

Abstract
Brain-derived neurotrophic factor (BDNF) promotes the biochemical and morphological differentiation of selective populations of neurons during development. In this study we examined the energy requirements associated with the effects of BDNF on neuronal differentiation. Because glucose is the preferred energy substrate in the brain, the effect of BDNF on glucose utilization was investigated in developing cortical neurons via biochemical and imaging studies. Results revealed that BDNF increases glucose utilization and the expression of the neuronal glucose transporter GLUT3. Stimulation of glucose utilization by BDNF was shown to result from the activation of Na+/K+-ATPase via an increase in Na+ influx that is mediated, at least in part, by the stimulation of Na+-dependent amino acid transport. The increased Na+-dependent amino acid uptake by BDNF is followed by an enhancement of overall protein synthesis associated with the differentiation of cortical neurons. Together, these data demonstrate the ability of BDNF to stimulate glucose utilization in response to an enhanced energy demand resulting from increases in amino acid uptake and protein synthesis associated with the promotion of neuronal differentiation by BDNF.
Keywords: BDNF, glucose utilization, 2-deoxyglucose, Na+influx, amino acid uptake, protein synthesis, GLUT3
Introduction
Brain-derived neurotrophic factor (BDNF) belongs to a family of closely related neurotrophic factors termed neurotrophins (Lewin and Barde, 1996). There is ample evidence that BDNF regulates the survival and differentiation of selective populations of neurons in the peripheral and central nervous systems (Davies, 1994; Jones et al., 1994; Lewin and Barde, 1996). Thus BDNF knock-out mice exhibit substantially reduced numbers of cranial and spinal sensory neurons as well as marked decreases in the expression of neuropeptide Y (NPY) and calcium-binding proteins in specific brain regions, including cerebral cortex and hippocampus (Jones et al., 1994). It is also well established that BDNF increases peptidergic differentiation of GABA-containing neurons as it stimulates the expression of specific neuropeptides such as somatostatin, substance P, NPY, and cholecystokinin both in vitro and in vivo (Nawa et al., 1993; Croll et al., 1994). In the CNS BDNF promotes structural changes in axonal and dendritic arborization (McAllister et al., 1999). Thus BDNF increases the length and complexity of dendrites of cortical pyramidal neurons (McAllister et al., 1995).
Besides these actions on neuronal survival and differentiation, BDNF also modulates both short-term and long-term synaptic transmission (Schuman, 1999). For instance, hippocampal long-term potentiation (LTP) is impaired markedly in BDNF knockout mice (Korte et al., 1995; Patterson et al., 1996), whereas reexpression of BDNF in the CA1 region (Korte et al., 1996) or treatment with recombinant BDNF restores LTP (Patterson et al., 1996). Recently, BDNF has been shown to evoke rapid neuronal depolarization by activating the tetrodotoxin-insensitive sodium channel Nav1.9 (Kafitz et al., 1999; Blum et al., 2002).
In the mammalian brain ∼50% of the total energy consumption is associated with neural signaling, including maintenance of resting potentials and neurotransmitter recycling (Attwell and Laughlin, 2001). Indeed, the majority of energy consumption is used to restore the ion gradients and resting membrane potentials by Na+/K+-ATPase, a plasma membrane enzyme that catalyzes the active transport of Na+ and K+ across the cell membrane (Astrup et al., 1981). In addition to the energy expenditure linked to neural signaling, a lower fraction of energy consumption is used to sustain basic cellular processes that are not coupled tightly to neural signaling, such as turnover of macromolecules (proteins, oligonucleotides, lipids), axoplasmic transport, and mitochondrial proton leak (Attwell and Laughlin, 2001). In the brain, glucose is the predominant substrate for energy metabolism (Sokoloff, 1960). Delivery of glucose from the blood to the brain requires its transport across the endothelial cells of the blood-brain barrier and the plasma membrane of neurons and glia. The entry of glucose into these cells is mediated by two facilitative glucose transporter (GLUT) isoforms i.e., GLUT1 and GLUT3. GLUT1 is the major glucose transporter in the blood-brain barrier, choroid plexus, ependyma, and glia, whereas GLUT3 is the neuronal glucose transporter (Maher et al., 1994; Vannucci et al., 1997). Cerebral glucose utilization increases during development of the human, mouse, and rat brain (Chugani and Phelps, 1986; Nehlig et al., 1988; Khan et al., 1999). Thus cerebral glucose utilization increases by 50-100% in most regions of the rat brain from postnatal day (P) 17 to P21 (Nehlig et al., 1988). Enhancement of glucose utilization during postnatal brain development relates to stimulation of neuronal differentiation and increases in neuronal activity (Nehlig et al., 1988; Vannucci et al., 1998). The interesting observation in the rat visual cortex revealing that the expression of BDNF is increased markedly during the same developmental period (Bozzi et al., 1995; Schoups et al., 1995; Tropea et al., 2001) led us to examine whether BDNF regulates glucose utilization in developing cortical neurons. In this study we show that BDNF increases glucose utilization and GLUT3 expression in cortical neurons. We also provide evidence that this effect results from the activation of Na+/K+-ATPase by a mechanism that involves the stimulation of Na+-dependent amino acid uptake and the increase in intracellular Na+ concentration.
Materials and Methods
Preparation of primary cultures of mouse cortical neurons. All experiments were performed in accordance with the European Communities Council Directive regarding the care and use of animals for experimental procedures.
Primary cultures of cerebral cortical neurons were prepared from 17-d-old Swiss mice embryos as previously described (Fiumelli et al., 1999) with minor modifications. Cells were plated at a density of 2 × 10⁵/cm2 on 60 × 15 mm (Northern blots) or on 35 × 10 mm (2-DG uptake, Western blots, protein synthesis, [Na+]i measurements and [14C]-AIB uptake) culture plates in Neurobasal medium supplemented with B27 (Invitrogen, Basel, Switzerland) and 500 μm glutamine. For immunocytochemical studies the cultures were plated at a density of 105/cm2 on glass coverslips in 24-well cell culture clusters in the above-mentioned medium. Cells were maintained at 37°C in a humidified atmosphere of 95% air/5% CO2 and were subjected to experiments after 6 d in vitro.
[3H]2-deoxyglucose uptake. [3H]2-deoxyglucose ([3H]2-DG) uptake was determined as previously described (Yu et al., 1993) with minor modifications. The culture medium was replaced by 2 ml of DMEM (5030, Sigma, Buchs, Switzerland) supplemented with (in mm) 5 glucose, 7.5 NaHCO3, 5 HEPES buffer, pH 7.0, and 0.045 phenol red (DMEM5). After 1 hr of stabilization at 37°C in a water-saturated atmosphere containing 5% CO2/95% air, cortical neurons were exposed to BDNF (Alomone Labs, Jerusalem, Israel) for 2 hr (except for time course analysis). When tested, 200 nm K252a (Biomol, Wangen, Switzerland), 50 μm PD98059 (Tocris, Wangen, Switzerland), 10 μm LY294002 (Calbiochem, Lucerne, Switzerland), 10 μm U73122 (Calbiochem), 10 μm U73343 (Sigma), 10 nm-1 μm ouabain (Sigma), 1 μm TTX (Latoxan, Lucerne, Switzerland), 1 μm MK-801 (Tocris), and 100 μm CNQX (Calbiochem) were added 20 min before BDNF. After replacement of the medium by 2 ml of DMEM5 containing [3H]2-DG (American Radiolabeled Chemicals, Wangen, Switzerland) at a tracer concentration of 1 μCi/ml (33 nm), cortical neurons were incubated for 20 min at 37°C. [3H]2-DG uptake was stopped by aspiration of the medium; the cells were rinsed three times with ice-cold PBS, pH 7.4, and 2 ml of 10 mm NaOH/0.1% Triton X-100 was added to lyse the cells. Aliquots of 500 μl were assayed for radioactivity by liquid scintillation counting, whereas 30 μl aliquots were used for measurement of protein content by a BCA protein assay kit (Pierce, Lausanne, Switzerland). Results, which represent glucose transporter-mediated uptake and subsequent phosphorylation by hexokinase, were calculated by subtracting from total counts the portion that was not inhibited by 50 μm of the glucose transporter inhibitor cytochalasin B (Sigma). The cytochalasin B-sensitive uptake accounted for ∼70% of total [3H]2-DG uptake. For Na+ replacement experiments an HEPES-buffered salt solution with the following composition (in mm) was used: 10 HEPES, pH 7.0, 7.5 NaHCO3, 2 KCl, 2 CaCl2, 3 MgSO4, 2 KH2PO4, 5 glucose, 0.045 phenol red, and 140 NaCl. For experiments performed in low extracellular Na+, the NaCl was replaced by an equimolar concentration of choline.
As to the kinetic analysis, [3H]2-DG uptake was determined in DMEM (5030, Sigma) supplemented with 7.5 mm NaHCO3, 5 mm HEPES buffer, pH 7.0, and 0.045 mm phenol red that contained the appropriate concentration of glucose. For each glucose concentration [3H]2-DG concentration was adjusted to maintain the 2-DG/glucose concentration ratio constant. Kinetic parameters of glucose transport were determined by a double-reciprocal plot of [3H]2-DG uptake rate versus extracellular glucose concentration. This Lineweaver-Burk plot yields a straight line with a slope of Km/Vmax, an x-intercept of -1/Km, and a y-intercept of 1/Vmax.
Northern blot analysis. Cortical neurons were exposed to BDNF for 2 hr except for the time course analysis in which time varied. At the end of the stimulation period the cells were washed twice with ice-cold PBS, and total RNA was extracted from cultured cortical neurons by using Trizol reagent according to the manufacturer's instructions (Invitrogen). Then 10 μg of total RNA was electrophoresed on a 1.2% agarose/2 m formaldehyde gel and transferred onto nylon membrane (NEN, Geneva, Switzerland) as previously described (Fiumelli et al., 1999). Hybridization was performed with a 32P-antisense GLUT3 riboprobe. Filters then were washed under high-stringency conditions (twice with 2× SSC/0.1% SDS at 65°C for 15 min and twice with 0.1× SSC/0.1% SDS at 65°C for 30 min) and apposed to autoradiography films at -70°C with an intensifying screen. Differences in RNA gel loading and blotting were assessed by rehybridizing the filters with a
32P-antisense glyceraldehyde-3-phosphate-dehydrogenase (GAPDH) riboprobe (Fiumelli et al., 1999). After autoradiography the films were scanned densitometrically, and the results were quantified by using the Macintosh-based NIH Image program, version 1.61. Densitometric values for GLUT3 mRNA were normalized to corresponding GAPDH mRNA values.
32P-antisense GLUT3 riboprobe was generated by using T7 RNA polymerase and 32P-α-UTP from a linearized pGEM-T vector containing an 802 bp GLUT3 cDNA fragment. GLUT3 cDNA fragment was obtained by reverse transcription and PCR amplification of total RNA from primary cultures of mouse cortical neurons with a set of oligonucleotide primers (5′-TTGGTTTGGACTTTATT-3′ and 5′-CATCTTCGCTGCCTTCCT-3′) located at 594-610 and 1378-1395 bp in the coding region of the mouse GLUT3 cDNA sequence (Nagamatsu et al., 1992). The identity of the amplified GLUT3 cDNA fragment was confirmed by DNA sequencing.
Western blot analysis. Mouse cortical neurons were exposed to 5 ng/ml BDNF for various periods of time. At the end of the incubation period the cells were washed twice with ice-cold PBS; lysed by adding 150 μl of 62.5 mm Tris-HCl, pH 6.8, 50 mm DTT, 0.3% SDS supplemented with a mixture of protease inhibitors (Sigma); heated for 5 min at 95°C; and sonicated to shear genomic DNA. The sample protein concentration was measured by the Bio-Rad (Glattbrugg, Switzerland) protein assay. Then 10 μg of each sample diluted in 62.5 mm Tris-HCl, pH 6.8, 50 mm DTT, 2% SDS, 10% glycerol, 0.1% bromophenol blue was electrophoresed through a 12% SDS-polyacrylamide minigel and blotted onto polyvinylidene difluoride membrane (NEN), using a semi-dry blotting system (Bio-Rad) as previously described (Cardinaux et al., 1997).
For immunodetection of GLUT3 the blots were blocked in 50 mm Tris-HCl, pH 7.5, 150 mm NaCl, 0.1% Tween-20 complemented with 5% skim milk, and 1% BSA for 1 hr at room temperature. The blots subsequently were incubated overnight at 4°Cin50mm Tris-HCl, pH 7.5, 150 mm NaCl, and 0.1% Tween-20 with 1% skim milk in the presence of a polyclonal rabbit anti-GLUT3 antibody (Chemicon, Lucerne, Switzerland) diluted at 1:5000. Immunolabeled GLUT3 was detected via the ECL detection system (Pharmacia, Dübendorf, Switzerland). Differences in protein gel loading and blotting were determined by reprobing the blots with a monoclonal mouse anti-β-tubulin antibody (Sigma) at a dilution of 1:100. Results were quantified by the Macintosh-based NIH Image program, version 1.61. Densitometric values for GLUT3 protein were normalized to corresponding β-tubulin values.
[Na+]imeasurements. Na+i imaging experiments were performed on the stage of an inverted epifluorescence microscope (Carl Zeiss, Jena, Germany) and observed through a 40 × 1.3 numerical aperture oil-immersion Neofluar objective lens (Carl Zeiss) as previously described (Chatton et al., 2000). Fluorescence excitation wavelengths were selected via a holographic monochromator (Polychrome II, Till Photonics, Planegg, Germany), and fluorescence was detected with a 12-bit cooled CCD camera (Micromax, Princeton Instruments, Trenton, NJ). Acquisition of images and time series were computer-controlled with the software Metafluor (Universal Imaging, West Chester, PA) running on a Pentium computer. The acquisition rate of ratio images was varied between 0.5 and 0.1 Hz.
[Na+]i was measured in single neurons after the cells were loaded with the Na+-sensitive fluorescent dye sodium-binding benzofuran isophta-late (SBFI-AM, Teflabs, Austin, TX). Cell loading was performed at 37°C, using 15 μm SBFI-AM in a HEPES-buffered balanced solution with the following composition (in mm): 135 NaCl, 5.4 KCl, 20 HEPES, 1.3 CaCl2, 0.8 MgSO4, 0.78 NaH2PO4, 20 glucose supplemented with 0.1% Pluronic F-127 (Molecular Probes, Eugene, OR). Once loaded with SBFI, the neurons were placed in a thermostated perfusion chamber (Harris et al., 1994) and superfused at 35°C in DMEM5 without phenol red. Fluorescence was excited sequentially at 340 and 380 nm and detected at 510 nm by using a bandpass filter (80 nm bandwidth). Fluorescence excitation ratios (F340nm/F380nm) were computed for each image pixel, and ratio images of cells proportional to [Na+]i were produced. In situ calibration was performed after each experiment as previously described (Chatton et al., 2000). Briefly, cells were permeabilized for monovalent cations with 6 μg/ml gramicidin (Sigma) and 10 μm monensin (Sigma) with simultaneous inhibition of the Na+/K+-ATPase by the use of 1 mm ouabain. Cells then were perfused sequentially with solutions buffered at pH 7.2 with 20 mm HEPES and containing 0, 5, 10, 20, and 50 mm Na+, respectively, plus 30 mm Cl- and 136 mm gluconate with a constant total concentration of Na+ and K+ of 165 mm. A five point calibration curve was computed for each selected cell in the field of view and used to convert fluorescence ratio values (F340nm/F380nm) into Na+ concentrations.
Experiments were repeated on four different coverslips from two independent cultures. Data are presented as changes in [Na+]i evoked by 10 ng/ml BDNF. At the end of each experiment the cortical neurons were exposed to 25 μm veratridine to elicit Na+ entry through voltage-gated Na+ channels, thereby enabling us to verify the responsiveness of the neurons. The few neurons that did not respond to veratridine were discarded from the analysis.
[14C]-aminoisobutyric acid uptake. [14C]-aminoisobutyric acid ([14C]-AIB) uptake was performed as follows. Cortical neurons were exposed to 5 ng/ml BDNF for various time periods in HEPES buffer containing 140 mm NaCl or choline, respectively. At the end of the stimulation period the neurons were incubated for 20 min at 37°C in the same buffer, but containing [14C]-AIB (specific activity, 51.5 mCi/mmol; NEN) at a concentration of 0.5 μCi/ml. [14C]-AIB uptake was stopped by aspirating the medium; the cells were rinsed three times with ice-cold PBS, pH 7.4, and 2 ml of 10 mm NaOH/0.1% Triton X-100 was added to lyse the cells. Aliquots of 500 μl were assayed for radioactivity by liquid scintillation counting, whereas 30 μl aliquots were used for measurement of protein content by a BCA protein assay kit (Pierce). For Na+ replacement experiments a HEPES-buffered salt solution with the following composition (in mm) was used: 10 HEPES, pH 7.0, 7.5 NaHCO3, 2 KCl, 2 CaCl2, 3 MgSO4, 2 KH2PO4, 5 glucose, and 140 NaCl. For experiments that were performed in low extracellular Na+, the NaCl was replaced by an equimolar concentration of choline.
Protein synthesis. Cortical neurons were washed once with DMEM lacking methionine and cysteine (Invitrogen) complemented with 5 mm HEPES, pH 7.0, and preincubated for 1 hr in 1 ml of the same medium at 37°C in a humidified atmosphere of 95% air/5% CO2. For 35S radioactive labeling studies the medium was replaced by 800 μl of a mixture consisting of 99% of the above-mentioned medium and 1% DMEM (5030, Sigma) containing 0.125 mCi/ml l-[35S]methionine and l-[35S]cysteine (met-labeling mix, Hartmann, Braunschweig, Germany; specific activity, 1000 Ci/mmol); BDNF was added immediately thereafter. After incubation with BDNF for various time periods the cells were washed twice with ice-cold PBS; lysed with 500 μl of 62.5 mm Tris, pH 6.8, 50 mm DTT, and 0.3% SDS; heated for 5 min at 95°C; and sonicated.
Cell suspension (50 μl) was added to 500 μl of 0.1 mg/ml BSA containing 0.02% NaN3 and placed on ice. To precipitate labeled proteins, we added 500 μl of ice-cold 20% TCA to the samples, vortex-mixed them vigorously, and incubated them for 30 min on ice. Suspensions then were filtered onto glass microfiber disks; the disks were washed twice with ice-cold 10% TCA and 100% EtOH. Air-dried filters were assayed for radioactivity by liquid scintillation counting.
Immunocytochemistry. Cortical neurons cultured on glass coverslips were exposed to 5 ng/ml BDNF for various time periods without changing the medium. Cells then were fixed in 4% paraformaldehyde for 20 min, washed twice in PBS, and preincubated in PBS containing 0.2% Triton X-100 (PBS-TX) and 4% normal donkey serum (Milan Analytica, La Roche, Switzerland) for 1 hr. Immunodetection of NPY was performed as follows: a polyclonal rabbit anti-NPY antibody (Sigma) diluted in PBS-TX at 1:5000 was applied overnight. The next day the cultures were rinsed twice with PBS-TX and once with PBS and then treated with Cy3-conjugated donkey anti-rabbit IgG (Milan Analytica) at a dilution of 1:1000 (PBS) for 30 min. All incubations and rinses were performed at room temperature. The coverslips were mounted on slides in Vectashield (Vector Laboratories, Servion, Switzerland). Cultures were observed with an Axioplan 2 microscope (Carl Zeiss) equipped with epifluorescence and appropriate filters.
The percentage of NPY-immunoreactive neurons was determined by counting the number of labeled cells in a surface identical for control and treated cultures and corresponding to ∼30% of the total surface of the coverslip. The number of cells counted in BDNF-treated cultures was expressed as a percentage of control cultures. Three coverslips were quantified at each time period in two independent experiments.
Results
BDNF increases 2-DG uptake in cortical neurons
Regulation of glucose utilization by BDNF was examined in primary cultures of cortical neurons by using the 2-DG method (Sokoloff et al., 1977). 2-DG is a glucose analog that has been shown to be transported specifically by facilitative glucose transporters of the GLUT family, but not by Na+-dependent glucose transporters (Kimmich and Randles, 1976; Hediger and Rhoads, 1994). Treatment of cortical neurons with BDNF resulted in a marked increase in 2-DG uptake (Fig. 1). Time course analysis revealed that 2-DG uptake increased significantly 20 min after exposure to BDNF (122.2 ± 3.9% of control), reached maximal levels after 2 hr (182.1 ± 19.1% of control), and remained elevated up to at least 7 hr of treatment with BDNF (152.1 ± 6.1% of control; Fig. 1A). As shown in Figure 1B, BDNF causes a statistically significant increase in 2-DG uptake at 0.1 ng/ml and elicits a maximal uptake at 1 ng/ml BDNF. Because cultures of neurons also contain a few percentages of astrocytes, a glial cell type involved in cerebral glucose metabolism, we investigated the effect of BDNF on glucose utilization in primary cultures of mouse cortical astrocytes. In marked contrast to its effect in cortical neurons, BDNF did not affect glucose utilization in cultured cortical astrocytes (data not shown). BDNF promotes neuronal survival and differentiation by binding and activating the receptor tyrosine kinase TrkB (Barbacid, 1994; Bothwell, 1995). To examine whether stimulation of 2-DG uptake by BDNF resulted from the activation of the tyrosine kinase TrkB receptor, we tested the effect of the tyrosine kinase inhibitor K252a. Data presented in Figure 2A show that BDNF-induced 2-DG uptake is abolished completely by K252a, consistent with a requirement for TrkB receptor activation. Binding of BDNF to TrkB produces biological responses via activation of three well described intracellular signaling pathways, including Ras/mitogen-activated protein kinase (MAPK), phospholipase C-γ (PLC-γ), and phosphatidylinositol 3-kinase (PI3K) (Segal and Greenberg, 1996). To determine the signaling pathway by which BDNF stimulates 2-DG uptake, we treated cortical neurons with BDNF in the presence of inhibitors of the Ras/MAPK, PLC-γ, or PI3K pathways. Results revealed that the PLC inhibitor U73122 completely suppressed the effect of BDNF on 2-DG uptake, whereas the inactive analog U73343 was ineffective (Fig. 2C). In contrast to U73122, the MAPK kinase inhibitor PD98059 and the PI3K inhibitor LY294002 did not prevent the BDNF-induced 2-DG uptake (Fig. 2B). Together, these data indicate that stimulation of glucose utilization by BDNF requires the activation of PLC-γ.
Figure 1.

BDNF increases [3H]2-DG uptake in cortical neurons. A, Time course analysis. Cultures of cortical neurons were stimulated by 5 ng/ml BDNF for various periods of time. [3H]2-DG uptake was measured as described in Materials and Methods. Data are the mean ± SEM percentages of control (Ctrl) values of triplicate determinations from three independent experiments. *p < 0.05, **p < 0.01 by unpaired Student's t test between Ctrl and BDNF-treated cultures. B, Concentration dependency. Cultures of cortical neurons were treated for 2 hr with increasing concentrations of BDNF. [3H]2-DG uptake was measured as described in Materials and Methods. Data are the mean ± SEM percentages of Ctrl values of triplicate determinations from three independent experiments. **p < 0.01, ***p < 0.001 by unpaired Student's t test between Ctrl and BDNF-treated cultures.
Figure 2.

Effects of inhibitors of TrkB-mediated signaling pathways on BDNF-induced [3H]2-DG uptake. Cultures of cortical neurons were exposed to 5 ng/ml BDNF for 2 hr in the presence of different inhibitors. Inhibitors also were tested on basal [3H]2-DG uptake. A, Effect of the tyrosine kinase inhibitor K252a (200 nm) on BDNF-induced [3H]2-DG uptake. Data are the mean ± SEM percentages of Ctrl values of triplicate determinations from three independent experiments. ***p < 0.001 by unpaired Student's t test between BDNF- and BDNF + K252a-treated cultures. B, Effects of the MAPK kinase inhibitor PD98059 (50 μm) and the PI3K inhibitor LY294002 (10 μm) on BDNF-induced [3H]2-DG uptake. Data are the mean ± SEM percentages of Ctrl values of triplicate determinations from at least three independent experiments. C, Effects of the PLC inhibitor U73122 (10 μm) and of its inactive analog U73343 (10 μm) on BDNF-stimulated [3H]2-DG uptake. Data represent the mean ± SEM percentages of Ctrl values of triplicate determinations from at least three independent experiments. ***p < 0.001 by unpaired Student's t test between BDNF- and BDNF + U73122-treated cultures.
BDNF stimulates GLUT3 expression
To characterize further the increased glucose utilization by BDNF, we determined the rate of 2-DG uptake as a function of increasing concentrations of extracellular glucose in control and BDNF-treated cortical neurons. As shown in Figure 3A, the rates of 2-DG uptake in control and BDNF-treated cultures exhibit typical Michaelis-Menten kinetics. Double-reciprocal plots of 2-DG uptake rate versus extracellular glucose concentration (Lineweaver-Burk plots) were used to determine kinetic parameters of 2-DG uptake in control and BDNF-treated cultures. The maximal velocity (Vmax) of 2-DG uptake increased significantly from 37.7 ± 4.3 fmol/mg of protein/min to 55.3 ± 3.9 fmol/mg of protein/min (p < 0.05, unpaired Student's t test) when cortical neurons were exposed to BDNF (Fig. 3B). In contrast, the Michaelis-Menten constant (Km) did not change significantly after treatment with BDNF because Km was 0.36 ± 0.1 mm in control neurons and 0.39 ± 0.16 mm in BDNF-treated neurons (Fig. 3B). The increased Vmax value of 2-DG uptake in response to BDNF suggests that BDNF enhances the number of functional glucose transporters in the plasma membrane of cortical neurons. Because GLUT3 is the predominant glucose transporter expressed in neurons (Maher et al., 1991; Nagamatsu et al., 1992), we examined the regulation of its expression by BDNF. Treatment of cultured cortical neurons with BDNF caused an upregulation of GLUT3 mRNA expression in a time- and concentration-dependent manner (Fig. 4A-D). Thus GLUT3 mRNA levels transiently increased, reaching maximal levels after 2 hr and returning to control values 7 hr after stimulation by BDNF (Fig. 4A,C). Induction of GLUT3 mRNA expression was dependent on the concentration of BDNF, with a maximal rise achieved at a concentration of 3 ng/ml (Fig. 4B,D). The transient increase in GLUT3 mRNA level by BDNF was accompanied by a sustained elevation of GLUT3 protein expression, as revealed by Western blot analysis (Fig. 4E,F). Subcellular fractionation of cortical neurons followed by Western blot analysis showed that the large majority (>95%) of GLUT3 protein was associated with plasma membranes and did not reveal a translocation of GLUT3 from intracellular stores to the plasma membrane of cortical neurons in response to BDNF (data not shown). Because there are several lines of evidence that GLUT1 and GLUT8 may be expressed in neurons (Maher and Simpson, 1994; Ibberson et al., 2002), we examined the regulation of GLUT1 and GLUT8 expression by BDNF. Western blot analysis revealed that in cultured cortical neurons GLUT1 was barely detectable and GLUT8 was not detected and that the expression of these two facilitative glucose transporters was not affected by BDNF (data not shown).
Figure 3.

Kinetic analysis of the increase in [3H]2-DG uptake by BDNF. Cultures of cortical neurons were treated for 2 hr with 5 ng/ml BDNF in DMEM containing increasing concentrations of glucose. A, Rate of [3H]2-DG uptake as a function of increasing concentrations of glucose in control (○) or BDNF-treated (•) neurons. Data are the mean ± SEM values of triplicate determinations from three independent experiments. B, Double-reciprocal plots of the results presented in A. Lineweaver-Burk plots yield straight lines, where x- and y-intercepts are -1/Km and 1/Vmax, respectively.
Figure 4.

BDNF stimulates GLUT3 mRNA and protein expression in cortical neurons. A, Time course analysis of GLUT3 mRNA changes induced by BDNF. Cultures of cortical neurons were exposed for various periods of time to 5 ng/ml BDNF. Extractions of total RNA and Northern blot analysis were performed as described in Materials and Methods. B, Concentration dependency of GLUT3 mRNA changes in response to BDNF. Cultures of cortical neurons were treated for 2 hr with increasing concentrations of BDNF. C, D, Quantitative analysis of the results presented in A and B. Data are the mean ± SEM percentages of Ctrl values from three independent experiments. E, Time course analysis of GLUT3 protein changes in response to BDNF. Cultures of cortical neurons were exposed for various periods of time to 5 ng/ml BDNF. Western blot analysis was performed as described in Materials and Methods. F, Quantitative analysis of the results presented in E.
Role of Na+/K+-ATPase in the stimulation of glucose utilization by BDNF
Because glucose uptake and phosphorylation are linked directly to glucose consumption, it was of interest to determine the origin of the energy-consuming processes activated by BDNF. The cost-liest energy-consuming process of the brain, which represents ∼50% of the total cerebral energy consumption, is linked to the active transport of Na+ and K+ through Na+/K+-ATPase, a pump that maintains the intracellular concentrations of Na+ and K+ ions in animal cells (Ames, 2000). To study the involvement of Na+/K+-ATPase in the stimulation of glucose utilization by BDNF, we pretreated cortical neurons for 20 min with increasing concentrations of ouabain, a specific inhibitor of Na+/K+-ATPase. As shown in Figure 5A, the BDNF-induced 2-DG uptake was blocked almost completely by 1 μm ouabain (75% inhibition), indicating that activation of the Na+/K+-ATPase accounts for this large increase in glucose utilization. In addition, partial replacement of extracellular Na+ with the impermeant cation choline completely abolished the stimulation of 2-DG uptake by BDNF, indicating that this effect is dependent on extracellular Na+ (Fig. 5B).
Figure 5.

Stimulation of [3H]2-DG uptake by BDNF is inhibited by applying ouabain and by lowering the extracellular Na+ concentration. A, Cultures of cortical neurons were stimulated for 2 hr by 5 ng/ml BDNF in the presence of increasing concentrations of the Na+/K+-ATPase inhibitor ouabain. Ouabain also was tested on basal [3H]2-DG uptake. Data represent the mean ± SEM percentages of Ctrl values of triplicate determinations from two independent experiments. ***p < 0.001 by unpaired Student's t test between cultures treated with BDNF and BDNF + 1 μm ouabain. B, Cultures of cortical neurons were exposed for 2 hr to 5 ng/ml BDNF in a medium containing 140 mm NaCl or 140 mm choline, respectively. Data represent the mean ± SEM percentages of Ctrl values of triplicate determinations from two independent experiments. ***p < 0.001 by unpaired Student's t test between Ctrl and BDNF-treated cultures.
BDNF increases Na+ influx in cortical neurons
On the basis of these data, we addressed the question of whether BDNF enhanced Na+ influx in cortical neurons. Studies that used fluorescence Na+ imaging revealed that treatment of cortical neurons with BDNF caused a rise in intracellular Na+ concentration ([Na+]i) with a latency of 13.4 ± 1.2 min (n = 22) in 60% of the neurons that were studied (Fig. 6). Na+ enters cells by many routes, including voltage-dependent Na+ channels [e.g., tetrodotoxin (TTX)-sensitive Na+ channels], ligand-gated Na+ channels (e.g., glutamate-gated ionotropic channels), and different Na+-dependent transporters (e.g., Na+-dependent amino acid transporters). To investigate the route through which BDNF stimulates Na+ influx and thereby increases glucose utilization, we pretreated cortical neurons with the Na+ channel blocker TTX, the NMDA receptor antagonist MK-801, or the AMPA/kainate receptor antagonist CNQX; glucose utilization was determined by the 2-DG method. Data showed that application of TTX, MK-801, and CNQX did not reduce 2-DG uptake stimulated by 5 ng/ml BDNF (Ctrl = 100 ± 1.67%, BDNF = 137.44 ± 3.41%, BDNF+TTX = 131.98 ± 5.53%, BDNF+MK-801 = 131.99 ± 5.61%, BDNF+CNQX = 128.96 ± 6.06%; n = 6). These results rule out the involvement of TTX-sensitive Na+ channels and ionotropic glutamate receptors in the stimulation of glucose utilization by BDNF.
Figure 6.
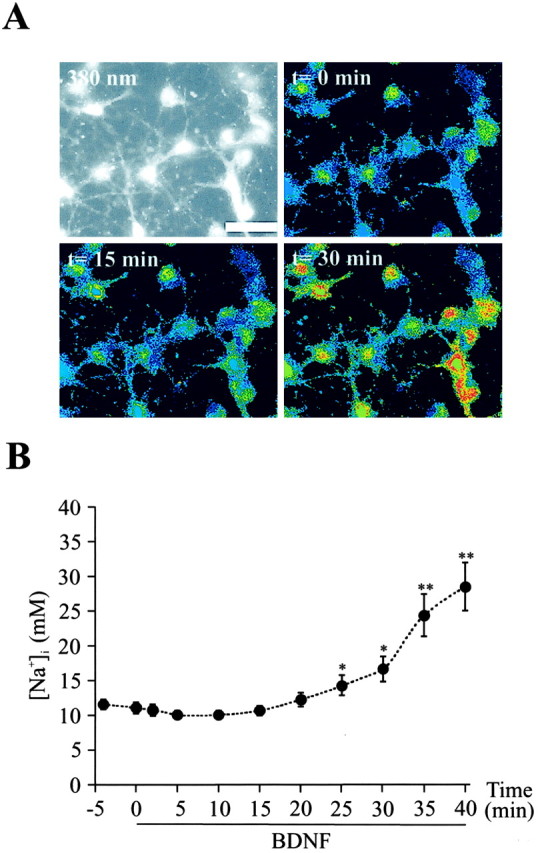
BDNF increases the intracellular Na+ concentration ([Na+]i) in cortical neurons. A, Images of SBFI-loaded neurons showing a raw fluorescence image excited at 380 nm (top left) and false color excitation ratio images (340/380 nm) recorded under control conditions (top right) after 15 min (bottom left) and 30 min (bottom right), respectively, of treatment with 10 ng/ml BDNF. Scale bar, 20 μm. B, Changes in [Na+]i were measured in SBFI-AM-loaded neurons stimulated by 10 ng/ml BDNF. At the indicated time points [Na+]i values of 13-22 neurons from four independent experiments were averaged and presented as the mean ± SEM values. *p < 0.05, **p < 0.001 by paired Student's t test between t = 0 min and t = 2-40 min after treatment with BDNF.
BDNF increases Na+-dependent amino acid transport
To investigate further the route of entry of Na+ ions, we examined whether BDNF stimulated amino acid transport in cortical neurons. Amino acid transport across plasma membranes is mediated via Na+-dependent and Na+-independent transporters (Bode, 2001). Na+-dependent transporters use the transmembrane Na+ electrochemical gradient, maintained mainly by Na+/K+-ATPase, to drive the uptake of amino acids against their concentration gradient (Bode, 2001). On the basis of these observations, we hypothesized that stimulation of Na+-dependent amino acid uptake by BDNF could contribute to the increased [Na+]i and thereby to the stimulation of Na+/K+-ATPase and glucose utilization observed in this study. To address this issue, we examined whether BDNF enhanced the uptake of [14C]-AIB, a non-metabolizable amino acid analog, which has affinity for both Na+-dependent and Na+-independent amino acid transporters (Brookes, 1988). Data showed that BDNF increased [14C]-AIB uptake in cortical neurons (Fig. 7). Time course analysis revealed that [14C]-AIB uptake was increased significantly after 20 min and reached maximal levels (175 ± 5.3% of control) after 5 hr of exposure to BDNF (Fig. 7). Partial substitution of extracellular Na+ with choline almost completely inhibited basal [14C]-AIB uptake (>90% inhibition) and abolished the increased [14C]-AIB uptake in response to BDNF (Fig. 7). The time course of [14C]-AIB uptake by BDNF indicates that stimulation of Na+-dependent amino acid uptake contributes to the increased [Na+]i (Figs. 6, 7).
Figure 7.

BDNF increases Na+-dependent [14C]-AIB uptake in cortical neurons. Cultures of cortical neurons were exposed for different time periods to 5 ng/ml BDNF in a medium containing either 140 mm NaCl to determine total [14C]-AIB uptake or 140 mm choline to determine Na+-independent [14C]-AIB uptake. [14C]-AIB uptake was determined as described in Materials and Methods. Data are the mean ± SEM values of six determinations from two independent experiments. *p < 0.05, ***p < 0.001 by unpaired Student's t test between Ctrl and BDNF-treated cultures.
BDNF increases overall protein synthesis
Because stimulation of amino acid transport is required for increased protein synthesis, it was important to examine the effect of BDNF on overall protein synthesis. Results showed that BDNF caused a time-dependent rise in the incorporation of [35S]methionine and [35S]cysteine into newly synthesized proteins (Fig. 8A). A significant increase in [35S]methionine and [35S]cysteine incorporation was measured 5 hr after stimulation by BDNF (124.1 ± 4.3% of control), and maximal incorporation was observed after 7 hr (132.7 ± 6.1% of control; Fig. 8A). Because cortical neurons used throughout this study are postmitotic, the enhanced overall protein synthesis by BDNF must reflect the activation of mechanisms associated with neuronal differentiation. In agreement with this, BDNF was shown to promote differentiation of cortical neurons (Nawa et al., 1993; Takei et al., 1997; Fiumelli et al., 2000). These effects were accompanied by the increased synthesis of certain proteins such as calcium-binding proteins (Fiumelli et al., 2000), synaptic vesicle proteins (Takei et al., 1997), and neuropeptides (Nawa et al., 1993). Among the neuropeptides NPY was reported to be induced after several days of treatment with BDNF (Nawa et al., 1993). This led us to examine the expression of NPY after acute treatment with BDNF. Immunocytochemical analysis revealed an early increase in the number of NPY-positive neurons resulting in a fivefold elevation of the number of NPYergic neurons after 7 hr of stimulation by BDNF (Fig. 8B).
Figure 8.

BDNF increases overall protein synthesis and the number of NPY-positive neurons. A, Cultures of cortical neurons were stimulated for different time periods by 5 ng/ml BDNF. Overall protein synthesis was determined by measuring the incorporation of [35S]methionine and [35S]cysteine into newly synthesized proteins in Ctrl (○) or BDNF-treated (•) neurons. Data represent the mean ± SEM values of six determinations from two independent experiments. *p < 0.05, ***p< 0.001 by unpaired Student's t test between Ctrl and BDNF-treated cultures. B, Cultures of cortical neurons were exposed to 5 ng/ml BDNF for different time periods, and the detection of NPY-positive neurons was performed by immunocytochemistry. Data are the mean ± SEM percentages of Ctrl values of six determinations from two independent experiments. **p < 0.01, ***p < 0.001 by unpaired Student's t test between Ctrl and BDNF-treated cultures.
Discussion
The present study provides evidence that BDNF increases Na+-dependent amino acid transport, causing a rise in [Na+]i that in turn leads to the activation of Na+/K+-ATPase, energy consumption, and the stimulation of glucose uptake and GLUT3 expression. The increased Na+-dependent amino acid transport ensures an adequate substrate supply for the enhanced protein synthesis induced by BDNF.
These data demonstrate for the first time that BDNF increases energy metabolism in developing CNS neurons. NGF, another member of the neurotrophin family, was shown previously to increase glucose utilization in PC12 cells (Morelli et al., 1986). However, the effect of NGF on glucose utilization was observed >2 d after chronic exposure to this neurotrophin, contrasting significantly with the time course of the BDNF effect reported in this study, in which a significant stimulation of glucose utilization was detected 20 min after exposure to BDNF (Fig. 1A).
Northern and Western blot analyses showed that stimulation of glucose utilization by BDNF was accompanied by an increase in GLUT3 mRNA and protein levels (Fig. 4). However, time course analysis of GLUT3 induction by BDNF (Fig. 4E,F) suggests that the upregulation of GLUT3 protein expression does not contribute to the stimulation of glucose utilization during the first hour of treatment with BDNF. It also is interesting to note that, although GLUT3 expression markedly increases after 2 hr of stimulation by BDNF (Fig. 4), glucose utilization remains relatively constant (Fig. 1A). A possible explanation for this observation is that 2-DG uptake is determined by the rates of both glucose transport and glucose phosphorylation (Whitesell et al., 1995). In addition, glucose phosphorylation has been shown to be the rate-limiting step for glucose utilization in the brain (Whitesell et al., 1995), suggesting that stimulation of GLUT3 expression by BDNF may not be coupled to a proportional increase in glucose phosphorylation.
In the brain ∼50% of the total energy consumption is used to restore ion gradients and resting membrane potentials by Na+/K+-ATPase (Ames, 2000). Our findings of an almost complete inhibition of BDNF-induced 2-DG uptake by ouabain are supportive of the view that the increased glucose demand is linked directly to the activation of Na+/K+-ATPase.
Our data also show that activation of Na+/K+-ATPase by BDNF results from an increase in [Na+]i (Fig. 6). The similar onsets of increases in Na+ influx (Fig. 6) and [14C]-AIB uptake (Fig. 7) strongly support the involvement of Na+-dependent amino acid transport in the elevation of [Na+]i. The relative contribution of this mechanism to the total increase in [Na+]i could not be determined because no high-affinity inhibitor for Na+-dependent amino acid transporters is presently available (Palacin et al., 1998). Therefore, the implication of other Na+-dependent transport systems in the increased glucose utilization by BDNF cannot be ruled out. Because glucose also might be transported by Na+-dependent glucose transporters such as SGLT1 (Poppe et al., 1997), we examined the regulation of Na+-dependent glucose transport activity by BDNF. However, our results ruled out the implication of this Na+-dependent transport system in the increased [Na+]i and glucose utilization in response to BDNF (data not shown). Together, these results reveal a novel mechanism by which BDNF stimulates Na+ influx in CNS neurons. The latency (13.4 ± 1.2 min; n = 22) of the increase in [Na+]i in response to BDNF contrasts with the recently described Na+ current activated by BDNF within milliseconds (Kafitz et al., 1999). The latency observed in this study might be explained by the translocation of amino acid transporters to the plasma membrane of cortical neurons. In support of this hypothesis is the recent observation that insulin, a hormone that also activates receptor tyrosine kinase, promotes the recruitment of SAT2, a Na+-dependent amino acid transporter, from an endosomal compartment to the plasma membrane of skeletal muscle cells (Hyde et al., 2002) with a latency consistent with the enhanced [Na+]i observed in our study.
The increase in Na+-dependent amino acid uptake by BDNF reported in this study precedes the enhancement of protein synthesis (Figs. 7, 8A). Thus a significant increase in [14C]-AIB uptake is observed after 20 min of exposure to BDNF, whereas a significant enhancement of [35S]methionine and [35S]cysteine incorporation into newly synthesized proteins requires 5 hr of stimulation by BDNF (Figs. 7, 8A). Our data suggest that BDNF acts by a concerted mechanism to induce an early entry of amino acids and a delayed enhancement of protein synthesis. The early entry of amino acids in response to BDNF ensures an adequate substrate supply for the increased protein synthesis, as previously shown for insulin (DeFronzo and Ferrannini, 1992). Among the proteins induced by BDNF with a time course similar to the stimulation of overall protein synthesis, we found an early increase in NPY expression (Fig. 8B). These data contrast with previous studies reporting an increased NPY expression in cultured cortical neurons after several days of treatment with BDNF (Nawa et al., 1993; Barnea et al., 1995; Takei et al., 1996). The increased number of NPYergic neurons by BDNF observed in our study (Fig. 8B) results from the enhancement of NPY mRNA levels maintained for at least 2 d (data not shown), indicating that BDNF stimulates the phenotypic differentiation of NPYergic neurons. With regard to the induction by BDNF of proteins associated with neuronal differentiation, we have reported previously that, on acute treatment of cortical neurons, BDNF stimulates the expression and the release of tissue-type plasminogen activator (tPA) (Fiumelli et al., 1999) with a time course similar to that of the enhancement of overall protein synthesis found in the present study. The fact that tPA is a serine protease capable of facilitating neurite outgrowth and neuronal migration during nervous system development (Seeds et al., 1997) suggests that activation of tPA by BDNF may contribute to structural changes associated with neuronal development (Fiumelli et al., 1999).
Stimulation of glucose utilization and GLUT3 expression by BDNF, as observed in this study, may be relevant to brain development. Indeed, a series of functional and structural modifications that affects the energetic demands of the brain and therefore the rate of glucose utilization occurs during brain development (Chugani and Phelps, 1986; Nehlig et al., 1988; Khan et al., 1999). Thus glucose utilization in the rat brain is low at birth and increases during postnatal maturation (Vannucci et al., 1994). In particular, glucose utilization sharply enhances between P14 and P21, a developmental stage that coincides with synaptogenesis and neuronal maturation (Vannucci et al., 1994). Interestingly, this developmental increase in cerebral glucose utilization is paralleled by a similar increase in the expression of GLUT3 in the rat brain (Vannucci, 1994; Vannucci et al., 1994). These results indicate that cerebral glucose utilization and GLUT3 expression increase in concert with synaptogenesis and neuronal maturation. Moreover, developmental studies have demonstrated that in the rat visual cortex the expression of BDNF increases sharply during the second and third postnatal week (Bozzi et al., 1995; Schoups et al., 1995; Rossi et al., 1999). Together, these data reported by different studies reveal a temporal link between the appearance of BDNF and the increase in glucose utilization and GLUT3 expression in the cerebral cortex in vivo. Our in vitro observations provide evidence that BDNF plays a determinant role as a stimulator of glucose utilization and GLUT3 expression in response to the increased energy demand resulting from the enhanced amino acid uptake and protein synthesis associated with the promotion of neuronal development by this neurotrophic factor.
Footnotes
This work was supported by Swiss National Science Foundation Grant 3200-061364.00 (to J.-L.M.). We thank Dr. M. Kiraly for stimulating discussions, Professor B. Thorens for the generous gift of the anti-GLUT8 antibody, and Dr. D. Jabaudon for preliminary experiments.
Correspondence should be addressed to Jean-Luc Martin, Institute of Physiology, Faculty of Medicine, University of Lausanne, 7 Rue du Bugnon, CH-1005 Lausanne, Switzerland. E-mail: Jean-Luc.Martin@iphysiol.unil.ch.
H. Fiumelli's present address: Department of Molecular and Cell Biology, University of California at Berkeley, Berkeley, CA 94720.
Copyright © 2003 Society for Neuroscience 0270-6474/03/238212-09$15.00/0
References
- Ames 3rd A ( 2000) CNS energy metabolism as related to function. Brain Res Brain Res Rev 34 : 42-68. [DOI] [PubMed] [Google Scholar]
- Astrup J, Sorensen PM, Sorensen HR ( 1981) Oxygen and glucose consumption related to Na+/K+ transport in canine brain. Stroke 12 : 726-730. [DOI] [PubMed] [Google Scholar]
- Attwell D, Laughlin SB ( 2001) An energy budget for signaling in the grey matter of the brain. J Cereb Blood Flow Metab 21 : 1133-1145. [DOI] [PubMed] [Google Scholar]
- Barbacid M ( 1994) The Trk family of neurotrophin receptors. J Neurobiol 25 : 1386-1403. [DOI] [PubMed] [Google Scholar]
- Barnea A, Cho G, Lu G, Mathis M ( 1995) Brain-derived neurotrophic factor induces functional expression and phenotypic differentiation of cultured fetal neuropeptide Y-producing neurons. J Neurosci Res 42 : 638-647. [DOI] [PubMed] [Google Scholar]
- Blum R, Kafitz KW, Konnerth A ( 2002) Neurotrophin-evoked depolarization requires the sodium channel NaV1.9. Nature 419 : 687-693. [DOI] [PubMed] [Google Scholar]
- Bode BP ( 2001) Recent molecular advances in mammalian glutamine transport. J Nutr 131 : 2475S-2485S. [DOI] [PubMed] [Google Scholar]
- Bothwell M ( 1995) Functional interactions of neurotrophins and neurotrophin receptors. Annu Rev Neurosci 18 : 223-253. [DOI] [PubMed] [Google Scholar]
- Bozzi Y, Pizzorusso T, Cremisi F, Rossi FM, Barsacchi G, Maffei L ( 1995) Monocular deprivation decreases the expression of messenger RNA for brain-derived neurotrophic factor in the rat visual cortex. Neuroscience 69 : 1133-1144. [DOI] [PubMed] [Google Scholar]
- Brookes N ( 1988) Neutral amino acid transport in astrocytes: characteriza tion of Na+-dependent and Na+-independent components of α-aminoisobutyric acid uptake. J Neurochem 51 : 1913-1918. [DOI] [PubMed] [Google Scholar]
- Cardinaux JR, Magistretti PJ, Martin JL ( 1997) Brain-derived neurotrophic factor stimulates phosphorylation of stathmin in cortical neurons. Brain Res Mol Brain Res 51 : 220-228. [DOI] [PubMed] [Google Scholar]
- Chatton JY, Marquet P, Magistretti PJ ( 2000) A quantitative analysis of l-glutamate-regulated Na+ dynamics in mouse cortical astrocytes: implications for cellular bioenergetics. Eur J Neurosci 12 : 3843-3853. [DOI] [PubMed] [Google Scholar]
- Chugani HT, Phelps ME ( 1986) Maturational changes in cerebral function in infants determined by 18FDG positron emission tomography. Science 231 : 840-843. [DOI] [PubMed] [Google Scholar]
- Croll SD, Wiegand SJ, Anderson KD, Lindsay RM, Nawa H ( 1994) Regulation of neuropeptides in adult rat forebrain by the neurotrophins BDNF and NGF. Eur J Neurosci 6 : 1343-1353. [DOI] [PubMed] [Google Scholar]
- Davies AM ( 1994) The role of neurotrophins in the developing nervous system. J Neurobiol 25 : 1334-1348. [DOI] [PubMed] [Google Scholar]
- DeFronzo RA, Ferrannini E ( 1992) Insulin actions in vivo: protein metabolism. In: International textbook of diabetes mellitus (Alberti KGMM, DeFronzo RA, Keen H, Zimmet P, eds), pp 467-511. Chichester, UK: Wiley.
- Fiumelli H, Jabaudon D, Magistretti PJ, Martin JL ( 1999) BDNF stimulates expression, activity and release of tissue-type plasminogen activator in mouse cortical neurons. Eur J Neurosci 11 : 1639-1646. [DOI] [PubMed] [Google Scholar]
- Fiumelli H, Kiraly M, Ambrus A, Magistretti PJ, Martin JL ( 2000) Opposite regulation of calbindin and calretinin expression by brain-derived neurotrophic factor in cortical neurons. J Neurochem 74 : 1870-1877. [DOI] [PubMed] [Google Scholar]
- Harris PJ, Chatton JY, Tran PH, Bungay PM, Spring KR ( 1994) pH, morphology, and diffusion in lateral intercellular spaces of epithelial cell monolayers. Am J Physiol 266 : C73-C80. [DOI] [PubMed] [Google Scholar]
- Hediger MA, Rhoads DB ( 1994) Molecular physiology of sodium-glucose cotransporters. Physiol Rev 74 : 993-1026. [DOI] [PubMed] [Google Scholar]
- Hyde R, Peyrollier K, Hundal HS ( 2002) Insulin promotes the cell surface recruitment of the SAT2/ATA2 system A amino acid transporter from an endosomal compartment in skeletal muscle cells. J Biol Chem 277 : 13628-13634. [DOI] [PubMed] [Google Scholar]
- Ibberson M, Riederer BM, Uldry M, Guhl B, Roth J, Thorens B ( 2002) Immunolocalization of GLUTX1 in the testis and to specific brain areas and vasopressin-containing neurons. Endocrinology 143 : 276-284. [DOI] [PubMed] [Google Scholar]
- Jones KR, Farinas I, Backus C, Reichardt LF ( 1994) Targeted disruption of the BDNF gene perturbs brain and sensory neuron development but not motor neuron development. Cell 76 : 989-999. [DOI] [PMC free article] [PubMed] [Google Scholar]
- Kafitz KW, Rose CR, Thoenen H, Konnerth A ( 1999) Neurotrophin-evoked rapid excitation through TrkB receptors. Nature 401 : 918-921. [DOI] [PubMed] [Google Scholar]
- Khan JY, Rajakumar RA, McKnight RA, Devaskar UP, Devaskar SU ( 1999) Developmental regulation of genes mediating murine brain glucose uptake. Am J Physiol 276 : R892-R900. [DOI] [PubMed] [Google Scholar]
- Kimmich GA, Randles J ( 1976) 2-Deoxyglucose transport by intestinal epithelial cells isolated from the chick. J Membr Biol 27 : 363-379. [DOI] [PubMed] [Google Scholar]
- Korte M, Carroll P, Wolf E, Brem G, Thoenen H, Bonhoeffer T ( 1995) Hippocampal long-term potentiation is impaired in mice lacking brain-derived neurotrophic factor. Proc Natl Acad Sci USA 92 : 8856-8860. [DOI] [PMC free article] [PubMed] [Google Scholar]
- Korte M, Griesbeck O, Gravel C, Carroll P, Staiger V, Thoenen H, Bonhoeffer T ( 1996) Virus-mediated gene transfer into hippocampal CA1 region restores long-term potentiation in brain-derived neurotrophic factor mutant mice. Proc Natl Acad Sci USA 93 : 12547-12552. [DOI] [PMC free article] [PubMed] [Google Scholar]
- Lewin GR, Barde YA ( 1996) Physiology of the neurotrophins. Annu Rev Neurosci 19 : 289-317. [DOI] [PubMed] [Google Scholar]
- Maher F, Simpson IA ( 1994) The GLUT3 glucose transporter is the predominant isoform in primary cultured neurons: assessment by biosynthetic and photoaffinity labeling. Biochem J 301 [Pt 2]: 379-384. [DOI] [PMC free article] [PubMed] [Google Scholar]
- Maher F, Davies-Hill TM, Lysko PG, Henneberry RC, Simpson IA ( 1991) Expression of two glucose transporters, GLUT1 and GLUT3, in cultured cerebellar neurons: evidence for neuron-specific expression of GLUT3. Mol Cell Neurosci 2 : 351-384. [DOI] [PubMed] [Google Scholar]
- Maher F, Vannucci SJ, Simpson IA ( 1994) Glucose transporter proteins in brain. FASEB J 8 : 1003-1011. [DOI] [PubMed] [Google Scholar]
- McAllister AK, Lo DC, Katz LC ( 1995) Neurotrophins regulate dendritic growth in developing visual cortex. Neuron 15 : 791-803. [DOI] [PubMed] [Google Scholar]
- McAllister AK, Katz LC, Lo DC ( 1999) Neurotrophins and synaptic plasticity. Annu Rev Neurosci 22 : 295-318. [DOI] [PubMed] [Google Scholar]
- Morelli A, Grasso M, Calissano P ( 1986) Effect of nerve growth factor on glucose utilization and nucleotide content of pheochromocytoma cells (clone PC12). J Neurochem 47 : 375-381. [DOI] [PubMed] [Google Scholar]
- Nagamatsu S, Kornhauser JM, Burant CF, Seino S, Mayo KE, Bell GI ( 1992) Glucose transporter expression in brain. cDNA sequence of mouse GLUT3, the brain facilitative glucose transporter isoform, and identification of sites of expression by in situ hybridization. J Biol Chem 267 : 467-472. [PubMed] [Google Scholar]
- Nawa H, Bessho Y, Carnahan J, Nakanishi S, Mizuno K ( 1993) Regulation of neuropeptide expression in cultured cerebral cortical neurons by brain-derived neurotrophic factor. J Neurochem 60 : 772-775. [DOI] [PubMed] [Google Scholar]
- Nehlig A, de Vasconcelos AP, Boyet S ( 1988) Quantitative autoradiographic measurement of local cerebral glucose utilization in freely moving rats during postnatal development. J Neurosci 8 : 2321-2333. [DOI] [PMC free article] [PubMed] [Google Scholar]
- Palacin M, Estevez R, Bertran J, Zorzano A ( 1998) Molecular biology of mammalian plasma membrane amino acid transporters. Physiol Rev 78 : 969-1054. [DOI] [PubMed] [Google Scholar]
- Patterson SL, Abel T, Deuel TA, Martin KC, Rose JC, Kandel ER ( 1996) Recombinant BDNF rescues deficits in basal synaptic transmission and hippocampal LTP in BDNF knock-out mice. Neuron 16 : 1137-1145. [DOI] [PubMed] [Google Scholar]
- Poppe R, Karbach U, Gambaryan S, Wiesinger H, Lutzenburg M, Kraemer M, Witte OW, Koepsell H ( 1997) Expression of the Na+-d-glucose cotransporter SGLT1 in neurons. J Neurochem 69 : 84-94. [DOI] [PubMed] [Google Scholar]
- Rossi FM, Bozzi Y, Pizzorusso T, Maffei L ( 1999) Monocular deprivation decreases brain-derived neurotrophic factor immunoreactivity in the rat visual cortex. Neuroscience 90 : 363-368. [DOI] [PubMed] [Google Scholar]
- Schoups AA, Elliott RC, Friedman WJ, Black IB ( 1995) NGF and BDNF are differentially modulated by visual experience in the developing geniculo-cortical pathway. Brain Res Dev Brain Res 86 : 326-334. [DOI] [PubMed] [Google Scholar]
- Schuman EM ( 1999) Neurotrophin regulation of synaptic transmission. Curr Opin Neurobiol 9 : 105-109. [DOI] [PubMed] [Google Scholar]
- Seeds NW, Siconolfi LB, Haffke SP ( 1997) Neuronal extracellular proteases facilitate cell migration, axonal growth, and pathfinding. Cell Tissue Res 290 : 367-370. [DOI] [PubMed] [Google Scholar]
- Segal RA, Greenberg ME ( 1996) Intracellular signaling pathways activated by neurotrophic factors. Annu Rev Neurosci 19 : 463-489. [DOI] [PubMed] [Google Scholar]
- Sokoloff L ( 1960) The metabolism of the central nervous system in vivo In: Handbook of physiology (Field L, Magoun H, Hall VE, eds), pp 1843-1864. Washington, DC: American Physiological Society.
- Sokoloff L, Reivich M, Kennedy C, Des Rosiers MH, Patlak CS, Pettigrew KD, Sakurada O, Shinohara M ( 1977) The [14C]deoxyglucose method for the measurement of local cerebral glucose utilization: theory, procedure, and normal values in the conscious and anesthetized albino rat. J Neurochem 28 : 897-916. [DOI] [PubMed] [Google Scholar]
- Takei N, Sasaoka K, Higuchi H, Endo Y, Hatanaka H ( 1996) BDNF increases the expression of neuropeptide Y mRNA and promotes differentiation/maturation of neuropeptide Y-positive cultured cortical neurons from embryonic and postnatal rats. Brain Res Mol Brain Res 37 : 283-289. [DOI] [PubMed] [Google Scholar]
- Takei N, Sasaoka K, Inoue K, Takahashi M, Endo Y, Hatanaka H ( 1997) Brain-derived neurotrophic factor increases the stimulation-evoked release of glutamate and the levels of exocytosis-associated proteins in cultured cortical neurons from embryonic rats. J Neurochem 68 : 370-375. [DOI] [PubMed] [Google Scholar]
- Tropea D, Capsoni S, Tongiorgi E, Giannotta S, Cattaneo A, Domenici L ( 2001) Mismatch between BDNF mRNA and protein expression in the developing visual cortex: the role of visual experience. Eur J Neurosci 13 : 709-721. [DOI] [PubMed] [Google Scholar]
- Vannucci SJ ( 1994) Developmental expression of GLUT1 and GLUT3 glucose transporters in rat brain. J Neurochem 62 : 240-246. [DOI] [PubMed] [Google Scholar]
- Vannucci SJ, Seaman LB, Brucklacher RM, Vannucci RC ( 1994) Glucose transport in developing rat brain: glucose transporter proteins, rate constants, and cerebral glucose utilization. Mol Cell Biochem 140 : 177-184. [DOI] [PubMed] [Google Scholar]
- Vannucci SJ, Maher F, Simpson IA ( 1997) Glucose transporter proteins in brain: delivery of glucose to neurons and glia. Glia 21 : 2-21. [DOI] [PubMed] [Google Scholar]
- Vannucci SJ, Clark RR, Koehler-Stec E, Li K, Smith CB, Davies P, Maher F, Simpson IA ( 1998) Glucose transporter expression in brain: relationship to cerebral glucose utilization. Dev Neurosci 20 : 369-379. [DOI] [PubMed] [Google Scholar]
- Whitesell RR, Ward M, McCall AL, Granner DK, May JM ( 1995) Coupled glucose transport and metabolism in cultured neuronal cells: determination of the rate-limiting step. J Cereb Blood Flow Metab 15 : 814-826. [DOI] [PubMed] [Google Scholar]
- Yu N, Martin JL, Stella N, Magistretti PJ ( 1993) Arachidonic acid stimulates glucose uptake in cerebral cortical astrocytes. Proc Natl Acad Sci USA 90 : 4042-4046. [DOI] [PMC free article] [PubMed] [Google Scholar]