

Abstract
AII amacrine cells play a critical role in the high-fidelity signal transmission pathways involved with nighttime vision. The temporal properties of the light responses strongly depend on the transfer function at different synaptic stages and consequently on presynaptic calcium influx. AII light responses are complex waveforms generated by graded input, they comprise Na+-based spikes as well as a sustained component, and they are transferred to graded cone bipolar cells. It is, therefore, of interest to determine the properties of AII voltage-dependent calcium channels (VDCCs) to establish whether these cells express N-type and/or P/Q-type VDCCs, characteristic of spiking neurons, or whether they are more like graded neurons, which mostly use L-type VDCCs. We combined electrophysiological, molecular biological, and imaging techniques to characterize calcium currents and their sites of origin in mouse AII amacrine cells. Calcium currents activated at potentials more positive than -60 mV (maximally between -50 and -20 mV) and inactivated slowly. These currents were blocked by dihydropyridine (DHP) antagonists and were enhanced by the DHP agonist BayK 8644. Single-cell RT-PCR analysis of mRNA encoding for different calcium channel α subunits in AIIs revealed a consistent expression of the α1-D subunit. Calcium imaging of AII cells showed that the greatest change in intracellular calcium occurred in the lobular appendages, with minor changes being observed in the arboreal dendrites. Depolarization-induced calcium rises were also modulated by DHPs, suggesting that a particular kind of L-type VDCC, mainly localized to the lobular appendages, enables these spiking-capable neurons to release neurotransmitter in a sustained manner onto OFF-cone bipolar cells.
Keywords: amacrine, rod vision, scotopic pathways, tonic synapses, transmitter release, α1D, CaV1.3α1, mouse retina, dihydropyridine
Introduction
Narrow-field bistratified AII amacrine cells play a crucial role in signal processing in nighttime vision. In the conventional rod pathway, rod photoreceptors convert light into an electrical signal that is transferred via a sign-inverting synapse to rod bipolar (RB) cells, which in turn synapse onto AII amacrine cells. The AII cells then split the incoming signal into the ON and OFF channels of the visual system by making electrical synapses, via gap junctions, with ON-cone bipolar (CB) cells and glycinergic inhibitory synapses with OFF-CB cells. CB cells transmit the information further to their respective ON and OFF ganglion cells.
In scotopic conditions, the light responses of various cell types appear to possess a robust sustained component. Light responses of rods show an early transient response, followed by a sustained phase (Baylor et al., 1984; Schneeweis and Schnapf, 1995). Similarly, RB cells respond to a light step in a biphasic manner comprising a transient and a sustained response (Dacheux and Raviola, 1986; Berntson and Taylor, 2000; Euler and Masland, 2000). AII cells, the next relay station, also seem to respond first with a transient component, followed by a more sustained response (Dacheux and Raviola, 1986; Bloomfield and Xin, 2000). Subsequently, ON-CB and OFF-CB cells respond to light in a sustained manner (Berntson and Taylor, 2000), and ganglion cells, in agreement with their presynaptic input, display a strong sustained component (Müller et al., 1988; Müller and Dacheux, 1997).
In rods and RB cells, neurotransmitter release takes place in zones that are highly specialized for the transmission of sustained graded responses and large bandwidths of information (Rao-Mirotznik et al., 1995; Juusola et al., 1996; von Gersdorff, 2001). Release areas are equipped with ribbon structures and with the exocytotic machinery necessary to provide continuous release of transmitter. Slow-inactivating L-type voltage-dependent calcium channels (VDCCs) are among the crucial elements that allow prolonged exocytosis, because prolonged periods of high calcium levels are required to trigger this release mode. AII cells display action potential-like spikes, although whether these spikes propagate signals along the cell membrane or act as local signal boosters remains to be clarified (Boos et al., 1993; Smith and Vardi, 1995; Veruki and Hartveit, 2002). There is strong evidence that transmitter release in spiking neurons is triggered by calcium influx at conventional synapses via N-type, P/Q-type, and R-type calcium channels or combinations of these channels (Juusola et al., 1996; Wu and Saggau, 1997). In AII cells, neurotransmitter release takes place at conventional synapses made by their lobular appendages onto OFF-CB cells (Famiglietti and Kolb, 1975; Strettoi et al., 1992; Sassoe-Pognetto et al., 1994). Thus, AII cells present a perplexing scenario in which sustained transmitter release is expected to take place in the lobular appendages at conventional synapses, which are usually furnished with VDCCs possessing fast inactivation kinetics.
Therefore, we set out to investigate the calcium channel types as well as their location in AII amacrine cells in mouse retinal slices using whole-cell recordings combined with single-cell RTPCR and intracellular calcium imaging. Our data show that AII cells possess slowly inactivating VDCCs of the α1D (CaV1.3α1) variety preferentially localized to their lobular appendages, in which they synapse onto OFF-CB cells.
Materials and Methods
All procedures were in accordance with the guidelines for animal experiments issued by the Federal Republic of Germany (Tierschutzgesetz). Vertical slices were prepared from the retinas of C57Bl/6J mice, 5-7 weeks of age, as described previously (Boos et al., 1993; Protti et al., 1997). Briefly, animals were killed by cervical dislocation and decapitated. The eyes were rapidly enucleated and transferred to a dish containing Ames medium. The cornea was cut along the ora serrata, the lens and vitreous were removed, and the retina was separated from the sclera. The retina was then cut into four pieces, one of which was embedded in 2% agar dissolved in Ames medium (kept at 38°C), and the resulting block was rapidly cooled. The block was transferred to a microslicer (Dosaka EM Co., Kyoto, Japan), and 200-μm-thick slices were cut. Slices were kept in Ames equilibrated with a mixture of 95% O2 and 5% CO2 for 1 hr before electrophysiological recording. Calcium dyes were purchased from Molecular Probes (Eugene, OR), ω-Conotoxin GVIA was purchased from Alamone Labs (Jerusalem, Israel), and ω-Agatoxin IVA was purchased from Peptide Institute (Osaka, Japan). Dihydropyridine (DHP) agonists, blockers, and all other chemicals were purchased from Sigma (Taufkirchen, Germany).
Electrophysiological recordings. Experiments were performed with the tight-seal whole-cell recording configuration of the patch-clamp technique. All experiments were performed at room temperature (20-22°C) using a fixed stage, upright microscope (Axioskop; Zeiss, Oberkochen, Germany) equipped with Nomarski differential interference contrast optics and a water immersion objective (63×; 0.9 NA). Recordings were obtained from the amacrine cells located in the innermost part of the inner nuclear layer (INL), using an EPC-9 amplifier (Heka Electronic, Landau, Germany). Borosilicate glass pipettes with 10 MΩ resistance were used. Experiments were performed with a cesium gluconate (CsGlu)-based intracellular solution containing (in mm): 106 CsGlu, 10 tetrabutylammonium chloride (TBA), 30 HEPES, 4.6 MgCl2, 0.4 Na-GTP, and 4 Na-ATP, pH 7.3. Neurobiotin (10 mg/ml) was included in the intracellular solution. Membrane potential values were corrected for junction potential (-15 mV). Leak and capacitive currents were subtracted (p/4 protocol). The tissue was perfused at a rate of 1-1.5 ml/min. Histological examination of neurobiotin-filled cells was performed after completion of electrophysiological recordings using standard staining procedures (Horikawa and Armstrong, 1988).
Single-cell RT-PCR. Cytoplasm from AII amacrine cells (n = 9), ganglion cells (n = 1), and cerebellar Purkinje cells (n = 5) was harvested to determine the molecular composition of their VDCCs by RT-PCR. Whole-cell recordings were established with thick wall borosilicate glass pipettes that had been baked previously for >4 hr at 200°C to inactivate RNases. Pipettes (2-5MΩ) were filled with intracellular solution (in mm: 140 KCl, 3 MgCl2, 10 HEPES, 0.5 EGTA) that had been sterile-filtered and autoclaved. Neurobiotin (0.5%) and Oregon Green BAPTA-1 (200 nm) were added to the internal solution in aliquots. Cellular cytoplasm and, in some cases, nuclei were harvested into the pipette using gentle suction under visual control. Harvesting was immediately terminated on loss of a gigaohm seal. Any remaining membrane attached to the electrode was removed by passing the electrode through the air/bath interface one or more times under visual control. Pipette contents were expelled into a PCR tube containing random primers (5 mm; Invitrogen, Groningen, The Netherlands), dNTPs (5 mm; Invitrogen), DTT (0.01 mm), RNase inhibitor (20 U; Promega, Mannheim, Germany), and Superscript II reverse transcriptase (100 U; Invitrogen), the total volume of which was 10 μl. Control experiments (n = 4) were also performed in which the pipette contents were collected after the electrode was lowered into the bath to just above the slice, while positive pressure was applied, and removed without harvesting a cell.
cDNA was reverse transcribed from cellular mRNAs in the above-described PCR tubes overnight at 37°C. Simultaneous amplification of cDNAs present in the 10 μl reverse transcription reaction was performed using primers for β-actin and all neuronal calcium channel α subunits (Table 1). These primer pairs were designed to span intronic sequences, so that amplification of genomic DNA would be detected easily by their relative larger sizes. To the buffer, supplied by the manufacturer, we added Taq polymerase (2.5 U; Qiagen, Hilden, Germany) as well as 10 pmol of each primer and performed PCR (94°C for 2 min; 20 cycles of 94°C for 40 sec; 58°C for 40 sec; 72°C for 60 sec, followed by a 10-min extension step at 72°C) in a total volume of 100 μl.
Table 1.
PCR primer sequences
|
αSubunit |
Gene |
Forward primer (5′-3′) |
Reverse primer (5′-3′) |
Insert |
|---|---|---|---|---|
| L-type | ||||
| 1.2a | CACNA1C | TCGTGGGTTTCGTCATTGTCA | CCTCTGCACTCATAGAGGGAGAG | 481 |
| 1.3a | CACNA1D | GAGCCTCGATTAGTATAGTGGAATG | AGGATGCAGCAACAGTCCATA | 217 |
| 1.4 | CACNA1F | GAAGCAGCAGATGGAAGAAG | TGTGTGGAGCGAGTAGAGTG | 206 |
| P/Q, N, R types | ||||
| 2.1a | CACNA1A | GAGCGGCTGGATGACACGGAACC | GAGCTGGCGACTCACCCTGGATGTC | 420 |
| 2.2a | CACNA1B | GAAGTAGCTGAAGTCAGCC | CTTGCGTGTCAGCCCCTGGA | 483 |
| 2.3a | CACNA1E | GAGACTGTGGTGACTTTTGAGGACC | ATAGAGCTATGGGGCACCATGGCTT | 697 |
| T-type | ||||
| 3.1b | CACNA1G | TACGGAGGCTGGAGAAAA | GATGATGGTGGG(A/G)TTGAT | 449 |
| 3.2b | CACNA1H | CGCAGACTATTCACACAC | GATGATGGTGGG(A/G)TTGAT | 325 |
| 3.3b | CACNA1I | GGAAAAGAAGCGCCGTAA | GATGATGGTGGG(A/G)TTGAT | 364 |
| β Actin
|
|
GGGAAATCGTGCGTGACATT
|
CGGATGTCAACGTCACACTT
|
252
|
The first round of PCR was followed by a second round of PCR (35 cycles) using 2 μl of the first PCR with the same cycling parameters and reaction solution as above, but with only a single primer set. From each 100 μl PCR reaction, 10 μl were electrophoresed through 2% agarose gels, stained with ethidium bromide (0.5 μg/ml), and imaged under UV excitation (Eagle Eye; Stratagene, La Jolla, CA). This protocol was initially tested on 50 pg of whole-brain RNA extracted using Trizol (Invitrogen), and all transcripts were amplified to detectable levels (data not shown). The identity of PCR products was confirmed by sequence analysis after cloning (TOPO; Invitrogen).
Fluorometric calcium imaging. Changes in intracellular calcium concentrations ([Ca2+]i) were detected as changes in the fluorescence intensity of Oregon Green 488 BAPTA-5N (OG5; 200 μm), which was included in the patch pipette. Calcium Green 1 (CG1; 100 μm) and Oregon Green 488 BAPTA 2 (OG2; 100 μm) were also used as calcium indicators. Fluorescence images were obtained with a MERLIN imaging system (Life Science Resources, Cambridge, UK). The excitation pathway consisted of a high-intensity Xe light source focused in a high-speed SpectraMASTER monochromator system coupled to the microscope by a liquid light guide. Excitation wavelength centered at 488 nm was used to monitor intracellular calcium concentration with the aforementioned dyes. The dichroic mirror and high-pass emission filter had center wavelengths at 510 nm and 520 nm, respectively. Images were acquired with an eight-bit-intensified analog video camera operating at 768 × 576 pixels, in its integrating mode. MERLIN 1.88 was used as acquisition and analysis software.
The standard protocol to study [Ca2+]i transients consisted of acquiring a sequence of images at regular intervals for 15-20 sec. Control images were taken either for 2 or 5 sec before depolarization. Stimuli consisted of a sequence of depolarizing pulses from -75 mV. Images were integrated for times ranging from 100 to 450 msec, optimizing this time separately for acquisition from the lobular appendages and the arboreal dendrites regions, the two regions that were the focus of our study. Changes in [Ca2+]i in the soma were also observed but not investigated, because the dynamic range of the imaging system used (256 bits) would have required different image acquisition rates. Fluorescence changes were analyzed offline by measuring the average fluorescence in small regions of interest (ROI) and converting the value to a percentage change in fluorescence: ΔF/F0 = 100*(F - Fr)/(Fr - B), where F is the measured fluorescence signal at any given time, Fr is the average fluorescence from several consecutive images preceding the stimulus, and B is the average value of the background fluorescence from four regions located in the periphery of the visual field and of similar size to the cellular ROIs. Background values were stable during each experiment. The decay phase of calcium transients was fitted using a least-squares fitting routine to a single exponential function: F(t) = A exp(-t/τ), in which t is time and A is the fitted amplitude of the transient. Data were analyzed with Igor Pro software (WaveMetrics, Lake Oswego, OR) using custom-made routines.
Results
Identification and morphology of AII amacrine cells
Recordings were obtained from AII amacrine cells in light-adapted retinal slices. They were identified under Nomarski optics by the following morphological characteristics: their somata, localized to the innermost part of the INL, bulge into the inner plexiform layer (IPL) giving rise to one or more sturdy primary dendrites (lobular dendrites), from which the lobular appendages branch in sublamina a while several thinner bushy dendrites (arboreal dendrites) ramify further down in the IPL in sublamina b. Cells were first morphologically identified on the basis of fluorescence images obtained after breaking into the cell with the patch pipette and dialyzing with intracellular solution containing both a calcium sensitive dye and neurobiotin. Commonly, the lobular appendages were rapidly loaded with dye, whereas the arboreal dendrites needed more time to be filled. After the recordings, slices were fixed and histochemically processed to reveal the morphology of neurobiotin-filled cells. In the initial experiments, neurobiotin staining was always performed to corroborate the cell identity as observed in the fluorescence image. Because we achieved a very high rate of success in selecting AII cells, cell type recognition in subsequent experiments was based mainly on fluorescence images. On loading with the Ca2+ probes, only individual cells were labeled, because Ca2+-sensitive dyes have a high molecular weight such that they do not permeate gap junctions. However, after neurobiotin staining, an extensive network of somata and dendrites could be observed occasionally, revealing gap junctional coupling (Fig. 1). Mosaics consisting of other AII cells as well as different types of ON-CB cells were observed around the injected cells, in agreement with previous reports (Vaney, 1991; Mills and Massey, 1995) but in contrast to the study of Boos et al. (1993). The presence of tracer coupling implies that AII cells are electrically coupled, as recently shown by Veruki and Hartveit (2002).
Figure 1.
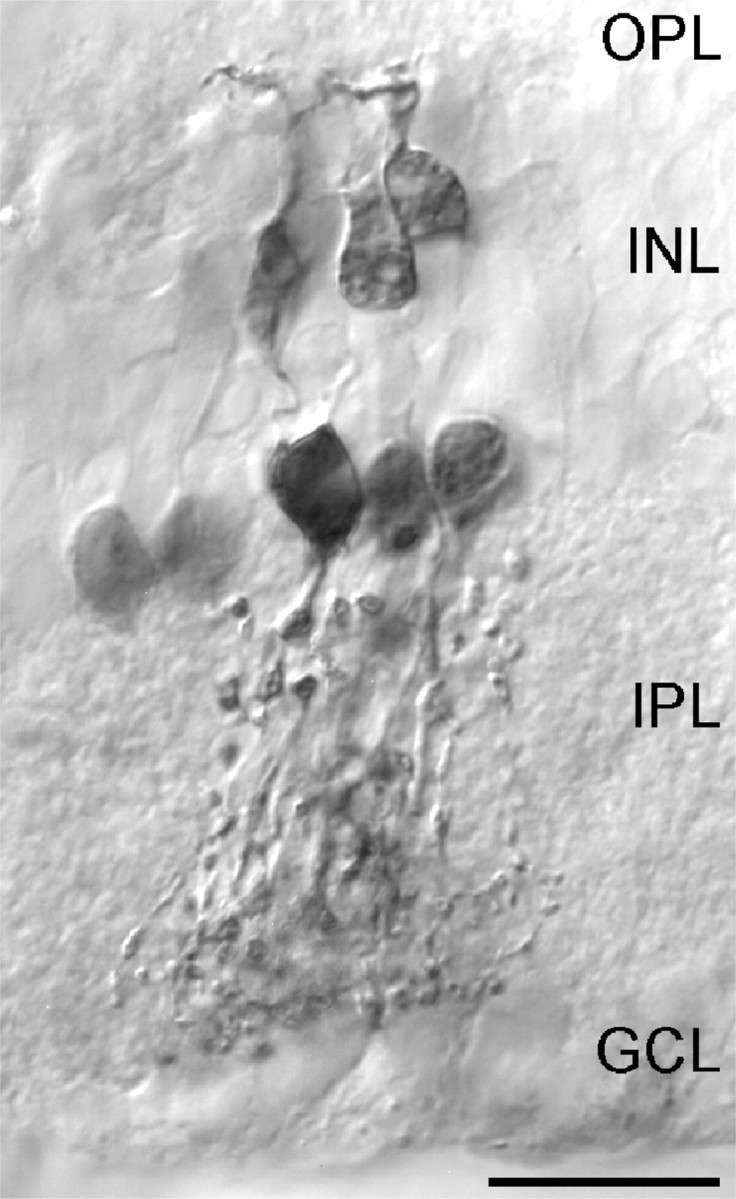
Micrograph of a retinal slice showing neurobiotin staining of a group of coupled AII (inner IPL) and ON-CB cells (outer IPL) after filling a single AII amacrine cell via the patch pipette. The strongly stained soma located in the innermost part of the INL is the patched cell. Robust dendrites that constitute the lobular appendages of AII cells are observed in sublamina a of the IPL, whereas the more bushy arboreal dendrites are observed in sublamina b. Scale bar, 10 μm.
General electrophysiological properties
Whole-cell recordings from AII cells in light-adapted conditions revealed a high level of spontaneous activity. Current fluctuations with kinetics characteristic of spontaneous IPSC activity as described previously for ganglion and amacrine cells (Protti et al., 1997; Tian et al., 1998; Frech et al., 2001) were typically a hallmark of these cells, whereas currents with kinetics typical of EPSCs were rarely observed. These currents had an amplitude ranging from -10 to -50 pA and were almost completely blocked by a mixture of the GABAA receptor antagonist bicuculline (10 μm) and the glycine receptor antagonist strychnine (1 μm) (data not shown). Therefore, to block spontaneous synaptic activity, the majority of experiments were performed in the presence of these drugs.
In a large number of cells, spontaneous currents characterized by a very fast rise and decay time (τ ≈ 1 msec) and a frequency between 10 and 180 Hz persisted after abolishing IPSC activity. The presence of these currents was dependent on membrane voltage and they ran down during the recordings. Pharmacological dissection revealed that they originated from activation of voltage-dependent Na+ channels, as shown by their sensitivity to 0.5-1 μm TTX (Boos et al., 1993; Veruki and Hartveit, 2002). Voltage-activated Na+ currents were also elicited by depolarizing steps or voltage ramp protocols, and these currents could also be reversibly blocked with TTX (data not shown). Because the focus of our study was the identification of the VDCCs, TTX was routinely added to the bathing medium to suppress the contribution of Na+ channels to the voltage-activated currents.
Characterization of Ca2+ currents
Cells were whole-cell patch clamped and dialyzed with an intracellular solution containing CsGlu and TBA to block most of the voltage-activated K+ currents. This internal solution in combination with bath perfusion of TTX, strychnine, and picrotoxin allowed us to isolate voltage-activated calcium currents. AII amacrine cells have been shown to possess very robust voltage-activated K+ currents, with peak amplitudes up to 3.5 nA (Boos et al., 1993). Full blockade of the outward K+ currents frequently lagged behind the appearance of inward currents and required longer periods of dialysis. Calcium currents, however, were observable from the beginning of the recording because they were not masked by the remaining K+ efflux, probably because of their different activation thresholds. Membrane potential was held at -75 mV, and voltage steps of 10 mV were applied every 2 sec. Such a voltage protocol is shown in Figure 2A. Inward currents of increasing magnitude with peak amplitudes around -40 and -30 mV were elicited after surpassing a threshold of -60 mV. Individual traces from holding potential to test potentials -55, -35, and -15 mV are shown in Figure 2B. No transient component was observed even when depolarizing from -95 mV, suggesting that low-voltage-activated (LVA) calcium currents are not present in AII amacrine cells. The current-voltage curves shown in Figure 2C show the similar properties of the Ca2+ currents when depolarizing from holding potential of -75 and -95 mV (n = 14 cells). These current-voltage relations also show that outward K+ currents, although largely reduced, were not fully blocked, hindering an accurate estimation of the reversal potential. Inward currents were blocked by Co2+ (n = 3 cells) and were enhanced when using 5 mm Ba2+ as charge carrier (n = 3 cells; data not shown), confirming that they arise from the activation of VDCCs. Current amplitudes measured from Vh =-95 to Vtest = 35 mV ranged between -10 and -80 pA and had an average peak amplitude of -37 pA (n = 57 cells). The histogram in Figure 2D shows the amplitude distribution of these currents. The inactivation properties of calcium currents were investigated by applying voltage pulses of varying duration, from holding potential to the maximal current activation potential. Inward currents of almost steady amplitude persisted for pulses that lasted up to several hundred milliseconds, demonstrating that the calcium currents inactivated very slowly. As shown in the example in Figure 2E, responses to three different depolarizing pulse durations (100, 250, and 500 msec) manifested a very slow inactivation. These inactivation rates are in a similar range to those observed for high-voltage-activated (HVA) Ca2+ currents in mammalian cone photoreceptors and bipolar cells (Protti and Llano, 1998; Taylor and Morgans, 1998; Pan, 2000) as well as in goldfish Mb1-bipolar cells (von Gersdorff and Matthews, 1996). Throughout the range explored, charge transfer on depolarization exhibited a linear relation to pulse duration (Fig. 2F). It is important to remark that these slow inactivation rates were observed even in the absence of strong exogenous Ca2+ buffers in the intracellular solution, suggesting that Ca2+-dependent inactivation of Ca2+ currents is not an important regulatory mechanism of their kinetics.
Figure 2.

Characterization of voltage-dependent calcium currents in AII amacrine cells. A, Voltage-activated currents recorded from an AII amacrine cell dialyzed with CsGlu. Depolarizing pulses of 10 mV steps were applied from a holding potential of -75 mV. B, Three individual traces from the currents shown in A from holding potential to test potentials -55, -35, and -15 mV from top to bottom, respectively. C, Average current-voltage relation measured from 14 cells recorded under similar conditions from Vhold = -75 and -95 mV. Values represent peak amplitude, and bars indicate SE. D, Amplitude histogram of the peak amplitude values (57 cells). E, Superimposed recordings from Vhold = -75 mV to Vtest = -35 mV for three different durations (100, 250, and 500 msec) showed a linear relation between charge transfer and pulse duration (F).
Pharmacology of calcium currents
So far, we have observed that in AII cells, both the activation threshold of Ca2+ currents and their voltage of maximal activation are more negative than those reported for the majority of other HVA Ca2+ currents, resembling more the activation properties of an LVA Ca2+ current. In other retinal neurons, however, it has been reported that L-type Ca2+ channels display more negative activation threshold than classically described L-type calcium channels (Protti and Llano, 1998; Taylor and Morgans, 1998). In addition, the lack of a transient component together with their slow decay kinetics suggests that calcium influx could be mediated by L-type calcium channels with kinetics similar to those previously observed in cone photoreceptors and bipolar cells. We set out to pharmacologically explore which type of voltage-activated calcium channels are responsible for calcium influx in AII amacrine cells.
HVA Ca2+ currents are currently categorized into several subclasses on the basis of their distinctive biophysical and pharmacological properties, as well as by their molecular identity. At least four different HVA Ca2+ channel types have previously been identified, namely L, N, P/Q, and R types (Zhang et al., 1993; McCleskey, 1994; Randall and Tsien, 1995; Ertel et al., 2000). Slowly inactivating L-type Ca2+ channels are positively and negatively modulated by DHP agonists and antagonists, respectively, whereas N-type Ca2+ channels have intermediate inactivation kinetics and are sensitive to the neuropeptide ω-Conotoxin GVIA. Channels of the P/Q type inactivate slowly and are blocked by the neurotoxin ω-Agatoxin IVA, whereas R-type Ca2+ channels are resistant to all the previously mentioned blockers and no other effective blockers are currently known.
We studied the effect of the L-type calcium channel agonist BayK 8644 (10 μm) on depolarization-induced calcium influx. Application of BayK 8644 produced a large increase in current amplitude above control values (Fig. 3A). Interestingly, the overall calcium current was enhanced, resulting in an increased amplitude but again with very slow inactivation kinetics. It is also evident that the tail current amplitude at the end of the depolarizing pulse was increased and lengthened. On average, the effect of BayK 8644 on depolarization-induced transmembrane charge was doubled in the presence of BayK 8644, and this effect was reversible (Fig. 3B; n = 20).
Figure 3.

Effect of DHP agonists and antagonists on VDCCs of AII cells. A, Representative recordings showing calcium currents elicited by steps to -45 mV from a holding potential of -95 mV. After recording currents in control conditions (middle trace), 10 μm BayK 8644 was added to the bathing medium (bottom trace). BayK 8644 was washed out from the bathing medium, and the calcium current returned to its initial amplitude. Perfusion of the tissue with medium containing 10 μm nitrendipine significantly reduced the current (top trace). B, Ca2+ influx expressed as charge transfer on depolarization. The summary of the effect of DHP antagonists (14 cells) and BayK (20 cells) on depolarization-elicited transmembrane charge is carried by Ca2+ ions of AII cells.
Two different L-type calcium channel antagonists were tested on voltage-dependent calcium currents. Both nitrendipine and nifedipine (10 μm) greatly reduced calcium currents without substantially affecting the kinetics of the remaining current. Figure 3A shows an example of the blocking effect of 10 μm nitrendipine in the same AII amacrine cell previously treated with 10 μm BayK 8644. Nitrendipine clearly reduced both the early and delayed phase of the calcium current with equal potency. In a total of 14 AII cells, DHP antagonists reduced calcium currents by almost 80% (Fig. 3B). The reversibility of the blocking effect on calcium currents required long periods of washout and was only observed occasionally. We investigated the effect of N-type and P/Q-type calcium channel blockers, on the voltage-gated calcium currents of AII cells. After incubation for 10 min in medium containing 5 μm ω-Conotoxin GVIA, calcium currents were reduced to ∼90% of their control amplitude (two cells). A similar reduction is commonly observed in the absence of any drugs and reflects run down of the calcium currents. In two cells treated with 100 nm ω-Agatoxin IVA, calcium currents suffered a similar reduction, implying that there is no blockade of the currents in addition to the run down. The clear effects observed in response to both DHP agonists and antagonists, together with the lack of effect of N-type and P/Q-type calcium channel blockers, indicate that L-type calcium channels play a major role in mediating calcium influx into AII amacrine cells.
Molecular characterization of the α 1 subunits of single AII cells
To determine the molecular identity of the VDCCs underlying our recordings of AII amacrine cells, we undertook single-cell RT-PCR experiments. There are currently 10 known genes (CACNA1A-CACNA1I and CACNA1S) coding for each of the VDCC α subunits (Ertel et al., 2000). Nine of these subunits (1A-1I) are expressed in neural tissue, whereas the remaining α subunit (1S) is expressed exclusively by muscle tissue. We, therefore, obtained primer sets for each gene (CACNA1A-CACNA1I; Table 1) and characterized their efficiency so that primer concentrations and PCR parameters were optimized for amplification from 50 pg of whole-brain mRNA.
We harvested cellular cytoplasm from nine AII amacrine cells. Four of these cells failed to give amplification of any product. All of the remaining five AII cells strongly and exclusively expressed a correctly sized PCR product for the CACNA1D gene (CaV1.3α1; Fig. 4A). No other correctly sized PCR products were obtained from AII cytoplasm. In contrast, amplification of cytoplasmic content harvested from a retinal ganglion cell yielded several PCR products belonging to all three families of VDCCs (Fig. 4B).
Figure 4.

CaV gene expression in single cells. A, Expression of VDCC α subunit encoding mRNAs in a single AII amacrine cell. Only a single PCR product (CaV1.3α1; CACNA1D) was observed. B, α Sub unit mRNAs detected from a single retinal ganglion cell. Several PCR products were observed. Genomic amplification was observed for CaV2.2α1 (larger band) and CaV3.2α1. C, Profile of VDCC α subunit mRNAs present in a single cerebellar Purkinje cell. Specific subunits of all major classes of VDCCs were found. Images represent ethidium bromide-stained agarose gels loaded with PCR reaction products after single-cell RT-PCR. The numbers at left give size (in base pairs) of the corresponding molecular weight marker bands and apply to all three panels. See Table 1 for expected PCR product sizes.
As further confirmation of the efficiency of our technique, we amplified cDNA made from the cytoplasm of five cerebellar Purkinje cells. Calcium currents in mature Purkinje cells are dominated by P-type currents (CaV2.1α1; CACNA1A) (Llinas et al., 1989; Hillman et al., 1991; Usowicz et al., 1992). Specific P-type antagonists such as ω-Agatoxin-IVA, however, do not completely eliminate all VDCC activity (Usowicz et al., 1992). The presence of N-, L-, and T-type VDCCs in Purkinje cells has also been shown by electrophysiological, pharmacological, and immunocytochemical means (Ahlijanian et al., 1990; Hillman et al., 1991; Regan, 1991; Westenbroek et al., 1992; McDonough and Bean, 1998; Liljelund et al., 2000). In four of five cells, we obtained strong amplification of the expected CACNA1A (CaV2.1α1) PCR product and a much weaker band for CACNA1G (CaV3.1α1; Fig. 4C; Table 2). In two cells, we also detected the presence of mRNAs coding for CACNA1B (CaV2.2α1) and CACNA1D (CaV1.3α1). No amplification was observed from four control experiments in which pipette contents were harvested after being introduced into the bath.
Table 2.
α Subunit
|
Cell |
1.2 |
1.3 |
1.4 |
2.1 |
2.2 |
2.3 |
3.1 |
3.2 |
3.3 |
|---|---|---|---|---|---|---|---|---|---|
| All 1 | − | + | − | − | − | − | − | − | − |
| All 2 | − | + | − | − | − | − | − | − | − |
| All 3 | − | + | − | − | − | − | − | − | − |
| All 4 | − | + | − | − | − | − | − | − | − |
| All 5 | − | + | − | − | − | − | − | − | − |
| RGC 1 | − | + | − | + | + | − | + | − | + |
| Purkinje 1 | − | − | − | + | − | − | − | − | − |
| Purkinje 2 | − | − | − | + | − | − | + | − | − |
| Purkinje 3 | − | − | − | − | − | − | + | − | − |
| Purkinje 4 | − | + | − | + | + | − | + | − | − |
| Purkinje 5
|
−
|
+
|
−
|
+
|
+
|
−
|
+
|
−
|
−
|
Single-cell RT-PCR data demonstrating the Cav α subunit gene expression profiles of different types of cells (−, No PCR product detected; +, PCR product detected).
These data strongly support the physiological and pharmacological evidence that AII amacrine cells exclusively express L-type VDCCs that contain the CaV1.3α1 α subunit.
Sites of origin of Ca2+ entry
Depolarization-induced calcium influx has been extensively investigated in several CNS neurons. All types of VDCCs have been localized to the dendrites of distinct classes of neurons, in which they have been found to play crucial roles in the modulation of dendritic action potentials, as well as being involved in a variety of forms of plasticity phenomena. In axonal terminals, N-type VDCCs as well as P/Q-type VDCCs seem to primarily mediate calcium influx responsible for transmitter release. Most amacrine cells represent an exceptional case among neurons, because transmitter release takes place at the active zones of their complex dendrites, since most of them do not possess an axon. The results presented previously revealed the presence of L-type calcium channels in AII amacrine cells, a channel type that does not normally play a major role in neuronal exocytosis. Thus, it is appealing to investigate their subcellular distribution in AII cells to see whether or not they are localized to the synaptic processes.
The spatial distribution of depolarization-induced changes in intracellular calcium concentration ([Ca2+]i) was monitored by imaging the fluorescence emitted by low- and high-affinity Ca2+-sensitive dyes. We focused our attention mainly on the two different dendritic compartments, the lobular appendages, and the arboreal dendrites. The use of the low-affinity indicator OG5 (KD, ∼20 μm), showed a large change in fluorescence in the lobular appendages in almost all cells studied (22 of 24) as opposed to no or very small changes in the arboreal dendrites in a smaller proportion of cells (11 of 24). Figure 5A shows an OG5-filled AII amacrine cell, in which the soma, lobular appendages, arboreal dendrites, and the ROIs for the calculation of ΔF/F0 can be observed. On application of a 500 msec depolarizing pulse, a large increase in [Ca2+]i was observed in the lobular appendages while a minor increase took place in the arboreal dendrites (Fig. 5B). Because the magnitude of depolarization-evoked Ca2+ changes in the arboreal dendrites was very small, to compare Ca2+ signals in both dendritic structures only those cells that showed a clearly detectable response to depolarization were used for quantification. A 250 msec depolarization yielded an average increase in fluorescence of 63% in the lobular appendages (n = 22), whereas an increase of only 9% was observed in the arboreal dendrites (n = 11). An offline linescan analysis, in which the fluorescence intensity values of a line across a cell are plotted as a function of time before and after depolarization, clearly revealed the distribution pattern of calcium transients, as shown in Figure 5C. A prominent increase in fluorescence is observed in the lobular appendages but not in the arboreal dendrites.
Figure 5.
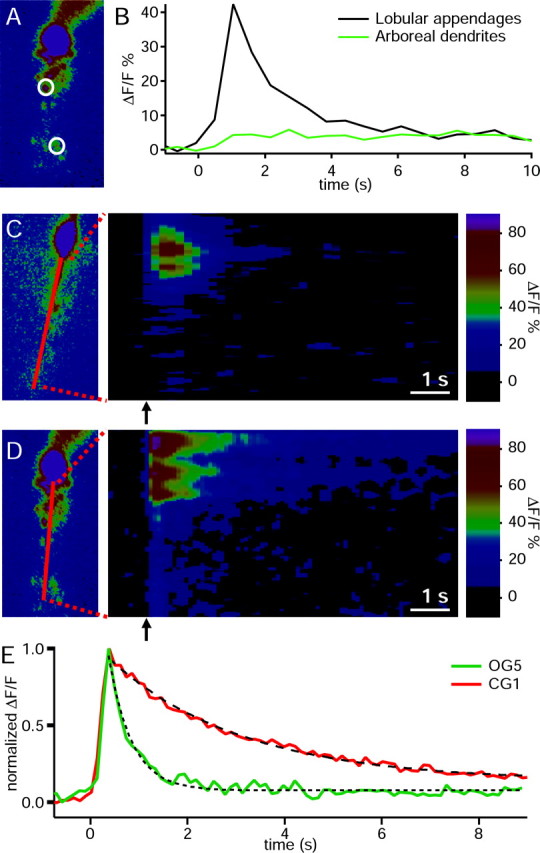
Localization of depolarization-induced Ca2+ signals. A, Fluorescence image of an AII amacrine cell filled via the patch pipette with OG5. The circles denote ROI, namely the lobular appendages in the middle region and arboreal dendrites in the lower region, for the calculation of ΔF/F0. B, Calcium transients of the AII cell shown in A, associated with a 500 msec depolarization. C, Offline linescan analysis of the spatial distribution of depolarization-elicited calcium transients. The left panel shows the fluorescence image of an AII cell, in which fluorescence intensity versus time was analyzed along the drawn line. The soma was excluded from the analysis. The right panel displays the percentage of change in fluorescence intensity (ΔF/F) values (color coded). The abscissa represents the time before and after depolarization (arrow). The ordinate represents the position within the dendritic arbor of the AII cell. The depolarizing pulse is indicated by the arrow. D, Offline linescan analysis as in C, using the high-affinity calcium indicator OG2. A depolarizing pulse was applied from Vhold = -85 mV to -45 mV for 250 msec. Images are pseudocolor representations of the raw fluorescence data, in which black to magenta indicates lowest to highest fluorescence. The depolarizing pulses are indicated at time 0 in all cases. E, Time course of calcium transients in response to a 250 msec depolarization monitored with OG5 and CG1. The traces are normalized to facilitate comparison of the decay kinetics.
Because Ca2+ transients in the arboreal dendrites were only detected occasionally and their magnitude was smaller than those observed in the lobular appendages, we also used intermediate affinity (OG2) and high-affinity (CG1) calcium dyes to investigate the nature of the calcium transients in more distal dendritic processes. The use of CG1 revealed again a large difference in the magnitude of the depolarization-induced change in fluorescence between the lobular appendages and the arboreal dendrites. The mean percentage of ΔF/F in the lobular appendages was 180% measured in seven of seven cells recorded, whereas it was 53% in six of the seven cells (one cell showed no change and was not considered for comparative purposes) in the arboreal dendrites. Similar results were observed when we used OG2. In the lobular appendages, Ca2+ transients were observed in all 11 cells studied with an average ΔF/F = 170%, whereas it was only 32% in the arboreal dendrites (nine of the 11 cells; two cells that showed no changes were not included in the average). A representative experiment with OG2 in which fluorescence changes were observed in both lobular appendages and arboreal dendrites is shown in Figure 5D. This offline linescan analysis also evidences the greater changes occurring in the distal inner plexiform layer. We have also observed that short (5-10 msec) depolarizing pulses were able to elicit detectable increments of ΔF/F0 in the lobular appendages but not in the arboreal dendrites (data not shown). The decay kinetics of the calcium signals were also different depending on the fluorophores used. Figure 5E shows that Ca2+ transients measured with OG5 (low-affinity dye) decay more rapidly than those reported by CG1 (high-affinity dye), reflecting the faster kinetics of OG5 but not the kinetics of the calcium currents.
To investigate whether L-type VDCCs mediate calcium influx in the lobular appendages, we studied the effect of DHPs on their calcium signals. BayK 8644 doubled the depolarization-induced increase in ΔF/F0 in the lobular appendages, and this effect was reversible (n = 3; Fig. 6A), consistent with the observed effect on calcium currents (see above). In agreement with this result, depolarization-elicited Ca2+ signals in the lobular appendages were largely abolished by application of 10 μm nimodipine (Fig. 6B). Like the calcium currents, the DHP block could not be reversed.
Figure 6.

Pharmacological profile of depolarization-induced calcium signals. A, Effect of an L-type calcium channel agonist on depolarization-elicited fluorescence intensity changes of OG5 in the lobular appendages. Calcium transients in response to a 250 msec depolarization were recorded in control conditions, after perfusion with 10 μm BayK 8644 and after a washout. BayK 8644 almost doubled the change in fluorescence, and this effect was reversible. B, Effect of L-type calcium channel antagonists on depolarization-evoked calcium transients of the lobular appendages detected with OG5. Calcium rises induced by a 250 msec depolarizing pulse were largely blocked by 10 μm nitrendipine.
Discussion
In the present study, we have identified and localized the VDCCs present in AII amacrine cells. Our results indicate that AII amacrine cells possess a single type of VDCC mainly localized to the lobular appendages, in which chemical synaptic transmission takes place. The pharmacological profile of AII calcium currents, their slow inactivation kinetics, their localization to the lobular appendages, and the consistent expression of CaV1.3α1 mRNA all point to the α1-D subunit of the L-type calcium channel as mediating neurotransmitter release.
Classically described L-type calcium channels are activated from a holding potential of -60 mV, their activation threshold ranges between -40 and -30 mV, and their peak amplitude is reached around -10 mV (Nowycky et al., 1985; Fox et al., 1987). The calcium current described here, however, displayed a more negative activation threshold. A similar difference has been described in other retinal cell types: monkey and tree shrew cone photoreceptors (Yagi and Macleish, 1994; Taylor and Morgans, 1998), goldfish Mb1 bipolar cells (Heidelberger and Matthews, 1992), rat and mouse RB cells (Protti and Llano, 1998; Satoh et al., 1998; Pan, 2000). Similar differences in activation threshold properties have also been described in other CNS neurons such as hippocampal cells (Kavalali and Plummer, 1994; Avery and Johnston, 1996) and rat cerebellar granule cells (Forti and Pietrobon, 1993), among others. Recent studies have demonstrated that the neuronal calcium channel type CaV1.3α1, also known as α1-D, activates at approximately -55 mV and peaks at around -30 mV. This represents a difference of -25 mV with respect to another neuronal L-type VDCC clone (CaV1.2α1) (Xu and Lipscombe, 2001). The exclusive expression of the α1-D subunit detected by single-cell RT-PCR in AII cells is in full agreement with the more negative activation threshold values observed in Ca2+ currents in AII cells.
The pharmacological profile of AII calcium currents also supports the idea that these cells express L-type VDCCs. Calcium current amplitude in AII cells was doubled in the presence of the L-type calcium channel agonist BayK 8644 and reduced by 80% on application of DHP antagonists. The incomplete block of AII calcium currents by DHP antagonists also corroborates our observation that these cells contain mRNA encoding the α1-D subunit. This channel type displays a lower sensitivity to DHPs (IC50 = 2.7 μm), when compared to another neuronal L-type calcium channel, CaV1.2α1, with IC50 = 139 nm (Xu and Lipscombe, 2001). Thus, 10 μm of DHP antagonists would not be expected to completely block calcium currents in AII cells. Additionally, DHP blockers did not alter the inactivation kinetics of the remaining current, suggesting that the incompleteness of the blockade most probably reflects the characteristic pharmacology of the α1-D subunit rather than a current carried by other calcium channel types. This was further supported by the lack of blocking effect of both ω-Conotoxin and ω-Agatoxin IVA. The small changes observed after incubation with these toxins were due to run down of the currents with no change in kinetics of the remaining current, as would be expected if different channel types with distinct inactivation constants contribute to the total current. Similar to our observations, cone photoreceptors of the tree shrew possess calcium currents with low DHP sensitivity and a strong immunoreactivity against α1-D in the cone pedicles (Taylor and Morgans, 1998; Morgans, 1999).
Depolarization-induced changes in the intracellular calcium concentration were observed mainly in the lobular appendages. It is noteworthy to remark that local application of glutamate to AII amacrine cells in the presence of calcium channel blockers elicits inward currents accompanied by calcium rises (Habermann et al., 2001). These changes in fluorescence detected with both OG5 and CG1 are much larger in the arboreal dendrites, in which AII cells receive glutamatergic input from RB cells, than in the lobular appendages. This indicates that the dye concentration in the distant dendritic processes can reliably detect large changes in calcium and implies that the observed differences of the changes in intracellular calcium on depolarization reflect a differential distribution of VDCCs in these two dendritic compartments. The enhancing effect of BayK 8644 and the blocking action of DHP antagonists on Ca2+ rises in the lobular appendages confirm the presence of L-type calcium channels in these dendritic structures. Because these changes were concomitant with calcium currents, they are interpreted as calcium influx via L-type calcium channels. Furthermore, the full blockade exerted by the antagonists rules out the presence of other calcium channel types, at least in the lobular appendages.
As mentioned earlier, L-type calcium channels seem to be commonly used by graded neurons, which possess synaptic ribbons, at early stages of sensory processing. Amacrine cells are a very diverse class of third order retinal interneuron. They differ in their morphology, function, light responses, and in the neurotransmitters that they release (for review, see Wässle and Boycott, 1991). Some amacrine cell types respond to light with action potentials in a transient manner whereas other types respond in a more sustained manner (Werblin and Dowling, 1969; Bloomfield, 1996). Are L-type VDCCs a common feature of all amacrine cells? Spiking dopaminergic amacrine cells of the rat retina also display slowly inactivating Ca2+ currents (Feigenspan et al., 1998). GABAergic amacrine cells of the rat retina, in contrast, possess more rapidly inactivating calcium currents consisting of L-, N-, and R-type components (Koizumi et al., 2001). Transmitter release in cultured chicken retinal amacrine cells is mediated by slowly inactivating VDCCs with low DHP sensitivity (Gleason et al., 1994). The activation threshold of this calcium current, however, does not display a more negative activation threshold as observed in AII cells. Therefore, it cannot be ruled out that transmitter release in other amacrine cell types occurs via other VDCC types.
Implications for signal processing
It is well established that retinal neurons involved in the rod pathway are capable of responding in a graded manner. Synaptic input to AII amacrine cells mostly originates from RB cells, which release neurotransmitter via L-type VDCCs (Protti and Llano, 1998; Satoh et al., 1998; Pan, 2000). However, a role for T-type VDCCs in signal transfer from RB cells has recently also been demonstrated (Pan et al., 2001). If sustained signals pass from RB cells to AII amacrine cells, how will they be further transferred to the ON and OFF channels generated by AII cells? ON signals flow via gap junctions to ON-CB cells. Therefore, the prolonged time course of the synaptic input can be considered to be conserved. Although the amplitude may be reduced depending on the strength of the electrical coupling, the time course should not be greatly affected (Naka and Christensen, 1981; Vardi and Smith, 1996; Veruki and Hartveit, 2002). The presence of L-type VDCCs in the chemical synapses of the lobular appendages of AII amacrine cells ensures that calcium levels may be high for long periods of time if required to transmit a sustained signal. Interestingly, OFF-CB cells postsynaptic to AII cells express the α1 subunits of the glycine receptors (Sassoe-Pognetto et al., 1994), which show little desensitization (Legendre, 2001) and which are, therefore, adequate to follow the time course of sustained transmitter release. Indeed, OFF-CB cells in scotopic conditions respond to light in a sustained manner (Berntson and Taylor, 2000).
Additionally, the close proximity of the activation threshold of AII calcium currents to their resting potential, together with their slow inactivation kinetics, suggests that Ca2+ influx through L-type calcium currents may contribute to the sustained component of the light-evoked responses. Interestingly, the threshold of voltage-dependent Na+ currents in AII amacrine cells is also shifted to more negative values (Boos et al., 1993), suggesting that the operational range of AII cells might be displaced to negative potentials.
In summary, AII amacrine cells, capable of spiking, which contain no ribbons in their terminal structure, express a slowly inactivating L-type calcium channel. This VDCC type seems to be highly conserved at early stages of the scotopic pathway to be able to transmit sustained signals at relatively hyperpolarized membrane potentials.
Footnotes
We thank Dr. Krishna Ghosh for critical reading of this manuscript. We also thank Drs. Bertrand Lambolez and Bruno Cauli for generous assistance with the single-cell RT-PCR.
Correspondence should be addressed to Dr. Dario A. Protti, Department of Physiology, Anderson Stuart Building (F13), University of Sydney, New South Wales 2006, Australia. E-mail: dariop@physiol.usyd.edu.au.
C. J. Habermann's present address: Max Planck Institute for Medical Research, Jahnstrasse 29, D-69120 Heidelberg, Germany.
Copyright © 2003 Society for Neuroscience 0270-6474/03/236904-10$15.00/0
References
- Ahlijanian MK, Westenbroek RE, Catterall WA ( 1990) Subunit structure and localization of dihydropyridine-sensitive calcium channels in mammalian brain, spinal cord, and retina. Neuron 4: 819-832. [DOI] [PubMed] [Google Scholar]
- Avery RB, Johnston D ( 1996) Multiple channel types contribute to the low-voltage-activated calcium current in hippocampal CA3 pyramidal neurons. J Neurosci 16: 5567-5582. [DOI] [PMC free article] [PubMed] [Google Scholar]
- Baylor DA, Nunn BJ, Schnapf JL ( 1984) The photocurrent, noise and spectral sensitivity of rods of the monkey Macaca fascicularis. J Physiol (Lond) 357: 575-607. [DOI] [PMC free article] [PubMed] [Google Scholar]
- Berntson A, Taylor WR ( 2000) Response characteristics and receptive field widths of on-bipolar cells in the mouse retina. J Physiol (Lond) 524: 879-889. [DOI] [PMC free article] [PubMed] [Google Scholar]
- Bloomfield SA ( 1996) Effect of spike blockade on the receptive-field size of amacrine and ganglion cells in the rabbit retina. J Neurophysiol 75: 1878-1893. [DOI] [PubMed] [Google Scholar]
- Bloomfield SA, Xin D ( 2000) Surround inhibition of mammalian AII amacrine cells is generated in the proximal retina. J Physiol (Lond) 523: 771-783. [DOI] [PMC free article] [PubMed] [Google Scholar]
- Boos R, Schneider H, Wässle H ( 1993) Voltage- and transmitter-gated currents of AII-amacrine cells in a slice preparation of the rat retina. J Neurosci 13: 2874-2888. [DOI] [PMC free article] [PubMed] [Google Scholar]
- Dacheux RF, Raviola E ( 1986) The rod pathway in the rabbit retina: a depolarizing bipolar and amacrine cell. J Neurosci 6: 331-345. [DOI] [PMC free article] [PubMed] [Google Scholar]
- Ertel EA, Campbell KP, Harpold MM, Hofmann F, Mori Y, Perez-Reyes E, Schwartz A, Snutch TP, Tanabe T, Birnbaumer L, Tsien RW, Catterall WA ( 2000) Nomenclature of voltage-gated calcium channels. Neuron 25: 533-535. [DOI] [PubMed] [Google Scholar]
- Euler T, Masland RH ( 2000) Light-evoked responses of bipolar cells in a mammalian retina. J Neurophysiol 83: 1817-1829. [DOI] [PubMed] [Google Scholar]
- Famiglietti EVJ, Kolb H ( 1975) A bistratified amacrine cell and synaptic circuitry in the inner plexiform layer of the retina. Brain Res 84: 293-300. [DOI] [PubMed] [Google Scholar]
- Feigenspan A, Gustincich S, Bean BP, Raviola E ( 1998) Spontaneous activity of solitary dopaminergic cells of the retina. J Neurosci 18: 6776-6789. [DOI] [PMC free article] [PubMed] [Google Scholar]
- Forti L, Pietrobon D ( 1993) Functional diversity of L-type calcium channels in rat cerebellar neurons. Neuron 10: 437-450. [DOI] [PubMed] [Google Scholar]
- Fox AP, Nowycky MC, Tsien RW ( 1987) Kinetic and pharmacological properties distinguishing three types of calcium currents in chick sensory neurones. J Physiol (Lond) 394: 149-172. [DOI] [PMC free article] [PubMed] [Google Scholar]
- Frech MJ, Perez-Leon J, Wässle H, Backus KH ( 2001) Characterization of the spontaneous synaptic activity of amacrine cells in the mouse retina. J Neurophysiol 86: 1632-1643. [DOI] [PubMed] [Google Scholar]
- Glasgow E, Kusano K, Chin H, Mczey E, Young III WS, Gainer H ( 1999) Single-cell reverse transcription-polymerase chain reaction analysis of rat supraoptic magnocellular neurons: neuropeptide phenotypes and high voltage-gated calcium channel subtypes. Endocrinology 140: 5391-5401. [DOI] [PubMed] [Google Scholar]
- Gleason E, Borges S, Wilson M ( 1994) Control of transmitter release from retinal amacrine cells by Ca2+ influx and efflux. Neuron 13: 1109-1117. [DOI] [PubMed] [Google Scholar]
- Habermann CJ, Wässle H, Protti DA ( 2001) AII amacrine cells show a distinct distribution of voltage-dependent calcium channels and ionotropic glutamate receptors. ARVO Abstr Invest Ophthalmol Vis Sci 42: S3622. [Google Scholar]
- Heidelberger R, Matthews G ( 1992) Calcium influx and calcium current in single synaptic terminals of goldfish retinal bipolar neurons. J Physiol (Lond) 447: 235-256. [DOI] [PMC free article] [PubMed] [Google Scholar]
- Hillman D, Chen S, Aung TT, Cherksey B, Sugimori M, Llinas RR ( 1991) Localization of P-type calcium channels in the central nervous system. Proc Natl Acad Sci USA 88: 7076-7080. [DOI] [PMC free article] [PubMed] [Google Scholar]
- Horikawa K, Armstrong WE ( 1988) A versatile means of intracellular labeling: injection of biocytin and its detection with avidin conjugates. J Neurosci Methods 25: 1-11. [DOI] [PubMed] [Google Scholar]
- Juusola M, French AS, Uusitalo RO, Weckstrom M ( 1996) Information processing by graded-potential transmission through tonically active synapses. Trends Neurosci 19: 292-297. [DOI] [PubMed] [Google Scholar]
- Kavalali ET, Plummer MR ( 1994) Selective potentiation of a novel calcium channel in rat hippocampal neurones. J Physiol (Lond) 480: 475-484. [DOI] [PMC free article] [PubMed] [Google Scholar]
- Koizumi A, Watanabe SI, Kaneko A ( 2001) Persistent Na+ current and Ca2+ current boost graded depolarization of rat retinal amacrine cells in culture. J Neurophysiol 86: 1006-1016. [DOI] [PubMed] [Google Scholar]
- Legendre P ( 2001) The glycinergic inhibitory synapse. Cell Mol Life Sci 58: 760-793. [DOI] [PMC free article] [PubMed] [Google Scholar]
- Liljelund P, Netzeband JG, Gruol DL ( 2000) L-type calcium channels mediate calcium oscillations in early postnatal Purkinje neurons. J Neurosci 20: 7394-7403. [DOI] [PMC free article] [PubMed] [Google Scholar]
- Llinas R, Sugimori M, Lin JW, Cherksey B ( 1989) Blocking and isolation of a calcium channel from neurons in mammals and cephalopods utilizing a toxin fraction (FTX) from funnel-web spider poison. Proc Natl Acad Sci USA 86: 1689-1693. [DOI] [PMC free article] [PubMed] [Google Scholar]
- McCleskey EW ( 1994) Calcium channels: cellular roles and molecular mechanisms. Curr Opin Neurobiol 4: 304-312. [DOI] [PubMed] [Google Scholar]
- McDonough SI, Bean BP ( 1998) Mibefradil inhibition of T-type calcium channels in cerebellar purkinje neurons. Mol Pharmacol 54: 1080-1087. [DOI] [PubMed] [Google Scholar]
- Mills SL, Massey SC ( 1995) Differential properties of two gap junctional pathways made by AII amacrine cells. Nature 377: 734-737. [DOI] [PubMed] [Google Scholar]
- Morgans CW ( 1999) Calcium channel heterogeneity among cone photoreceptors in the tree shrew retina. Eur J Neurosci 11: 2989-2993. [DOI] [PubMed] [Google Scholar]
- Müller F, Wässle H, Voigt T ( 1988) Pharmacological modulation of the rod pathway in the cat retina. J Neurophysiol 59: 1657-1672. [DOI] [PubMed] [Google Scholar]
- Müller JF, Dacheux RF ( 1997) α Ganglion cells of the rabbit retina lose antagonistic surround responses under dark adaptation. Vis Neurosci 14: 395-401. [DOI] [PubMed] [Google Scholar]
- Naka KI, Christensen BN ( 1981) Direct electrical connections between transient amacrine cells in the catfish retina. Science 214: 462-464. [DOI] [PubMed] [Google Scholar]
- Nowycky MC, Fox AP, Tsien RW ( 1985) Three types of neuronal calcium channel with different calcium agonist sensitivity. Nature 316: 440-443. [DOI] [PubMed] [Google Scholar]
- Pan ZH ( 2000) Differential expression of high- and two types of low-voltage-activated calcium currents in rod and cone bipolar cells of the rat retina. J Neurophysiol 83: 513-527. [DOI] [PubMed] [Google Scholar]
- Pan ZH, Hu HJ, Perring P, Andrade R ( 2001) T-type Ca2+ channels mediate neurotransmitter release in retinal bipolar cells. Neuron 32: 89-98. [DOI] [PubMed] [Google Scholar]
- Protti DA, Gerschenfeld HM, Llano I ( 1997) GABAergic and glycinergic IPSCs in ganglion cells of rat retinal slices. J Neurosci 17: 6075-6085. [DOI] [PMC free article] [PubMed] [Google Scholar]
- Protti DA, Llano I ( 1998) Calcium currents and calcium signaling in rod bipolar cells of rat retinal slices. J Neurosci 18: 3715-3724. [DOI] [PMC free article] [PubMed] [Google Scholar]
- Randall A, Tsien RW ( 1995) Pharmacological dissection of multiple types of Ca2+ channel currents in rat cerebellar granule neurons. J Neurosci 15: 2995-3012. [DOI] [PMC free article] [PubMed] [Google Scholar]
- Rao-Mirotznik R, Harkins AB, Buchsbaum G, Sterling P ( 1995) Mammalian rod terminal: architecture of a binary synapse. Neuron 14: 561-569. [DOI] [PubMed] [Google Scholar]
- Regan LJ ( 1991) Voltage-dependent calcium currents in Purkinje cells from rat cerebellar vermis. J Neurosci 11: 2259-2269. [DOI] [PMC free article] [PubMed] [Google Scholar]
- Sassoe-Pognetto M, Wässle H, Grünert U ( 1994) Glycinergic synapses in the rod pathway of the rat retina: cone bipolar cells express the α1 subunit of the glycine receptor. J Neurosci 14: 5131-5146. [DOI] [PMC free article] [PubMed] [Google Scholar]
- Satoh H, Aoki K, Watanabe SI, Kaneko A ( 1998) L-type calcium channels in the axon terminal of mouse bipolar cells. NeuroReport 9: 2161-2165. [DOI] [PubMed] [Google Scholar]
- Schneeweis DM, Schnapf JL ( 1995) Photovoltage of rods and cones in the macaque retina. Science 268: 1053-1056. [DOI] [PubMed] [Google Scholar]
- Smith RG, Vardi N ( 1995) Simulation of the AII amacrine cell of mammalian retina: functional consequences of electrical coupling and regenerative membrane properties. Vis Neurosci 12: 851-860. [DOI] [PubMed] [Google Scholar]
- Strettoi E, Raviola E, Dacheux RF ( 1992) Synaptic connections of the narrow-field, bistratified rod amacrine cell (AII) in the rabbit retina. J Comp Neurol 325: 152-168. [DOI] [PubMed] [Google Scholar]
- Taylor WR, Morgans C ( 1998) Localization and properties of voltage-gated calcium channels in cone photoreceptors of Tupaia belangeri. Vis Neurosci 15: 541-552. [DOI] [PubMed] [Google Scholar]
- Tian N, Hwang TN, Copenhagen DR ( 1998) Analysis of excitatory and inhibitory spontaneous synaptic activity in mouse retinal ganglion cells. J Neurophysiol 80: 1327-1340. [DOI] [PubMed] [Google Scholar]
- Usowicz MM, Sugimori M, Cherksey B, Llinas R ( 1992) P-type calcium channels in the somata and dendrites of adult cerebellar Purkinje cells. Neuron 9: 1185-1199. [DOI] [PubMed] [Google Scholar]
- Vaney DI ( 1991) Many diverse types of retinal neurons show tracer coupling when injected with biocytin or Neurobiotin. Neurosci Lett 125: 187-190. [DOI] [PubMed] [Google Scholar]
- Vardi N, Smith RG ( 1996) The AII amacrine network: coupling can increase correlated activity. Vision Res 36: 3743-3757. [DOI] [PubMed] [Google Scholar]
- Veruki ML, Hartveit E ( 2002) AII (Rod) amacrine cells form a network of electrically coupled interneurons in the mammalian retina. Neuron 33: 935-946. [DOI] [PubMed] [Google Scholar]
- von Gersdorff H ( 2001) Synaptic ribbons: versatile signal transducers. Neuron 29: 7-10. [DOI] [PubMed] [Google Scholar]
- von Gersdorff H, Matthews G ( 1996) Calcium-dependent inactivation of calcium current in synaptic terminals of retinal bipolar neurons. J Neurosci 16: 115-122. [DOI] [PMC free article] [PubMed] [Google Scholar]
- Wässle H, Boycott BB ( 1991) Functional architecture of the mammalian retina. Physiol Rev 71: 447-480. [DOI] [PubMed] [Google Scholar]
- Werblin FS, Dowling JE ( 1969) Organization of the retina of the mud-puppy, Necturus maculosus. II. Intracellular recording. J Neurophysiol 32: 339-355. [DOI] [PubMed] [Google Scholar]
- Westenbroek RE, Hell JW, Warner C, Dubel SJ, Snutch TP, Catterall WA ( 1992) Biochemical properties and subcellular distribution of an N-type calcium channel α1 subunit. Neuron 9: 1099-1115. [DOI] [PubMed] [Google Scholar]
- Wu LG, Saggau P ( 1997) Presynaptic inhibition of elicited neurotransmitter release. Trends Neurosci 20: 204-212. [DOI] [PubMed] [Google Scholar]
- Xu W, Lipscombe D ( 2001) Neuronal CaV1.3α1 L-type channels activate at relatively hyperpolarized membrane potentials and are incompletely inhibited by dihydropyridines. J Neurosci 21: 5944-5951. [DOI] [PMC free article] [PubMed] [Google Scholar]
- Yagi T, Macleish PR ( 1994) Ionic conductances of monkey solitary cone inner segments. J Neurophysiol 71: 656-665. [DOI] [PubMed] [Google Scholar]
- Zhang JF, Randall AD, Ellinor PT, Horne WA, Sather WA, Tanabe T, Schwarz TL, Tsien RW ( 1993) Distinctive pharmacology and kinetics of cloned neuronal Ca2+ channels and their possible counterparts in mammalian CNS neurons. Neuropharmacology 32: 1075-1088. [DOI] [PubMed] [Google Scholar]