

Abstract
We examined whether coupling between neighboringα-type ganglion cells (α-GCs) in the rabbit retina underlies their synchronous spike activity. Simultaneous recordings were made from arrays of α-GCs to determine the synchrony of both spontaneous and light-evoked spike activity. One cell within each array was then injected with the biotinylated tracer Neurobiotin to determine which of the cells were coupled via gap junctions. Cross-correlation analyses indicated that neighboring off-center α-GCs maintain short-latency (∼2.5 msec) synchronous spiking, whereas the spontaneous spike activities of on-centerα-GC neighbors are not correlated. Without exception, those off-centerα-GCs showing synchronous spiking were found to be tracer coupled to both amacrine cells and neighboring off-centerα-GCs. In contrast, on-center α-GCs were never tracer coupled. Furthermore, whereas spikes initiated in an off-center α-GC with extrinsic current injection resulted in short-latency synchronized spiking in neighboring off-center α-GCs, this was never seen between on-center α-GCs. These results indicate that electrical coupling via gap junctions underlies the short-latency concerted spike activity of neighboring α-GCs.
Keywords: retina, gap junctions, spike synchrony, ganglion cells, electrophysiology, coupling
Introduction
As the output neurons of the retina, ganglion cell responses represent the final, integrated visual signals conveyed to higher brain centers. Much of our knowledge of ganglion cell physiology stems from single-unit recordings in which the light-evoked activity of individual neurons are analyzed sequentially. Following this strategy, investigators have described over 10 physiological classes of ganglion cell, including those displaying simple, concentric center-surround receptive fields or complex trigger features such as direction and orientation selectivity (Kuffler, 1953; Barlow et al., 1964; Levick, 1967; Caldwell and Daw, 1978).
More recently, multielectrode recordings have been used to study the distributed activity among ganglion cell arrays. Neighboring ganglion cells in a number of species show concerted firing patterns in both their spontaneous and light-evoked discharges (Arnett and Spraker, 1981; Mastronarde, 1983a,b,c, 1989; Meister et al., 1995; Brivanlou et al., 1998; DeVries, 1999). This concerted spike activity ranges from a relatively loose synchrony, reflected in broad cross-correlograms spanning tens of milliseconds, to narrowly synchronized spiking with latencies of <3 msec. The findings that concerted firing may account for up to one-half of all of the retinal spike activity, coupled with the high temporal precision in which retinal signals are conveyed to central targets, suggest that synchronous spikes play an important role in encoding visual information (Castelo-Branco et al., 1998; Rager and Singer, 1998; Schnitzer and Meister, 2003).
Synchronous spiking can arise from a number of synaptic circuits, including common excitatory or inhibitory inputs to neighboring cells. Mastronarde (1983c) first described synchronous activity between neighboring Y-type ganglion cells [the physiological substrate of α-type ganglion cells (α-GCs)], showing that an antidromically evoked spike in one cell leads to the generation of a spike in a neighboring Y-cell with a latency of 0.5-1.0 msec. Antidromic activation precluded common synaptic inputs as the cause of the spike synchrony, whereas the relatively short latency argued against the involvement of chemical synaptic transmission. Mastronarde thus reasoned that short-latency concerted firing must reflect direct electrical coupling between neighboring cells. Nearly 10 years later, Vaney (1991) showed that α-GCs are tracer coupled to one another and to amacrine cells, thus providing the substrate for electrical coupling. Interestingly, Brivanlou et al. (1998) reported that short-latency synchrony between neighboring ganglion cells in salamander retina survived the presence of cadmium chloride, presumed to block chemical transmission, supporting a role for electrical coupling. However, synchronous activity could not be abolished with gap junction blockers, nor was it established whether the recorded ganglion cells in fact maintained gap junctions.
In this study, we measured the concerted activity of α-GC arrays and subsequently labeled them with the tracer Neurobiotin to determine their coupling patterns. Our results indicate unequivocally that short-latency synchronous spiking generated spontaneously or evoked with light or extrinsic current occurs only in neighboring α-GCs that are tracer coupled. Furthermore, whereas neighboring off-center α-GCs were tracer coupled and showed spike synchrony, on-center α-GCs were never coupled nor displayed short-latency concerted activity. These results indicate a fundamental difference in the electrical coupling and resulting activity of the α-GC subtypes in the mammalian retina.
Materials and Methods
Preparation. The experimental procedures used in this study have been described extensively previously (Hu et al., 2000). Briefly, adult New Zealand White rabbits (Oryctolagus cuniculus) (1.5-2.5 kg body weight) were anesthetized with an intraperitoneal injection of 40% ethyl carbamate (2.0 gm/kg body weight) and a local injection of 2% lidocaine hydrochloride to the eyelids and surrounding tissue. The eye was then removed under dim red illumination and hemisected ∼1 mm posterior to the ora serrata. The vitreous humor was removed with ophthalmic sponges, and the resultant retina eyecup was everted. Four radial cuts, ∼4 mm in length, were made peripherally in the retina eyecup in a Maltese cross-configuration to flatten it before placement in a superfusion chamber. The chamber was then placed in a light-tight Faraday cage and superfused at a flow rate of 20 ml/min with a mammalian Ringer's solution (Bloomfield and Miller, 1982). The superfusate was kept at a constant temperature of 34°C, with oxygenation and pH 7.4 maintained by bubbling with a gaseous mixture of 95% O2-5% CO2. Retinas were maintained in complete darkness for 1 hr before initiation of experimentation. After enucleations, animals were killed with an intracardial injection of ethyl carbamate (5 ml of a 40% solution).
The superfusion chamber was mounted on the stage of an upright light microscope (BX501WI; Olympus Optical, Tokyo, Japan). A 900 nm cutoff filter allowed transmission of infrared (IR) light from below the stage and then up through a condenser and the glass coverslip mounted in the superfusion chamber base. An IR-sensitive CCD camera (VE-1000; Dage-MTI, Michigan City, IN) captured the retinal image that was displayed on a video monitor outside the Faraday cage. Still video frames of neurons in the ganglion cell layer (GCL) were acquired using a video capture card (Snazzi; Dazzle Multimedia, Fremont, CA). A motorized drive operated by foot pedals allowed for fine focal adjustments to be made from outside the cage. On either side of the stage, triple-axis motorized micromanipulators (DC3001R; World Precision Instruments, Sarasota, FL) were operated by controllers (MS314; Märzhäuser, Wetzlar, Germany) from outside the cage. One micromanipulator supported the headstage of an isolated AC differential amplifier (DAM80i; World Precision Instruments) for extracellular recordings. The body of a high acceleration linear piezo stepper (Inchworm motor IW-700; controller ULN 6000; Burleigh Instruments, Fishers, NY) was attached to the other micromanipulator. An adapter fitting on the tip of the Inchworm motor allowed connection to either a second extracellular headstage or to the headstage of a high-impedance amplifier for intracellular recordings (Axoprobe 1A; Axon Instruments, Foster City, CA). Thus, simultaneous dual extracellular and intracellular recordings could be made from neighboring cells. Data were digitized online with an analog-to-digital board (Digidata 1200; Axon Instruments) and stored on a personal computer.
Visualization of α ganglion cells. To visualize cells, superfusion of the retina was temporarily halted, and three to five drops of 0.1% Azure B (dissolved in modified Ames medium with 25 mm sodium bicarbonate without glucose) were placed on the retinal surface. After 60-90 sec, the superfusion was resumed, and the Azure B was suctioned off the retina and discarded. Optimal staining density occurred within 10-15 min, and cells remained visible for the entire duration of the experiment (up to 10 hr).
Intracellular and extracellular recordings. Intracellular recordings were obtained from neurons using microelectrodes fashioned from standard borosilicate glass tubing (outer diameter, 1.2 mm; inner diameter, 0.6 mm). For most studies, electrodes were filled at their tips with 4% N-(2-amino-ethyl)-biotinamide hydrochloride (Neurobiotin) (Vector Laboratories, Burlingame, CA) in 0.1 m Tris buffer, pH 7.6, and then backfilled with 4 m potassium chloride. Final DC resistances of these electrodes ranged from 350 to 450 MΩ. After physiological characterization of a cell, Neurobiotin was injected into the cell, with a combination of sinusoidal (3 Hz; 0.8 nA; peak-to-peak) and DC current (0.4 nA) applied simultaneously; this method allowed for passage of tracer through the microelectrode without polarization.
Extracellular recordings were obtained from neurons using carbon fiber microelectrodes constructed with 10 μm diameter fibers with 25 μm exposure (World Precision Instruments). The compact construction of these electrodes (total length, 40-50 mm) provided maximum stability and could be fitted easily below the water-immersion objectives. After extracellular recordings, neurons were impaled with an intracellular microelectrode and labeled with Neurobiotin for subsequent morphological identification. It should be noted that the carbon electrodes effectively recorded spikes only from relatively large ganglion cells and only when placed directly atop their somata. Thus, there was no ambiguity about the identity of the ganglion cell being recorded.
A green light-emitting diode (λmax, 468 nm) focused onto the retinal surface provided a low scotopic (4.7 Rh* · rod-1 · sec-1), full-field light stimulus to the dark-adapted retina. During recordings of light-evoked spike activity, the frequency of stimulation was 1 Hz with a 0.5 sec duration.
Histology. After a physiological experiment, the retina was fixed immediately in a cold (4°C) fixative solution of 4% paraformaldehyde-0.1% glutaraldehyde in 0.1 m phosphate buffer, pH 7.3, for 12 min. The retina was then detached, trimmed, fixed onto a gelatinized glass coverslip, and left in fixative overnight at 4°C. Retinas were washed for 4-5 hr in 10 mm sodium PBS (9% saline; pH 7.6) and then reacted with the Elite ABC kit (Vector Laboratories) and 1% Triton X-100 (Sigma, St. Louis, MO) in PBS overnight at 4°C. Retinas were processed for peroxidase histochemistry using 3-3′diaminobenzidine (DAB) with cobalt intensification, and then dehydrated, cleared, and flat-mounted in Permount (Fisher Scientific, Houston, TX).
To determine the level at which dendritic processes stratified in the inner plexiform layer (IPL), we examined Neurobiotin-labeled cells in flat-mount under a 100× objective. The borders of the IPL were determined by the location of amacrine and ganglion cell bodies using Nomarski interference contrast optics. The position of the outer margin of the IPL next to the amacrine cell bodies was defined as 0, whereas the vitreal border of the IPL was defined as 100. The position of cellular processes in the IPL was determined using a precision micrometer and given a value from 0 to 100. Multiple measures were made for a single cell to elucidate any variations in stratification throughout its extent.
Measurements of soma diameters were made using a 100× oilimmersion objective coupled with an eyepiece graticule. An unexpected advantage of using Azure B was that all of the cells maintained a bluish label even after histological processing for Neurobiotin. This allowed us to visualize and measure the soma diameter of both tracer-coupled and uncoupled ganglion cells.
Analysis of spike activity. The spike trains were sorted and timestamped off-line (off-line spike sorter; Plexon, Dallas, TX). The cross-correlation function between two spike trains was computed by histogramming all of the time differences between a spike from one cell and a spike from the other cell (NeuroExplorer; Plexon). Significance was determined by the 99% confidence limits.
For light-evoked spiking, a shift predictor correction procedure (Perkel et al., 1967) separated the features of the cross-correlation functions that are related to neuronal interactions from those resulting from the coactivation of the cells by the light stimulus. The shift predictor was generated in the same manner as a normal cross-correlation function except that one of the spike trains was shifted over one or more stimulus intervals. Here, the shift predictor was created as the arithmetical mean of all of the possible interval shifts. The shift predictor was then subtracted from the original cross-correlation function to generate the shift-predicted function, which included only those correlations independent of the light stimulus.
Results
The data presented here represent 1,166 recordings made from α-GCs of which 120 were injected intracellularly with Neurobiotin and analyzed morphologically. Recordings were made throughout the retina; cell eccentricities ranged from 0.4 to 4.0 mm ventral to the optic disk.
Identification of α ganglion cells
To visually target α-GCs for electrophysiological recordings it was necessary to unequivocally identify them in the superfused rabbit retina eyecup. As reported previously, Azure B was found to stain somata within the GCL of the living retina (Hu et al., 2000). These included a mosaic of cells easily identified by their regular spacing and particularly large somata when viewed under IR illumination (Fig. 1A,C). After histological processing and counterstaining with hematoxylin, it was evident that these cells displayed the very largest cell bodies (Fig. 1B). Although a comparison of Figure 1, A and B, would suggest that Azure B stained only a subset of cells, examination under higher magnification indicated that all of the cell bodies were indeed labeled, but some smaller somata were very lightly stained and were thus invisible in the video micrograph. In preliminary experiments, the largest cells were targeted for intracellular injection with Neurobiotin to determine their soma-dendritic architecture (Fig. 1C). We found the morphological features of these cells consistent with those described for α-GCs in a number of mammalian species, including the rabbit (Boycott and Wässle, 1974; Wässle et al., 1975, 1981; Peichl et al., 1987; Peichl, 1991). These features included a large, ovoid soma that emitted four to six stout, primary dendrites that branched successively in a radiate manner to form a large, circular dendritic field with acutely branched processes that rarely overlapped (Fig. 1D). The dendritic arbors unistratified in either sublamina a or b of the inner plexiform layer (IPL), which was subsequently found to correspond to the off- or on-center receptive fields of the cells, respectively (Famiglietti et al., 1977; Nelson et al., 1978; Peichl and Wässle, 1981; Bloomfield and Miller, 1986). Indicative of a single class of cells, we found a decrease in cell density at higher retinal eccentricities coupled with a dramatic enlargement of both the soma and the dendritic arbor of individual cells. However, despite differences seen in size, the overall dendritic architecture of cells within this class was preserved across the retina.
Figure 1.
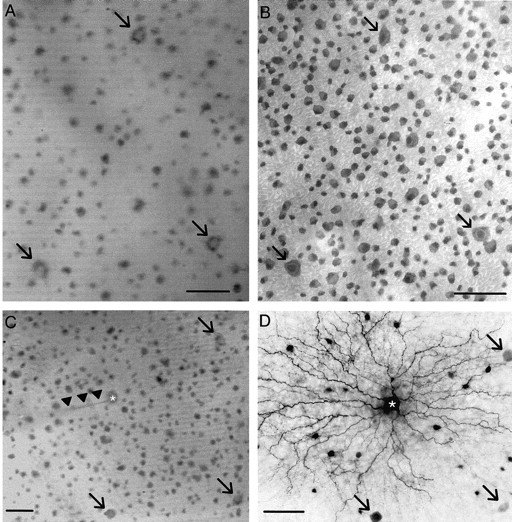
α-GCs are easily identified and targeted for experimentation. A, Digital video image of the flattened retina-scleral preparation taken under infrared illumination during an experiment. Ganglion cells with large somata are easily identified (arrows). Scale bar, 50 μm. B, Flat-mount-view photomicrograph of the same ganglion cells in A (arrows) after histological processing and hematoxylin counterstaining. Scale bar, 50 μm. C, Digital video image of flattened retina-scleral preparation under infrared illumination. A glass intracellular microelectrode (arrowheads) filled with Neurobiotin is shown impaling an off-center α-GC (asterisk). Previously, dual simultaneous extracellular recordings were made from this cell and neighboring off-center α-GCs (arrows). Scale bar, 50 μm. D, Flat-mount-view photomicrograph of the off-centerα-GC injected in C (asterisk) after histological processing for standard peroxidase histochemistry. Off-center α-GC identification was confirmed by morphological criteria. Three of the tracer-coupled α-GCs also correspond to off-center α-GCs shown in C (arrows). Scale bar, 50 μm.
Interestingly, we found that the somata of some α-GCs lay more vitreal than others and were labeled a bit more darkly with Azure B. Although similar in size and shape, the dark and light α-GCs appeared to form regular, but independent, arrays. Subsequent physiological experiments indicated that the more darkly labeled α-GCs showed off-center physiology, whereas the lighter cells were on-center. These findings confirm a previous finding that on- and off-center α-GCs achieve a uniform and independent coverage of the retina (Wässle et al., 1981).
Together, the (1) regular mosaics, (2) distinctly large somatic size, and (3) characteristic dendritic architecture provided strong support for the positive identification of these neurons as α-GCs. The prominence of the α-GC somata in the retinal preparation indicated that they could be easily targeted for physiological studies.
Physiology of α ganglion cells
The α-GCs have been identified as the morphological equivalent of the physiological, brisk-transient Y-cells in the cat retina (Cleland et al., 1975; Peichl and Wässle, 1981; Saito, 1983; Fukuda et al., 1984; Stanford and Sherman, 1984). Extracellularly recorded α-GCs in the rabbit showed transient light-evoked spike activity, consistent with the data from cat (Fig. 2A,B). The α-GCs could be divided into on- and off-center categories on the basis of the transient burst of spike activity at light onset or offset, respectively. Intracellular recordings showed some sustained slow potential components in the responses of both on- and off-center cells, but these were not translated into any sustained spike discharges (Fig. 2C,D). We rarely recorded antagonistic surround-mediated responses from α-GCs because of the fact that retinas were maintained in the dark-adapted state when surround activity is lost (Barlow et al., 1957; Peichl and Wässle, 1983; Muller and Dacheux, 1997).
Figure 2.
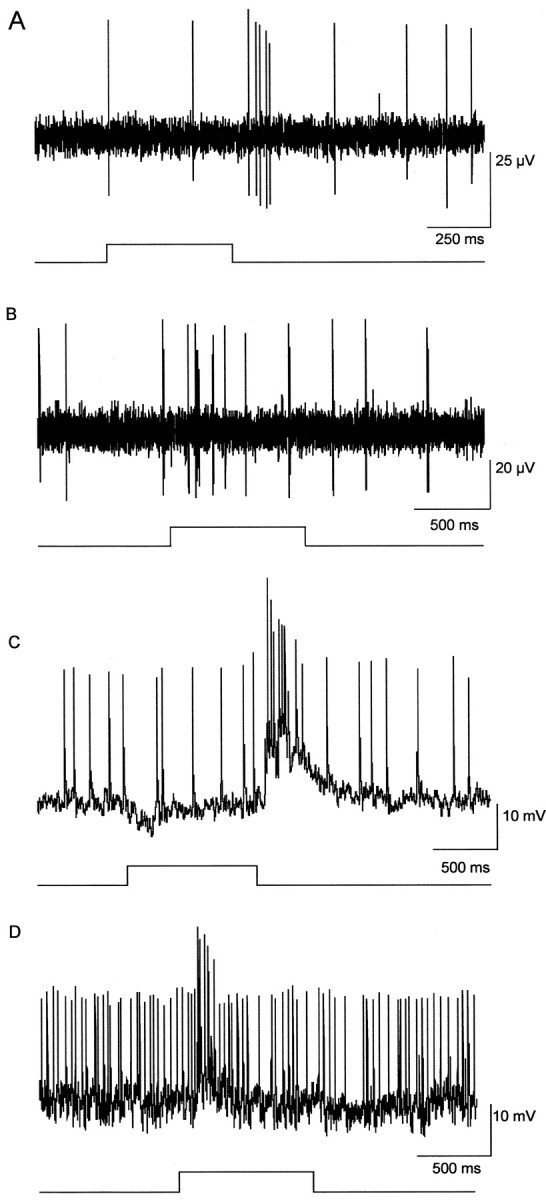
Typical extracellular and intracellular light-evoked responses of α-GCs. A, B, Extracellularly recorded responses of an off-center and on-center α-GC, respectively, to full-field illumination. Brief, transient light-evoked spike activity was observed for both. Light traces at bottom indicate onset and offset of the light stimulus. C, D, Intracellularly recorded off-center and on-center responses to full-field illumination of the same cells as in A and B, respectively. The stimulus was presented at a frequency of 1 Hz and 0.5 sec duration with intensity in the low scotopic range (4.7 Rh* · rod-1 · sec-1). Light traces at bottom indicate onset and offset of the light stimulus.
On- and off-center α-GCs displayed very different patterns of spontaneous spike activity. The spontaneous spikes of on-center α-GCs occurred predominantly as spike doublets with irregular frequency (Fig. 3A). Autocorrelation functions showed that these spike doublets had interspike intervals of 3-5 msec (Fig. 3B). In contrast, spontaneous activity of off-center α-GCs consisted of single spikes spaced at least 10 msec apart (Fig. 3C,D).
Figure 3.

On- and off-center α-GCs have different patterns of spontaneous spike activity. A, Extracellular recording of spontaneous spike activity from an on-center α-GC in the dark-adapted retina. Spike activity occurred predominantly as spike doublets. B, Autocorrelation function of spontaneous spike activity of the on-center α-GC in A. Spike doublets had interspike intervals of 3-5 msec. Dashed lines indicate the 99% confidence limits. C, Extracellular recording of spontaneous spike activity from an off-center α-GC in the dark-adapted retina. Spike activity consisted of single spikes. Amplitude and time calibration in C apply to A as well. D, Autocorrelation function of spontaneous spike activity from the off-center α-GC in C. The minimum interspike interval was at least 10 msec.
Correlated spike activity between neighboring α ganglion cells
The primary objective of this study was to determine whether electrical coupling underlies the synchronous spike activity between neighboring α-GCs. To this end, dual, simultaneous recordings were made from 523 pairs of α-GCs in 62 arrays, after which the central cell within a recorded array was injected with Neurobiotin to determine which cells were tracer coupled.
Cross-correlation analysis of the light-evoked spike activity from neighboring on-center α-GCs typically showed a single peak at time 0 with a width of 40-80 msec (Fig. 4A). In contrast, cross-correlations of the light-evoked activity recorded from pairs of neighboring off-center α-GCs characteristically showed two peaks with a trough at time 0 indicative of reciprocal interactions; the peaks showed latencies of ±2.0-2.5 msec (Fig. 4B). These peaks were superimposed on the same broad peak seen for on-center α-GCs. As expected, the light-evoked activity of neighboring on- and off-center α-GCs was negatively correlated.
Figure 4.

Cross-correlation functions of the light-evoked spike activity of on- and off-center α-GCs. A, Cross-correlation function of the light-evoked spike activity for a pair of neighboring on-center α-GCs. Correlations were relatively broad (40 msec) and unimodal. Dashed lines indicate the 99% confidence limits. B, Cross-correlation function of light-evoked spike activity for a pair of neighboring off-center α-GCs. Correlations showed two peaks with a trough at time 0 riding atop a broad profile. Latencies of the two peaks were ∼2.0 msec. C, D, Shift prediction analysis of cross-correlation functions in A and B, respectively, revealed that correlations for on-center α-GC pairs were synchronized to the light stimulus. However, twin peaks in function for off-center α-GC pairs remain above the 99% confidence interval, indicating that this synchrony is independent of the light stimulus. Data plotted are the difference between the original cross-correlations and the shift predictor analysis. Solid lines indicate the 99% confidence limits.
It is plausible that the concerted spiking seen for α-GC neighbors arises independently, the result of the activity of each cell being synchronized to the common light stimulus. To eliminate this possible mechanism, we performed a shift prediction analysis on the light-evoked spike trains of neighboring α-GCs (Perkel et al., 1967). After this analysis, the robust unimodal distribution for on-center cells remained but now fell below the 99% confidence level, thus indicating that the synchrony was linked to the light stimulus, consistent with common excitatory synaptic activation via bipolar cells. In contrast, the bimodal distribution for off-center cells remained the only components above the 99% confidence interval, indicating that these correlations reflected synchrony independent of the light stimulus (Fig. 4C,D).
A more striking difference was found between the cross-correlation functions of the spontaneous spike activities of on- and off-center α-GC pairs maintained in complete darkness. The spontaneous activity of neighboring on-center α-GC pairs showed no correlated spike activity (Fig. 5A-C). In contrast, the spontaneous activity of the neighboring off-center α-GC pair showed the same bimodal cross-correlation distribution seen for light-evoked activity, consisting of a trough at 0 msec and peaks with latencies of ±2-2.5 msec (Fig. 5D-F). No correlations were found between the spontaneous activities of on- and off-center α-GCs.
Figure 5.

Off-center, but not on-center, α-GCs exhibit short-latency correlations of spontaneous spike activity. A-C, Cross-correlation function of the spontaneous spike activity for a pair of neighboring on-center α-GCs. B and C are expanded time scales of A. No correlated activity was observed for neighboring on-center α-GCs. Dashed lines indicate the 99% confidence limits. D-F, Cross-correlation function of spontaneous spike activity for a pair of neighboring off-center α-GCs. B and C are expanded time scales of D. Short latency (2.5 msec) bimodal correlations were observed for neighboring off-center α-GCs.
Tracer-coupling patterns
After physiological recordings, 120 individual α-GCs were injected with Neurobiotin to determine their tracer-coupling patterns. We found that the coupling for on- and off-center α-GCs differed dramatically. The tracer-coupling pattern of off-center α-GCs typically showed an extensive array of over 100 small somata lying within both the GCL and proximal inner nuclear layer and a local ring of three to eight ganglion cells with large somata similar in size to that of the injected α-GC (Fig. 6A). The number of coupled ganglion cells in the local ring decreased with eccentricity because of the decrease in overall α-GC density. Previous studies have shown that the small cell bodies belong to at least two classes of amacrine cells, including one with long-range dendritic arbors extending beyond 1 mm (Vaney, 1991, 1994; Dacey and Brace, 1992; Penn et al., 1994; Xin and Bloomfield, 1997).
Figure 6.
Tracer-coupling patterns of off- and on-center α-GCs are different. A, Neurobiotin-injected off-center α-GC (asterisk) shows homologous coupling to a local ring of five α-GCs as well as heterologous coupling to a field of >100 amacrine cells. Identification as off-center α-GC was confirmed by transient off-center response to full-field illumination and stratification of dendritic processes in sublamina a of the IPL. Scale bar, 100 μm. B, Neurobiotin-injected on-center α-GC (asterisk) shows no evidence of tracer coupling. Identification as on-center α-GC was confirmed by transient on-center response to full-field illumination and stratification of dendritic processes in sublamina b of the IPL. Scale bar, 100 μm. C, Neurobiotin-injected on- and off-center α-GCs in the same dark-adapted retina. On the left, an off-center α-GC displays the typical tracer coupling to both α-GCs and amacrine cells. On the right, an on-center α-GC shows no evidence of tracer coupling. Scale bar, 250 μm.
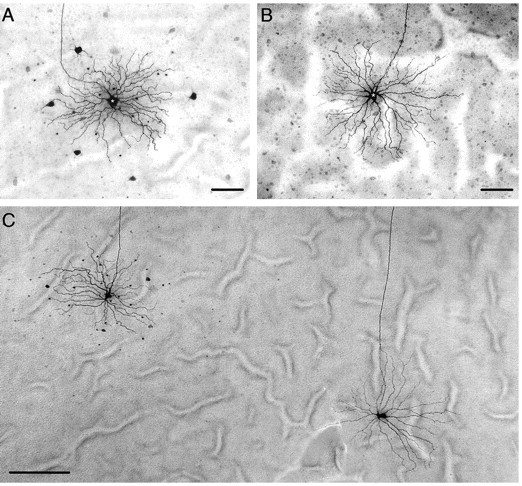
Unfortunately, Neurobiotin usually failed to label the dendritic arbor of coupled ganglion cells, and so it was not possible to unequivocally identify these coupled neurons as α-GCs. However, several pieces of evidence indicate that α-GCs are indeed coupled to neighboring α-GCs. First, both the injected and tracer-coupled ganglion cells formed a regularly spaced array indicative of cells within a single morphological class. Second, like the injected α-GC, the somata of the tracer-coupled ganglion cells were larger than those of any neighboring cells in the GCL (Fig. 7A). Third, the soma sizes of the tracer-coupled ganglion cells, which were generated from injections made within 0.4-4.0 mm of the visual streak, all fell within the range previously described for α-GCs in the rabbit retina (Peichl et al., 1987) (Fig. 7B). Finally, on occasion, the proximal dendrites of a tracer-coupled ganglion cell could be visualized and displayed a radiate branching pattern consistent with that of an α-GC. Our conclusion that α-GCs in rabbit retina are coupled homologously to each other is consistent with tracer-coupling patterns established for α-GCs in a number of mammalian retinas (Vaney, 1991; Dacey and Brace, 1992, Penn et al., 1994; Xin and Bloomfield, 1997)
Figure 7.
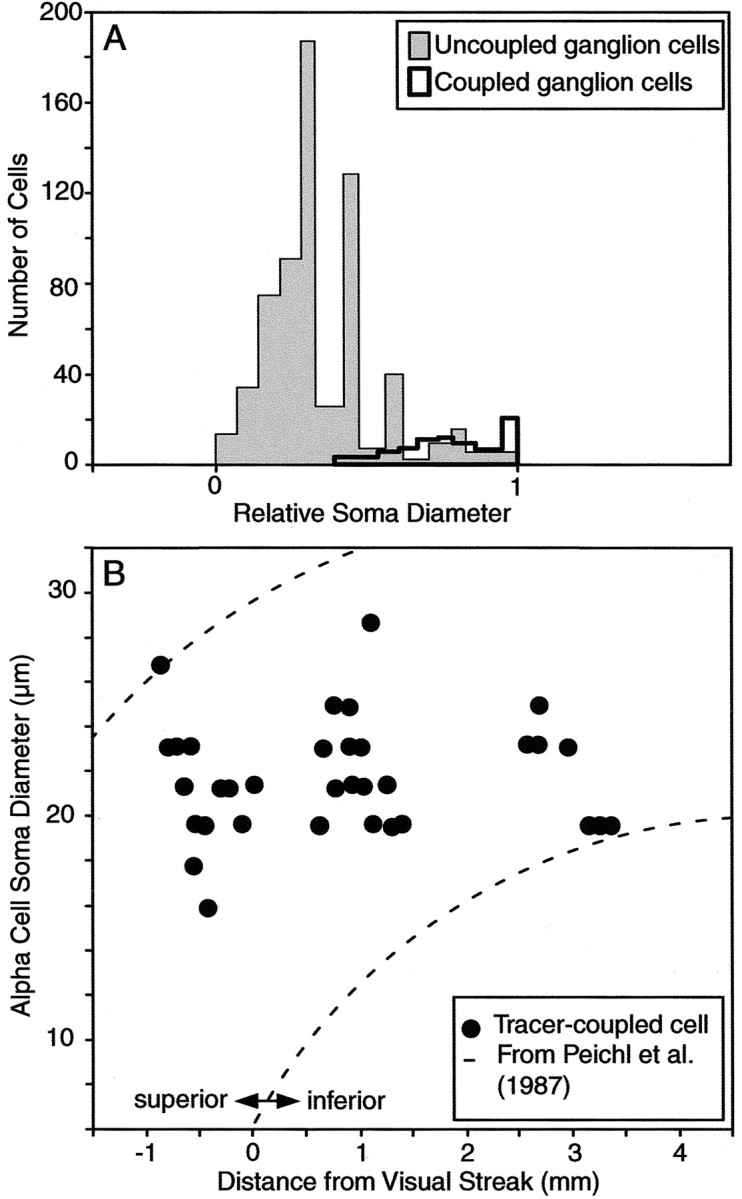
Analysis of tracer-coupled ganglion cell soma sizes suggests α-GC identity. A, Histogram shows relative soma diameters of coupled and uncoupled ganglion cells in experiments in which single α-GCs (n = 5) were injected with Neurobiotin; all of the data are referenced to the largest labeled ganglion cell (i.e., 1.0) for each injection. B, Scatter plot comparing the soma diameters and eccentricity of labeled α-GCs after injections of Neurobiotin into single α-GCs. Dashed lines indicate range of soma diameter-eccentricity parameter for α-GCs in rabbit retina as reported by Peichl et al. (1987).
In striking contrast, on-center α-GCs never showed evidence of tracer coupling after injection of a single cell with Neurobiotin (Fig. 6B). Despite the clear difference in coupling pattern, the completeness and intensity of Neurobiotin labeling was identical for on- and off-center α-GCs. Furthermore, the different coupling patterns were found even for on- and off-center α-GCs labeled in the same retina under identical dark-adapted conditions (Fig. 6C). Thus, the different tracer-coupling patterns of on- and off-center α-GCs could not be explained by differences in the adaptational state of the retina nor any technical problems related to Neurobiotin labeling.
Synchronous spike activity correlates to tracer coupling of α ganglion cells
The data described above clearly indicate a general correlation between coupling and spike synchrony across the α-GC population: off-center α-GCs show short-latency spike correlations and tracer coupling, whereas on-center cells show uncorrelated spontaneous spiking and are uncoupled. To study this correlation further, we determined whether spike synchrony between pairs of off-center α-GCs occurred only for those that were tracer coupled.
In these experiments, recordings were made continuously from a central reference off-center α-GC while a second electrode was moved systematically to record the activity of other offcenter α-GCs in the array. This resulted in a series of simultaneous, dual recordings from a local array of α-GCs, all referenced to a particular cell. The reference α-GC was then injected with Neurobiotin to determine which of the α-GCs in the array were tracer coupled to it. Figure 8A shows an array of off-center α-GCs in which the reference cell (cell 1) was injected with Neurobiotin after physiological recordings. Dual extracellular recordings of the spontaneous spike activity were made between cell 1 and four nearby off-center α-GCs (cells 2-5). The cross-correlation functions were subsequently generated for each cell pair (Fig. 8B). The darkly tracer-coupled cells 2 and 3 showed spike activity that was highly synchronized to that of the reference cell (cell 1) as indicated by the short-latency (±2.5 msec) bimodal peaks in the cross-correlation functions (Fig. 8B). Cells 4 and 5 were not tracer coupled to cell 1, nor did they show any correlated spontaneous spike activity with cell 1.
Figure 8.

Correlated spike activity occurs exclusively between tracer-coupled off-center α-GCs. A, Photomicrograph of off-center α-GCs from which dual extracellular recordings of spontaneous activity were made. Paired recordings included a reference cell (1) and one of four nearby cells (2-5). Cell 1 was injected with Neurobiotin at the end of the experiment to produce the labeling shown. Scale bar, 100 μm. B, Cross-correlation functions of spontaneous spike activity between cell 1 and four (cells 2-5) neighboring off-center α-GCs from A. Darkly tracer-coupled cells 2 and 3 show significant correlated activity with cell 1. Second-tier neighbors, cells 4 and 5, showed neither tracer coupling nor any correlated spike activity with cell 1. Dashed lines indicate 99% confidence limits.
The spontaneous spike activity of a total of 102 pairs of off-center α-GCs within 20 arrays was recorded simultaneously in dark-adapted retinas. We computed the cross-correlation function comparing the spike activity for each pair. We found 85% (47 of 55) of nearest neighbor pairs to have significant (above the 99% confidence level) correlated spike activity. Without exception, we found that every pair of nearest neighbor α-GCs that showed synchronized spiking were also tracer coupled. In contrast, we found that second-tier α-GC neighbors in the dark-adapted retina were never tracer coupled, nor did their cross-correlation functions show any synchrony between their spontaneous spike activities.
Synchrony of spikes evoked with extrinsic current injection
In a final set of experiments, we determined whether spikes generated with extrinsic current into an α-GC could evoke synchronous spikes in a neighboring α-GC. In these experiments, the activity of on-center and off-center α-GC pairs was monitored with intracellular and extracellular recording electrodes (Fig. 9A,B). Spikes were then evoked in one of the α-GCs by injection of current through the intracellular electrode. Although positive current injection effectively induced spiking in α-GCs, we found that injection of negative current consistently generated single anodal break spikes whose latencies could be compared with those of spikes in a neighboring α-GC (Fig. 9C,D). We found that 22% (121 of 550) of anodal break spikes generated in off-center α-GCs resulted in a spike in a neighboring off-center α-GC with a latency of <5 msec. In contrast, only 0.04% (8 of 200) of anodal break spikes in on-center α-GCs were paired with a spike in a neighboring α-GC with a latency of <5 msec. Moreover, a comparison of the short-latency synchronized spiking of off-center cells after current injection showed a peak latency of ∼2.4 msec (Fig. 9E), thus matching those of the cross-correlation functions described above for the spontaneous and light-evoked activities of off-center cells. No similar pattern was found for on-center cells, suggesting that the few spike pairs with short latencies occurred simply by chance (Fig. 9F).
Figure 9.

Spikes generated in α-GCs with extrinsic current injection. A, B, Simultaneous intracellular and extracellular recordings from pairs of off-center (A) and on-center (B) α-GCs. Responses are to a full-field stimulus with intensity in the low scotopic range (4.7 Rh* · rod-1 · sec-1). Light traces at bottom indicate onset and offset of the light stimulus. C, D, Same pairs of cells showing anodal break spike produced in one cell after negative current injection through the intracellular microelectrode and the simultaneous extracellular recording from the neighboring cell. Anodal break spike in the off-center α-GC produced a spike in the neighboring off-center cell with a latency of ∼2.5 msec. Anodal break spike in the on-center α-GC produced no spike in the on-center α-GC neighbor. Top and bottom amplitude calibrations apply to intracellular and extracellar recordings, respectively. E, F, Cumulative histograms showing the latency between spikes generated in simultaneously recorded pairs of off-center (E) (n = 4) and on-center (F) (n = 2) α-GCs after generation of an anodal break spike in one cell of each pair. Whereas 22% (121 of 550) of anodal break spikes generated in off-center α-GCs resulted in a spike in a neighboring off-center α-GC with a latency of <5 msec, only 0.04% (8 of 200) of anodal break spikes in on-center α-GCs were paired with a spike in a neighboring α-GC. The short-latency synchronous spiking of off-center cells after current injection showed a peak latency of ∼2.4 msec.
Discussion
Tracer-coupled α cells show short-latency spike synchrony
A number of studies across several species have described concerted spike firing between retinal ganglion cell neighbors (Arnett and Spraker, 1981; Mastronarde, 1983a,b,c, 1989; Meister et al., 1995; Brivanlou et al., 1998; DeVries, 1999). Three basic types of correlated spike activity exist, each occurring on a different time scale. Two are characterized by either a medium or broad cross-correlation function with a single peak, suggesting that the neighboring cells are synchronized by excitation derived from a common presynaptic input. The other, which was extensively studied here, is recognized by a narrow bimodal cross-correlation function with a trough at 0 msec and peaks at ±0.5-2.5 msec. The bimodal distribution and short latency of these peaks suggests reciprocal activity resulting from direct electrical coupling (Mastronarde, 1983c). The finding of extensive tracer-coupling patterns for many ganglion cells, including α-GCs, in mammalian retina provides the morphological substrate for this electrical coupling (Vaney 1991, 1994; Dacey and Brace, 1992; Penn et al., 1994; Xin and Bloomfield, 1997). By combining the physiological and morphological approaches of these previous studies, we showed directly, for the first time, that only tracer-coupled α-GCs show short-latency synchrony of spontaneous, light-evoked, or current-evoked spike activity.
The finding that not all of the α-GCs showed tracer coupling was fortuitous, in that the uncoupled α-GC population formed an internal control to test for spike synchrony. In fact, a previous report from our laboratory described variability in α-GC tracer-coupling patterns, but it was unclear whether this reflected different subpopulations of α-GCs or light-induced coupling changes related to alterations in adaptational state (Xin and Bloomfield, 1997). The present results indicate that the variability in α-GC coupling is related to their on- and off-center physiology: off-center α-GCs are tracer coupled, whereas on-center α-GCs are not. Uncoupled on-center α-GCs and coupled offcenter α-GCs were found side-by-side in the same retinas under identical adaptational conditions. Thus, the difference in coupling suggests a fundamental dichotomy in the organization of the on- and off-center subtypes, whereby the former simply lack gap junctions. Support for this notion comes from a recent finding of GABA accumulation, presumably resulting from permeation through gap junctions made with GABAergic amacrine cells, in off-center, but not on-center, α-GCs (Marc and Jones, 2002).
Consistent with the difference in tracer-coupling patterns of α-GCs, we found that off-center α-GCs displayed short-latency spike synchrony, whereas on-center α-GCs did not. Spontaneous, light-evoked, and current-evoked spiking of off-center α-GCs showed narrow synchrony with latencies of 2.0-2.5 msec. The bimodal distribution of their cross-correlation functions suggested reciprocal activation. In contrast, neighboring on-center α-GCs showed no correlated spontaneous spike activity. However, the correlations for light-evoked spike activities of neighboring on-center α-GCs did show a broad distribution with a single peak at 0 msec. Our finding that the shift predictor brought this peak below the 99% confidence level is consistent with previous assertions that this type of correlation reflects common synaptic inputs (Brivanlou et al., 1998; DeVries, 1999). Interestingly, the light-evoked activity of off-center α-GC pairs also showed this same broad correlation beneath the bimodal short-latency peaks, indicating two modes of spike synchrony.
We found that only the nearest neighbor α-GCs were tracer coupled and displayed short-latency concerted spike activity. These data suggest then that the synchronous networks formed by coupled α-GCs are highly localized, composed of a central α-GC and its three to eight nearest α-GC neighbors. However, the limits in the spread of tracer as well as the current underlying spike synchrony should not be construed as the result of some physical barrier. Quite the opposite, coupled α-GCs and amacrine cells should be considered a continuous electrical array that spans the entire retina. However, the conductance of the intercellular gap junctions must be relatively low, whereby tracer and current spread is restricted to nearest neighbors.
Comparison with other studies
Mastronarde (1983a,c) reported short-latency spike synchrony between neighboring on- and off-center Y-cell pairs. These data suggest that, in cat retina, both on- and off-center α-GCs (the morphological counterpart of Y-cells) are coupled via gap junctions. The discrepancy between these data and the present study could reflect species differences. In fact, on- and off-center parasol cells, the primate homolog of α-GCs, are both tracer coupled, indicating a clear difference with our findings in the rabbit (Dacey and Brace, 1992). However, another plausible explanation arises from the fact that Mastronarde was unable to visualize the cells he recorded and therefore based his identification strictly on physiological criteria. It is possible that ganglion cell types other than α-GCs were included in his study. In fact, we found that, at least in rabbit retina, not all of the ganglion cells physiologically classified as brisk-transient are α-GCs.
Our data are consistent with those reported by DeVries (1999), showing bimodal peaks of 2.5 msec in the cross-correlation functions for off-center, but not on-center, brisk-transient ganglion cells in the rabbit retina. Our findings thus confirm DeVries' hypothesis that off-center, but not on-center, α-GCs are electrically coupled. In contrast, Arnett and Spraker (1981) reported spike synchrony between both on- and off-center brisk-transient ganglion cells in the rabbit retina. However, they admittedly grouped cells into very broad categories, and it is thus likely that their sample included ganglion cell types other than α-GCs.
Homologous versus heterologous coupling
Consistent with previous studies, our results suggest that tracer-coupled α-GCs form homologous gap junctions with each other as well as heterologous junctions with at least two amacrine cell types, including long-range cells (Vaney 1991, 1994; Dacey and Brace, 1992; Penn et al., 1994; Xin and Bloomfield, 1997). The obvious question that arises is whether the direct homologous and/or indirect heterologous coupling is responsible for the short-latency spike synchrony between neighboring α-GCs. In fact, it is currently unclear whether α-GCs are directly coupled to one another: tracer-coupled α-GCs could be the result of α-GC-to-amacrine cell-to-α-GC movement of Neurobiotin (Jacoby et al., 1996). This indirect pathway may explain why the latencies for synchronization of α-GCs in rabbit appear somewhat longer than those reported in cat (Mastronarde, 1983c) and salamander (Brivanlou et al., 1998).
However, we found that injection of Neurobiotin into a single α-GC results in darker and more extensive labeling of neighboring α-GCs than when a coupled amacrine is injected, thus suggesting direct α-GC-to-α-GC coupling (our unpublished data). Furthermore, our finding that spike synchrony between off-center α-GCs is limited to the circumscribed array that are tracer coupled, provides compelling evidence that ganglion-to-ganglion cell coupling indeed exists and likely mediates this synchrony. Two additional lines of evidence also argue against amacrine-to-ganglion cell coupling being responsible for short-latency spike synchrony. First, within a single array, >100 amacrine cells are typically tracer-coupled, extending far beyond the circumscribed ring of coupled α-GCs. Second, individual long-range amacrine cells have enormous dendritic and receptive fields (Bloomfield, 1992; Xin and Bloomfield, 1997). Together, these data suggest that if amacrine-to-ganglion cell coupling was responsible, it should have imparted spike synchrony to a much larger array of ganglion cells, far beyond nearest neighbors. Finally, it is interestingly to note that Long et al. (2002) have reported a similar 2 msec lag in synchronous spikes of inferior olivary neuron pairs showing direct, electrical coupling.
Role of local correlated activity
Studies in salamander retina have shown that the receptive fields of the synchronous spike activity from pairs of ganglion cells are often smaller than those of individual ganglion cells and are located at their intersection (Meister et al., 1995; Meister, 1996). This synchronous activity may thus serve to preserve high-resolution spatial signals and compress information for efficient transmission across the limited capacity of the optic nerve (Meister and Berry, 1999). Furthermore, these data suggest that synchronous activity provides additional visual information to the brain that is multiplexed with the asynchronous signals from individual ganglion cells. However, this idea has recently been challenged by Nirenberg et al. (2001).
Synchronous spike activity may also enhance the saliency of visual signals. Synchronized EPSPs at central targets are more likely to elicit spikes than EPSPs dispersed over longer time intervals (Alonso et al., 1996; Matsumura et al., 1996; Alonso and Martinez, 1998; Stevens and Zador, 1998; Usrey and Reid, 1999). It has been proposed that concerted activity may provide the temporal precision by which retinal signals are reliably transmitted to central targets (Singer, 1999).
A final question raised by our results is the following: Why do off-center α-GCs show short-latency synchrony, whereas on-center cells do not? In general, the off-center α-GCs are optimized to detect targets that are darker than the ambient background, such as during twilight. Recently, Tsukamoto et al. (2001) suggested that rod photoreceptors couple under these conditions to pool signals, thereby improving response signal-to-noise and increasing sensitivity. Likewise, coupling between the off-center α-GCs may serve to amplify the saliency of signals encoding dark targets. This would be particularly important for rabbits to avoid predators, particularly birds, during dawn or dusk. This scenario would suggest that coupling patterns for α-GCs might vary according to changes in retinal adaptational state. It will thus be of interest to determine whether synchronous activity between α-GCs is regulated by changes in ambient light conditions.
Footnotes
This work was supported by National Institutes of Health Grant EY07360 (S.A.B.) and Medical Scientist Training Program GM07308 (E.H.H.) and by Research to Prevent Blindness, Inc. E.H.H. was a Research to Prevent Blindness Medical Student Eye Research Fellow. We thank Drs. Esther Gardner and Eric Lang for helpful discussions.
Correspondence should be addressed to Dr. Stewart Bloomfield, Department of Ophthalmology, New York University School of Medicine, 550 First Avenue, MSB181, New York, NY 10016. E-mail: blooms01@med.nyu.edu.
Copyright © 2003 Society for Neuroscience 0270-6474/03/236768-10$15.00/0
References
- Alonso JM, Martinez LM ( 1998) Functional connectivity between simple cells and complex cells in cat striate cortex. Nat Neurosci 1: 395-403. [DOI] [PubMed] [Google Scholar]
- Alonso JM, Usrey WM, Reid RC ( 1996) Precisely correlated firing in cells of the lateral geniculate nucleus. Nature 383: 815-819. [DOI] [PubMed] [Google Scholar]
- Arnett D, Spraker TE ( 1981) Cross-correlation analysis of the maintained discharge of rabbit retinal ganglion cells. J Physiol (Lond) 317: 29-47. [DOI] [PMC free article] [PubMed] [Google Scholar]
- Barlow HB, Fitzhugh R, Kuffler SW ( 1957) Change of organization in the receptive fields of the cat's retina during dark adaptation. J Physiol (Lond) 137: 338-354. [DOI] [PMC free article] [PubMed] [Google Scholar]
- Barlow HB, Hill RM, Levick WR ( 1964) Retinal ganglion cells responding selectively to direction and speed of image motion in the rabbit. J Physiol (Lond) 173: 377-407. [DOI] [PMC free article] [PubMed] [Google Scholar]
- Bloomfield SA ( 1992) Relationship between receptive field and dendritic field size of amacrine cells in the rabbit retina. J Neurophysiol 68: 711-725. [DOI] [PubMed] [Google Scholar]
- Bloomfield SA, Miller RF ( 1982) A physiological and morphological study of the horizontal cell types in the rabbit retina. J Comp Neurol 208: 288-303. [DOI] [PubMed] [Google Scholar]
- Bloomfield SA, Miller RF ( 1986) A functional organization of ON and OFF pathways in the rabbit retina. J Neurosci 6: 1-13. [DOI] [PMC free article] [PubMed] [Google Scholar]
- Boycott BB, Wässle H ( 1974) The morphological types of ganglion cells of the domestic cat's retina. J Physiol (Lond) 240: 397-419. [DOI] [PMC free article] [PubMed] [Google Scholar]
- Brivanlou IH, Warland DK, Meister M ( 1998) Mechanisms of concerted firing among retinal ganglion cells. Neuron 20: 527-539. [DOI] [PubMed] [Google Scholar]
- Caldwell JH, Daw NW ( 1978) New properties of rabbit retinal ganglion cells. J Physiol (Lond) 276: 257-276. [DOI] [PMC free article] [PubMed] [Google Scholar]
- Castelo-Branco M, Neuenschwander S, Singer W ( 1998) Synchronization of visual responses between cortex, lateral geniculate nucleus, and retina in the anesthetized cat. J Neurosci 18: 6395-6410. [DOI] [PMC free article] [PubMed] [Google Scholar]
- Cleland BG, Levick WR, Wässle H ( 1975) Physiological identification of a morphological class of cat retinal ganglion cells. J Physiol (Lond) 248: 151-171. [DOI] [PMC free article] [PubMed] [Google Scholar]
- Dacey DM, Brace S ( 1992) A coupled network for parasol but not midget ganglion cells in the primate retina. Vis Neurosci 9: 279-290. [DOI] [PubMed] [Google Scholar]
- DeVries SH ( 1999) Correlated firing in rabbit retinal ganglion cells. J Neurophysiol 81: 908-920. [DOI] [PubMed] [Google Scholar]
- Famiglietti EV, Kaneko A, Tachibana M ( 1977) Neuronal architecture of on and off pathways to ganglion cells. Science 198: 1267-1269. [DOI] [PubMed] [Google Scholar]
- Fukuda Y, Hsiao C-F, Watanabe M, Ito H ( 1984) Morphological correlates of physiologically identified Y, X, and W cells in cat retina. J Neurophysiol 52: 999-1013. [DOI] [PubMed] [Google Scholar]
- Hu EH, Dacheux RF, Bloomfield SA ( 2000) A flattened-retina eyecup preparation suitable for electrophysiological studies of neurons visualized with trans-scleral infrared illumination. J Neurosci Methods 103: 209-216. [DOI] [PubMed] [Google Scholar]
- Jacoby R, Stafford D, Kouyama N, Marshak D ( 1996) Synaptic inputs to ON parasol ganglion cells in the primate retina. J Neurosci 16: 8041-8056. [DOI] [PMC free article] [PubMed] [Google Scholar]
- Kuffler SW ( 1953) Discharge patterns and functional organization of mammalian retina. J Neurophysiol 16: 37-68. [DOI] [PubMed] [Google Scholar]
- Levick WR ( 1967) Receptive fields and trigger features of ganglion cells in the visual streak of the rabbit's retina. J Physiol (Lond) 188: 285-307. [DOI] [PMC free article] [PubMed] [Google Scholar]
- Long MA, Deans MR, Paul DL, Connors BW ( 2002) Rhythmicity without synchrony in the electrically uncoupled inferior olive. J Neurosci 22: 10898-10905. [DOI] [PMC free article] [PubMed] [Google Scholar]
- Marc RE, Jones BW ( 2002) Molecular phenotyping of retinal ganglion cells. J Neurosci 22: 413-427. [DOI] [PMC free article] [PubMed] [Google Scholar]
- Mastronarde DN ( 1983a) Correlated firing of cat retinal ganglion cells. I. Spontaneously active inputs to X- and Y-cells. J Neurophysiol 49: 303-324. [DOI] [PubMed] [Google Scholar]
- Mastronarde DN ( 1983b) Correlated firing of cat retinal ganglion cells. II. Responses of X- and Y-cells to single quantal events. J Neurophysiol 49: 325-349. [DOI] [PubMed] [Google Scholar]
- Mastronarde DN ( 1983c) Interactions between ganglion cells in the cat retina. J Neurophysiol 49: 350-365. [DOI] [PubMed] [Google Scholar]
- Mastronarde DN ( 1989) Correlated firing of retinal ganglion cells. Trends Neurosci 12: 75-80. [DOI] [PubMed] [Google Scholar]
- Matsumura M, Chen DF, Sawaguchi T, Kubota K, Fetz EE ( 1996) Synaptic interactions between primate precentral cortex neurons revealed by spike-triggered averaging of intracellular membrane potentials in vivo. J Neurosci 16: 7757-7767. [DOI] [PMC free article] [PubMed] [Google Scholar]
- Meister M ( 1996) Multineuronal codes in retinal signaling. Proc Natl Acad Sci USA 93: 609-614. [DOI] [PMC free article] [PubMed] [Google Scholar]
- Meister M, Berry MJ ( 1999) The neural code of the retina. Neuron 22: 435-450. [DOI] [PubMed] [Google Scholar]
- Meister M, Lagnado L, Baylor DA ( 1995) Correlated signaling by retinal ganglion cells. Science 270: 1207-1210. [DOI] [PubMed] [Google Scholar]
- Muller JF, Dacheux RF ( 1997) Alpha ganglion cells of the rabbit retina lose antagonistic surround responses under dark adaptation. Vis Neurosci 14: 395-401. [DOI] [PubMed] [Google Scholar]
- Nelson R, Famiglietti EV, Kolb H ( 1978) Intracellular staining reveals different levels of stratification for on- and off-center ganglion cells in cat retina. J Neurophysiol 41: 472-483. [DOI] [PubMed] [Google Scholar]
- Nirenberg S, Carcieri SM, Jacobs AL, Latham PE ( 2001) Retinal ganglion cells act largely as independent encoders. Nature 411: 698-701. [DOI] [PubMed] [Google Scholar]
- Peichl L ( 1991) Alpha ganglion cells in mammalian retinae: common properties, species differences, and some comments on other ganglion cells. Vis Neurosci 7: 155-169. [DOI] [PubMed] [Google Scholar]
- Peichl L, Wässle H ( 1981) Morphological identification of on- and offcentre brisk transient (Y) cells in the cat retina. J Physiol (Lond) 212: 139-156. [DOI] [PubMed] [Google Scholar]
- Peichl L, Wässle H ( 1983) The structural correlate of the receptive field center of alpha ganglion cells in the cat retina. J Physiol (Lond) 341: 309-324. [DOI] [PMC free article] [PubMed] [Google Scholar]
- Peichl L, Buhl EH, Boycott BB ( 1987) Alpha ganglion cells in the rabbit retina. J Comp Neurol 263: 25-41. [DOI] [PubMed] [Google Scholar]
- Penn AA, Wong ROL, Shatz CJ ( 1994) Neuronal coupling in the developing mammalian retina. J Neurosci 14: 309-324. [DOI] [PMC free article] [PubMed] [Google Scholar]
- Perkel DH, Gerstein GL, Moore GP ( 1967) Neuronal spike trains and stochastic point processes. II. Simultaneous spike trains. Biophys J 7: 419-440. [DOI] [PMC free article] [PubMed] [Google Scholar]
- Rager G, Singer W ( 1998) The response of cat visual cortex to flicker stimuli of variable frequency. Eur J Neurosci 10: 1856-1877. [DOI] [PubMed] [Google Scholar]
- Saito HA ( 1983) Morphology of physiologically identified X-, Y-, and W-type retinal ganglion cells of the cat. J Comp Neurol 221: 279-288. [DOI] [PubMed] [Google Scholar]
- Schnitzer MJ, Meister M ( 2003) Multineuronal firing patterns in the signal from eye to brain. Neuron 37: 499-511. [DOI] [PubMed] [Google Scholar]
- Singer W ( 1999) Neuronal synchrony: a versatile code for the definition of relations? Neuron 24: 49-65. [DOI] [PubMed] [Google Scholar]
- Stanford LR, Sherman SM ( 1984) Structure/function relationships of retinal ganglion cells in the cat. Brain Res 297: 381-386. [DOI] [PubMed] [Google Scholar]
- Stevens CF, Zador AM ( 1998) Input synchrony and the irregular firing of cortical neurons. Nat Neurosci 1: 210-217. [DOI] [PubMed] [Google Scholar]
- Tsukamoto Y, Morigiwa K, Ueda M, Sterling P ( 2001) Microcircuits for night vision in mouse retina. J Neurosci 21: 8616-8623. [DOI] [PMC free article] [PubMed] [Google Scholar]
- Usrey WM, Reid RC ( 1999) Synchronous activity in the visual system. Annu Rev Physiol 61: 435-456. [DOI] [PubMed] [Google Scholar]
- Vaney DI ( 1991) Many diverse types of retinal neurons show tracer coupling when injected with biocytin or Neurobiotin. Neurosci Lett 125: 187-190. [DOI] [PubMed] [Google Scholar]
- Vaney DI ( 1994) Patterns of neuronal coupling in the retina. Prog Retin Eye Res 13: 301-355. [Google Scholar]
- Wässle H, Levick WR, Cleland BG ( 1975) The distribution of the alpha type of ganglion cells in the cat's retina. J Comp Neurol 159: 419-438. [DOI] [PubMed] [Google Scholar]
- Wässle H, Peichl L, Boycott BB ( 1981) Morphology and topography of onand off-alpha cells in the cat retina. Proc R Soc Lond B Biol Sci 212: 157-175. [DOI] [PubMed] [Google Scholar]
- Xin D, Bloomfield SA ( 1997) The tracer coupling pattern of amacrine and ganglion cells in the rabbit retina. J Comp Neurol 383: 512-528. [DOI] [PubMed] [Google Scholar]