

Abstract
Information processing in the visual cortex is critically dependent on the input-output relationships of its component neurons. The transformation of synaptic inputs into spike trains depends in turn on the host of intrinsic membrane properties expressed by neurons, which define established electrophysiological cell classes in the neocortex. Here we studied, with intracellular recordings in vivo, how the electrophysiological cell classes in the primary visual cortex transform an increasing input, represented by stimulus contrast, into membrane depolarization and trains of action potentials. We used contrast as input because, regardless of their stimulus selectivity, primary visual cortical cells increase their firing rates in response to increases in luminance contrast. We found that both the spike rate response and the membrane potential response are best described by the hyperbolic ratio function when compared with linear, power, and logarithmic functions. In addition, both responses show similar parameter values and similar residual variance from the fits to all four functions. We also found that changes in membrane potential are similar, but firing rates differ strongly, between the established electrophysiological cell classes: fast spiking neurons show the highest firing rates, followed by fast rhythmic bursting, and regular spiking (RS) cells. In addition, among complex cells, RS cells from supragranular layers fired at higher rates than RS cells from infragranular layers. Finally, we show that the differences in firing rates between cell classes arise from differences in the slope of the relationship between membrane potential and spike rate.
Keywords: contrast, visual cortex, intrinsic properties, intracellular, in vivo, simple, complex
Introduction
A critical step in understanding the operations of local cortical networks is to determine the input-output relations of its component cells. Local cortical networks contain several types of excitatory and inhibitory elements, which display nonlinear electrophysiological behaviors and are interconnected by complex recurrent loops. Therefore, to understand the operations performed by the network as a whole, it is first necessary to quantify how individual elements of the network transform synaptic inputs into trains of action potentials. It is known from electrophysiological recordings in vitro (McCormick et al., 1985; Schwindt et al., 1988; Connors and Gutnick, 1990; Llinas et al., 1991; Schwindt and Crill, 1999) and in vivo (Nunez et al., 1992; Gray and McCormick, 1996; Azouz et al., 1997; Steriade et al., 1998) that different cortical cells respond to depolarizing current injection with trains of action potentials that differ in their frequency and firing patterns. These differences form the basis for the classification of cortical cells into distinct electrophysiological classes (Connors and Gutnick, 1990). The segregation of cells into electrophysiological classes is important not only because of their differences in input-output relations, but also because there is a general correspondence with the neurotransmitter released by the cell (DeFelipe, 1993). For example, fast spiking (FS) cells are generally GABAergic inhibitory interneurons, whereas regular spiking (RS) cells are glutamatergic excitatory cells. Therefore, for a functional understanding of cortical operations it is critical to determine if the electrophysiological differences revealed by the responses to artificial current injection also differentiate cells during responses to sensory stimuli.
In primary visual cortex, cells are most commonly classified according to functional criteria (Skottun et al., 1991) as simple and complex (Hubel and Wiesel, 1962). Because electrophysiological studies of visual cortex generally group cells in these two categories only, the input-output relations of different electrophysiologically defined cells classes are lumped together.
The spatiotemporal distribution of local luminance contrasts is the basic information that needs to be represented by the visual system to represent objects. Indeed, neurons in V1 increase their firing rates with increases in stimulus contrast, regardless of their selectivity. The contrast response function (CRF) of spike rate responses of V1 neurons has a sigmoidal shape (Albrecht and Hamilton, 1982). At low contrasts the response increases as a power function, at high contrasts the response saturates, and in between it is roughly linear. It has been proposed (Albrecht and Hamilton, 1982) that these two nonlinearities are critical for stimulus selectivity and the maintenance of selectivity independent of contrast.
We report here on CRFs of membrane potential (Vm) and the spike rate obtained from intracellular recordings in cat V1 in vivo. Cells were classified both functionally (simple/complex) and electrophysiologically. We find that cell classes differ significantly in their firing rates in response to contrast but not in the behavior of the underlying Vm. We also find that the nonlinearities of the CRF are present at the level of Vm. Finally, we find that the variation in firing rates among cells can be accounted for by the different slopes of the linear relationships between Vm and the spike rate.
Materials and Methods
Surgical protocol. Experiments were conducted in accordance with the ethical guidelines of the National Institutes of Health and with the approval of the Institutional Animal Care and Use Committee of the University of Pennsylvania. Adult cats (2.5-3.5 kg) were anesthetized with an initial intraperitoneal injection of thiopental (25 mg/kg). Supplementary halothane (2-4% in a 70:30 mixture of N2O and O2) permitted the placement of two venous catheters. Subsequently, deep anesthesia was maintained during surgery with intravenous thiopental as needed and maintained for the duration of the experiment (14-16 hr) with a continuous infusion (3-10 mg/hr). Atropine sulfate (0.05 mg/kg, i.m.) was administered to prevent secretions and dexamethasone (4 mg, i.m.) to prevent cerebral edema. Lidocaine (2%) was generously applied to all skin incisions and pressure points. The animal was paralyzed with gallamine triethiodide (Flaxedil) by an initial injection of 60 mg and maintained with continuous intravenous infusion (20 mg/hr). The level of anesthesia was determined by continuously monitoring the EEG and the heart rate. Because the thiopental is infused continuously, we obtained very stable patterns of anesthesia throughout the experiment. The end-tidal CO2 concentration was kept at 3.7 ± 0.2%, and the rectal temperature was kept at 37-38°C with a heating pad.
The surface of the visual cortex was exposed with a craniotomy centered at Horsley Clarke posterior 4.0, lateral 2.0 and bathed in mineral oil to prevent desiccation. The stability of the recordings was ensured by performing a bilateral pneumothorax, drainage of the cisterna magna, hip suspension, and by filling the cranial defect with a solution of 4% agar.
Visual stimulation. The corneas were protected with neutral contact lenses after dilating the pupils with 1% ophthalmic atropine and retracting the nictitating membranes with phenylephrine (Neosynephrine). Spectacle lenses were chosen by the tapetal reflection technique to optimize the focus of stimuli on the retina. The position of the monitor was adjusted with an x-y-stage so that the area centralae were well centered on the screen and their coordinates entered into the computer for tracking receptive field (RF) positions in retinal coordinates.
Stimuli were presented on an Image Systems (Minnetonka, MN) model M09LV monochrome monitor operating at 125 frames per second at a spatial resolution of 1024 × 786 pixels and a mean luminance of 47 cd/m2. The screen subtends 36 by 27o (28.7 pixels per degree), and lookup tables were linearized for a contrast range of ±100%. Stimuli were synthesized using custom software by means of the framestore portion of a Cambridge Research Systems (Cambridge, UK) VSG card mounted in a conventional personal computer. Programs provide for stimulus control, online displays of acquired signals (Vm and spikes), and a graphical user interface for controlling all stimulus parameters. In addition to this online control, all data were stored on a Nicolet Vision, and it was from these records that offline analyses were performed. Vm and stimulus marks were sampled at 10 kHz with 16 bit analog-to-digital converters.
Computer-assisted hand plotting routines were used with every cell to estimate quickly and accurately the optimal orientation, direction, and spatial and temporal frequencies and to determine the receptive field position and dimensions. Contrast response functions were generated by presenting sinusoidal gratings of optimal orientation, direction, and spatial frequency, drifting within a patch limited to the receptive field. Mean luminance and all parameters of the stimuli were held constant except for contrast, which was presented in pseudorandom order. Presentation at each contrast consisted of 3-5 cycles before the screen was returned to mean luminance for an equal interval. In this way we minimized, or at least standardized, the effects of changing the contrast set point of cells, which is known to change over an average time course of seconds (Ohzawa et al., 1982; Sanchez-Vives et al., 2000). One pass consisted of presentations at each contrast, and 5-15 passes were generally run. The contrasts used were always 0, 2, 4, 8, 16, 32, and 64%.
Simple cells were distinguished from complex cells by the relative modulation of their spike trains. If the fundamental F1 (response at the temporal frequency of the grating) equaled or exceeded the average firing rate (the DC), the cell was classified as simple (Skottun et al., 1991); otherwise it was classified as complex.
Intracellular recording procedures. Intracellular recordings were obtained from the visual cortex as close as possible to the representation of the area centralis (P4, L2). Intracellular recordings were performed with glass micropipettes filled with 2 m potassium acetate (with 2% neurobiotin added). The depth of the cells was estimated from the microdrive reading, which was calibrated by comparing those readings with the depths of cells filled with Neurobiotin (n = 12) and found to have <15% error. After beveling, pipettes had final resistances of 60-80 MΩ.
Statistical analysis. Contrast response functions were generated offline using MatLab (MathWorks, Natick, MA). Spike firing times were determined from the Nicolet records, and PSTHs were constructed, giving spike counts per bin (n = 100) evenly spaced over the cycle for each contrast. F1 and DC response components were extracted from the peri-stimulus histograms (PSTHs) at each contrast on a pass-by-pass basis. Spikes were also removed from the records of Vm (by template subtraction), and cyclegrams were generated of Vm for each pass. F1 and DC components were extracted from the Vm cyclegrams as well. Thus, seven F1 terms and seven DC terms were obtained for both Vm and spikes for every cell. Each set of 4 × 7 observations was fit to four candidate functions using the Levenberg-Marquardt method to minimize the χ2 error between the observations and the candidate function. This method combines the steepest-descent method and a Taylor series-based method to obtain a fast, reliable technique for nonlinear optimization. Following the lead of Albrecht and Hamilton (1982), the four candidate functions are:
 |
 |
 |
 |
where R(C) denotes response as a function of contrast. Spontaneous activity (or resting Vm) was subtracted from the data before curve fitting. The parameters of the hyperbolic ratio function will be explained in Results.
In most instances, the groups being compared are small. Accordingly, nonparametric statistics are used unless otherwise noted.
Results
Our goal was to characterize quantitatively the responses of electrophysiologically defined cell classes in primary visual cortex, as a function of the contrast of visual stimuli. Using intracellular recording in vivo, we measured the responses to drifting sinusoidal gratings of optimal orientation and spatiotemporal frequency presented at logarithmically spaced contrasts. Cells were classified electrophysiologically with intracellular current injection, and contrast response functions (CRFs) were obtained for Vm and spike rates (in Hertz). The CRFs were characterized quantitatively by least-squares fits to four mathematical functions: linear, logarithmic, power, and hyperbolic ratio (see Materials and Methods). The parameters of these fits were then used to compare the CRFs obtained simultaneously for spike rates and Vm and to summarize and compare the responses of the various cell classes. We emphasize the differences between RS and FS cells because they constitute the great majority of excitatory and inhibitory cells in the neocortex, but we also show differences between these and other cell types.
Intracellular recordings with sharp glass microelectrodes were obtained from layers 2-6 of cat primary visual cortex (area 17). Of the 148 cells recorded intracellularly in 36 cats, we selected 58 cells based on two criteria: (1) at least one complete CRF was obtained and (2) the resting Vm was stable and more negative than -60 mV with overshooting action potentials for at least 15 min.
Cells were classified electrophysiologically based on two criteria: (1) their firing patterns in response to current injection and (2) the characteristics of the action potential. Every cell was tested with the combined application of depolarizing current pulses, applied both at rest and at a hyperpolarized Vm, as well as hyperpolarizing pulses applied at rest (Fig. 1). Cells were then classified according to established criteria (Connors et al., 1982; McCormick et al., 1985; Nunez et al., 1992; de la Pena and Geijo-Barrientos, 1996; Steriade et al., 1998). RS cells (n = 23) (Fig. 1, top left) fired action potentials of 1 msec duration (Fig. 1, insert) measured at threshold and produced adapting spike trains with peak instantaneous frequencies below 200 Hz. FS cells (n = 17) (Fig. 1, bottom left) fired spikes of <0.6 msec duration at threshold, with pronounced and brief spike afterhyperpolarizations (AHPs). FS cells generated trains of action potentials with instantaneous frequencies of up to 700 Hz with very little frequency adaptation. Fast rhythmic bursting cells (FRB, also called “chattering” cells, n = 11) (Fig. 1, upper right) (Gray and McCormick, 1996) had action potentials of 0.6 msec at threshold, and fired repetitive bursts, in response to current pulses, with intraburst frequencies of 100-300 Hz and interburst frequencies of 15-40 Hz. Low-threshold spiking cells (LTS; n = 7) (Fig. 1, lower right) generated action potentials of 0.8 msec duration and fired a single burst of action potentials, sometimes followed by trains of single spikes, in response to depolarizing pulses only when applied from a hyperpolarized Vm (below -65 mV). Low-threshold bursts were also generated at the break of hyperpolarizing pulses (Fig. 1, bottom right, darker trace). None of the other three cell types (RS, FS, and FRB), generated low-threshold bursts. Intrinsically bursting cells were also occasionally recorded (n = 4); all were complex cells, but none met both criteria for inclusion in this study. Cells were also classified functionally as simple (n = 24) or complex (n = 34), according to the relative modulation of their spike trains by the drifting gratings. Cells were classified as simple if the modulation of the spike train at the temporal frequency of the grating (the F1 component) exceeded the mean response (the DC component) at contrasts above 4%. Otherwise, cells were classified as complex (Movshon et al., 1978a,b; Skottun et al., 1991). This criterion has been shown to correlate well with the original, qualitative definitions of simple and complex cells by Hubel and Wiesel (1962).
Figure 1.

Intrinsic firing patterns of cortical cells. Cells were classified according to their distinct firing patterns in response to square current pulses, as RS, FS, FRB, and LTS. In addition, the different cell classes fired action potentials with different durations (inset). The RS cell responded to a 0.8 nA depolarizing pulse of 0.4 sec duration with an accommodating train of single spikes at ∼30 Hz. The FRB cell responded to a depolarizing pulse of 0.8 nA and 0.3 sec with a characteristic discharge of rhythmic bursts at ∼30 Hz and an intraburst frequency of 250 Hz. The first burst in the response is typically longer (11 spikes as opposed to 3 or 4 in the subsequent bursts) and with a higher intraburst frequency of 500 Hz. The FS cells showed a high-frequency train of spikes at 300 Hz with virtually no accommodation in response to a 1 nA pulse lasting 0.2 sec. Note the sharp after hyperpolarization compared with the U-shaped AHP of the RS cell. The LTS responded with a single burst of spikes when activated with a 0.4 nA pulse applied on a background of DC hyperpolarization (-76 mV), or the break of a 0.8 nA hyperpolarizing pulse lasting 0.15 sec applied at rest (-65 mV). Note the characteristic long first interval in the burst of the LTS cell. The inset shows the duration at the threshold of the first spike in each of the responses: RS = 1.0, FS = 0.5, LTS = 0.8, and FRB = 0.6 msec. The vertical calibration bar for voltage and current is the same for all. Vm is indicated for this and all the figures.
There was no obvious correspondence between the electrophysiological cell classes and the functional types. The only exception to this generalization was the population of LTS neurons, which were exclusively complex (7 of 7). RS, FS, and FRB cells were either simple (RS = 8, FS = 11, FRB = 5) or complex (RS = 15, FS = 6, FRB = 6). In addition, there were no differences between cells of the same category located in different layers, except for RS complex cells, which showed differences between the supragranular and infragranular layers. Hence, cells were grouped for comparison of their responses to contrast into eight categories: FS simple, FS complex, FRB simple, FRB complex, RS simple, RS complex supragranular, RS complex infragranular, and LTS complex.
In response to drifting sinusoidal gratings of optimal orientation (Fig. 2, center) and restricted to the RF, simple cells (Fig. 2, left) showed sinusoidal modulation of their Vm at the temporal frequency of the grating, sometimes superimposed on changes of the mean Vm. The response increased in amplitude with increasing contrast of the drifting grating. At the top of the sinusoidal modulation of the Vm, simple cells fired action potentials, and the firing rates increased with the increase in contrast. The simple cell shown in Figure 2, an FS cell with a resting Vm of -71 mV, showed a peak-to-peak modulation of its Vm of 20 mV in response to the grating of 64% contrast (top trace, each presentation consisted of five cycles at 3.3 Hz). This same cell increased its firing rate from 4 Hz (at rest, 0% contrast) to 60 Hz at 64% contrast. Complex cells (Fig. 2, right) responded to drifting gratings with depolarization of their mean Vm and an elevation in mean firing rate, with virtually no modulation of the response. The example of Figure 2 is a complex RS cell in which the Vm showed a mean depolarization of ∼4 mV at the highest contrast of 64% and an increase in mean firing rate from 1 Hz at rest (0% contrast) to 4 Hz at 64%. The large difference in spike rates apparent in the examples in Figure 2 is representative of the difference between FS and RS cells, but the difference in Vm is not (see below).
Figure 2.

Responses of simple and complex cells to drifting sinusoidal gratings of increasing contrast. Each presentation consisted of five cycles of a drifting sinusoidal grating at 3.3 Hz, with increasing contrast from 0 to 64% (center circles). Grating was confined to the RF of the cell. Simple cells (left) showed a modulation of their membrane potential at the frequency of the grating, whereas the complex cell (right) responded with DC depolarization. The simple cell was an FS cell and showed a striking increase in firing rate with contrast. The complex cell was an RS cell and showed only a modest increase in firing rate.
To quantify the spike and Vm responses to the drifting gratings, we first averaged both responses time-locked to the cycle of the sine-wave grating generating PSTH and Vm cyclegrams, respectively. Examples of averaged data (PSTH and cyclegrams) from two RS and two FS cells are shown in Figure 3. As the contrast of the grating increased from 0 to 64%, the sinusoidal modulation of the Vm of simple cells (Fig. 3, RS and FS, top), at the frequency of the grating, increased in amplitude. The depolarizing phase of the modulated Vm was crowned by action potentials with increasing frequencies as contrast increased. In the RS simple cell the sinusoidal modulation of the Vm was mostly above rest, indicating an important DC component. Modulation in the FS cell was roughly symmetrical around the resting Vm. The two complex cells (Fig. 3, bottom) showed primarily an elevation of the mean Vm and mean firing rates with virtually no modulation.
Figure 3.

Average Vm and spike rate as a function of contrast. Vm and spike rate were averaged time-locked to the cycle of the grating to generate cyclegrams (Vm cyclegrams) and PSTHs, respectively. The RS simple (top left) and the FS simple (top right) cells responded with a modulation of the Vm and spike response phase-locked to the cycle of the grating, which increased in amplitude with increasing contrast (0 to 64%). The RS complex (bottom left) and the FS complex (bottom right) cells responded with an elevation of the mean DC value of Vm and spike rate without modulation.
From the averaged responses, we used the DC component as the measure of the response of complex cells and the F1 component as the measure of the response of simple cells. The DC component is simply the mean value of the PSTH (in hertz) or the cyclegram (in millivolts) for each contrast, whereas the F1 component is the portion of the response (PSTH or cyclegram) modulated at the temporal frequency of the grating. It is calculated as the amplitude of the first harmonic (F1) component of the response, i.e., half of the peak-to-peak amplitude of the sine wave with the same temporal frequency as the grating that best fits the response (again in Hertz or millivolts). Figure 4 shows the CRFs calculated from the PSTHs and Vm cyclegrams shown in Figure 3. In these and all cases, we subtracted the value of Vm and spike rate obtained at 0% contrast (the spontaneous value) from all points. This value is arbitrarily assigned a contrast of 0.3% to permit plotting on log contrast axes. The RS simple cell (Fig. 4A) showed a Vm response with an F1 component of 1.8 mV at 64% contrast, whereas the spike output increased from 0 Hz at 0% contrast to an F1 value of 9 Hz at 64% contrast. The FS simple cell (Fig. 4B) showed a larger modulation of the Vm with an F1 value of 7.8 mV at 64% contrast and an increase in firing rate from 7 Hz at rest (0% contrast) to 66 Hz at 64%. The RS complex cell (Fig. 4C) depolarized 6.4 mV (DC component) from a resting Vm of -64 mV and the FS complex cell (Fig. 4D) depolarized 5.5 mV from a resting Vm of -61 mV at 64% contrast. Although the depolarization of these two complex cells was comparable, the firing rate of the RS cell increased from 0 Hz at rest to 12 Hz at 64% contrast, whereas the FS cell showed an increase in mean firing rate from 3 to 51 Hz. The plots of Figure 4 are characteristic of our entire population of cells in two fundamental aspects: (1) The shape of the response exhibits an accelerating portion at low contrast, a roughly linear portion at midcontrasts, and saturation at high contrasts. (2) The responses of Vm and spikes had very similar shapes.
Figure 4.

The contrast response function was best fit by the hyperbolic ratio function. Examples of hyperbolic fits to the responses shown in Figure 3: RS simple (A), FS simple (B), RS complex (C), and FS complex (D). Filled diamonds represent the spike rate, measured from the PSTH in Figure 3. Open circles represent the Vm, measured from the cyclegrams in Figure 3. The values represented are the DC component for the complex cells and the F1 component for the simple cells. Vm and spike responses were fit equally well by the hyperbolic ratio function (solid lines).
It has already been shown, using extracellular recordings (Albrecht and Hamilton, 1982), that the function that best describes the CRF of the spike response is the hyperbolic ratio function. We wanted to determine if the same function was the best descriptor of the spike data in our intracellular recordings, and more importantly, if it was also the best descriptor of the responses at the level of Vm. We calculated the least-squares best fit to the spike and Vm responses of all cells using four functions: linear, logarithmic, power, and hyperbolic ratio (see Materials and Methods). We found that the hyperbolic ratio provided a far better fit for the spike rate data. We also found that the hyperbolic ratio function provided the best fit for the Vm data. Figure 5 presents the residual variance remaining after fitting each CRF in our entire cell population with the four candidate functions. Several important results emerge from this analysis. First, our results for spikes are in good agreement with the earlier study by Albrecht and Hamilton (1982), and in every case, the hyperbolic ratio was superior to fits with all the other functions. Furthermore, the results for Vm are indistinguishable from those for spikes. For both spikes and Vm, the hyperbolic ratio accounts for at least 90% of the variance in the CRFs. For 30% of the cells it accounts for 99% of the variance. In a few cases (n = 7), hyperbolic fits to the CRFs obtained from Vm were only marginally better than fits to power functions.
Figure 5.

Comparison of the goodness of the fits to the four functions used. The effectiveness of each of the four candidate functions (linear, power, logarithmic, and hyperbolic ratio) as fits to the raw contrast-response data were assessed by measuring residual variance. The four functions were fit to both Vm (top) and firing rate (bottom) responses. The abscissa is the fraction of the variance in the raw measurement unaccounted for by the best fitting candidate function. The average variance unaccounted for by the fit is indicated above the histogram. The hyperbolic ratio is markedly superior to the other three functions.
Based on this analysis, the parameters of the best fitting hyperbolic ratio function provide an efficient way to compare the relationships between contrast and response for our eight cell classes as well as a means to compare CRFs obtained for spike rates and Vm of individual cells. The hyperbolic ratio function has three parameters: C50, the semisaturation constant, which specifies where on the contrast axis the curve is centered; n, the exponent, which determines the steepness of the curve and the sharpness of the nonlinearities at high and low contrasts; and Rmax, the value of Vm or spike rate at which the response saturates. C50 and n can be compared for data derived from Vm and spike rates, but Rmax cannot. The solid lines in Figure 4 are the best fitting hyperbolic ratios to the CRFs obtained from spikes and Vm for the four cells illustrated. It is evident that the fits are excellent and also that the curves for spikes and Vm are very similar. This is especially obvious for the cells whose CRFs are illustrated in Fig. 5C and 5D because the data for Vm and spike rates are essentially superimposed. In Fig. 5A, the cell exhibited a lower exponent and a slightly lower C50 for Vm compared with spike rates. In Fig. 5B, the C50 for Vm was lower, but the exponent was slightly higher for spike rates.
Summaries of the parameters of the best fitting hyperbolic ratios, for both spikes and Vm for our entire population, are shown in Figure 6A. The distributions of exponent and C50 for spikes (bottom) are in very good agreement with values reported by Albrecht and Hamilton (1982). Our values for Rmax cannot be directly compared with theirs because ours are given in hertz rather than in a normalized form. The remarkable finding is that the distributions of n and C50 for Vm (top) are statistically indistinguishable from those obtained for spikes (bottom; t test, p < 0.1). These data imply that, as in the examples of Figure 4, the shapes of the CRFs are similar for Vm and spike rates. The distributions for Rmax cannot be directly compared (hertz vs millivolts) but it is noteworthy that the shapes of these two distributions are distinctly different.
Figure 6.

Distributions of the parameters from the best fitting hyperbolic ratio functions for the Vm and spike responses for all cells. A, Vm (top) and spike (bottom) responses had similar mean values (indicated in each histogram) for the exponent (n) and the semisaturation constant (C50). Rmax is not comparable because for Vm it is given in millivolts and for spikes it is in Hertz. B, Scatter plots of exponent (left) and C50 (right) from Vm (x-axis) and spike responses (y-axis) for all cells. The main diagonal (with slope 1) is shown as a dashed line. Cells above the main diagonal have lower parameter values for Vm than for spikes; cells below the diagonal have lower parameter values for spikes than for Vm.
The similarity of the distributions of the exponent and the C50 for CRFs obtained with spike rates and Vm does not exclude the possibility that individual cells or cell classes show specific relationships between the parameters for Vm and spikes. For example, FS cells, because of their high firing rates could show steeper CRFs for spikes than for Vm and thus show higher values in the exponent for spikes, suggesting an effect of the spike threshold in increasing the sensitivity to contrast in that population. To explore this possibility, we plotted the values of the exponent and the C50 from Vm responses against those from spike responses for all cells (Fig. 6B). If the values of exponent and C50 derived from spike rates and Vm were identical for all cells, all the points would fall on the dashed line of unit slope. In fact, there is considerable variability from cell to cell, and the relationship between parameters obtained from spikes and Vm is weak. The majority of points are near the line, and the points are balanced about the line of unit slope (i.e., as many points fall below the line as above it). The cells above the diagonal for the value of exponent had steeper slopes for spikes than for Vm, suggesting a role for the spike threshold in enhancing the sensitivity of the cell. But cells with values below the diagonal suggest the opposite, i.e., that the Vm actually had more sensitivity to contrast than the spike output of the cell. Similar reasoning is applicable to the distribution of values of C50; the cells whose C50s fall above the diagonal tend to have CRFs with higher thresholds for spikes than for Vm, an expected effect of the spike threshold mechanism. However, for the cells whose C50s fall below the diagonal, significant spiking activity has been triggered without a significant change in the underlying Vm.
We draw two conclusions from the data presented so far. First, the hyperbolic ratio function captures the essence of the relationships between contrast and both the membrane potential and firing rate of V1 neurons. This indicates that the Vm already exhibits the characteristic shape of the CRFs observed extracellularly: the expansive nonlinearity at low contrasts, the saturation at high contrasts, and the intervening quasilinear portion. Second, in spite of the threshold for spike generation, the CRFs of most individual cells are quite similar when taken from Vm and spike rates. These data also demonstrate that CRFs from our relatively small sample of cells (n = 58) is representative of the distributions of CRFs found in the primary visual cortex in general (Albrecht and Hamilton, 1982) and that the intracellular recording technique did not introduce any unhealthy bias in the behavior of our population of cells. Also, in the study by Albrecht and Hamilton (1982), there was no clustering of the values of the spike responses, suggesting that cells cannot be grouped in categories on the basis of their CRFs. This does not contradict our results, because we only observed grouping on the basis of Rmax, a value that was normalized in their study.
We also use the parameters of the best fitting hyperbolic ratio function to compare the CRFs of cells belonging to the eight classes defined jointly on the basis of their electrophysiological and functional properties. These data are presented for our entire population in Figure 7A. Here, each star represents a cell and each row corresponds to the cell classification. The exponent (left), C50 (middle column), and Rmax (right) for each cell are given for both Vm (top) and spikes (bottom). Below each set of asterisks, the mean and standard error of the parameters for each set of cells is depicted as a circle and a line, respectively. Because the numbers of cells in each group are small, we compared the groups using the Kolmogorov-Smirnov test, a nonparametric statistic.
Figure 7.
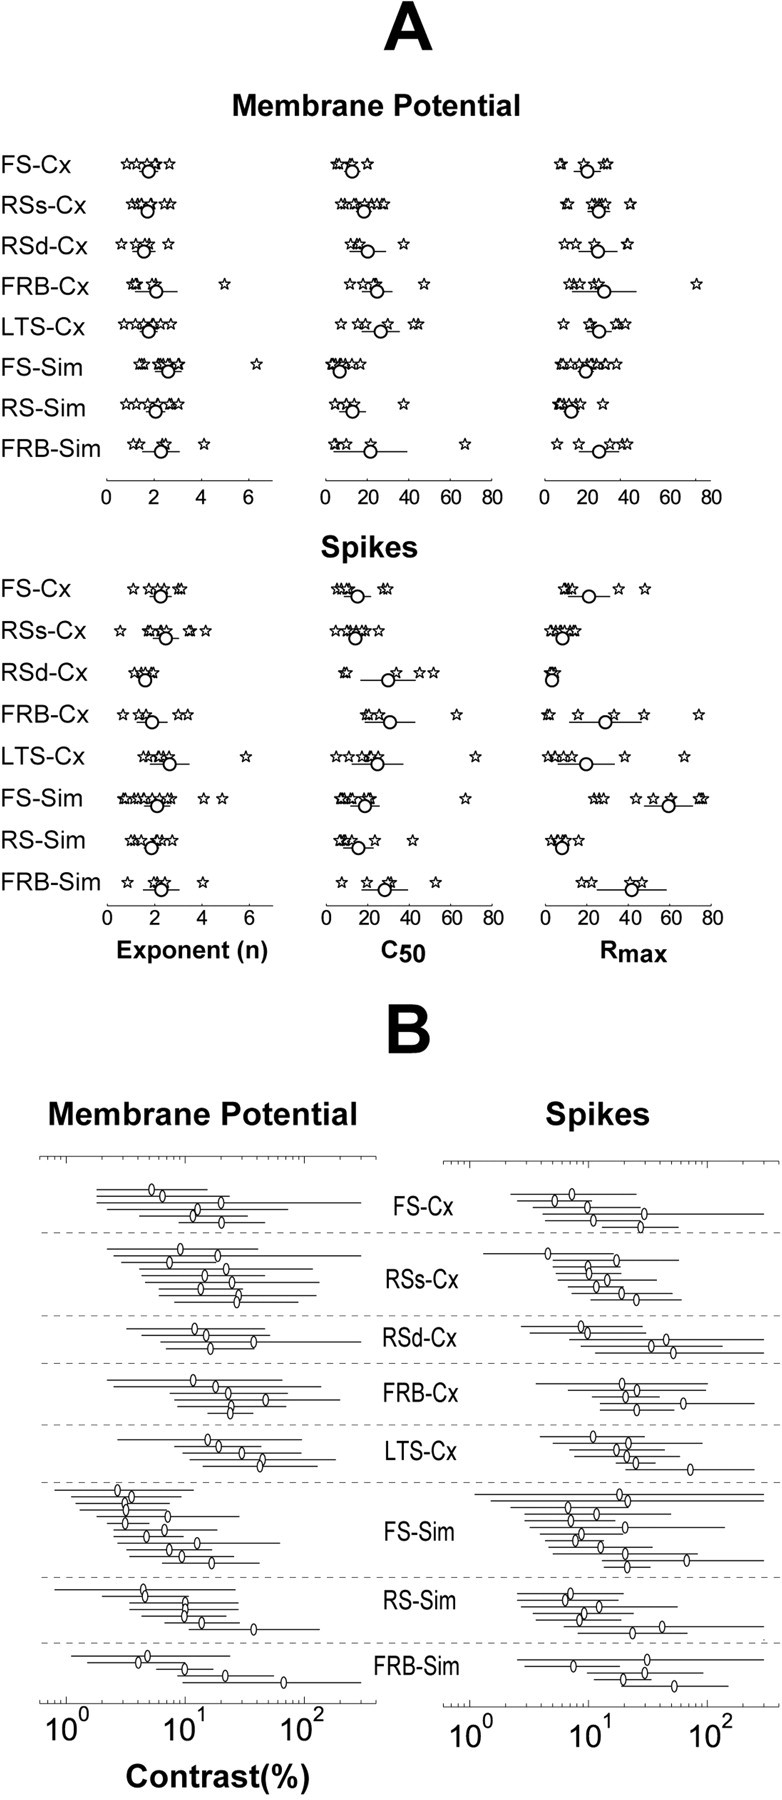
Values of the parameters from the best-fit hyperbolic ratio function for all cells and their dynamic ranges. A, Cell groups (n = 8, see Results) are indicated on the left. Top, Values from Vm responses; bottom, values from spike responses. Stars represent single cells; circles and lines represent the mean and the standard error for each group. B, Dynamic range is represented by the horizontal lines. Open circles denote the mean of the C50 for each cell. Cell classes separated by dotted lines are indicated in the middle column. Dynamic range varied considerably from cell to cell but each cell class covered the whole range of contrasts used, both for the Vm (left) and the spike responses (right). Cx, Complex; Sim, simple.
Differences between cell groups based on CRFs taken from Vm are generally small, and most were not statistically significant. There were three exceptions: (1) The Vm response of simple cells had a higher exponent (2.36 ± 1.1; mean ± SD) than complex cells (1.78 ± 0.8; p < 0.005). (2) The Vm response of simple cells had a lower C50 (11.6 ± 14.1) than the Vm response of complex cells (20.5 ± 11.2; p < 0.001). (3) The Vm response of all FS cells had a lower C50 (8.7 ± 5.7) than all RS cells (16.8 ± 9.8; p < 0.025). These results indicate that the Vm response of simple cells is steeper (higher exponent) and more sensitive to lower values of contrast (lower C50) than complex cells, although these differences in the Vm response are not manifested in the spike output (see below). Finally, the Vm of FS cells (simple and complex) is more sensitive at low contrasts (smaller C50) than RS cells.
Differences between cell groups based on CRFs obtained for spike rates were not statistically significant for either C50 or the exponent. The most striking differences between cell groups were in the Rmax of the CRFs obtained with spike rates. These differences are summarized in Figure 8. Specifically, Rmax derived from the spike response was: (1) higher for all simple (39.4 ± 31.3 Hz) than for all complex cells (16 ± 4.2 Hz; p < 0.005); (2) higher for all FS (46.6 ± 30.1 Hz) than for all RS cells (7 ± 4.2 Hz; p < 0.001); (3) higher for FS simple (59.4 ± 27.3 Hz) than for RS simple cells (8 ± 3.9 Hz; p < 0.001); (4) higher for FRB simple (41.7 ± 25.1 Hz) than for RS simple (8 ± 3.9 Hz); (5) higher for FS complex (21.1 ± 16.6 Hz) than for all RS complex (superficial and deep, 6.4 ± 4.3 Hz; p < 0.05), and finally; (6) higher for RS complex supragranular (8.3 ± 4.4 Hz) than for RS complex infragranular cells (3.2 ± 1.0 Hz; p < 0.05). From these data, it is clear that the cells with the highest firing rates were FS simple cells, followed by FRB simple and FS complex, and the cells with the lowest firing rates were the RS complex, particularly those in the infragranular layers. Strikingly, despite these large differences in spike rates, there were no significant differences between the Rmaxs of CRFs obtained with Vm for any of the cell classes (all p > 0.1).
Figure 8.

Nonparametric statistical analysis (Kolmogorov-Smirnov) of the comparisons between cell categories. Only the results of Rmax from the spike response are depicted. Boxes give the 25-75% percentile, brackets represent the minimum and maximum of the distribution, and the small square represents the median; p values are indicated in each case.
It is not obvious from the distribution of parameters shown in Figure 7A whether different cell classes respond preferentially to different ranges of contrast. To explore this possibility we plotted the dynamic range of each cell (Fig. 7B) grouped by cell class. We define dynamic range as the range of contrasts that generates from 5 to 95% of the Rmax as determined from the individual fits to the hyperbolic ratio function. This is an arbitrary range that incorporates more than just the linear central portion. The circles represent the C50 for each cell. It is evident that cells in any category collectively span the entire operating range of contrasts encountered in real-world images. These data also reflect conclusions reached in connection with Figure 7A, such as the tendency of simple cells to exhibit modulation of their Vm at lower contrasts than complex cells.
In addition to using the parameters of the best fitting hyperbolic ratio functions to compare the CRFs of cell classes, we also averaged the raw CRFs (DC component for complex cells, DC and F1 components for simple cells) for all cells in each category. The average CRFs (Fig. 9) provide an excellent illustration not only of the differences among cell classes but also of the striking dissociation between the behavior of spike rates and Vm as a function of contrast. Although there seems to be no good reason to expect this in advance, the average CRFs also exhibited a hyperbolic shape. FS cells produced higher spike rates than RS cells at all contrasts; this difference was much greater among simple cells than among complex cells (Fig. 9). FS simple cells reached spike rates above 50 Hz (F1 component) at 64% contrast, whereas RS simple cells reached values of only 6 Hz (F1 component), a difference of almost 10-fold. FS complex cells (Fig. 9, complex, top, see inset) fired at average rates slightly below 25 Hz in response to 64% contrast, whereas RS complex superficial cells fired at rates of 8 Hz and RS complex deep cells yield average frequencies of only 3 Hz. In addition, the firing rates of FS simple cells were almost twice those of FS complex cells, whereas RS simple and complex cells had very similar spike counts. FRB cells had spike rates in between those of FS and RS cells, and FRB simple cells reached 30 Hz (F1 component) at 64%, whereas FRB complex cells fired at an average 18 Hz for maximum contrast. Finally, LTS complex cells fired at rates very similar to FRB complex with maximum average rates of 14 Hz.
Figure 9.
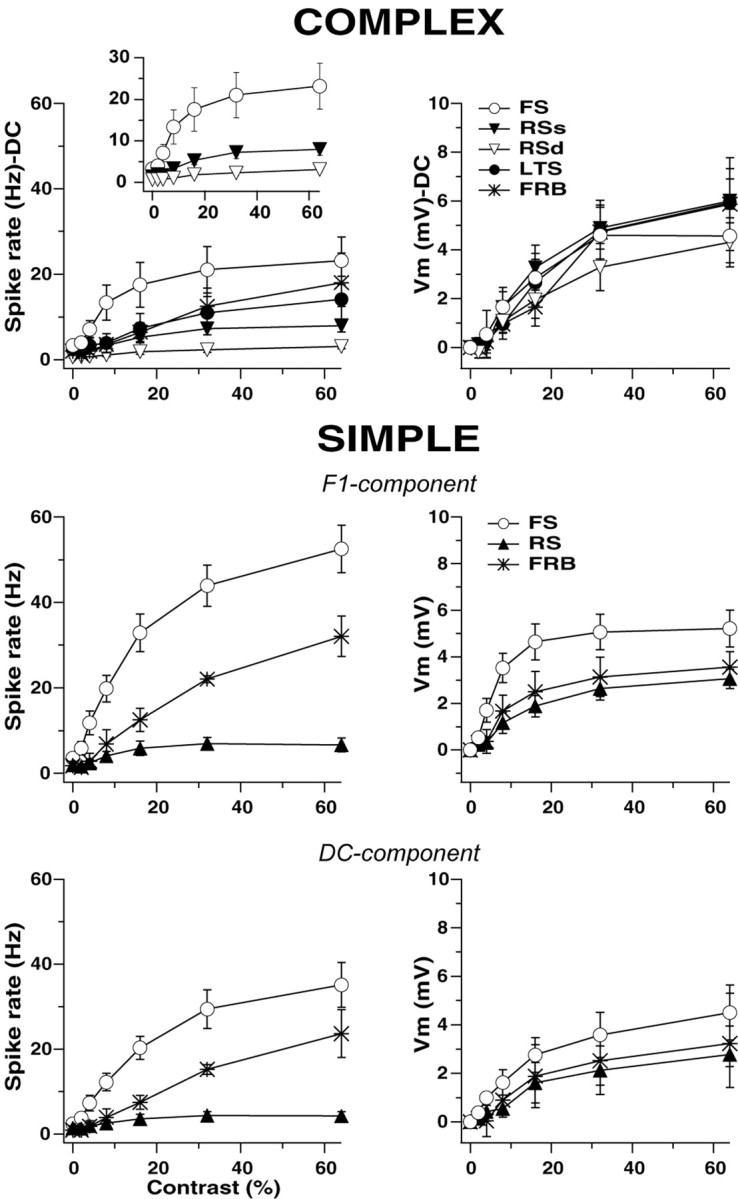
Average CRFs were constructed by simply averaging the contrast response raw data from all cells in each class. The response of complex cells (top) is the DC component of the spike rate (left) and Vm (right) responses. The response of simple cells is the F1 and the DC component also for spikes and Vm responses. Differences in the firing rates of simple and complex cells did not correspond with the small changes in Vm. The inset on top left plot shows the three complex cell classes that were significantly different (FS, RS supragranular, and RS infragranular).
The differences in the F1 component of the firing rate responses of the different simple cell classes were paralleled by strong differences in the DC component (Fig. 9, bottom). This is expected because the spike rate output of simple cell responses is a half rectified version of the sinusoidal input (there are no negative counts); therefore, higher modulation of the spike counts necessarily shifts the value of DC upward. In all three cases the values of the DC component of the spike rate response were smaller than those of the F1 component, as is expected for simple cells (Skottun et al., 1991).
However, the large differences in spike rates between cell classes were not paralleled by differences in the Vm. The average CRFs for Vm of the different classes of complex cells were almost identical (Fig. 9, complex), showing a maximum average depolarization from rest of 5-6 mV in response to 64% contrast, regardless of electrophysiological type. FS simple cells showed a slight tendency for larger depolarization than RS simple cells (F1 value of 5 vs 3 mV at 64%), hardly sufficient to account for the difference in spike rates of almost 10-fold. The differences in the Vm responses among simple cells were even smaller when comparing the DC component (Fig. 9, bottom). Interestingly, the majority of cells had a clear DC elevation in the Vm during the response to contrast (Carandini and Ferster, 2000).
The differences in firing rates among cell classes in the face of almost indistinguishable Vm responses, prompted us to explore the relationship between Vm and firing rate for cells in each class, during the response to visual stimuli differing only in contrast. Because the shape of the CRFs obtained for Vm and spike rates are similar but cells vary widely in their firing rates, we may anticipate that the relationship between Vm and spike rate is linear but with large differences in slope between the cell classes. Evidence that this is so is presented in Figure 10. In Figure 10A, we show plots of spike rate as a function of Vm for two simple cells (top) and two complex cells (bottom). In these and in the majority of cells (53 of 58), the relationship between Vm and the spike rate is indeed linear. The RS cells (left) have low slopes and the FS cells (right) have high slopes. The average slopes for each cell category are given in Figure 10B (left) and, as a measure of the goodness of the linear fit, the average correlation coefficients (all ≥0.9) are shown on the right. FS simple cells showed the highest slopes (9.2 Hz/mV), followed by FRB simple cells (8 Hz/mV) and FS complex cells (3.9 Hz/mV), whereas RS complex cells had the lowest slopes (RS infragranular, 0.8 Hz/mV; RS supragranular 1.1 Hz/mV).
Figure 10.

Relationship between Vm and firing rate. A, Plots of firing rate against Vm for four representative cells. The slope for the best linear fit and the correlation coefficient (r) are indicated. Neurons are arranged as in Figures 3 and 4. B, The distribution of average slopes for each cell class (left) and the average correlation coefficient for each cell class (right).
Discussion
A striking feature of the organization of the neocortex is its large diversity of cell types. Neurons can be differentiated and classified according to their morphology, laminar location, neurotransmitter and cotransmitters, calcium-binding proteins, firing patterns, and more. These properties are, for the most part, independent of the cortical area in which neurons are located. Likewise, from the functional point of view, cortical neurons are diverse and exhibit a high degree of selectivity across many functional dimensions. How do functional properties, which are location-specific, relate to the global, location-independent properties? These questions are hard to answer, because they require a complex combination of techniques, including, obligatorily, intracellular recordings in vivo.
In primary visual cortex (V1), neurons are selective along many stimulus dimensions, such as spatial position and phase, temporal and spatial frequency, orientation, direction of motion, and binocular disparity. Yet functionally they are classified into two qualitatively distinct categories, simple and complex. There is a surprising lack of knowledge of how global cellular properties distribute among simple and complex cells and how such properties relate to the functional selectivity of the cell. Here we have related the intrinsic electrophysiological properties of cells in cat V1 to one fundamental aspect of the visual response: the response to contrast.
The main results of this work can be summarized as follows: (1) The best description of the relationships between contrast and both spike rate and Vm is provided by the hyperbolic ratio function. (2) The values of the exponents and the C50s obtained from spike responses have means and distributions similar to those obtained from the Vm responses. (3) The values of Rmax from the spike rate response are significantly different among cell categories: Among simple cells, FS cells have the highest values, followed by FRB and RS cells. Among complex cells, FS cells also show the highest Rmax values followed by RS supragranular, and finally by RS infragranular. FRB complex and LTS complex cells have values of Rmax in between FS and RS cells, but the differences are not significant. (4) Despite the large differences in spike rates, the Vm response from all cell classes is very similar. (5) Finally, all LTS cells are complex.
Functional implications of the CRF nonlinearities: comparison between Vm and spike responses
A first step toward understanding the mechanism underlying the nonlinearities that characterize the CRF is to compare the response of the Vm, which represents the summed input to the cell, with the spike rate response, which represents the output. Our results show that the Vm and the spike responses are very similar. This similarity is in complete agreement with the linear relationship between Vm and spike rate that we report here (Fig. 10) and that was previously suggested by the linear rectification model of Carandini and Ferster (2000). The linear relationship between Vm and the spike rate seems to argue against a postsynaptic cellular mechanism, such as the spike threshold or intrinsic nonlinear electroresponsive properties, as the origin of the nonlinearities present in the CRF.
It has already been suggested by Barlow (1972), that at every stage of the visual system there should be an enhancement of stimulus selectivity, in other words, a progressive narrowing of the tuning properties of cells. This enhancement may be based on the effect of passing the visual input through neuronal elements with exponents greater than 1 and is supported by data showing an increase in the exponent of the CRFs from the thalamus (1.6 in Sclar et al., 1990; 1.4 in our unpublished data; n = 30) to the primary visual cortex (2.4 in Sclar et al., 1990; 2.9 in Albrecht and Hamilton, 1982; 2.2 in this study) to 3.0 in the middle temporal visual area (Sclar et al., 1990). However, this prediction does not seem to apply to local cortical circuits: although there seems to exist an orderly progression of activation across layers (Douglas and Martin, 1991; Yuste et al., 1997; Contreras and Llinas, 2001; Martinez and Alonso, 2001), the exponent value showed a homogeneous distribution against depth (data not shown).
Given the difference in the spike response between LGN and V1 cortical cells (Sclar et al., 1990) one would expect the Vm response of simple cells to reflect the properties of the LGN input: namely, lower exponent, higher saturation contrasts, and consequently wider dynamic range. However, both simple and complex cells showed Vm responses that were similar to their spike responses. This finding is consistent with the fact that the main source of synaptic input to cortical cells in all layers is from other cortical cells. Thus, although the input to the cortex is hyperbolic with contrast, the overall activity of the cortical network seems to raise the exponent and increase the selectivity of cortical neurons.
Although parameter values of Vm and spike responses were similar when comparing populations, the representation of values on a cell-by-cell basis (scatter plot in Fig. 6B) revealed a paradox. Cells with a higher exponent for Vm than for the spike response (cells below the main diagonal) should show a narrower orientation and spatial frequency tuning for Vm than for spike rates. However, ample experimental evidence from our unpublished data and from others (Ferster and Miller, 2000) shows that the tuning of the spike rate responses is always narrower than that of Vm. To resolve this paradox it will be necessary to obtain CRFs (both for Vm and spikes) at each of many spatial frequencies (or orientations). For example, such an experiment might reveal that Rmax scales differently for Vm and spikes as the orientation is changed away from optimal. This seems more likely than differential changes in the exponent or C50 of spikes and Vm, because such changes would have the additional effect of changing the contrast at which saturation occurs, a result incompatible with the known contrast independence of orientation selectivity.
Conversely, cells with a smaller exponent value for Vm than for spikes, should have broader tuning for Vm than for spikes, which is in agreement with the experimental evidence mentioned above.
In the case of C50 (Fig. 6B, right), cells located above the diagonal have lower C50s for Vm than for spikes, which coincides with the intuitive notion that the Vm depolarizes before the firing rate increases in response to contrast. Cells below the main diagonal have lower values of C50 for spikes than for Vm, which implies that spike rates increase before changes are visible at the level of Vm. This result strongly suggests that factors other than the average increase in Vm drive action potential generation in those cells. We propose that this role is played by the variance of the Vm; therefore, we predict that cells with lower values of C50 for spikes than for Vm will show an increase in Vm variance with contrast, proportional to the increase in firing rate.
Intrinsic electrophysiological properties
The electrophysiological cell categories are usually revealed, and have been extensively studied, by means of current injection through the recording micropipette (Llinas, 1988). However, little is known about the role different electrophysiological properties may play in shaping the responses of neurons to natural stimuli. Our results show that the differences in intrinsic electrophysiological properties between classes of visual cortical cells established on the basis of their responses to current injection, also differentiate these cells in their input-output relationship when responding to visual stimuli. More specifically, we show here, that the differences between cell categories in their response to contrast reside in the slope of the relationship between Vm and spike rate. Such differences in slope lead to significant differences in the values of Rmax of the spike response despite the small and nonsignificant differences in the Rmax of the Vm response.
Contextual effects
It is well known that the presence of stimuli outside of the RF may facilitate or depress the response to stimuli concomitantly presented within the RF (Polat et al., 1998; Sengpiel et al., 1998; Kapadia et al., 1999; Freeman et al., 2001; Walker et al., 2002). A recent network model (Somers et al., 1998; Dragoi and Sur, 2000) proposes that local recurrent inhibition is the key element that controls the contrast- and orientation-dependent effects of the modulatory surround stimuli. The model proposes that a higher gain of local inhibitory cells results in the predominance of inhibition in the local network when the excitatory drive to the network is increased. Here we show that indeed the output (in spikes per second) of FS cells increases proportionally more than the output of RS cells when contrast increases. However, this is not attributable to a higher gain in the response to contrast, because RS and FS cells are indistinguishable on the basis of their C50s (Fig. 7A), exponents (Fig. 7A), and dynamic ranges (Fig. 7B). Instead, the higher firing rates of FS cells are based on their steeper relationship between Vm and the spike rate (Fig. 10).
Footnotes
This work was supported by National Eye Institute Grant RO1 EY 013984.
Correspondence should be addressed to Dr. Diego Contreras, Department of Neuroscience, University of Pennsylvania School of Medicine, 215 Stemmler Hall, Philadelphia, PA 19106-6074. E-mail: diegoc@mail.med.upenn.edu.
Copyright © 2003 Society for Neuroscience 0270-6474/03/236936-10$15.00/0
References
- Albrecht DG, Hamilton DB ( 1982) Striate cortex of monkey and cat: contrast response function. J Neurophysiol 48: 217-237. [DOI] [PubMed] [Google Scholar]
- Azouz R, Gray CM, Nowak LG, McCormick DA ( 1997) Physiological properties of inhibitory interneurons in cat striate cortex. Cereb Cortex 7: 534-545. [DOI] [PubMed] [Google Scholar]
- Barlow HB ( 1972) Single and sensation: a neuron doctrine for perceptual psychology? Perception 1: 371-394. [DOI] [PubMed] [Google Scholar]
- Carandini M, Ferster D ( 2000) Membrane potential and firing rate in cat primary visual cortex. J Neurosci 20: 470-484. [DOI] [PMC free article] [PubMed] [Google Scholar]
- Connors BW, Gutnick MJ ( 1990) Intrinsic firing patterns of diverse neocortical neurons. Trends Neurosci 13: 99-104. [DOI] [PubMed] [Google Scholar]
- Connors BW, Gutnick MJ, Prince DA ( 1982) Electrophysiological properties of neocortical neurons in vitro. J Neurophysiol 48: 1302-1320. [DOI] [PubMed] [Google Scholar]
- Contreras D, Llinas R ( 2001) Voltage-sensitive dye imaging of neocortical spatiotemporal dynamics to afferent activation frequency. J Neurosci 21: 9403-9413. [DOI] [PMC free article] [PubMed] [Google Scholar]
- de la Pena E, Geijo-Barrientos E ( 1996) Laminar localization, morphology, and physiological properties of pyramidal neurons that have the low-threshold calcium current in the guinea-pig medial frontal cortex. J Neurosci 16: 5301-5311. [DOI] [PMC free article] [PubMed] [Google Scholar]
- DeFelipe J ( 1993) Neocortical neuronal diversity: chemical heterogeneity revealed by colocalization studies of classic neurotransmitters, neuropeptides, calcium-binding proteins, and cell surface molecules. Cereb Cortex 3: 273-289. [DOI] [PubMed] [Google Scholar]
- Douglas RJ, Martin KA ( 1991) A functional microcircuit for cat visual cortex. J Physiol (Lond) 440: 735-769. [DOI] [PMC free article] [PubMed] [Google Scholar]
- Dragoi V, Sur M ( 2000) Dynamic properties of recurrent inhibition in primary visual cortex: contrast and orientation dependence of contextual effects. J Neurophysiol 83: 1019-1030. [DOI] [PubMed] [Google Scholar]
- Ferster D, Miller KD ( 2000) Neural mechanisms of orientation selectivity in the visual cortex. Annu Rev Neurosci 23: 441-471. [DOI] [PubMed] [Google Scholar]
- Freeman RD, Ohzawa I, Walker G ( 2001) Beyond the classical receptive field in the visual cortex. Prog Brain Res 134: 157-170. [DOI] [PubMed] [Google Scholar]
- Gray CM, McCormick DA ( 1996) Chattering cells: superficial pyramidal neurons contributing to the generation of synchronous oscillations in the visual cortex. Science 274: 109-113. [DOI] [PubMed] [Google Scholar]
- Hubel DH, Wiesel TN ( 1962) Receptive fields, binocular interaction and functional architecture in the cat's visual cortex. J Physiol (Lond) 160: 106-154. [DOI] [PMC free article] [PubMed] [Google Scholar]
- Kapadia MK, Westheimer G, Gilbert CD ( 1999) Dynamics of spatial summation in primary visual cortex of alert monkeys. Proc Natl Acad Sci USA 96: 12073-12078. [DOI] [PMC free article] [PubMed] [Google Scholar]
- Llinas RR ( 1988) The intrinsic electrophysiological properties of mammalian neurons: insights into central nervous system function. Science 242: 1654-1664. [DOI] [PubMed] [Google Scholar]
- Llinas RR, Grace AA, Yarom Y ( 1991) In vitro neurons in mammalian cortical layer 4 exhibit intrinsic oscillatory activity in the 10- to 50-Hz frequency range. Proc Natl Acad Sci USA 88: 897-901. [DOI] [PMC free article] [PubMed] [Google Scholar]
- Martinez LM, Alonso JM ( 2001) Construction of complex receptive fields in cat primary visual cortex. Neuron 32: 515-525. [DOI] [PubMed] [Google Scholar]
- McCormick DA, Connors BW, Lighthall JW, Prince DA ( 1985) Comparative electrophysiology of pyramidal and sparsely spiny stellate neurons of the neocortex. J Neurophysiol 54: 782-806. [DOI] [PubMed] [Google Scholar]
- Movshon JA, Thompson ID, Tolhurst DJ ( 1978a) Receptive field organization of complex cells in the cat's striate cortex. J Physiol (Lond) 283: 79-99. [DOI] [PMC free article] [PubMed] [Google Scholar]
- Movshon JA, Thompson ID, Tolhurst DJ ( 1978b) Spatial summation in the receptive fields of simple cells in the cat's striate cortex. J Physiol (Lond) 283: 53-77. [DOI] [PMC free article] [PubMed] [Google Scholar]
- Nunez A, Amzica F, Steriade M ( 1992) Voltage-dependent fast (20-40 Hz) oscillations in long-axoned neocortical neurons. Neuroscience 51: 7-10. [DOI] [PubMed] [Google Scholar]
- Ohzawa I, Sclar G, Freeman RD ( 1982) Contrast gain control in the cat visual cortex. Nature 298: 266-268. [DOI] [PubMed] [Google Scholar]
- Polat U, Mizobe K, Pettet MW, Kasamatsu T, Norcia AM ( 1998) Collinear stimuli regulate visual responses depending on cell's contrast threshold. Nature 391: 580-584. [DOI] [PubMed] [Google Scholar]
- Sanchez-Vives MV, Nowak LG, McCormick DA ( 2000) Membrane mechanisms underlying contrast adaptation in cat area 17 in vivo. J Neurosci 20: 4267-4285. [DOI] [PMC free article] [PubMed] [Google Scholar]
- Schwindt P, Crill W ( 1999) Mechanisms underlying burst and regular spiking evoked by dendritic depolarization in layer 5 cortical pyramidal neurons. J Neurophysiol 81: 1341-1354. [DOI] [PubMed] [Google Scholar]
- Schwindt PC, Spain WJ, Foehring RC, Stafstrom CE, Chubb MC, Crill WE ( 1988) Multiple potassium conductances and their functions in neurons from cat sensorimotor cortex in vitro. J Neurophysiol 59: 424-449. [DOI] [PubMed] [Google Scholar]
- Sclar G, Maunsell JH, Lennie P ( 1990) Coding of image contrast in central visual pathways of the macaque monkey. Vision Res 30: 1-10. [DOI] [PubMed] [Google Scholar]
- Sengpiel F, Baddeley RJ, Freeman TC, Harrad R, Blakemore C ( 1998) Different mechanisms underlie three inhibitory phenomena in cat area 17. Vision Res 38: 2067-2080. [DOI] [PubMed] [Google Scholar]
- Skottun BC, De Valois RL, Grosof DH, Movshon JA, Albrecht DG, Bonds AB ( 1991) Classifying simple and complex cells on the basis of response modulation. Vision Res 31: 1079-1086. [DOI] [PubMed] [Google Scholar]
- Somers DC, Todorov EV, Siapas AG, Toth LJ, Kim DS, Sur M ( 1998) A local circuit approach to understanding integration of long-range inputs in primary visual cortex. Cereb Cortex 8: 204-217. [DOI] [PubMed] [Google Scholar]
- Steriade M, Timofeev I, Durmuller N, Grenier F ( 1998) Dynamic properties of corticothalamic neurons and local cortical interneurons generating fast rhythmic (30-40 Hz) spike bursts. J Neurophysiol 79: 483-490. [DOI] [PubMed] [Google Scholar]
- Walker GA, Ohzawa I, Freeman RD ( 2002) Disinhibition outside receptive fields in the visual cortex. J Neurosci 22: 5659-5668. [DOI] [PMC free article] [PubMed] [Google Scholar]
- Yuste R, Tank DW, Kleinfeld D ( 1997) Functional study of the rat cortical microcircuitry with voltage-sensitive dye imaging of neocortical slices. Cereb Cortex 7: 546-558. [DOI] [PubMed] [Google Scholar]