Abstract
Up states are prolonged membrane potential depolarizations critical for synaptic integration and action potential generation in cortical and striatal neurons. They commonly result from numerous concurrent synaptic inputs, whereas neurons reside in a down state when synaptic inputs are few. By quantifying the composition, frequency, and amplitude of synaptic inputs for both states, we provide important constraints for state transitions in striatal network dynamics.
Up and down states occur naturally in cortex-striatum-substantia nigra cocultures, which were used as an in vitro model in the present study. Spontaneous synaptic inputs during down states were extracted automatically in spiny projection neurons and fast spiking interneurons of the striatum using a newly developed computer algorithm. Consistent with a heterogeneous population of synaptic inputs, PSPs and PSCs showed no correlation in amplitude and rise time and occurred at relatively low frequencies of 10-40 Hz during the down state. The number of synaptic inputs during up states, estimated from the up-state charge and the unitary charge of down-state PSCs, was 217 ± 44. Given the average up-state duration of 284 ± 34 msec, synaptic input frequency was ∼800 Hz during up-states for both neuronal types. Many down-state events reversed at the chloride reversal potential and were blocked by GABAA antagonists. The high correlation between up- and down-state reversal potential suggests that despite these drastic changes in synaptic input frequency, the ratio of inhibitory to excitatory currents is similar during both states.
Keywords: striatum, up state, down state, spiny projection neuron, fast spiking interneuron, population statistics, synaptic inputs, organotypic culture
Introduction
Described first in the striatum (Wilson and Groves, 1981), up states are now recognized as an important feature of striatal and cortical neurons in vivo that govern synaptic integration and action potential generation (Wilson and Kawaguchi, 1996; Stern et al., 1997; Lampl et al., 1999). At the level of intracellular membrane potential, up states are readily recognized as large deflections to a subthreshold potential of -55 mV from a more hyperpolarized down-state potential near -80 mV (Reynolds and Wickens, 2000; Goto and O'Donnell, 2001). In the striatum, spiny projection neurons fire action potentials only during the up state (Wilson and Groves, 1981; Wilson and Kawaguchi, 1996), and, thus, a detailed analysis of up-state generation provides important insight into how these neurons control basal ganglia outputs.
A key step in understanding up- and down-state transitions is the identification and quantification of synaptic inputs during both states. Because of their synchronization with local field potentials (Steriade et al., 1993) and the high correlation of up states between nearby neurons (Stern et al., 1998; Lampl et al., 1999), up states are considered periods of increased network activity during which neurons receive numerous synaptic inputs. Although intrinsic currents shape up- and down-state transitions to some extent (Gruber et al., 2003), intracellular application of sodium, potassium, and calcium current blockers does not change up-state duration (Wilson and Kawaguchi, 1996), suggesting that, at least in striatal spiny projection neurons, up states are driven synaptically. For striatal neurons, the main depolarizing, glutamatergic input that initiates a transition to the up state originates from the corticostriatal pathway (Kincaid et al., 1998; Zheng and Wilson, 2002). However, glutamate is not the only depolarizing transmitter in the striatum. Intrastriatal GABAergic inputs from spiny projection neurons (Czubayko and Plenz, 2002; Tunstall et al., 2002) and striatal fast spiking interneurons (Kawaguchi, 1993; Plenz and Kitai, 1998a; Koos and Tepper, 1999) are depolarizing at rest in spiny projection neurons (for review, see Plenz, 2003). Thus, the first step toward determining whether GABAergic inputs also play a role in up-state generation is to quantify the proportion of GABAergic inputs during down states and up states.
The present study, thus, estimates synaptic inputs to striatal neurons during up and down states in cortex-striatum-substantia nigra organotypic cultures. Inputs to both fast spiking interneurons and spiny projection neurons are evaluated because both receive direct cortical inputs (Bennett and Bolam, 1994; Ramanathan et al., 2002) and local synaptic inputs (Kita et al., 1990). Also, fast spiking interneurons provide inhibition to spiny projection neurons (Plenz and Kitai, 1998a; Koos and Tepper, 1999); thus, up-state transitions in spiny projection neurons cannot be completely understood without knowledge of fast spiking interneuron activity during up states. The coculture system, which contains a mature and functionally intact dopaminergic nigrostriatal pathway (Plenz and Kitai, 1996, 1998b; Becq et al., 1999), exhibits up and down states (Plenz and Aertsen, 1996b; Plenz and Kitai, 1998a; Kerr and Plenz, 2002) because of the spontaneous activity of the cortical culture that is relayed to the striatal culture by corticostriatal projection neurons. This in vitro system also permits visual selection of neuronal type, without which recordings from fast spiking interneurons are unlikely. These measurements of synaptic inputs during up and down states illuminate mechanisms that control transitions between states.
Materials and Methods
Preparation of organotypic cultures
Cortex-striatum-substantia nigra organotypic cultures were prepared from coronal sections of rat brains (350-500 μm; Sprague Dawley; Taconic Farms, Germantown, NY) at postnatal days 0-2. Slices containing the striatum and the cortex were cut on a vibroslicer (VT 1000 S; Leica Microsystems Inc., Allendale, NJ) and were used for dissection of dorsal or dorsolateral cortical and striatal tissue. For the substantia nigra, ventrolateral sections from mesencephalic slices were taken; medial tissue regions were avoided. The tissue was placed on a coverslip with 25 μl of chicken plasma (Sigma, St. Louis, MO). Then, 25 μl of bovine thrombin [1000 NIH units (standard units that give activity of enzyme)/0.75 ml; Sigma] was added. After plasma coagulation, individual cultures were placed in culture tubes (Nunc Inc., Naperville, IL) in 800 μl of medium. The unbuffered standard medium consisted of 50% basal medium Eagle, 25% HBSS, and 25% horse serum (Invitrogen, Grand Island, NY) with 0.5% glucose and 0.5 mml-glutamine (Invitrogen) added. The cultures were rotated in a rollertube incubator set to 0.6 rpm (Heraeus GmbH, Göttingen, Germany) at 35°C in normal atmosphere (Gähwiler, 1981; Plenz and Kitai, 1996). After 3 and 27 d in vitro (DIV), 10 μl of mitosis inhibitor was added for 24 hr (4.4 mm cytosine-5-b-arabino-furanoside, 4.4 mm uridine, and 4.4 mm 5-fluorodeoxyuridine; calculated to final concentration; all from Sigma). Medium was changed every 3-5 d.
Whole-cell patch recordings
For electrophysiological recording, cultures were placed in a custom-made heated recording chamber and maintained at 35.5 ± 0.5°C (TC-20; NPI, Tamm, Germany). Cultures were submerged in artificial CSF (ACSF) containing (in mm): 126 NaCl, 0.3 NaH2PO4, 2.5 KCl, 0.3 KH2PO4, 1.6 CaCl2, 1.0 MgCl2, 0.4 MgSO4, 26.2 NaHCO3, and 11 d-glucose saturated with 95% O2 and 5% CO2 at a flow rate of 1.8 ml/min. The osmolarity of the ACSF was 300 ± 5 mOsm. The recording chamber was mounted on an upright microscope equipped with 4× and 40× water-immersion objectives (BX-50; Olympus, Tokyo, Japan) and Hoffmann Modulation Contrast optics (40×). The microscope was placed on a custom-made sliding table allowing a change in field of view during the experiment. Patch pipettes for somatic whole-cell recordings were pulled (outside diameter, 1.5 mm; inside diameter, 0.75; P-97; Sutter Instruments, Novato, CA) and fire-polished to a resistance of 12.8 ± 3.6 MΩ (MF-830; Narishige, Tokyo, Japan). The intracellular patch solution contained (in mm) 132 K-gluconate, 6 KCl, 8 NaCl, 10 HEPES, 2 Mg-ATP, and 0.39 Na-GTP and was supplemented with 2% Neurobiotin (Vector Laboratories, Burlingame, CA). The pH was adjusted to 7.2-7.4 with KOH, and the final osmolarity of the pipette solution was 290 ± 10 mOsm. To reduce degradation of ATP and GTP, the intracellular working solution was kept on ice throughout the experiment before backfilling of electrodes. For drug application, 10 μm CNQX [Research Biochemicals Inc. (RBI), Natick, MA] and 50 μm (±)-APV (RBI) were bath applied in ACSF. Picrotoxin (10 mm in ACSF; RBI) was pressure ejected locally through a glass pipette.
Identification of neuronal type was based on soma size and physiological criteria, as described below. Striatal spiny projection neurons were presumptively identified by their spherical soma with a diameter of 10-12 μm. Fast spiking interneurons were identified by their relatively large, fusiform soma. To provide more equal sample sizes for the statistical tests, we purposefully oversampled the fast spiking interneurons. Intracellular signals in voltage clamp and current clamp were recorded using Axopatch 200B amplifiers (Axon Instruments, Foster City, CA). After the formation of a Giga-seal, electrode capacitance was compensated for and serial resistance compensation was switched off. Data were preamplified (Cyberamp380; Axon Instruments), and current and voltage channels were digitized at 25 kHz during voltage and current clamp, respectively, and stored in continuous stream mode using CED1041 hardware and Spike2 software (version 3.13; Cambridge Electronic Design, Cambridge, UK). Neurons were voltage clamped at various depolarized potentials between the down-state potential (e.g., -80 to -70 mV) and -20 mV in increments of 10 mV. Spontaneous PSCs were extracted from traces after initial transients from the voltage step decayed. In cases in which neurons escaped voltage clamp and continued firing action potentials, the voltage series was terminated and the holding potential was returned to the down-state potential.
Extraction and analysis of synaptic events
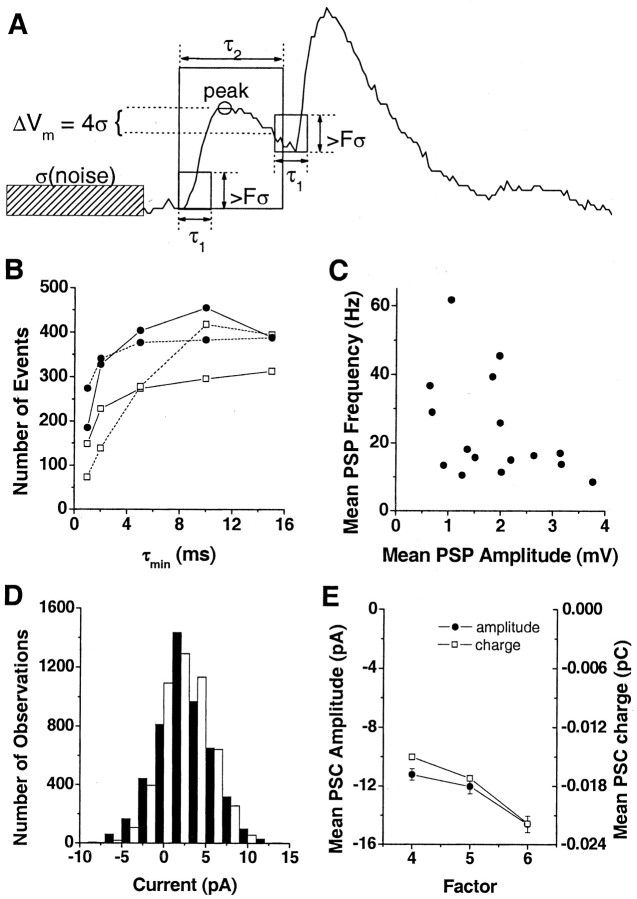
Automated event extraction. A computer algorithm written in Spike2 extracted putative down-state PSPs and PSCs using a combination of amplitude and rise time thresholds (Fig. 1 A). The amplitude threshold was expressed as a multiple, F, of the SD, σ, of the membrane potential (or holding current) noise during a synaptic input-free data segment. A PSP was detected if membrane potential deflection exceeded F·σ within the rise time τ1. Once a PSP was detected, the peak value was computed as the local maximum within the expected PSP duration, τ2, typically set to 30-50 msec. To prevent detecting the same event twice, the search for a subsequent PSP was begun once the membrane potential Vm had decayed from the peak value by ΔVm = 4·σ, but no sooner than a minimum time, τmin, from the previous peak. τmin equals τ1/2 and was set to 3 msec for PSCs and 5 or 10 msec for PSPs (based on visual inspection). Because of the higher noise in voltage-clamp recordings, the data were filtered (five-point filter) for the purpose of extracting PSCs and identifying the peak value. A second stage of smoothing was adapted to the rise time threshold by calculating the mean for each of 10 segments within τ1. If the difference between the smallest mean and the largest mean exceeded the amplitude threshold, a PSC was considered detected. Slow drift did not affect synaptic event extraction, because each current or potential deflection was evaluated with respect to a local minimum value immediately preceding the putative synaptic event (<40 msec). The threshold factor F was chosen separately for each neuron, to minimize both missed detections and false classifications, and was typically set to 4 for PSCs (4.1 ± 1.0) and 5-6 for PSPs (5.5 ± 0.9). Threshold values F·σ for spiny projection neurons did not differ significantly from thresholds for fast spiking interneurons (0.61 ± 0.14 vs 0.88 ± 0.15 mV for PSPs; 9 ± 2 vs 7 ± 1 pA for PSCs). In all cases, synaptic events were visually inspected for obvious noise artifacts.
Figure 1.
Automatic detection of spontaneous synaptic events. A, Schematic illustration of detection algorithm and critical parameters. The difference between the minimum and maximum of membrane potential is computed for a time period, τ1 (equal to twice the minimum event distance, τmin). An event is detected if the difference is greater than the amplitude threshold, Fσ, where σ is the SD of the noise and F is a multiplication factor. The peak value is computed as the local maximum within the expected event duration τ2. The search for a subsequent synaptic event begins once the membrane potential decays from the peak value by ΔVm = 4σ. B, Number of events detected as a function of minimum event distance, τmin (n = 4 spiny projection neurons). Note that the number of events varies very little when τmin is reduced from 10 msec to 5 msec or increased to 15 msec. C, Scatter plot reveals no correlation between mean event amplitude and mean event frequency. This suggests that differences in event frequency between neurons are not caused by differences in event amplitude. D, Similarity of noise from perceptually synaptic input-free data segments (▪, SD, 3.4 pA) and noise from data segments in which ionotropic glutamate and GABA receptors are blocked (□, bath application of 10 μm DNQX, 50 μm APV, and local application of 10 mm picrotoxin; SD, 2.9 pA). For the population, noise SD is 2 ± 0.18 pA. E, Effect of threshold on amplitude and charge of unitary synaptic events confirms that F = 5 is the “best” threshold for PSC detection. An increase in F to 6 significantly decreases the charge and amplitude of the mean unitary PSC by >20%, whereas a decrease in F to 4 nonsignificantly increases the charge and amplitude of the mean unitary PSC by only ∼10%.
The validity and robustness to parameters of the algorithm were demonstrated with several analyses to reinforce the veracity of the quantitative results. First, the number of events detected varied little for 5 < τmin < 16 msec (Fig. 1 B), which was the working range in the present study. This working range restricted the maximum frequency of detected events to 67-200 Hz; however, the mean frequency of detected events in the down state was well below this range. Second, the frequency of events was not correlated with mean amplitude (Fig. 1C), confirming that the amplitude threshold parameter F·σ did not bias the results. Third, membrane potential distributions calculated for periods that appeared free of synaptic inputs and for periods in which synaptic inputs were blocked pharmacologically were similar (Fig. 1 D). For three cells, the ratio of the SD of noise from synaptic input-blocked data to the SD of noise from synaptic input-free data was 0.85 ± 0.09, which was not significantly different from 1.0 (t = -1.62; p = 0.25). Thus, calculating detection thresholds using noise from periods that appeared free of synaptic inputs did not bias PSC extraction toward larger amplitude events.
Synaptic inputs during up states. Synaptic inputs during the up states were expressed in multiples of unitary synaptic events in the down state. First, up states in voltage-clamp recordings were defined as periods during which the clamp current exceeded the holding current by >5 SDs for at least 50 msec. Second, the up-state charge was measured as the area between the up-state current and mean holding current. The charge ratio, up-state charge divided by the charge of the average unitary PSC during down states, is an estimate of the number of down-state PSCs necessary to produce the currents observed during up states. Figure 1 E shows that the charge ratio is minimally biased by using the “perceptually best” threshold for extracting unitary events in down states (Fig. 1 E). This method of estimating synaptic inputs during the up state was validated further by comparison with the synaptic input frequency estimate using the detection algorithm. The detection algorithm was applied to up states using the same threshold as used for down states, but with a minimum event distance of 1 msec. Then, to compensate for coincident synaptic inputs detected as single inputs by the algorithm, the resulting input frequency during up states was scaled by the ratio of up-state PSC amplitude to down-state PSC amplitude.
Reversal potential calculation for down-state PSCs and up states. At each clamp potential, inward and outward currents were extracted separately and then combined to estimate the mean amplitude of the unitary PSC. Then the reversal potential of the population of down-state events was estimated from a regression of mean amplitude of unitary PSCs versus holding potential. The reversal potential of the up state was estimated from a regression of the mean up-state charge transfer versus holding potential. A fairly linear relationship between holding current and holding potential suggests good voltage-clamp conditions and that noninactivating inward currents were not activated in these experiments (R2 = 0.95 ± 0.08 SD for all neurons).
Statistical data analysis
Analysis of data was performed in Origin version 6.0 (Microcal, Southampton, MA) and the statistical software SAS (SAS Institute, Cary, NC). Differences between fast spiking and spiny projection neurons were assessed using the SAS procedure GLM for multivariate ANOVA (MANOVA) applied to basic physiological parameters, PSP characteristics, and PSC characteristics. If the MANOVA revealed significant differences, identification of specific differences was performed with individual ANOVAs. Correlation was estimated by regression analysis in Origin or the procedure CORR in SAS. Data are expressed as mean ± SEM, if not stated otherwise.
Results
Identification of striatal cell types in cortex-striatum-substantia nigra cultures
Whole-cell recordings of spiny projection neurons and fast spiking interneurons were performed in mature cortex-striatum-substantia nigra organotypic cultures that were grown, on average, for 32 ± 4 DIV (n = 17). Neurons had down-state potentials of at least -50 mV, overshooting action potential amplitude, and could fire action potentials repetitively. In response to current injections, spiny projection neurons showed a stronger inward rectification at hyperpolarized potentials and displayed a longer latency to first action potential compared with fast spiking interneurons (Fig. 2A-C). A scatter plot of action potential width versus maximum latency was used to divide the population of striatal neurons into spiny projection neurons (n = 16) and fast spiking interneurons (n = 7) (Fig. 2D). This resulted in nonoverlapping clusters in the afterhyperpolarization time versus down-state potential parameter space, which confirmed our primary classification (Fig. 2E). These electrophysiological differences (Table 1) are similar to those described in morphologically identified spiny projection neurons and fast spiking interneurons (Kawaguchi, 1993; Plenz and Aertsen, 1996a; Plenz and Kitai, 1998a; Koos and Tepper, 1999).
Figure 2.
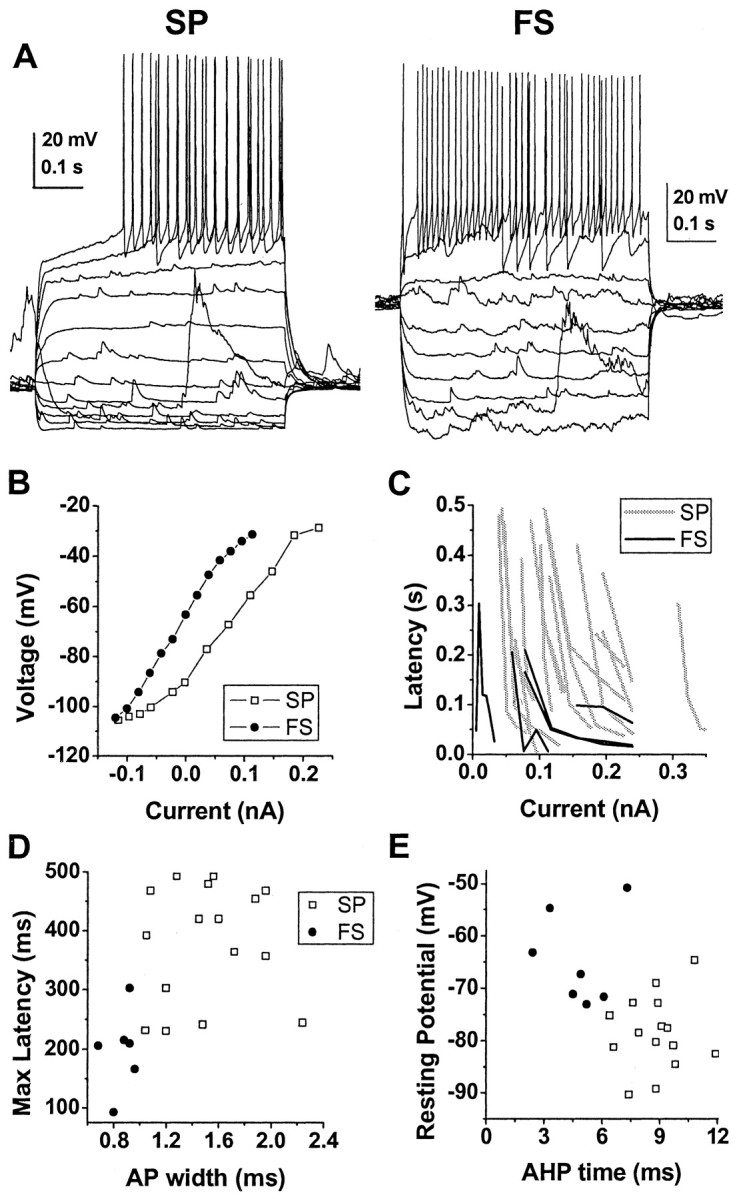
Differences in electrophysiological characteristics of spiny projection neurons (SP) and fast spiking interneurons (FS) recorded with whole-cell patch pipettes in current clamp. A, Responses of an SP and an FS to somatic current-pulse injections. B, Steady-state current-voltage plot for SP and FS. C, Latency to first action potential as a function of current injection for each neuron. Note the increased latency for SP (gray lines) compared with FS (black lines) independent of current strength. D, Scatter plot of maximum observed latency to first action potential versus action potential (AP) width. E, Scatter plot of down-state membrane potential versus time to maximal spike afterhyperpolarization (AHP). Note that spiny projection neurons and fast spiking interneurons form separate clusters in both of these two-dimensional parameter spaces.
Table 1.
Electrophysiological characteristics of striatal spiny projection neurons and fast spiking interneurons in cortex-striatum-substantia nigra cultures
|
Characteristics |
Spiny projection neuron (n=16) |
Fast spiking interneuron (n=7) |
|---|---|---|
| Down-state potential (mV) | −79.2 ± 1.9 | −64.5 ± 3.3** |
| Input resistance (MΩ)a | 341 ± 36 | 287 ± 60 |
| Spike amplitude (mV)b | 61.5 ± 2.4 | 57.1 ± 5.0 |
| Spike width (msec)c | 1.51 ± 0.09 | 0.83 ± 0.05 |
| AHPmax (mV) | 14.1 ± 0.8 | 17.3 ± 2.0 |
| Time to AHPmax (msec) | 8.8 ± 0.4 | 4.8 ± 0.6** |
| Latency to first spike (msec)d
|
379 ± 25
|
199 ± 28
|
Results are mean ± SEM (MANOVA:F = 18.74;p = 0.001;**ANOVA on time to AHPmax:F = 33.62;p<0.0001; ANOVA on down-state potential:F = 15.03;p = 0.0019). Spike width and latency to first spike were used to classify neurons; thus, ANOVA is inappropriate on these characteristics.
Measured using depolarizing and hyperpolarizing current pulses from down-state potential.
Spike threshold to spike peak.
Action potential width measured at half of spike amplitude.
Maximal observed latency in response to 500 msec current pulses at various current strengths.
Spontaneous synaptic inputs during the down state are similar in spiny projection neurons and fast spiking interneurons
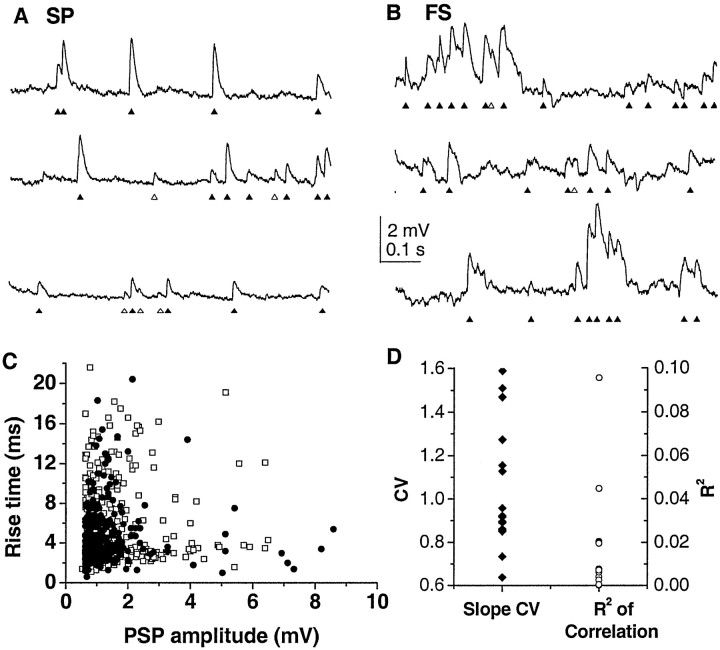
To understand the change in synaptic inputs that produces up states, we first describe synaptic inputs during the down state. Spontaneous striatal activity in cortex-striatum-substantia nigra cultures is characterized by down states that last for several seconds separated by up states of <1 sec duration (Plenz and Aertsen, 1996b; Plenz and Kitai, 1998a; Kerr and Plenz, 2002). During the down state, numerous spontaneous PSPs that resemble synaptic inputs are visible in both neuronal classes in current-clamp recordings (47 ± 15 sec down-state duration; n = 10 spiny projection neurons; n = 6 fast spiking interneurons). PSPs have a fast onset, followed by a relatively slow decay, and were always depolarizing at rest (Fig. 3A,B). The wide dispersion in rise time versus amplitude indicates that down-state PSPs are highly heterogeneous in individual cells (Fig. 3C,D) (R2 < 0.1 for all neurons) and is in contrast to the correlation between amplitude and rise time predicted by linear cable theory for a homogenous population of synaptic inputs (Rall, 1970). Furthermore, slope values are characterized by a high coefficient of variation (between 0.6 and 1.6), another demonstration that rise time and amplitude were not related (Fig. 3D). Probability density functions for PSP amplitude, 10-90% rise time, slope, and interevent interval (IEI) have long tails, with most events less than the mean but with a fair number of events with very large values (Fig. 4). No significant differences are found for mean values in amplitude, rise time, slope, and IEI between the two neuronal types (Table 2).
Figure 3.
Spontaneous synaptic events in striatal neurons during the down state (current clamp) in spiny projection neurons (SP; A) and fast spiking interneurons (FS; B). Traces represent contiguous segments. Activity is characterized by the presence of spontaneous events that resemble synaptic inputs at down-state potential. ▴, Identified events; ▵, putative events missed by the algorithm or misclassified. Down-state potential is -93 mV (SP) and -57 mV (FS), respectively. Note the occurrence of multiple PSPs with an IEI too short for the membrane potential to return to resting potential in the FS. C, Rise time versus amplitude is uncorrelated for both spiny projection neurons and fast spiking interneurons, suggesting a heterogeneous population of synapses. D, Summary of PSP slope characteristics for all neurons. Low R2 values indicate the absence of correlation between PSP amplitude and PSP rise time. Similarly, relatively high coefficient of variation (CV) values demonstrate large variations in PSP slope for all neurons.
Figure 4.
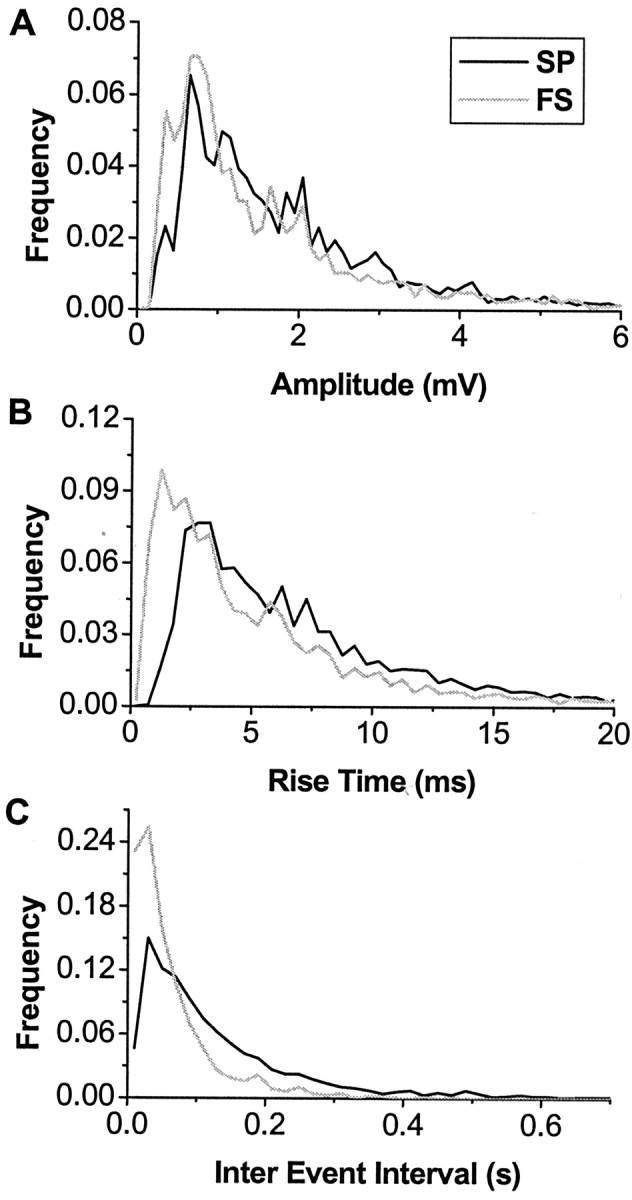
Density function of spontaneous postsynaptic events for the population of spiny projection neurons (SP) and fast spiking interneurons (FS) in current clamp. Amplitude (A), rise time (B), and population IEI (C) distributions do not differ between both classes.
Table 2.
Electrophysiological parameters for spontaneous putative synaptic events during the down state in current clamp (PSP) and voltage clamp (PSC)
|
|
Spiny projection neuron (n = 11) |
Fast spiking interneuron (n = 7) |
|---|---|---|
| PSP amplitude (mV)a | 2.0 ± 0.31 | 1.7 ± 0.35 |
| PSP rise time (msec) | 7.0 ± 0.7 | 5.4 ± 1.4 |
| PSP IEI (msec) | 141 ± 19 | 70 ± 13 |
| PSP slope (mV/msec) | 469 ± 103 | 323 ± 49 |
| PSC amplitude (pA)a | −14 ± 3 | −26 ± 9 |
| PSC rise time (msec) | 1.2 ± 0.1 | 1.0 ± 0.1 |
| PSC IEI (msec) | 321 ± 78 | 131 ± 39 |
| PSC slope (pA/msec)
|
−11.8 ± 2.6
|
−30.45 ± 11.0
|
Results are mean ± SEM. No significant differences were found (MANOVA). PSP,F = 1.62;p = 0.24. PSC,F = 1.05; p = 0.44.
Measured at down-state potential.
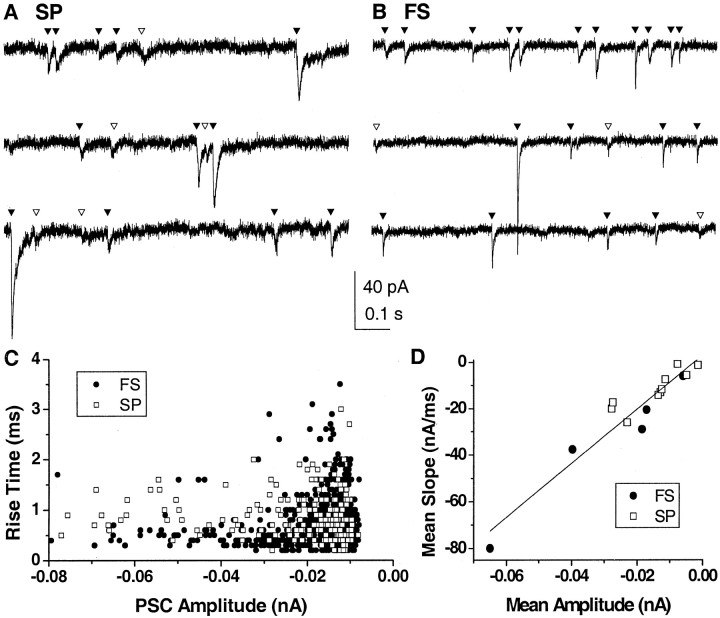
To better assess the characteristics of unitary synaptic inputs, they were analyzed in neurons voltage clamped at zero current holding potential. Numerous spontaneous events that resembled PSCs in time course were visible in the membrane current at down-state holding potential. These putative, spontaneous PSCs were extracted from down-state periods that lasted, on average, 52 ± 18 sec (Fig. 5A,B) (n = 10 spiny projection neurons; n = 6 fast spiking interneurons). Their mean amplitude of -14 to -26 pA compared favorably with those reported for NMDA and non-NMDA-mediated synaptic events (-26 pA) in spiny projection neurons from acute striatal slices (Mori et al., 1994a,b). There was a wide dispersion in PSC amplitude versus rise time plots (Fig. 5C). At the population level, probability density functions and cumulative distribution functions for PSCs were skewed (Fig. 6), as observed for the PSP density functions. These population statistics for PSCs differed from those for PSPs in two aspects. First, the probability density functions for PSC rise time were bimodal, which is consistent with AMPA glutamatergic inputs (Jahn et al., 1998) and fast GABAergic synaptic inputs (Salin and Prince, 1996). Second, a significant correlation was revealed between mean PSC amplitude and mean slope for each neuron (Pearson's r = 0.95; p < 0.002) (Fig. 5E). Similar to our results from current-clamp recordings, mean values of PSC amplitude, 10-90% rise time, slope, and IEI were not significantly different between neuronal classes (Table 2). Our analysis, thus, demonstrates that synaptic inputs during the down state are highly heterogeneous and similar between spiny projection neurons and fast spiking interneurons.
Figure 5.
Spontaneous synaptic currents in striatal neurons during the down state in voltage clamp in a spiny projection neuron (SP; A) and a fast spiking interneuron (FS; B). Traces represent contiguous segments. Activity is characterized by the presence of spontaneous events that resemble synaptic currents. ▾, Identified events; ▿, putative events missed by the algorithm or misclassified. Holding potential is -78 mV (SP) and -66 mV (FS), respectively. C, Rise time versus amplitude is uncorrelated for both SP and FS, suggesting a heterogeneous population of synapses. D, Mean amplitude is highly correlated with mean slope (Pearson's r = 0.95), indicating a small variation in mean rise time among neurons.
Figure 6.
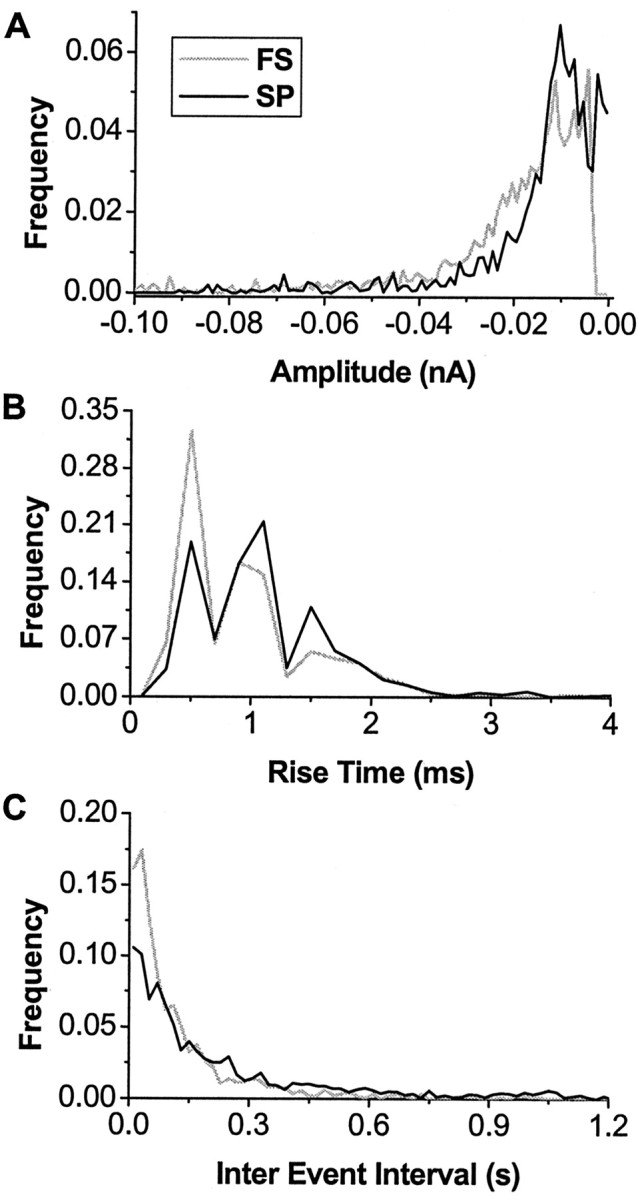
Density function and cumulative distribution of PSCs for the population of spiny projection neurons (SP) and fast spiking interneurons (FS). Amplitude distribution (A), rise time distribution (B), and IEI distribution (C) do not differ between neuronal types.
Frequency of synaptic inputs during up states
In contrast to the relatively small down-state events, up states are characterized by large voltage and current fluctuations (Fig. 7A,B) that are similar for both neuronal types. On average, up states last for 306 ± 44 msec in spiny projection neurons and 246 ± 95 msec in fast spiking interneurons (t = 0.664; p = 0.519). Using the ratio of up-state charge to unitary synaptic charge (see Materials and Methods), the number of synaptic inputs during an up state is estimated to be ∼200 and is not different between neuronal classes (Fig. 7C) (t = 0.301; p = 0.77; 232 ± 54 for spiny projection neurons; 190 ± 83 for fast spiking interneurons). The resulting synaptic input frequency during up states is 806 ± 188 and 725 ± 124 Hz for spiny projection neurons and fast spiking interneurons, respectively (Fig. 7D) (t = 0.445; p = 0.66). The number of inputs is correlated with up-state duration (r = 0.79) (Fig. 7E), suggesting that the frequency of synaptic inputs does not vary with up-state duration. Taken collectively, the typical up state has a duration of 284 ± 43 msec with an average of 217 ± 44 synaptic inputs, which results in an average synaptic input frequency of 777 ± 125 Hz (n = 15).
Figure 7.
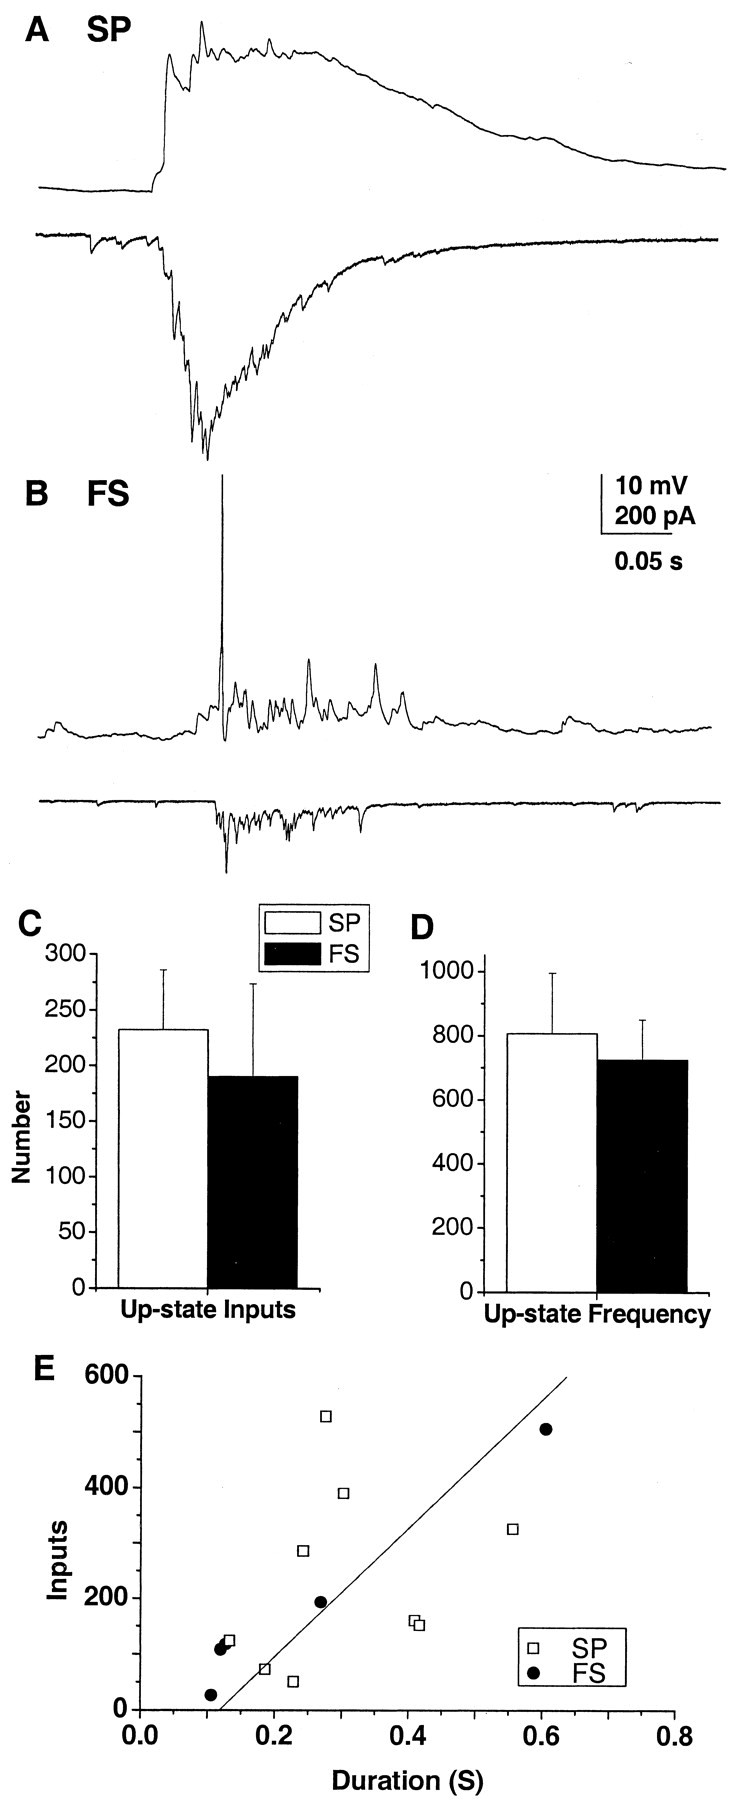
Striatal neurons receive ∼200 synaptic inputs during up states. A, B, Example up states for spiny projection neurons (SP) and fast spiking interneurons (FS). Top trace, Current clamp. Bottom trace, Voltage clamp. VH = -77 mV for SP and -66 mV for FS. C, D, Summary statistics for total number of synaptic inputs during up states (C) and average synaptic input frequency (D) for both neuronal types. E, Up-state duration is correlated with the number of synaptic inputs (r = 0.79) for the population of neurons (excluding one outlier with a charge of -0.67), suggesting that input frequency during up states is stationary.
A second, independent estimate of PSC frequency during up states is provided by our detection algorithm. This method is less sensitive to activation of voltage-dependent currents, which is a potential problem because of possible space-clamp errors. However, it misses many events because of the high synaptic input frequency, even with a very low minimum event distance of, for example, 1 msec. Using this approach, a lower bound for synaptic input frequency during up states is estimated at 455 ± 74 Hz (n = 15).
GABAergic synaptic inputs contribute significantly during up states
In principle, GABAA synaptic inputs could contribute to up states by depolarizing the spiny projection neurons from the hyperpolarized down state, because in vivo the reversal of GABAA synaptic inputs is -60 mV in spiny projection neurons (for review, see Plenz, 2003). However, the proportion of GABAA synaptic inputs present during up states is currently not known. If a preponderance of inputs were glutamatergic, the reversal potential of the population of synaptic inputs would be close to 0 mV. In contrast, if most inputs were GABAergic, the reversal potential would be -59 mV for both neuronal types, which is the chloride reversal potential in the present experiments. A mixture of glutamatergic and GABAergic inputs would result in a reversal between these two extremes.
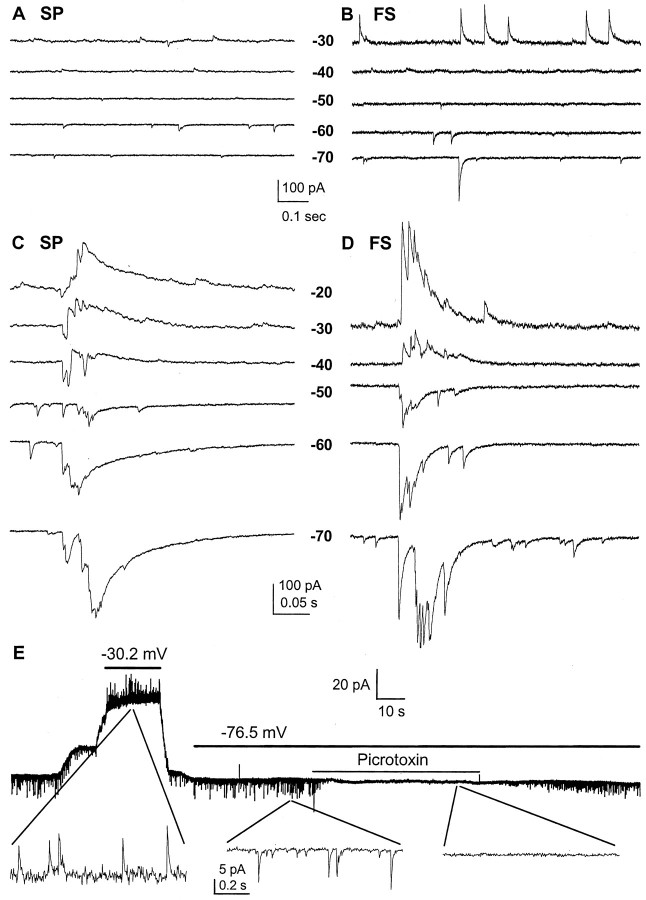
The presence of GABAergic synaptic inputs is demonstrated in Figure 8, which shows samples of down-state events at holding potentials between -70 and -30 mV for a spiny projection neuron and a fast spiking interneuron. With depolarization, down-state events become smaller, until they increase again with reversed polarity at more depolarized holding potentials for both neurons. Local application of the GABAA antagonist picrotoxin verifies the GABAergic nature of the reversed events (Fig. 8E). In four spiny projection neurons, picrotoxin blocked 90% of the synaptic events that reversed at potentials below -30 mV. The population of unitary PSCs reversed in six of nine spiny projection neurons and in four of six fast spiking interneurons with a mean reversal potential of -41.7 ± 3.8 and -55.9 ± 7.0 mV, respectively (t = 1.95; p < 0.05). In nine neurons, a sufficient number of inward and outward currents were present simultaneously at a single clamp potential that the fraction of GABAergic and glutamatergic events could be estimated. The frequency of inward currents did not differ significantly from the frequency of outward currents (ratio, 0.85 ± 0.14 at potential of -40.6 ± 4.3 mV), suggesting that at least half of all synaptic inputs are GABAergic during the down state.
Figure 8.
Up and down states receive a significant number of GABAergic inputs. Spontaneous activity in a spiny projection neuron (SP; left) and fast spiking interneuron (FS; right) during down state (A, B) and upstate (C, D) at different holding potentials. E, In the presence of the glutamate receptor antagonists CNQX (20 μm) and APV (50 μm), all spontaneous PSCs were reversed and blocked by local application of picrotoxin. Bars indicate clamp voltage and application of picrotoxin. Insets show traces on an expanded time scale.
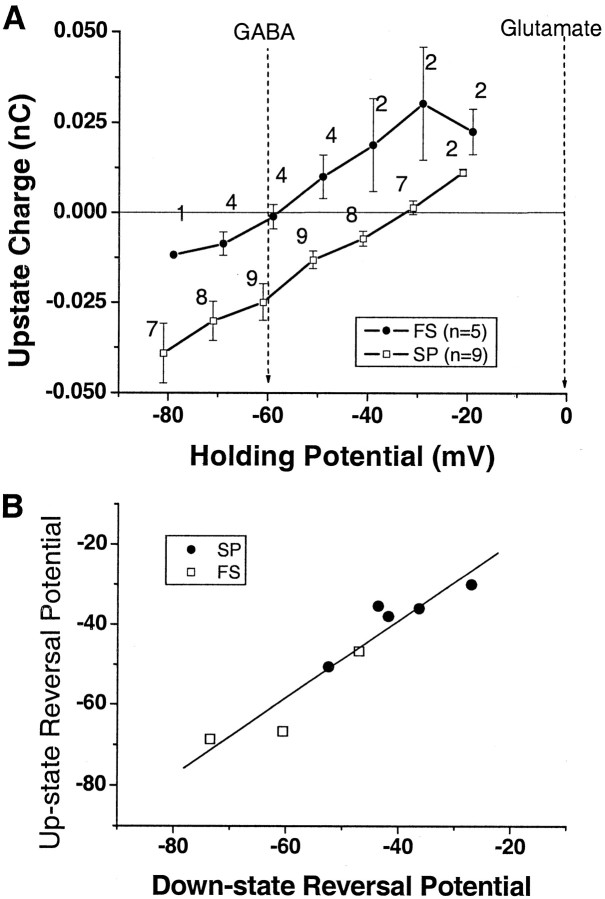
The presence of GABA inputs during up states was evaluated from the effect of holding potential on charge transfer. With depolarization, the up-state current (and charge transfer) became smaller, until it reversed at more depolarized holding potentials (Fig. 8C,D). In both neuronal types, up-state charge reversed well below 0 mV, indicating the presence of GABAergic inputs. The average reversal potential was significantly higher in spiny projection neurons (-38.1 ± 3.4 mV) compared with fast spiking interneurons (Fig. 9A) (-58.0 ± 5.7 mV; t = 3.16; p = 0.016). In fact, the up-state reversal potential in fast spiking interneurons was very close to the pure GABA reversal potential in our recording configuration, suggesting that most inputs to these neurons during the up state are GABAergic.
Figure 9.
The correlation in population reversal potential between up and down states suggests that the fraction of GABAergic inputs is stable in both states for each neuron. A, Up-state charge for spiny projection neurons (SP) and fast spiking interneurons (FS) reverses between -60 and 0 mV. Numbers indicate the number of neurons tested for each holding potential. B, Reversal potential for up-state charge correlates highly with reversal potential of charge for unitary down-state PSCs (R2 = 0.90).
Relationship between up and down states
Because we estimated synaptic inputs during down and up states for individual neurons, we tested whether information about synaptic inputs during the down state would predict properties of the up state in the same neuron. Results show there was no correlation between the frequency of synaptic inputs during the down state and the frequency of synaptic inputs during the up state (n = 12 neurons). This implies that down-state frequency is not predictive of up-state frequency. In contrast, the reversal potential calculated for the population of down-state PSCs was highly correlated with reversal potential for up-state charge in both neuronal types for each neuron (Fig. 9B) (slope, 0.96 ± 0.13; R2 = 0.90), suggesting that the fraction of GABAergic inputs does not change as neurons transition between up and down states.
Discussion
The present study quantitatively analyzed spontaneous synaptic inputs during up and down states in striatal neurons. The main results showed that both striatal projection neurons and fast spiking interneurons receive ∼800 synaptic inputs per second during the up state compared with 10-40 inputs per second during down states. In both states, a substantial proportion of these inputs was GABAergic, and the proportion did not change as neurons switched between states.
This comparative study is made possible by the spontaneous cortical activity of the in vitro system, which provides a large variation in synaptic input frequency to the striatum and allows striatal neurons to exhibit up and down states (Plenz and Aertsen, 1996b; Plenz and Kitai, 1998a; Kerr and Plenz, 2002). The in vitro system also allows visual selection of striatal neurons to adequately sample the fast spiking interneurons. Even with this degree of visualization, current technical limitations prevent the simultaneous monitoring of synaptic inputs at all locations on the dendritic tree. However, up and down states so far have only been described from somatic recordings, and, therefore, it is reasonable to quantify the differences in synaptic inputs between states from somatic recordings. Furthermore, all membrane currents in a neuron ultimately are integrated at the axon hillock, which determines action potential generation. This integration is reasonably well accessible through somatic recordings.
Constraints for striatal network models
Our results provide several constraints for neuronal network models of the striatum. First, synaptic inputs to spiny projection neurons are highly heterogeneous as viewed from the soma. Such heterogeneity could be obtained by a random spatial distribution of synaptic inputs along dendrites of these neurons, as suggested from anatomy (Zheng and Wilson, 2002) and a large variability in synaptic conductances. The skewed, unimodal distributions, which precluded identification of independent classes of synaptic inputs, are similar to that observed for spontaneous events in cultured hippocampal slices (Thompson et al., 1997). Second, although the synaptic input frequency is rather high during the up state, the main type of corticostriatal neuron, which constitutes the corticostriatal pathway in vivo and in the culture system (Plenz and Aertsen, 1996a; Plenz and Kitai, 1998a; Zheng and Wilson, 2002), fires at very low frequencies (Bauswein et al., 1989; Turner and DeLong, 2000). This fact, in conjunction with possible short-term depression at the corticostriatal synapse (Mori et al., 1994a) implies a convergence of corticostriatal afferents to obtain high population input rates to striatal neurons (Zheng and Wilson, 2002). Therefore, our findings preclude models in which several strong inputs dominate striatal neuron firing. Third, whereas the variability in individual synaptic inputs was similar between spiny projection neurons and fast spiking interneurons, the composition in excitatory and inhibitory inputs was different, as suggested by reversal potential calculations for unitary PSCs and up-state charge. Differences in reversal potential could be explained by a relative preponderance of inhibitory inputs to fast spiking interneurons, which would result in values for both reversal potential calculations to be near the theoretical reversal potential of approximately -60 mV, as was found in the present study. Anatomical findings demonstrate glutamatergic corticostriatal inputs (Somogyi et al., 1981; Lapper et al., 1992; Bennett and Bolam, 1994) and local inputs from striatal GABAergic neurons (Somogyi et al., 1981; Kita et al., 1990; Kita, 1993; Yung et al., 1996) converging on both neuronal types. Although the number of inhibitory inputs to fast spiking interneurons may be less than spiny projection neurons, our results suggest that the proportion of inhibitory inputs to fast spiking interneurons is greater. This suggests that neuronal models within basal ganglia circuits should have similar types of inputs to both neuronal types but a relative dominance of GABAergic inputs to fast spiking interneurons. Our finding further suggests that functional differences between neuronal types are a consequence of differences in both the balance of inhibitory to excitatory inputs and intrinsic currents.
Basic assumptions in determination of synaptic input frequency for up states
Our measurements and conclusions are based on four basic assumptions. The first assumption is that the algorithm provides a proper sampling of spontaneous synaptic inputs. The combination of threshold detection with an additional criterion on rise time is similar to a threshold on the first derivative of the membrane potential but avoids the use of an explicit low-pass filter, which is necessary when working on the first derivative (Cochran, 1993; Ankri et al., 1994; Carlson and Krieger, 1996). A commonly used alternative (i.e., template matching) (Clements and Bekkers, 1997) does not seem to be suitable in our case because of the large variation in rise time of events. In the present study, the threshold is adjusted for each neuron to minimize the total number of misclassified events, which includes both missed detections (if the threshold is too high) and false positives (if the threshold is set too low). Three controls show that this approach is appropriate for detecting synaptic events. First, noise estimates obtained from time periods with no apparent synaptic inputs are similar to noise estimates obtained when synaptic activity is blocked pharmacologically. Second and third, decreasing the threshold or changing the minimum event distance from the “optimal” values has minor effects on the amplitude or number of events detected. These results indicate that our algorithm is optimized for detection of synaptic events.
The second assumption is that the average unitary synaptic event during the down state is similar to that in the up state. Differences in unitary synaptic event charge between down and up state could result from short-term plasticity at glutamatergic and GABAergic synapses (Thomson, 2000). The presence of long-lasting short-term depression for glutamatergic inputs to spiny projection neurons (Mori et al., 1994b) suggests that short-term plasticity could play a major role. Similarly, the GABAergic inputs revealed during up states in the present study most likely originate from spiny projection neurons and fast spiking interneurons (Plenz and Kitai, 1998a; Koos and Tepper, 1999; Czubayko and Plenz, 2002; Tunstall et al., 2002). Both neuronal types can fire at rates during which synaptic short-term plasticity occurs, and short-term depression as well as facilitation has been demonstrated for these synapses (Plenz and Kitai, 1998a; Czubayko and Plenz, 2002; Plenz, 2003). Accordingly, refinement of our estimate of the synaptic input frequency during up state events must wait for precise measurements of the change in unitary PSC charge during spontaneous (rather than evoked) action potential trains.
The third assumption is that the ratio of glutamatergic and GABAergic inputs during down state and up state is similar. Three measures [reversal potential of down-state PSCs (-50 to -35 mV), reversal potential of up-state charge (-50 to -35 mV), and the presence of both inward and outward currents at a single-clamp potential] imply that GABAergic inputs are present during both states. The reversal potential of the charge transfer during up states is highly correlated with the reversal potential of the mean unitary PSC amplitude during down states, supporting the assumption that the proportion of GABAergic to glutamatergic synaptic inputs is the same for both states.
Finally, our measurements of charge transfer during the up state could be biased by activation of voltage-dependent currents caused by an incomplete space clamp. Inward currents from voltage-activated channels would cause an increase in charge transfer, which would lead to an overestimation of synaptic inputs during the up state. Similarly, outward currents would decrease our estimate of synaptic inputs. During down states, a fairly linear relationship exists between holding potential and holding current (R2 = 0.95 ± 0.08 SD; n = 16), suggesting that voltage-gated channels were not activated during the voltage-clamp experiments. Although it is difficult to assess voltage escape during the brief up states, using the detection algorithm provides an alternative measure of PSC frequency during up states, which is less sensitive to activation of voltage-dependent currents. Because this method is less sensitive to synaptic plasticity and space-clamp errors but more restricted by the imposed minimal event interval of 1 msec, it provided a conservative lower limit on the synaptic input frequency during up states.
The validity of these assumptions is supported by the similarity between our estimate of 129 inputs (455 Hz × 0.28 sec) to 217 inputs during the average up state and the 150 synaptic inputs predicted from compartmental modeling for up-state generation (Wilson, 1992).
The functional role of GABA during up states
We found that GABAA channels carry a significant fraction of synaptic currents during both states. Using whole-cell recording, the chloride reversal potential in the present study was set to -59 mV and, consequently, GABAergic inputs were depolarizing during the down state. That GABAergic inputs might depolarize spiny projection from down states is further suggested from recordings with sharp intracellular recordings in vivo and in the acute slice, in which responses to locally applied GABA or GABAergic inputs were shown to reverse at approximately -60 mV (Mercuri et al., 1991; Kita, 1996; Tunstall et al., 2002), which is positive with respect to the average down-state potential (Wilson and Kawaguchi, 1996). Whereas the depolarizing action, in general, is not at question for spiny projection neurons, measurement of the exact value of the GABAA reversal potential requires different techniques (Gulledge and Stuart, 2003).
GABAA inputs to spiny projection neurons could control neuronal activity in spiny projection neurons in numerous ways (for review, see Plenz, 2003). Depolarizing GABAA inputs from spiny projection neurons and fast spiking interneurons (Czubayko and Plenz, 2002; Tunstall et al., 2002; Plenz and Kitai, 1998a; Koos and Tepper, 1999) during a down state may facilitate glutamatergic inputs, as was shown recently in cortical pyramidal cells (Gulledge and Stuart, 2003). At membrane potentials above the chloride reversal potential, local application of GABAA antagonists increased firing frequency (Plenz and Aertsen, 1996b), suggesting that intrastriatal GABAergic circuits suppress action potential firing during up states. Thus, the functional role of GABAA inputs may change dynamically, depending on the state of the postsynaptic neuron and the history of the presynaptic neuron.
Footnotes
K.T.B. was supported by grants from the National Science Foundation (IBN 0077509) and the National Institute of Mental Health (K21-MH01141). We thank Veronika Karpiak and Craig Stewart for expert technical assistance with the preparation of cultures.
Correspondence should be addressed to Dr. Kim Blackwell, Krasnow Institute, Mail Stop 2A1, Rockfish Creek Lane, George Mason University, Fairfax, VA 22030. E-mail: avrama@gmu.edu.
Copyright © 2003 Society for Neuroscience 0270-6474/03/239123-10$15.00/0
References
- Ankri N, Legendre P, Faber DS, Korn H ( 1994) Automatic detection of spontaneous synaptic responses in central neurons. J Neurosci Methods 52: 87-100. [DOI] [PubMed] [Google Scholar]
- Bauswein E, Fromm E, Preuss A ( 1989) Corticostriatal cells in comparison with pyramidal tract neurons: contrasting properties in the behaving monkey. Brain Res 493: 198-203. [DOI] [PubMed] [Google Scholar]
- Becq H, Bosler O, Geffard M, Enjalbert A, Herman JP ( 1999) Anatomical and functional reconstruction of the nigrostriatal system in vitro: selective innervation of the striatum by dopaminergic neurons. J Neurosci Res 58: 553-566. [DOI] [PubMed] [Google Scholar]
- Bennett BD, Bolam JP ( 1994) Synaptic input and output of parvalbumin-immunoreactive neurons in the neostriatum of the rat. Neuroscience 62: 707-719. [DOI] [PubMed] [Google Scholar]
- Carlson CG, Krieger JW ( 1996) A baseline detection method for analyzing transient electrophysiological events. J Neurosci Methods 67: 211-220. [PubMed] [Google Scholar]
- Clements JD, Bekkers JM ( 1997) Detection of spontaneous synaptic events with an optimally scaled template. Biophys J 73: 220-229. [DOI] [PMC free article] [PubMed] [Google Scholar]
- Cochran SL ( 1993) Algorithms for detection and measurement of spontaneous events. J Neurosci Methods 50: 105-121. [DOI] [PubMed] [Google Scholar]
- Czubayko U, Plenz D ( 2002) Fast synaptic transmission between striatal spiny projection neurons. Proc Natl Acad Sci USA 99: 15764-15769. [DOI] [PMC free article] [PubMed] [Google Scholar]
- Gähwiler BH ( 1981) Organotypic monolayer cultures of nervous tissue. J Neurosci Methods 4: 329-342. [DOI] [PubMed] [Google Scholar]
- Goto Y, O'Donnell P ( 2001) Network synchrony in the nucleus accumbens in vivo J Neurosci 21: 4498-4504. [DOI] [PMC free article] [PubMed] [Google Scholar]
- Gruber AJ, Solla SA, Surmeier JD, Houk JC ( 2003) Modulation of striatal single units by expected reward: a spiny neuron model displaying dopamine-induced bistability. J Neurophysiol 90: 1095-1114. [DOI] [PubMed] [Google Scholar]
- Gulledge AT, Stuart GJ ( 2003) Excitatory actions of GABA in the cortex. Neuron 37: 299-309. [DOI] [PubMed] [Google Scholar]
- Jahn K, Bufler J, Franke C ( 1998) Kinetics of AMPA-type glutamate receptor channels in rat caudate-putamen neurones show a wide range of desensitization but distinct recovery characteristics. Eur J Neurosci 10: 664-672. [DOI] [PubMed] [Google Scholar]
- Kawaguchi Y ( 1993) Physiological, morphological, and histochemical characterization of three classes of interneurons in rat neostriatum. J Neurosci 13: 4908-4923. [DOI] [PMC free article] [PubMed] [Google Scholar]
- Kerr JN, Plenz D ( 2002) Dendritic calcium encodes striatal neuron output during up-states. J Neurosci 22: 1499-1512. [DOI] [PMC free article] [PubMed] [Google Scholar]
- Kincaid AE, Zheng T, Wilson CJ ( 1998) Connectivity and convergence of single corticostriatal axons. J Neurosci 18: 4722-4731. [DOI] [PMC free article] [PubMed] [Google Scholar]
- Kita H ( 1993) GABAergic circuits of the striatum. In: Chemical signalling in the basal ganglia (Arbuthnott GW, Emson PC, eds), pp 51-72. Amsterdam, Oxford, New York, Tokyo: Elsevier.
- Kita H ( 1996) Glutamatergic and GABAergic postsynaptic responses of striatal spiny neurons to intrastriatal and cortical stimulation recorded in slice preparations. Neuroscience 70: 925-940. [DOI] [PubMed] [Google Scholar]
- Kita H, Kosaka T, Hessizmann CW ( 1990) Parvalbumin-immunoreactive neurons in the rat neostriatum: a light and electron microscopic study. Brain Res 536: 1-15. [DOI] [PubMed] [Google Scholar]
- Koos T, Tepper JM ( 1999) Inhibitory control of neostriatal projection neurons by GABAergic interneurons. Nat Neurosci 2: 467-472. [DOI] [PubMed] [Google Scholar]
- Lampl I, Reichova I, Ferster D ( 1999) Synchronous membrane potential fluctuations in neurons of the cat visual cortex. Neuron 22: 361-374. [DOI] [PubMed] [Google Scholar]
- Lapper SR, Smith Y, Sadikot AF, Parent A, Bolam JP ( 1992) Cortical input to parvalbumin-immunoreactive neurons in the putamen of the squirrel monkey. Brain Res 580: 215-224. [DOI] [PubMed] [Google Scholar]
- Mercuri NB, Calabresi P, Stefani A, Stratta F, Bernardi G ( 1991) GABA depolarizes neurons in the rat striatum: an in vivo study. Synapse 8: 38-40. [DOI] [PubMed] [Google Scholar]
- Mori A, Takahashi T, Miyashita Y, Kasai H ( 1994a) Quantal properties of H-type glutamatergic synaptic input to the striatal medium spiny neurons. Brain Res 654: 177-179. [DOI] [PubMed] [Google Scholar]
- Mori A, Takahashi T, Miyashita Y, Kasai H ( 1994b) Two distinct glutamatergic synaptic inputs to striatal medium spiny neurones of neonatal rats and paired-pulse depression. J Physiol (Lond) 476: 217-228. [DOI] [PMC free article] [PubMed] [Google Scholar]
- Plenz D ( 2003) When inhibition goes incognito: feedback interaction between spiny projectioin neurons in striatal function. Trends Neurosci 26: 436-443. [DOI] [PubMed] [Google Scholar]
- Plenz D, Aertsen A ( 1996a) Neural dynamics in cortex-striatum co-cultures. I. Anatomy and electrophysiology of neuronal cell types. Neuroscience 70: 861-891. [DOI] [PubMed] [Google Scholar]
- Plenz D, Aertsen A ( 1996b) Neuronal dynamics in cortex-striatum co-cultures. II. Spatio-temporal characteristics of neuronal activity. Neuroscience 70: 893-924. [DOI] [PubMed] [Google Scholar]
- Plenz D, Kitai ST ( 1996) Organotypic cortex-striatum-mesencephalon cultures: the nigro-striatal pathway. Neurosci Lett 209: 177-180. [DOI] [PubMed] [Google Scholar]
- Plenz D, Kitai ST ( 1998a) `Up' and `down' states in striatal medium spiny neurons simultaneously recorded with spontaneous activity in fast-spiking interneurons studied in cortex-striatum-substantia nigra organotypic cultures. J Neurosci 18: 266-283. [DOI] [PMC free article] [PubMed] [Google Scholar]
- Plenz D, Kitai ST ( 1998b) Regulation of the nigrostriatal pathway by metabotropic glutamate receptors during development. J Neurosci 18: 4133-4144. [DOI] [PMC free article] [PubMed] [Google Scholar]
- Rall W ( 1970) Cable properties of dendrites and effects of synaptic location. In: Excitatory synaptic mechanisms (Andersen P, Janzen JKS, eds), pp 175-187. Oslo: Universitaetsverlag.
- Ramanathan S, Hanley JJ, Deniau JM, Bolam JP ( 2002) Synaptic convergence of motor and somatosensory cortical afferents onto GABAergic interneurons in the rat striatum. J Neurosci 22: 8158-8169. [DOI] [PMC free article] [PubMed] [Google Scholar]
- Reynolds JN, Wickens JR ( 2000) Substantia nigra dopamine regulates synaptic plasticity and membrane potential fluctuations in the rat neostriatum in vivo. Neuroscience 99: 199-203. [DOI] [PubMed] [Google Scholar]
- Salin PA, Prince DA ( 1996) Spontaneous GABAA receptor-mediated inhibitory currents in adult rat somatosensory cortex. J Neurophysiol 75: 1573-1588. [DOI] [PubMed] [Google Scholar]
- Somogyi P, Bolam JP, Smith AD ( 1981) Monosynaptic cortical input and local axon collaterals of identified striatonigral neurons. A light and electron microscopic study using the golgi-peroxidase transport degeneration procedure. J Comp Neurol 195: 567-584. [DOI] [PubMed] [Google Scholar]
- Steriade M, Nuñez A, Amzica F ( 1993) Intracellular analysis of relation between the slow (<1 Hz) neocortical oszillation and other sleep rhythms of the electroencephalogram. J Neurosci 13: 3266-3283. [DOI] [PMC free article] [PubMed] [Google Scholar]
- Stern EA, Kincaid AE, Wilson CJ ( 1997) Spontaneous subthreshold membrane potential fluctuations and action potential variability of rat corticostriatal and striatal neurons in vivo. J Neurophysiol 77: 1697-1715. [DOI] [PubMed] [Google Scholar]
- Stern EA, Jaeger D, Wilson CJ ( 1998) Membrane potential synchrony of simultaneously recorded striatal spiny neurons in vivo. Nature 394: 475-478. [DOI] [PubMed] [Google Scholar]
- Thompson SM, Poncer JC, Capogna M, Gähwiler BH ( 1997) Properties of spontaneous miniature GABAA receptor mediated synaptic currents in area CA3 of rat hippocampal slice cultures. Can J Physiol Pharmacol 75: 495-499. [PubMed] [Google Scholar]
- Thomson AM ( 2000) Facilitation, augmentation and potentiation at central synapses. Trends Neurosci 23: 305-312. [DOI] [PubMed] [Google Scholar]
- Tunstall MJ, Oorschot DE, Kean A, Wickens JR ( 2002) Inhibitory interactions between spiny projection neurons in the rat striatum. J Neurophysiol 88: 1263-1269. [DOI] [PubMed] [Google Scholar]
- Turner RS, DeLong MR ( 2000) Corticostriatal activity in primary motor cortex of the macaque. J Neurosci 20: 7096-7108. [DOI] [PMC free article] [PubMed] [Google Scholar]
- Wilson CJ ( 1992) Dendritic morphology, inward rectification and the functional properties of neostriatal neurons. In: Single neuron computation (McKenna T, Davis J, Zornetzer SF, eds), pp 141-171. San Diego: Academic.
- Wilson CJ, Groves PM ( 1981) Spontaneous firing patterns of identified spiny neurons in the rat neostriatum. Brain Res 220: 67-80. [DOI] [PubMed] [Google Scholar]
- Wilson CJ, Kawaguchi Y ( 1996) The origins of two-state spontaneous membrane potential fluctuations of neostriatal spiny neurons. J Neurosci 16: 2397-2410. [DOI] [PMC free article] [PubMed] [Google Scholar]
- Yung KK, Smith AD, Levey AI, Bolam JP ( 1996) Synaptic connections between spiny neurons of the direct and indirect pathways in the neostriatum of the rat: evidence from dopamine receptor and neuropeptide immunostaining. Eur J Neurosci 8: 861-869. [DOI] [PubMed] [Google Scholar]
- Zheng T, Wilson CJ ( 2002) Corticostriatal combinatorics: the implications of corticostriatal axonal arborizations. J Neurophysiol 87: 1007-1017. [DOI] [PubMed] [Google Scholar]


