Abstract
Rats, using their whiskers, have excellent capabilities in texture discrimination. What is the representation of texture in rat somatosensory cortex? We hypothesize that as rats “whisk” over a surface, the spatial frequency of a grooved or pebbled texture is converted to a temporal frequency of whisker vibration. Surface features such as groove depth or grain size modulate the amplitude of this vibration. Validation of the hypothesis depends on showing that vibration parameters have distinct neuronal representations in cortex. To test this, we delivered sinusoidal vibrations to the whisker shaft and analyzed cortical neuronal activity. Seven amplitudes and seven frequencies were combined to construct 49 stimuli while recording activity through a 10 × 10 microelectrode array inserted into the middle layers of barrel cortex. We find that cortical neurons do not explicitly encode vibration frequency (f) or amplitude (A) by any coding measure (average spike counts over different time windows, spike timing patterns in the peristimulus time histograms or in autocorrelograms). Instead, neurons explicitly encode the product of frequency and amplitude, which is proportional to the mean speed of the vibration. The quantity Af is an invariant because neuronal response encodes this feature independently of the values of the individual terms A and f. This was true across a wide time scale of firing rate measurements, from 5 to 500 msec. We conclude that vibration kinetics are rapidly and reliably encoded in the firing rate of cortical ensembles. Therefore, the cortical representation of vibration speed could underlie texture discrimination.
Keywords: barrel, cortex, tactile, vibrissae, texture, vibration
Introduction
Rats possess superb tactile capacities through use of their large facial whiskers. Indeed, as nocturnal animals albino rats depend on their whisker sensory system for object localization, judgment of the size and shape of objects, and the roughness or texture of surfaces (Guic-Robles et al., 1989; Brecht et al., 1997). It is of particular interest that humans and rats have approximately equivalent capacities in texture discrimination tasks such as comparing two spatial densities of grooves on a surface (Carvell and Simons, 1990). The purpose of the present work is to propose and test one hypothesis for the neuronal representation of texture in rat somatosensory cortex.
The rat somatosensory system is well suited for examining how neuronal activity encodes stimuli, not only because of its excellent functional capacities but also because of its unique anatomic and physiological organization. Layer IV of vibrissal somatosensory cortex is organized as a map of “barrels” (Woolsey and Van der Loos, 1970; Welker, 1971; Jensen and Killackey, 1987). Neurons in a given barrel and its associated column yield the strongest response to one single whisker and a weaker response to several surrounding whiskers (Simons, 1978; Armstrong-James and Fox, 1987; Diamond et al., 1993). The last several years have seen progress in revealing the temporal and spatial unfolding of barrel cortical neural activity in response to single-whisker deflections (Petersen and Diamond, 2000). From this, it has been possible to unravel the functional circuitry underlying cortical activity, but most studies have not provided insights into the issue of precisely which stimulus features are signaled by neuronal activity. One clue, however, comes from measurements of barrel cortex neural activity during ramp whisker deflections that varied in velocity and final resting position (Gibson and Welker, 1983b; Ito, 1985; Pinto et al., 2000). The main finding was that cortical neuronal firing rate increased with whisker velocity. Ramp and hold movements, however, are very different from the whisker movements observed during texture discrimination (Carvell and Simons, 1990). In the present study, we have used stimuli that more closely approximate the whisker movements that occur when behaving rats collect tactile information.
Rather than passively allowing objects to encounter the whiskers, rats generate tactile stimuli by sweeping their whiskers forward and backward (Welker, 1964; Fee et al., 1997; Sachdev et al., 2001, 2002; Berg and Kleinfeld, 2003). We hypothesize that during the forward and backward “whisking” movement, contact with textured surfaces produces vibrations in the whisker shaft. Surface features such as groove depth or grain size and the spacing between them modulate the frequency and amplitude of the vibrations. Whisker vibrations, the “signatures” of surfaces, propagate to the mechanoreceptors at the base of the whisker, which then transduce the motion to produce a neural representation. The hypothesis is viable only if different vibration parameters produce reliable and systematically distinct neuronal responses. Therefore we delivered vibrations as sinusoidal movements of the whisker shaft and analyzed cortical neuronal activity to determine whether, and in what way, vibration parameters are represented in cortex.
Materials and Methods
Subjects, surgery, and data acquisition. For a detailed description of surgical methods, see Rousche et al. (1999). Five adult male Wistar rats, weighing 250-350 gm, were used. All experiments were conducted in accordance with National Institutes of Health, international, and institutional standards for the care and use of animals in research. Surgical anesthesia was induced by urethane (1.5 gm/kg body weight) and maintained at a constant level by monitoring hindpaw withdrawal, corneal reflex, and respiratory rate and administering extra doses (10% of original dose) as necessary. Body temperature was maintained near 37.5°C using a servo-controlled heating blanket (FHC, Brunswick, ME). After placing subjects in a stereotaxic apparatus (Narishige, Tokyo, Japan), left somatosensory cortex was exposed by a 7 × 7 mm craniotomy centered on a point 2 mm posterior and 6 mm lateral to bregma. The dura mater was left intact. The vibrissae region of left somatosensory cortex was then identified according to vascular landmarks and stereotaxic coordinates (Hall and Lindholm, 1974; Chapin and Lin, 1984). A “Utah” array consisting of a 10 × 10 grid of 1.5-mm-long electrodes with 400 μm tip-to-tip spacing (Bionic Technologies, Salt Lake City, UT) was positioned over the selected area and inserted into the barrel (Fig. 1a,b) cortex using a pneumatic impulse inserter (Bionic Technologies) (Rousche and Normann, 1992). Another wire was positioned in the cortex to serve as a reference. From photographs of the inserted array and from response latency to whisker movement (see below) the minimum and maximum depths of electrode penetrations were estimated to be 700-1000 μm in all experiments (Fig. 1a).
Figure 1.
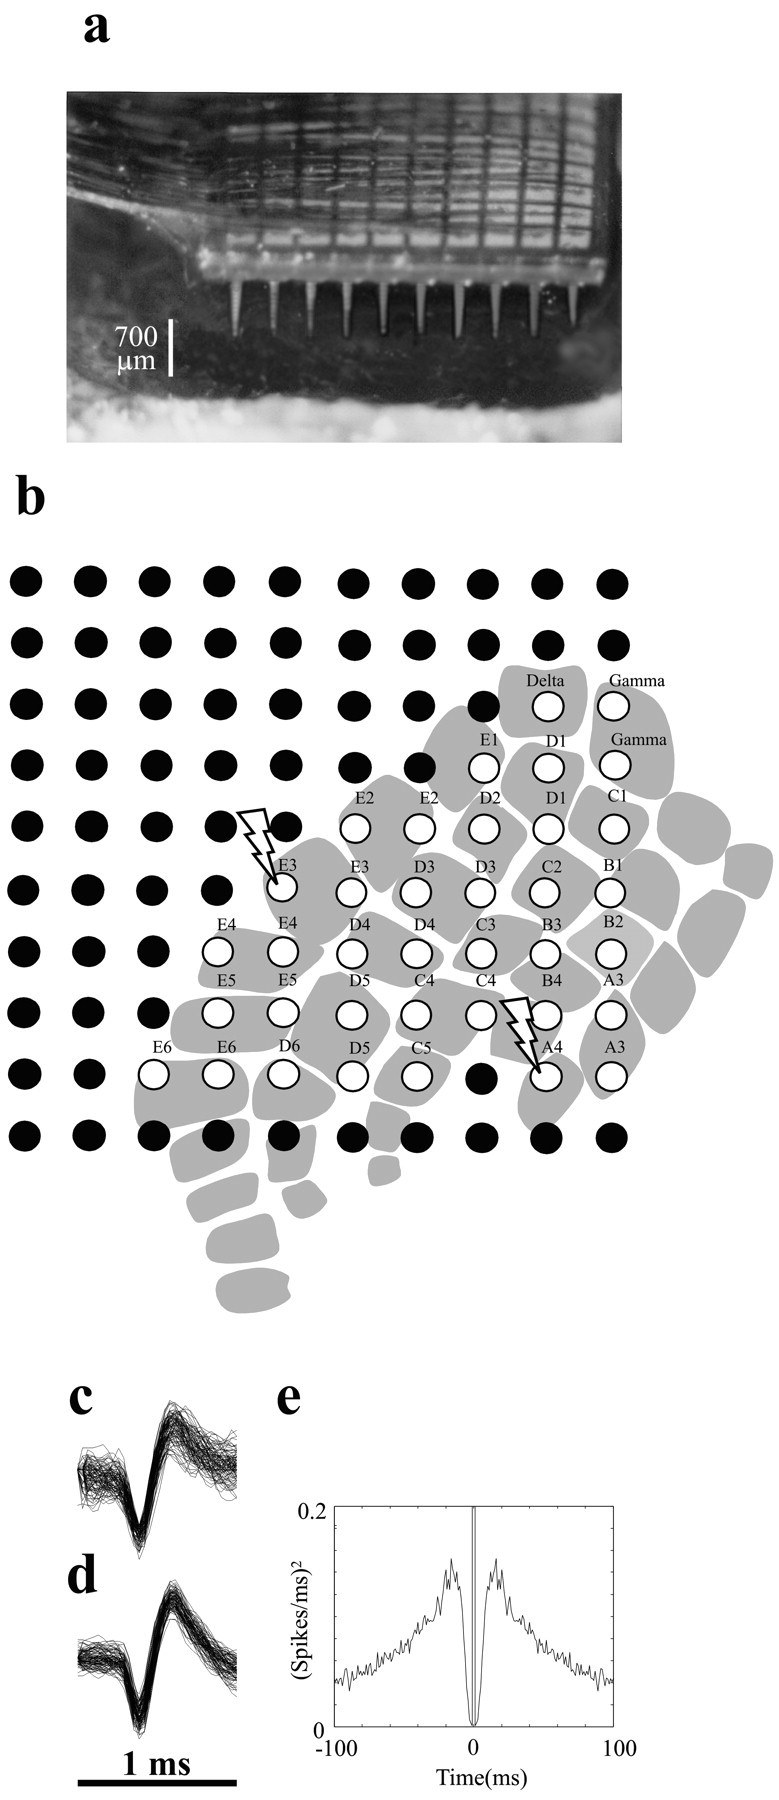
Multielectrode parallel recordings in rat barrel cortex. a, Photograph of a 10 × 10 array of microelectrodes implanted in rat somatosensory cortex in experiment 3. Interelectrode distance is 400 μm, and electrode length is 1.5 mm. Scale bar refers to the approximate 700 μm length of electrode shaft outside the brain; thus, depth of insertion was 700-800 μm. b, Placement of the microelectrode array in the barrel subfield in the same experiment. White-filled circles show the 37 electrodes at which neuronal data were recorded during whisker stimulation. The position of the array relative to the barrel columns was based on identification of the principal whisker input at each electrode of interest (see Materials and Methods). Each barrel column is designated by its row (A-E) and its arc (1-6) (Woolsey and Van der Loos, 1970). Lightning bolts designate electrodes 19 and 45, where the signals shown in c-e were recorded. c, One hundred overlaid action potential waveforms of the neuronal cluster at electrode 19. Further spike sorting was not feasible for this electrode. d, One hundred overlaid action potential waveforms of a putative unit selected from the neuronal cluster at electrode 45. e, Autocorrelogram for the putative single unit shown in d. The plot was constructed with 1 msec time bins from 2000 sec of data including spontaneous and stimulus-induced activity. The absence of spikes within 2 msec of the central bin, not observed for multi-neuron clusters, reflects the absolute refractory period of the isolated single unit.
Signals from all 100 electrodes were simultaneously amplified and filtered (gain, 5000; bandpass 250-7500 Hz; Bionic Technologies). For each active electrode, a voltage threshold was set to a value 2.5-3.5 times the root mean square voltage. A digital signal processor (Bionic Technologies) extracted 1 msec of data (0.33 msec before each threshold crossing, 0.67 msec after) and saved the waveform to the hard disk of a personal computer at 30,000 samples per second (Guillory and Normann, 1999). The waveforms emitted by a multiunit neural cluster (Fig. 1c) at each channel were selected off-line using spike-sorting programs (Bionic Technologies), and their time stamps were saved for further analysis. In earlier work it has been estimated that each electrode captures the activity of a cluster of ∼3-5 neurons (Rousche et al., 1999). At several electrodes in each experiment, it was possible to separate putative single-unit activity (Fig. 1d), and we exploited this to analyze the temporal firing patterns of single units (see Fig. 7). However, our principal aim was to select multiunit cluster activity rather than isolate single units.
Figure 7.
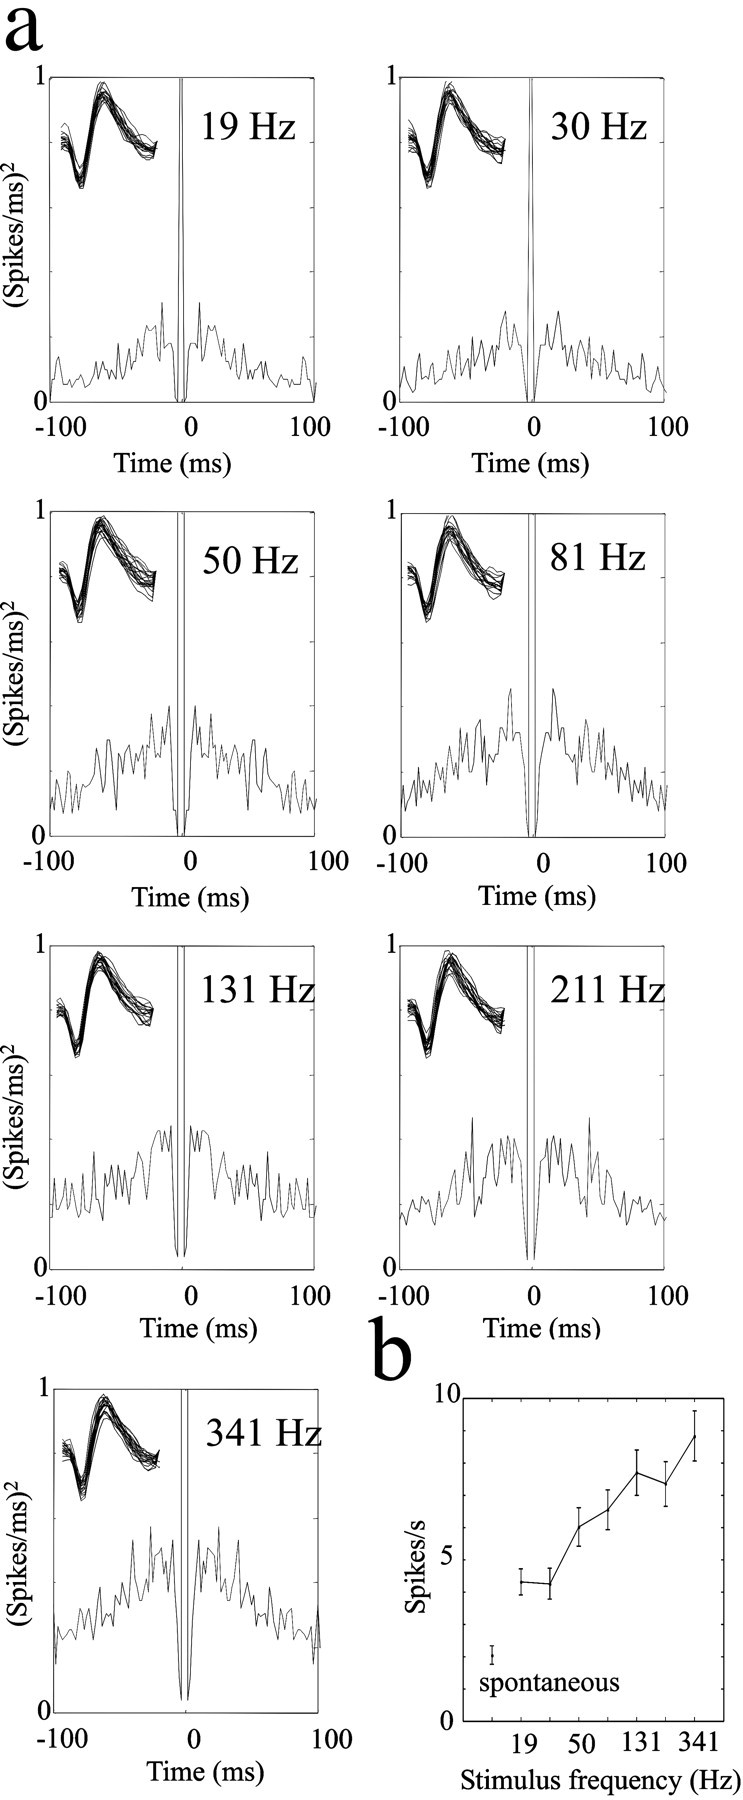
Comparison of two candidate single-neuron codes for vibration frequency. a, Single-unit autocorrelograms for vibrations ranging from 19 to 341 Hz. No phase-locked activity is evident at any vibration frequency. Insets show 50 overlaid spike waveforms from each record, ensuring that the same single unit was measured for each stimulus. b, Single-unit firing rates for the same stimulus set. Note frequency-dependent increase in firing rate. Error bars are the SEM of spike counts across trials. For both a and b responses were measured over the interval 0-500 msec after stimulus onset.
Whisker stimulation paradigm. Using thin, lightweight glass micropipettes, we made a five-rung “ladder” and attached it to a piezoelectric wafer (Morgan Matroc, Bedford, OH). We positioned the ladder on the right side of the animal's snout so that the five rungs lay just below the corresponding five rows of whiskers (A-E), each whisker shaft resting lightly on the ladder ∼5 mm from the skin. Vibration duration was 500 msec with a 1 sec interval between consecutive vibrations. The piezoelectric wafer was driven vertically by sinusoidal voltages of varying amplitude and frequency, as follows. The discrete sinusoidal waveforms (10,000 samples/sec) were generated in MATLAB (Mathworks, Natick, MA). The stimulus signal came from a digital-to-analog converter (National Instruments, Austin, TX) that was split and sent in parallel to an amplifier (gain, 40) that drove the piezoelectric wafer and to a channel of the data acquisition computer, to maintain a record of the exact time of each trial. To explore cortical coding of the vibration, its frequency and amplitude on each trial assumed one of seven values (frequency: 19, 30, 50, 81, 131, 211, and 341 Hz; amplitude: 8, 12, 21, 33, 54, 87, and 140 μm). The resulting 49 different frequency-amplitude combinations (Fig. 2a,b) were presented in pseudorandom order 100-200 times per stimulus. To give an impression of the range of frequencies and amplitudes, short segments of the stimuli as measured by an optic sensor (see below) are shown in Figure 2c. Using a calibrated custom-built optic sensor, we confirmed that the stimulator moved in a smooth sinusoidal manner. We also monitored the displacement of the whisker shaft to verify that whisker movement smoothly “followed” and matched wafer movement across the full range of frequencies and amplitudes (Fig. 2d).
Figure 2.
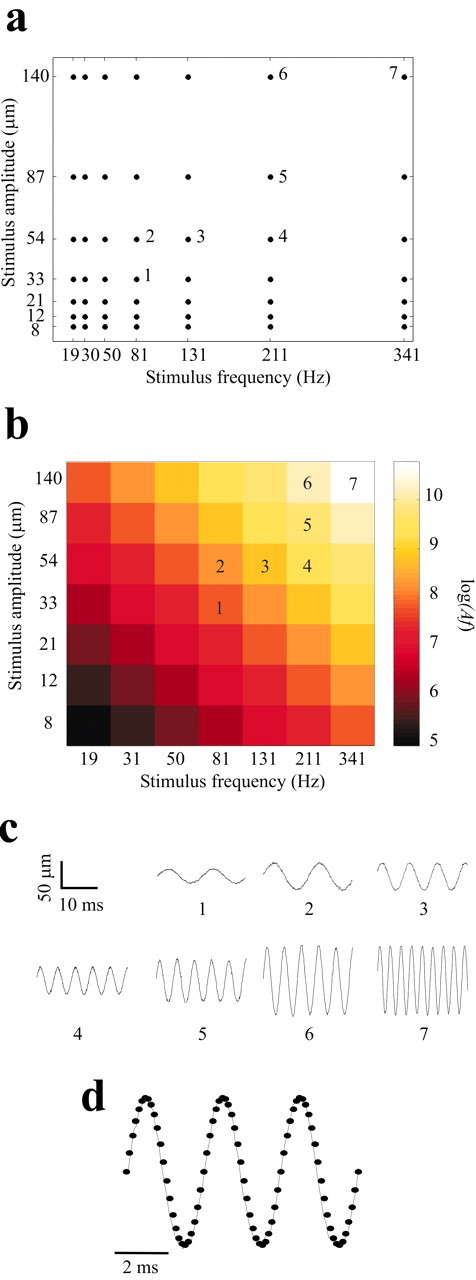
Properties of the whisker stimulus set. a, Combinations of seven amplitudes and seven frequencies were used to create 49 different stimuli. Each point represents the frequency-amplitude combination of one sinusoidal stimulus. The stimuli numbered 1-7 are represented in c. b, The frequency-amplitude combinations of a plotted according to loge(Af), where Af is proportional to the mean vibration speed. c, 20 msec segments of the movement of the ladder stimulator, corresponding to stimuli designated 1-7 in a and b. d, Sinusoidal movement of the whisker shaft. The continuous trace shows whisker movement when stimulated by the highest frequency/highest amplitude vibration (denoted as stimulus 7 in a-c). The overlying dots are sampled from a computer-generated sinusoidal waveform of the same frequency and amplitude. Note the match of the observed whisker movement to the sinusoid. Measurements in c and d were made by the optical sensor.
After delivery of the full stimulus set, all whiskers were cut 3 mm from their base and stimulated individually by a piezoelectric wafer with 1 Hz square pulses for 1 min. The resulting data were used off-line to determine for each electrode whether the neuronal cluster had a statistically significant response to any single whisker and, for such clusters, to identify the principal whisker and the response onset latency. Criteria for these measures are given in Petersen and Diamond (2000). Neuronal clusters that gave a statistically significant response and had a clear principal whisker were selected for analysis of responses to vibration stimuli; there were 16, 24, 37, 35, and 18 acceptable electrodes in experiments 1-5, respectively. Response onset latencies were in the range of 5-8 msec, signifying recording sites in a cortical layer receiving direct thalamic input. Identification of the principal whisker input to each neuronal cluster allowed us to construct barrelfield maps like the one shown in Figure 1b.
Results
Before turning to neuronal responses, it is important to take a deeper look at the composition of the stimuli. We have plotted for each stimulus the quantity loge(Af), where A is vibration amplitude and f is vibration frequency (Fig. 2b). The quantity Af is proportional to the mean speed of the stimulus. The stimulus set was organized in diagonal bands (top left to bottom right) within which widely varying frequency-amplitude combinations yielded similar values of Af. For example, for the stimuli f = 81 Hz, A = 87 μm and f = 211 Hz, A = 33 μm, loge(Af) = 8.86 and 8.85, respectively. We refer to these diagonally oriented series of stimuli as iso-Speed, or iso-Af, bands. Af differed sharply between neighboring bands. Note that the stimulus set could equally well be plotted in terms of loge(Af)2, the quantity (Af)2 being proportional to the kinetic energy of the stimulus. In that case, the diagonally oriented bands would consist of iso-energy stimuli. The main result to be illustrated in the course of the report, that neuronal response is systematically related to (Af)n, holds for any positive value of n.
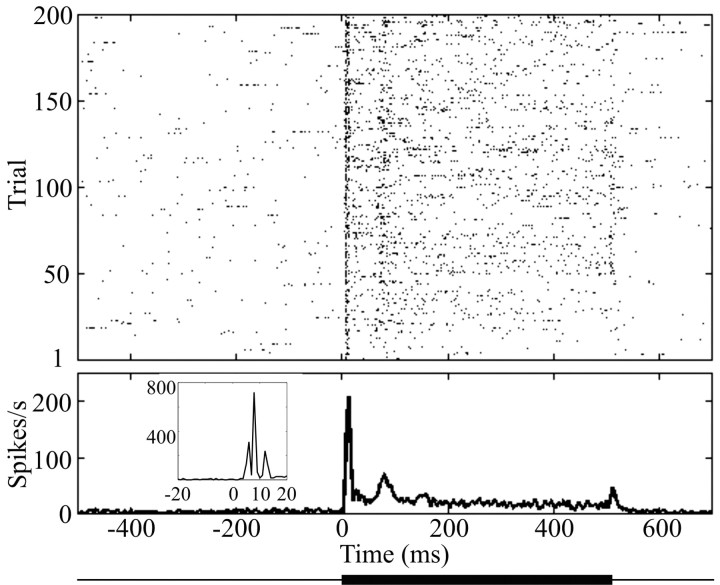
Typical responses of a neuronal cluster to whisker vibrations (211 Hz, 87 μm) are evident in the raster plot and peristimulus time histograms (PSTHs) shown in Figure 3. The neuron cluster showed a sharp initial increase in firing rate 5 msec after stimulus onset, rising to a peak a few milliseconds later (see PSTH inset). After a second, smaller rise in firing rate at 70 msec, the response settled to a level of ∼25 spikes/sec and remained there until stimulus offset. There was a small increase in firing rate when the stimulus ended. Neurons commonly showed the two response phases present in this example: an early, rapidly adapting response (typically the first 50-100 msec of activity) and a subsequent, slowly adapting response (until stimulus offset).
Figure 3.
Responses to a sinusoidal stimulus recorded from a neural cluster. Raster plot and PSTHs from a neural cluster in barrel column B2 recorded in experiment 1. Stimulus was 211 Hz, 87 μm; stimulus 5 in Figure 2a-c. Dots in the top part show spike times across 200 trials, and the corresponding PSTH (bin size, 4 msec) is aligned below the raster plot. Stimulus presentation was from 0 to 500 msec, as indicated by the thick line below the PSTH. The inset shows the earliest portion of the PSTH with 1 msec bins. The three-peaked structure at response onset did not depend on stimulus parameters.
How were vibration features encoded in neuronal activity? Figure 4 shows the responses of a neuronal cluster to the entire set of 49 stimuli. Response was measured as the firing rate across the entire 500 msec stimulus duration averaged across trials. In Figure 4a, responses are plotted for frequency-varying, iso-amplitude lines, highlighting how firing rate increased as vibration frequency increased. In Figure 4b, the same neuronal response values are plotted for amplitude-varying, iso-frequency lines; here, the dependence of firing rate on vibration amplitude is clear.
Figure 4.
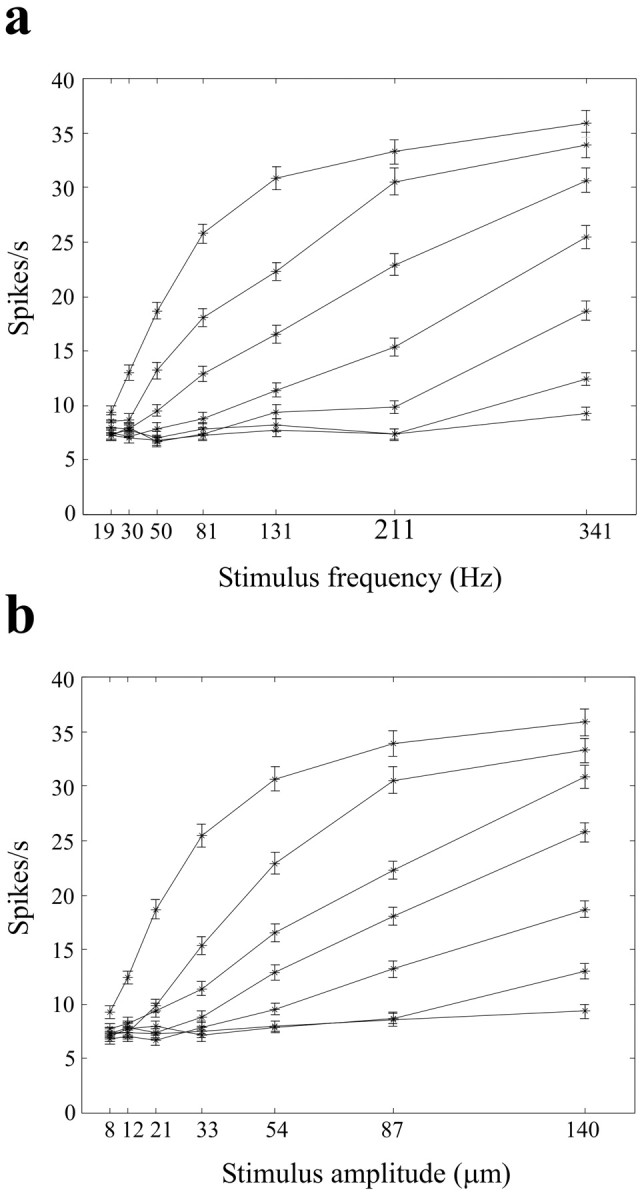
Frequency and amplitude dependence of firing rates for a neural cluster. Data are from barrel column D2 in experiment 1. Spikes were counted over the 0-500 msec time window (vibration onset, 0 msec) and averaged over 200 trials for each stimulus. Error bars are the SEM spike counts across trials. a, Firing rates are shown as a function of stimulus frequency. Each line connects the points generated by increasing vibration frequency with constant vibration amplitude. Amplitudes increase (8, 12, 21, 33, 54, 87, and 140 μm) from the lowest line to the highest. b, Firing rates as a function of stimulus amplitude. Each line connects the points generated by increasing vibration amplitude with constant vibration frequency. Frequencies increase (19, 30, 50, 81, 131, 211, and 341 Hz) from the lowest line to the highest. Note the similar dependence of firing rate on the change in either frequency or the amplitude.
From these findings we conclude that neuronal firing rate varies with both frequency and amplitude. However, “decoding” these features from the firing rate of a single cluster would be ambiguous: a given response level could, in principle, represent an infinite number of frequency-amplitude combinations. Hence, barrel cortical neurons do not appear to explicitly report either of these two vibration features, frequency or amplitude, in their response magnitudes. Was some other feature of the vibration unambiguously encoded by response magnitude? As shown below, the product of frequency and amplitude (proportional to mean vibration speed) seems to be unambiguously encoded by response magnitude. Figure 5a illustrates firing rate, averaged over the 500 msec stimulus duration, for all 49 frequency-amplitude combinations. Responses within a given iso-Af band, running from top left to bottom right as in Figure 2, a and b, were nearly equal even if the stimuli differed drastically in frequency and amplitude. Moreover, firing rate increased monotonically from one iso-Af band to its neighbor in the top right direction. To test whether the late or “adapted” part of the neural response encodes Af, Figure 5b shows firing rate for the neuronal cluster excluding the first 100 msec of the response. Firing rates during late response (100-500 msec after stimulus onset) were lower than those measured over the whole stimulus duration, but correlated equally well with Af.
Figure 5.
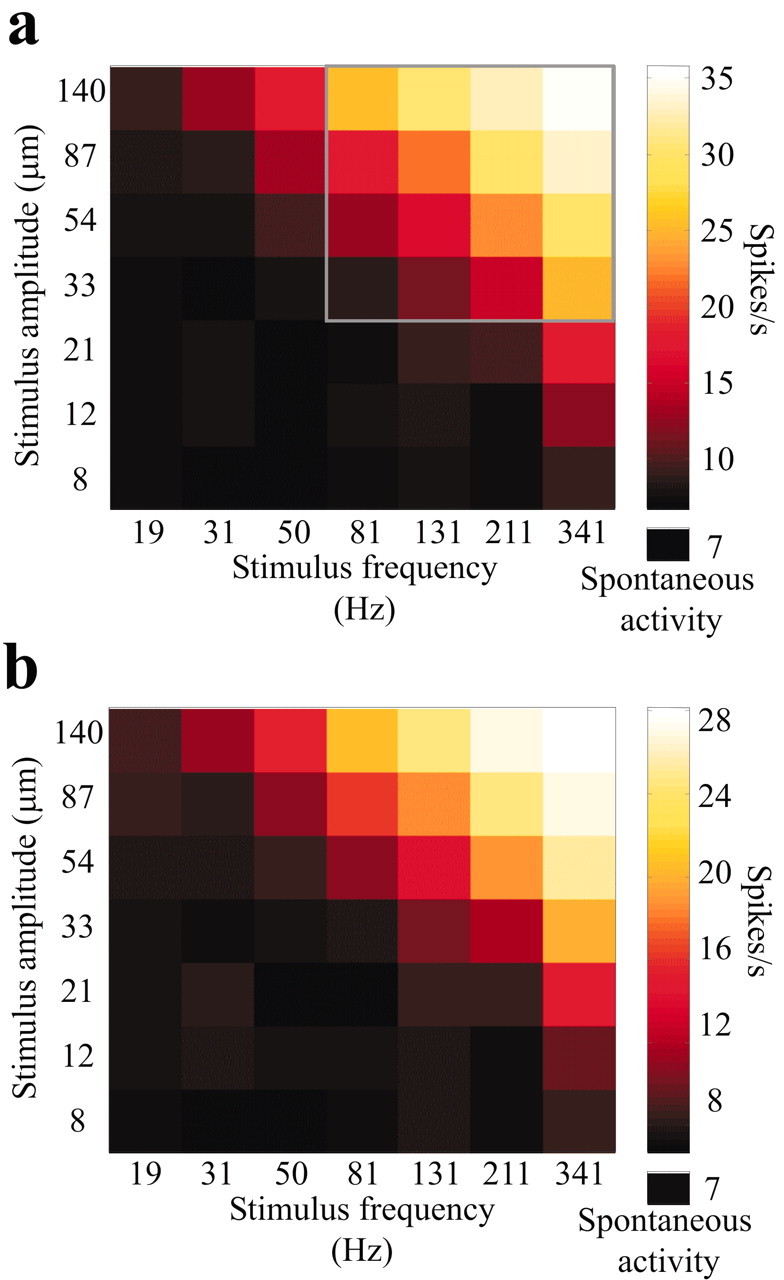
Neuronal encoding of the vibration feature Af. a, Color plot of spike counts (0-500 msec after stimulus onset) in response to the 7 × 7 stimulus grid for the same neuronal cluster shown in Figure 4. By comparing neuronal responses with the plot of Af (Fig. 2b), it is clear that firing rates were nearly identical within an iso-Af group regardless of the frequency-amplitude combination that gave rise to the stimulus. Firing rates increased as mean vibration speed grew from one iso-Af group to its neighbor. The 4 × 4 set of responses in the frame are analyzed further in Figure 6. The average firing rate in the 500 msec interval preceding stimulus onset is denoted as spontaneous activity, below the color scale. b, Spike counts 100-500 msec after stimulus onset. Even after excluding the early part of the response, the neuronal cluster robustly encoded stimulus Af.
Stimuli of very different frequencies evoked nearly equal values of neuronal firing rate, provided that vibration amplitude was shifted in proportion to 1/f: vibration frequency therefore was not encoded by firing rate, at least at the slow time scales used above. However, it is possible that two other coding mechanisms, spike timing on a more precise time scale and correlations between spike times, could carry information to disambiguate frequency from amplitude. We examined these possibilities by comparing the PSTHs and autocorrelograms for different stimuli. Differences in PSTH profiles across stimuli imply coding by the precise timing of individual spikes; differences in autocorrelation structure across stimuli imply coding by spike correlations within neuronal clusters (Panzeri et al., 2001; Petersen et al., 2001).
Figure 6a presents the PSTHs corresponding to the 4 × 4 grid of stimuli framed in the top quadrant of Figure 5a. Although there were clear variations in PSTH profile (the emergence of a second peak at 70 msec, for example), the profiles were dictated by the product Af, not by frequency or amplitude alone. For example, note the similarity of the top left and bottom right PSTHs (asterisks), which were generated by stimuli of equal mean velocity but frequencies of 81 and 341 Hz. Autocorrelation histograms for the same stimuli are shown in Figure 6b; there were no specific autocorrelation “signatures” associated with particular vibration frequencies or particular amplitudes. Rather, the autocorrelograms reflect increasing numbers of events, that is, higher firing rates, as Af increased. These results were characteristic of the multiunit data from all five rats: in no case did we find evidence that the frequency-amplitude ambiguity present in neuronal firing rates (Fig. 4) could be resolved by precise spike timing or by correlations between spikes within these same neuronal clusters.
Figure 6.
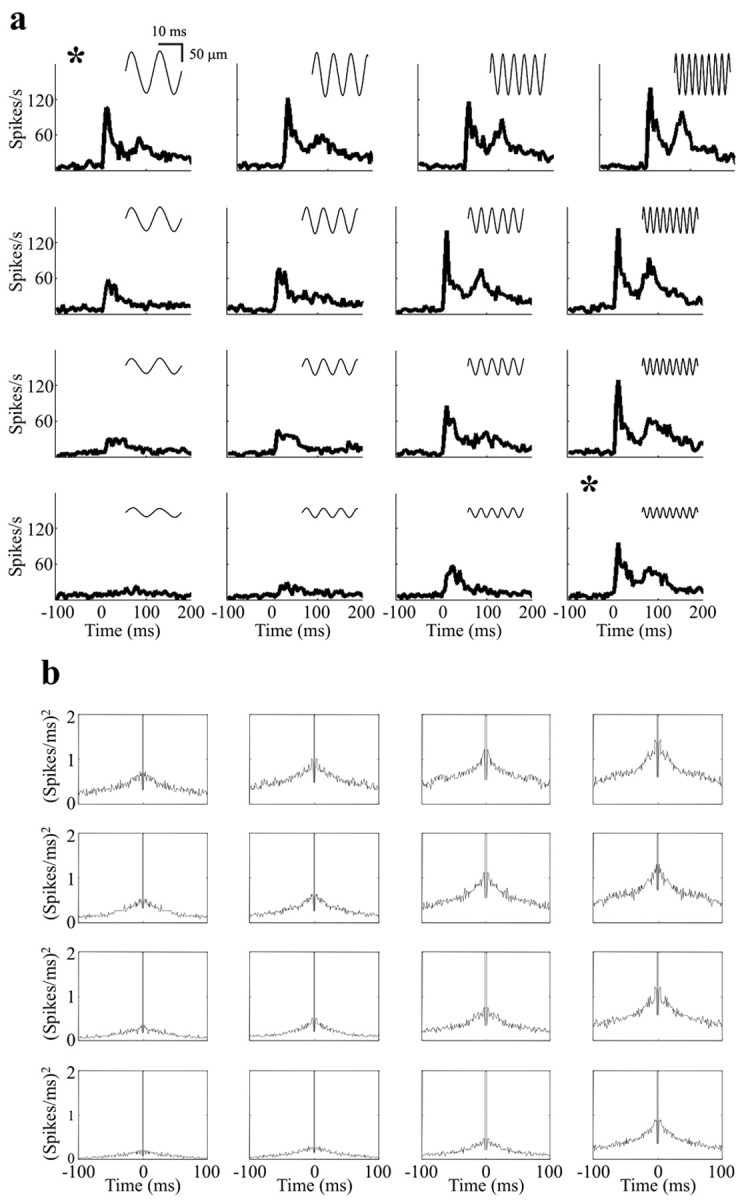
Temporal structure in responses of a multi-neuron cluster. a, PSTHs corresponding to the 4 × 4 grid in Figure 5. Note the similarity in profiles for the top left and bottom right PSTHs (asterisks), which were generated by stimuli of equal values of the product Af but frequencies of 81 and 341 Hz. b, Autocorrelation histograms (1 msec bin size) for the same 4 × 4 grid. The autocorrelograms were modulated as a function of Af (the number of events simply increased), but for the stimuli of a diagonal iso-Af band there was no temporal structure that could characterize frequency or amplitude.
If stimulus frequency were encoded by the spike timing of individual neurons, the code might be obscured by analyses limited to multiunit clusters. To exclude this possibility, we analyzed the activity of putative single units whenever possible. Figure 7 shows the coding of vibration frequency for the neuron illustrated in Figure 1, d and e. Responses to stimuli from the top row of the 7 × 7 stimulus grid were selected for illustration; here, the entire vibration frequency range was sampled at the highest amplitude so that phase-locked activity, if it existed as a coding mechanism, would be most evident. Autocorrelograms (Fig. 7) reveal that the number of spikes increased as stimulus frequency increased (the height of the “shoulder” of the autocorrelogram), yet no frequency-dependent temporal firing patterns emerged. Even at the lowest frequency (19 Hz), there was no autocorrelogram peak at 53 msec, as would be expected if firing were phase-locked to stimulus cycles. In contrast, the firing rate of the single unit was clearly proportional to vibration frequency, increasing progressively as frequency increased (Fig. 7b).
Because individual neurons do not appear to encode vibration features through time-locked signals, we decided to characterize the neuronal encoding of vibration parameters for large neuronal populations by summating the spikes recorded at all electrodes positioned in the barrel cortex. These data came from at least 16 electrodes in each experiment (see Materials and Methods). For the five experiments, the mean population firing rates for the entire stimulus duration (0-500 msec) are given in Figure 8a. The strong correlation between stimulus speed and response magnitude was highly reproducible in different rats.
Figure 8.
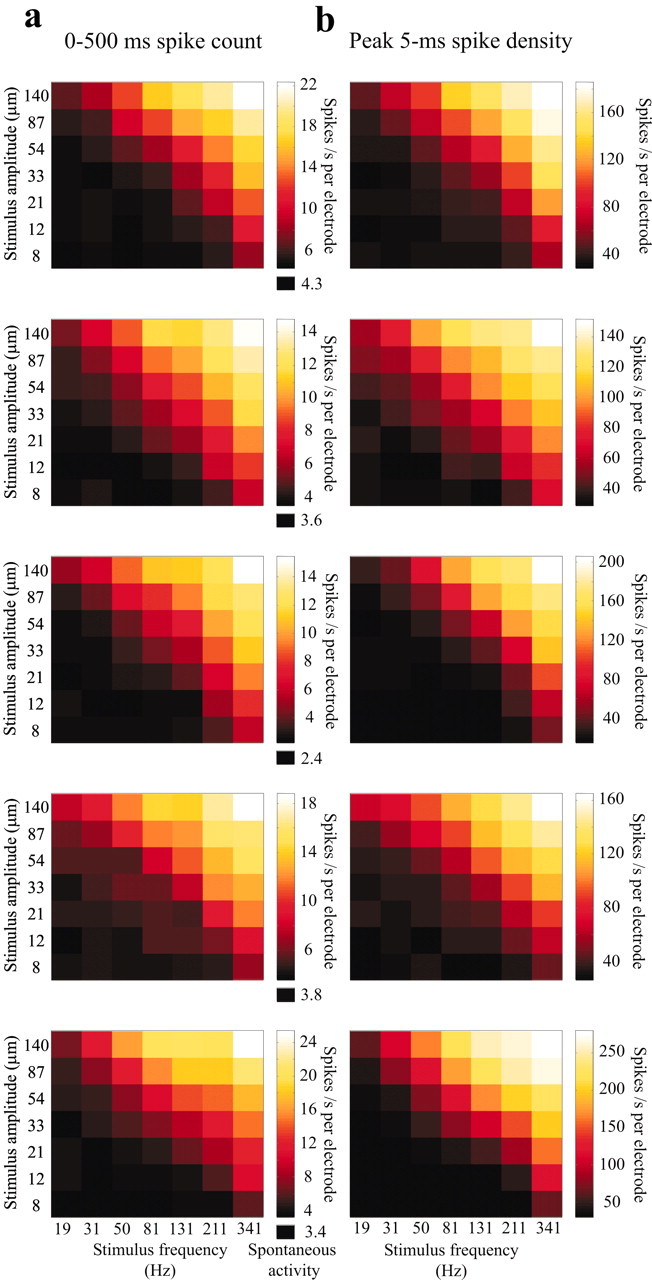
Neuronal encoding of mean stimulus speed on multiple time scales. a, Af-coding at a 500 msec time scale. Mean population firing rate for all electrodes positioned in the barrel cortex for experiments 1-5, measured by counting the spikes pooled from all electrodes during the entire stimulus presentation window (0-500 msec). The average firing rate in the 500 msec interval preceding stimulus onset is denoted as spontaneous activity, below the color scale. Neuronal activity was recorded at 16, 24, 37, 35, and 18 electrodes in experiments 1-5, respectively. The strong correlation between Af and response magnitude was highly reproducible in different rats. b, Af-coding by peak spike density counted over a sliding time window of 5 msec (see Results for analysis method). Each plot is matched with the 500 msec spike count for the same experiment plotted on the left. For each of the five experiments, the encoding of the stimulus feature Af by maximum, instantaneous spike density was nearly indistinguishable from the encoding of this feature by a long-time window spike count.
In the analyses to this point, neuronal responses were characterized by the activity in a window whose beginning and end time were fixed exactly to the time of stimulus onset. However, “downstream” neurons that integrate barrel cortex spike trains may not have independent signals regarding stimulus onset time. Moreover, the intervals across which downstream neurons integrate spikes may be much shorter than the periods of several hundred milliseconds we have considered; freely moving rats can make texture discriminations in shorter time spans (Carvell and Simons, 1990). It is important to consider whether a fast, “stimulus time-free” code might represent the vibration features. Therefore, we also quantified the neuronal response in a simple way that does not make use of the exact stimulus onset time: we shifted a narrow temporal window in 1 msec steps along the whole-array spike train and registered the maximum number of spikes falling in the window on each trial. The sliding window began 500 msec before stimulus onset and ended 500 msec after stimulus offset. For each stimulus, we computed the average of this peak across trials. The method included no explicit knowledge of stimulus onset time besides the separation of successive trials. Results for a 5 msec time window are shown in Figure 8b. For each of the five experiments, the encoding of stimulus speed by peak firing rate was nearly indistinguishable from the encoding of stimulus speed by a long-time window firing rate (Fig. 8a). This finding was insensitive to the width of the sliding time window for the entire range tested, from 2 to 50 msec.
Discussion
Identifying the encoded feature of the stimulus
In the present study, to our surprise, neither vibration frequency f nor amplitude A was reported in the activity of barrel cortex neurons in any unambiguous manner. Instead, the firing rate of barrel cortex neurons was related to log(Af)n. We illustrated the results with n = 1, such that neuronal activity was considered in relation to the mean speed of deflection. However, the same monotonic relation between stimulus and neuronal activity would have been obtained with, for example, n = 2; the quantity (Af)2 characterizes the kinetic energy of vibration. Because vibration energy and mean speed differ only by the exponent n, it is impossible to know whether neuronal activity encodes one, the other, or some combination. On the other hand, the data exclude the coding of any physical property of the vibration that has an asymmetric dependence on amplitude and frequency. One such property is acceleration, proportional to Af2. If cortical neurons explicitly encoded acceleration, then their activity would have depended more strongly on changes in frequency than on changes in amplitude.
From the present study, certain differences between subcortical and cortical responses to stimulus kinetics can be identified. Primary afferents can “follow” sinusoidal stimuli in a phase-locked manner at high frequencies (Dykes, 1975; Gottschaldt and Vahle-Hinz, 1981), whereas cortical neurons cannot. In contrast, some properties of the subcortical stations are conserved in cortical neurons. One example is the threshold for whisker velocity. In our experiments, the response threshold fell somewhere between the fourth and sixth velocity bands (Fig. 8), corresponding to 4-10 mm/sec at 5 mm distance from the skin. This places them near the typical threshold range for primary afferent fibers (8 mm/sec) (Gibson and Welker, 1983; Shoykhet et al., 2000) and for neurons in the ventral posterior medial nucleus of the thalamus (Ito, 1988) when measured using ramp and hold stimuli.
Converging results with multiple analytical approaches
To demonstrate the robustness of cortical vibration coding, we showed that the relation between Af and firing rate was very strong whether the window over which firing rate was measured included the entire 500 msec stimulus presentation (Figs. 5a,8a) or else a smaller window comprising only the “adapted” part of the response (Fig. 5b). Because these measures depend on the experimenter synchronizing the response measurement on stimulus onset time (information that the rat itself may not have), we examined an alternative coding scheme that is independent of a precise knowledge of stimulus time. On each trial, we slid a narrow time window along the whole-array spike train and registered the peak firing rate. From the mean of this peak across trials an explicit representation of Af nevertheless emerged (Fig. 8b).
Contact with an object during natural whisking usually is maintained for some tens of milliseconds in each whisking cycle (Sachdev et al., 2001; Berg and Kleinfeld, 2003), and a candidate coding mechanism must allow for stimulus information to be integrated on this time scale. In this light, the representation of Af by peak firing rate is particularly appealing not only because it is “stimulus time-free,” but also because it is rapid: the information necessary to distinguish stimuli is present within as little as 5-15 msec after stimulus onset. It is interesting that, when tested for the encoding of an entirely different sort of information (the identity of a single deflected whisker), barrel cortex activity provides maximum discriminability on the same time scale (Petersen and Diamond 2000; Panzeri et al., 2001; Petersen et al., 2002).
In contrast to their rapid and robust neuronal representation of the product Af, none of the firing rate decoding methods differentiated frequency or amplitude independently. We therefore looked to temporal codes. We asked whether two iso-Af stimuli with similar mean firing rates could induce distinct spike timing patterns correlated with frequency or amplitude. Neither the time-varying firing rate profile, as estimated by the PSTH, nor the within-cluster temporal patterns, as estimated by the autocorrelogram, could distinguish vibration amplitude or frequency. Further work with formal informational methods (Panzeri and Schultz, 2001; Panzeri et al., 2001; Pola et al., 2002) will be able to delineate exactly how much information is carried by neuronal activity about different stimulus features, which aspects of neuronal activity (firing rate, correlations) carry the information, and precisely how much stimulus discriminability could be afforded by the coding properties of cortical neurons.
Models for texture discrimination
In primates, the leading model for tactile texture discrimination proposes that type I slowly adapting receptors contain an isomorphic representation of the surface in their discharge patterns (Blake et al., 1997; Yoshioka et al., 2001). The response of these afferent fibers is then spatially filtered by neurons in area 3b of the primary somatosensory cortex to compute local spatial variations or roughness (Hsiao et al., 1993; Johnson, 2001). Although rats have texture discrimination capacities rivaling those of humans, there is, to date, no specific proposal for the neuronal representation of object features. One thing is certain: gross differences at the receptor level exclude the possibility that the same mechanisms could account for tactile processing in primates and rats. Examples of such differences include the specialized structure of hair follicles, the presence of different receptor types, and the discrete nature of the whisker grid, as compared with the continuous structure of the skin. The present study is a first step in addressing how the rat whisker sensory system has achieved capacities similar to those of primates through an independent coding strategy.
The challenge is to discover the essential differences in the neural representations of two different surface textures. In awake, behaving animals this has proved difficult and inconclusive (Prigg et al., 2002). Our expectation is that from experiments in anesthetized animals we can formulate specific hypotheses to be tested subsequently in awake, mobile animals. Sinusoidal vibrations, although inevitably a simplification of the waveforms generated at the follicle as the whiskers scan a surface, provide a controllable model containing some of the critical features associated with textures. The simplest interpretation of our results is that neurons encode textures not in terms of whisker vibration frequencies but rather in terms of the velocity (Af) or kinetic energy (Af)2 of the whisker vibration. More specifically, as the rat's whisking motion sweeps the whiskers across an object, the surface features, ridges or grains, for example, could produce whisker vibrations superimposed on the sweep. Surfaces might be distinguishable by the velocity (or kinetic energy) of the vibrations. The complete understanding of texture coding will need to take into account a number of additional factors. The vibration induced in a whisker as it sweeps over a surface is likely to depend on the properties of active whisking (whisking frequency and sweep amplitude), the structure of the textured surface, the distance between the base of the whisker and the point of surface contact, as well as the intrinsic mechanical properties of the whiskers.
This last factor is of particular interest because the mechanical properties of whiskers affect the transmission of vibrations along the shaft. Whisker length varies systematically across different arcs on the rat's snout (Brecht et al., 1997); as a consequence, the longer, caudal ones resonate at lower frequencies than the shorter rostral ones (Neimark et al., 2003). This suggests that the whisker array might act analogously to the cochlea, differentially distributing across the whiskerpad the principal frequencies associated with different surfaces. Induced frequencies matching the resonance frequency of the whisker would transmit the largest amount of energy to the base and, according to the findings presented here, this energy would be encoded in the sensory pathways. Rats could judge texture according to a comparison of the amount of energy transmitted by each whisker.
A second set of studies suggests an entirely different sort of mechanism. High-frequency (>200 Hz) oscillations in barrel cortex surface field potentials are evoked by whisker deflection (Jones and Barth, 1999; Jones et al., 2000). The oscillations are time-locked to stimulus onset, and the peak amplitude of the oscillation is centered on the column of the stimulated whisker. Most importantly, the oscillations induced by simultaneous stimulation of different whiskers interact depending on submillisecond time differences in the stimulus onsets; slight changes in relative stimulus timing determine whether there is constructive or destructive interference in the field potentials. Taken together, these observations point to a model in which different textures generate distinct timing patterns among the whiskers, and such timing patterns are represented in the high-frequency oscillations in barrel cortex. The proposal we have put forward differs from both ideas outlined above in that multiwhisker patterns do not appear to be a critical component of the cortical representation of texture in our model.
Additional work involving neuronal recordings from awake animals will be required to test whether barrel cortex neurons encode whisker vibrations during natural behavior and whether such coding is in fact an essential mechanism underlying tactile discrimination.
Footnotes
This work was supported by European Community IST-2000-28127, Telethon Foundation GGP02459, J. S. McDonnell Foundation 20002035, Consiglio Nazionale delle Ricerche 02.00536.ST97, Wellcome Trust 066372/Z/01/Z, and Regione Friuli Venezia Giulia. We thank Miguel Maravall, Stefano Panzeri, Adrienne Fairhall, Marcelo Magnasco, and John Nicholls for valuable discussions and Erik Zorzin for construction of the optic sensor.
Correspondence should be addressed to Mathew E. Diamond, Cognitive Neuroscience Sector, International School for Advanced Studies, Via Beirut 2/4, 34013 Trieste, Italy. E-mail: diamond@sissa.it.
Copyright © 2003 Society for Neuroscience 0270-6474/03/239146-09$15.00/0
References
- Armstrong-James M, Fox K ( 1987) Spatiotemporal convergence and divergence in the rat S1 “barrel” cortex. J Comp Neurol 263: 265-281. [DOI] [PubMed] [Google Scholar]
- Berg RW, Kleinfeld D ( 2003) Rhythmic whisking by rat: retraction as well as protraction of the vibrissae is under active muscular control. J Neurophysiol 89: 104-117. [DOI] [PubMed] [Google Scholar]
- Blake DT, Hsiao SS, Johnson KO ( 1997) Neural coding mechanisms in tactile pattern recognition: the relative contributions of slowly and rapidly adapting mechanoreceptors to perceived roughness. J Neurosci 17: 7480-7489. [DOI] [PMC free article] [PubMed] [Google Scholar]
- Brecht M, Preilowski B, Merzenich MM ( 1997) Functional architecture of the mystacial vibrissae. Behav Brain Res 84: 1-97. [DOI] [PubMed] [Google Scholar]
- Carvell GE, Simons DJ ( 1990) Biometric analyses of vibrissal tactile discrimination in the rat. J Neurosci 10: 2638-2648. [DOI] [PMC free article] [PubMed] [Google Scholar]
- Chapin JK, Lin CS ( 1984) Mapping the body representation in the SI cortex of anesthetized and awake rats. J Comp Neurol 229: 99-213. [DOI] [PubMed] [Google Scholar]
- Diamond ME, Armstrong-James M, Ebner FF ( 1993) Experience-dependent plasticity in adult rat barrel cortex. Proc Natl Acad Sci USA 90: 2082-2086. [DOI] [PMC free article] [PubMed] [Google Scholar]
- Dykes RW ( 1975) Afferent fibers from mystacial vibrissae of cats and seals. J Neurophysiol 38: 650-662. [DOI] [PubMed] [Google Scholar]
- Fee MS, Mitra PP, Kleinfeld D ( 1997) Central versus peripheral determinants of patterned spike activity in rat vibrissa cortex during whisking. J Neurophysiol 78: 1144-1149. [DOI] [PubMed] [Google Scholar]
- Gibson JM, Welker WI ( 1983a) Quantitative studies of stimulus coding in first-order vibrissae afferents of rat. I: Receptive field properties and threshold distributions. Somatosens Res 1: 51-66. [DOI] [PubMed] [Google Scholar]
- Gibson JM, Welker WI ( 1983b) Quantitative studies of stimulus coding in first-order vibrissae afferents of rat. II: Adaptation and coding of stimulus parameters. Somatosens Res 1: 95-117. [DOI] [PubMed] [Google Scholar]
- Gottschaldt KM, Vahle-Hinz C ( 1981) Merkel cell receptors: structure and transducer function. Science 214: 143-186. [DOI] [PubMed] [Google Scholar]
- Guic-Robles E, Valdivieso C, Guajardo G ( 1989) Rats can learn a roughness discrimination using only their vibrissal system. Behav Brain Res 31: 285-289. [DOI] [PubMed] [Google Scholar]
- Guillory KS, Normann RA ( 1999) A 100-channel system for real time detection and storage of extracellular spike waveforms. J Neurosci Methods 91: 21-29. [DOI] [PubMed] [Google Scholar]
- Hall RD, Lindholm EP ( 1974) Organization of motor and somatosensory neocortex in the albino rat. Brain Res 66: 23-38. [Google Scholar]
- Hsiao SS, Johnson KO, Twombly IA ( 1993) Roughness coding in the somatosensory system. Acta Psychol (Amst) 84: 53-67. [DOI] [PubMed] [Google Scholar]
- Ito M ( 1985) Processing of vibrissa sensory information within the rat neocortex. J Neurophysiol 54: 479-490. [DOI] [PubMed] [Google Scholar]
- Ito M ( 1988) Response properties and topography of VPM neurons in the rat. J Neurophysiol 60: 1161-1197. [DOI] [PubMed] [Google Scholar]
- Jensen KF, Killackey HP ( 1987) Terminal arbors of axons projecting to the somatosensory cortex of the adult rat. I. The normal morphology of specific thalamocortical afferents. J Neurosci 7: 3529-3543. [DOI] [PMC free article] [PubMed] [Google Scholar]
- Johnson KO ( 2001) The roles and functions of cutaneous mechanoreceptors. Curr Opin Neurobiol 11: 455-461. [DOI] [PubMed] [Google Scholar]
- Jones MS, Barth DS ( 1999) The spatiotemporal organization of fast (>200 Hz) electrical oscillations in rat vibrissa/barrel cortex J Neurophysiol 82: 1599-1609. [DOI] [PubMed] [Google Scholar]
- Jones MS, MacDonald KD, Choi BJ, Dudek FE, Barth DS ( 2000) Intracellular correlates of fast (>200 Hz) electrical oscillations in rat somatosensory cortex. J Neurophysiol 1505-1518. [DOI] [PubMed]
- Neimark MA, Andermann ML, Hopfield JJ, Moore CI ( 2003) Vibrissa response as a transduction mechanism for tactile encoding. J Neurosci 23: 6499-6509. [DOI] [PMC free article] [PubMed] [Google Scholar]
- Panzeri S, Schultz SR ( 2001) A unified approach to the study of temporal, correlational and rate coding. Neural Comput 13: 1311-1349. [DOI] [PubMed] [Google Scholar]
- Panzeri S, Petersen RS, Schultz SR, Lebedev M, Diamond ME ( 2001) The role of spike timing in the coding of stimulus location in rat somatosensory cortex. Neuron 29: 769-777. [DOI] [PubMed] [Google Scholar]
- Petersen RS, Diamond ME ( 2000) Spatio-temporal distribution of whisker-evoked activity in rat somatosensory cortex and the coding of stimulus location. J Neurosci 20: 6135-6143. [DOI] [PMC free article] [PubMed] [Google Scholar]
- Petersen RS, Panzeri S, Diamond ME ( 2001) Population coding of stimulus location in rat somatosensory cortex. Neuron 32: 503-514. [DOI] [PubMed] [Google Scholar]
- Petersen RS, Panzeri S, Diamond ME ( 2002) Population coding in somatosensory cortex. Curr Opin Neurobiol 12: 441-447. [DOI] [PubMed] [Google Scholar]
- Pinto DJ, Brumberg JC, Simons DJ ( 2000) Circuit dynamics and coding strategies in rodent somatosensory cortex. J Neurophysiol 83: 1158-1166. [DOI] [PubMed] [Google Scholar]
- Pola G, Schultz S, Petersen RS, Panzeri S ( 2002) A practical guide to information analysis of spike trains. In: Tools for neuroscience databases (Kotter R, ed), pp 137-152. Kluwer: Academic.
- Prigg T, Goldreich D, Carvell GE, Simons DJ ( 2002) Texture discrimination and unit recordings in the rat whisker/barrel system. Physiol Behav 77: 671-675. [DOI] [PubMed] [Google Scholar]
- Rousche PJ, Normann RA ( 1992) A method for pneumatically inserting an array of penetrating electrodes into cortical tissue. Ann Biomed Eng 20: 413-422. [DOI] [PubMed] [Google Scholar]
- Rousche PJ, Petersen RS, Battiston S, Giannotta S, Diamond ME ( 1999) Examination of the spatial and temporal distribution of sensory cortical activity using a 100-electrode array. J Neurosci Methods 90: 57-66. [DOI] [PubMed] [Google Scholar]
- Sachdev RN, Sellien H, Ebner F ( 2001) Temporal organization of multi-whisker contact in rats. Somatosens Mot Res 18: 91-100. [DOI] [PubMed] [Google Scholar]
- Sachdev RN, Sato T, Ebner FF ( 2002) Divergent movement of adjacent whiskers. J Neurophysiol 87: 1440-1448. [DOI] [PubMed] [Google Scholar]
- Shoykhet M, Doherty D, Simons D ( 2000) Coding of deflection velocity and amplitude by whisker primary afferent neurons: implications for higher level processing. Somatosens Mot Res 17: 171-180. [DOI] [PubMed] [Google Scholar]
- Simons DJ ( 1978) Response properties of vibrissa units in rat SI somatosensory neocortex. J Neurophysiol 41: 798-820. [DOI] [PubMed] [Google Scholar]
- Welker C ( 1971) Microelectrode delineation of fine grain somatotopic organization of (SmI) cerebral neocortex in albino rat. Brain Res 26: 259-275. [PubMed] [Google Scholar]
- Welker WI ( 1964) Analysis of sniffing of the albino rat. Behavior 22: 223-244. [Google Scholar]
- Woolsey TA, Van der Loos H ( 1970) The structural organization of layer IV in the somatosensory region (SI) of mouse cerebral cortex. The description of a cortical field composed of discrete cytoarchitectonic units. Brain Res 17: 205-242. [DOI] [PubMed] [Google Scholar]
- Yoshioka T, Gibb B, Dorsch AK, Hsiao SS, Johnson KO ( 2001) Neural coding mechanisms underlying perceived roughness of finely textured surfaces. J Neurosci 21: 6905-6916. [DOI] [PMC free article] [PubMed] [Google Scholar]


