

Abstract
Fetal alcohol syndrome is a major cause of learning and sensory deficits. These disabilities may result from disruption of neocortex development and plasticity. Alcohol exposure during the third trimester equivalent of human gestation may have especially severe and long-lasting consequences on learning and sensory processing, because this is when the functional properties and connectivity of neocortical neurons start to develop. To address this issue, we used the monocular deprivation model of neural plasticity, which shares many common mechanisms with learning. Ferrets were exposed to ethanol (3.5 mg/kg, i.p.) on alternate days for 3 weeks starting on postnatal day (P) 10. Animals were then monocularly deprived at the peak of ocular dominance plasticity after a prolonged alcohol-free period (15-20 d). Quantitative single-unit electrophysiology revealed that alcohol exposure disrupted ocular dominance plasticity while preserving robust visual responses. Moreover, optical imaging of intrinsic signals revealed that the reduction in visual cortex area driven by the deprived eye was much less pronounced in ethanol-treated than in control animals. Alcohol exposure starting at a later age (P20) did not disrupt ocular dominance plasticity, indicating that timing of exposure is crucial for the effects on visual plasticity. In conclusion, alcohol exposure during a brief period of development impairs ocular dominance plasticity at a later age. This model provides a novel approach to investigate the consequences of fetal alcohol exposure and should contribute to elucidate how alcohol disrupts neural plasticity.
Keywords: alcohol, ocular dominance plasticity, visual development, ferret, monocular deprivation, optical imaging, neocortex development, fetal alcohol syndrome
Introduction
Fetal alcohol syndrome (FAS), one of the leading causes of mental retardation in the Western world, is characterized by a constellation of behavioral and physiological abnormalities that includes learning and sensory deficits (Jones and Smith, 1973). Some neurological deficits found in children with FAS may be closely associated with peripheral malformations (Miller et al., 1981; Garber, 1982; Stromland, 1985; Robinson and Conry, 1986; Phillips, 1991), but developmental problems involving the neocortex make a major contribution to learning and sensory abnormalities. In extreme cases, major structural anomalies occur in the brain, including microcephaly (West et al., 1987), callosal agenesis (Mattson and Riley, 1996), and anomalies of cortical neuron dendritic spines (Ferrer and Galofre, 1987). However, cortical impairments are also present even when effects of fetal alcohol intoxication are not as extreme (Church et al., 1997; Kaneko and Riley, 2003). A recent study has provided evidence that prenatal alcohol disrupts neocortical processing and storage of information by showing that alcohol ingestion throughout gestation induced a persistent reduction of neuronal responses and plasticity in the barrel cortex (Rema and Ebner, 1999). However, these results do not clarify whether the effects of alcohol on sensory plasticity resulted from the depression of sensory responses or from a specific disruption of molecular mechanisms that underlie neural plasticity.
The effects of alcohol on the neocortex may be especially important during the third trimester equivalent of human gestation, when the neocortex is just starting to develop and major changes occur in its anatomical and functional properties. Alcohol could disrupt several critical developmental processes, including neuronal differentiation, synaptogenesis, circuit formation, and remodeling of neural connections that characterize this period of gestation (Guerri, 1998). The ferret is an excellent model for studying the effects of alcohol on cortical development, because its third trimester equivalent of human gestation occurs postnatally. In ferrets, lateral geniculate axons invade the cortical plate and start forming synapses with layer IV neurons during the second week of postnatal life (Herrmann et al., 1994). Even before eye opening at approximately postnatal day (P) 32, cortical neurons are already developing receptive field properties, such as orientation selectivity, that characterize the mature cortex of higher mammals (Chapman and Stryker, 1993). Alcohol intoxication during this period may have drastic effects on the development and plasticity of neural circuits in the neocortex and ultimately on the ability of the neocortex to process and store information. To examine this possibility, we used the monocular deprivation (MD) model of visual plasticity, one of the best characterized models of neuronal plasticity in the neocortex. We asked whether alcohol exposure from P10-P30 disrupts visual cortical plasticity at a later age. Quantitative single-unit recording and optical imaging of intrinsic activity revealed that exposure of ferrets to alcohol on alternate days during this relatively short period of development is sufficient to induce a drastic reduction in ocular dominance plasticity while preserving visual responses.
Materials and Methods
Ferrets received a series of alcohol injections (3.5 mg/kg, 25% in saline, i.p.) every other day for a period of 3 weeks and, as controls, additional animals were injected with vehicle saline solution or did not receive any treatment. The treatment started at P10, when thalamic axons start connecting with layer IV neurons in the primary visual cortex (Herrmann et al., 1994), or P20, approximately the time when ocular dominance modules are first seen (Crowley and Katz, 2000). Blood samples were obtained from the tail tip at different times after an injection, and blood alcohol levels were analyzed using a commercial kit (333-A diagnostics kit; Sigma, St. Louis, MO). Blood alcohol levels of 254 ± 13 mg/dl were observed 1-5 hr after the injection. As shown in Figure 1a, the blood alcohol level was reduced from this maximum within 22 hr and was undetectable 34 hr after the injection. Alcohol-treated animals at ages between P45 and P50 had a tendency to weigh less than saline-treated littermates or untreated animals at the same age (Fig. 1b), although differences are not statistically significant (one-way ANOVA; p = 0.08; 17 ethanol-treated animals; 7 saline-treated animals; 8 untreated animals). Even if saline and untreated animals are pooled together, the difference is still not significant (p = 0.11; t test).
Figure 1.

Blood alcohol levels in young ferrets exposed to alcohol. a, Levels of blood alcohol, 1-5 hr after an intraperitoneal injection, were 254 ± 13 mg/dl. A reduction in blood alcohol from this peak value was observed within 22 hr, and alcohol was no longer detectable 34 hr after the injection. The number of animals used to estimate blood alcohol levels at different time points was as follows: 1 hr, 3 animals; 2 hr, 5 animals; 3 hr, 6 animals; 5 hr, 4 animals; 22 hr, 4 animals; 34 hr, 2 animals. Blood was collected once from each animal. b, Body weight at the time of recording. Ethanol-treated animals showed a small but nonsignificant (p > 0.05) reduction in body weight relative to normal and saline-treated animals.
Ferrets at P45-P50, at the peak of ocular dominance plasticity (Issa et al., 1999), had the lid of the right eye sutured closed to prevent patterned visual stimulation. After 3, 5, or 10 d of monocular deprivation, the animals were anesthetized and quantitative single-unit in vivo electrophysiology or optical imaging of intrinsic signals was performed to assess changes in ocular dominance in the left hemisphere. All procedures described in this study were approved by the Institutional Animal Care and Use Committee at Virginia Commonwealth University.
In vivo electrophysiology. Animals were premedicated by subcutaneous injection of a tranquilizer (acepromazine; 2 mg/kg), a muscarinic antagonist (methyl atropine bromide; 0.2 mg/kg) to reduce bronchial secretion, and dexamethasone sodium phosphate (0.5 mg/kg) to reduce inflammation. Animals were then anesthetized using sodium pentobarbital (35 mg/kg, i.p.; Abbott Labs, North Chicago, IL) and placed in a stereotaxic frame. No procedures started until the animal was sufficiently anesthetized, as ascertained by the loss of withdrawal and cornea-blink reflexes. A tracheal cannulation was performed, and the animal was placed on a ventilator. Heart rate, expired CO2, and arterial blood oxygen saturation (SpO2) were monitored continuously and maintained at ∼4.0% and above 90%, respectively. Body temperature was maintained at 38°C using a homeostatic blanket. The eyelids were opened, nictitating membranes were retracted using phenylephrine hydrochloride (2.5%), the pupils were dilated with atropine sulfate (1%), and contact lenses were placed on the corneas. A craniotomy (diameter, 3-4 mm) was performed to expose the binocular region of the left primary visual cortex where recordings were performed.
Paralytics were used in four control animals and eight treated animals. Animals were paralyzed using pancuronium bromide (0.2 mg/kg, i.p.), given along with the sodium pentobarbital. To comply with the National Institutes of Health guidelines for use of paralytic agents, muscle relaxants were not administered in the remaining animals. Similar visual responsiveness was observed in paralyzed and nonparalyzed animals: the mean visual response was 7.8 ± 0.3 spikes per run in paralyzed animals, and 8.4 ± 0.2 in nonparalyzed animals (t test; p > 0.05). The results for the two groups of animals have been pooled together. Supplemental doses of pentobarbital were varied as needed with the average dose (12 mg/kg, i.p.) lower than the initial dose. Pentobarbital and pancuronium bromide (0.1 mg/kg, i.p.) were given approximately every hour throughout the experiment or when the heart rate or expired CO2 increased. To determine whether repeated pentobarbital administration may have affected visual responses over time, we computed the correlation between time of recording and responsiveness (in spikes per run) for each animal. The correlation coefficients (with significance level) for the alcohol-treated animals were the following: 0.53 (p = 0.002), 0.07 (p = 0.7), 0.003 (p = 0.98), 0.023 (p = 0.9), 0.14 (p = 0.46), 0.108 (p = 0.43), 0.09 (p = 0.56), 0.2 (p = 0.24), 0.03 (p = 0.85), 0.23 (p = 0.2), 0.035 (p = 0.83), 0.05 (p = 0.77), 0.18 (p = 0.28), 0.07 (p = 0.65), 0.115 (p = 0.53), 0.30 (p = 0.08), 0.134 (p = 0.45), 0.2 (p = 0.19), 0.07 (p = 0.7), 0.3 (p = 0.07), 0.7 (p = 0.0005), and 0.16 (p = 0.37). The correlation coefficients (multiple R) and proof value for the control animals were the following: 0.38 (p = 0.06), 0.04 (p = 0.83), 0.165 (p = 0.3), 0.12 (p = 0.46), 0.23 (p = 0.27), 0.028 (p = 0.91), 0.188 (p = 0.4), 0.03 (p = 0.88), 0.005 (p = 0.98), 0.53 (p = 0.02), 0.23 (p = 0.15), 0.34 (p = 0.18), and 0.06 (p = 0.76). This analysis revealed that the great majority (32 of 35) of animals maintained visual responsiveness during the experiment. In the case of the three animals showing significant change in response with time (p < 0.05), responses were found to have decreased (two cases) or increased (one case). Collectively, the results indicate that repeated pentobarbital administration did not affect visual responses over time.
Single-unit recordings were conducted using a glass-coated tungsten microelectrode with a 5 μm exposed tip lowered into the primary visual cortex at an ∼20° angle to the vertical. To minimize sampling bias, single-unit recordings used in this study were separated at least 100 μm along the electrode track. After the isolation of a single unit, its receptive field was mapped and the optimal stimulus orientation, direction, and velocity determined qualitatively with a moving bar of light projected onto a tangent screen. All data were collected from cells in the binocular region of the visual field. Ocular dominance, spontaneous activity, and number of spikes per stimulus were then quantitatively determined for each cell by presenting a computer-controlled bar of light to each eye. Each stimulus presentation consisted of the bar of light moving across the receptive field at the optimal orientation in one direction and back across in the opposite direction. Spikes were collected on a computer during the 10 stimulus presentations using Spike 2 software (Cambridge Electronics Design, Cambridge, UK), and peristimulus histograms were generated. Spontaneous activity was determined by recording activity in the absence of stimulation. Repeated qualitative evaluation of receptive field position in nonparalyzed animals as well as examination of computer-generated times of spike firing were used to examine eye movements during recording of responses from each neuron. At the conclusion of the electrophysiology experiment, ferrets were killed with Euthasol (125 mg/kg; Delmarva Laboratories, Midlothian, VA).
To quantify cortical binocularity, an ocular dominance index was calculated for each cell using the following equation: (LE)/(LE + RE), where LE indicates the response to stimulation of the left eye, and RE indicates the response to stimulation for the right eye. Additionally, a contralateral bias index (CBI) was calculated and defined as [(P0.00 - 0.19 - P0.80 - 1.00) + (P0.20 - 0.39 - P0.60 - 0.79)/2 + 100]/200, where PA - B denotes the percentage of cells with binocular indices between A and B. The results were analyzed statistically using a Wilcoxon Mann-Whitney rank sum test. Comparisons of maximal visual responses and spontaneous activity in normal and treated animals were conducted using a t test.
Optical imaging of intrinsic signals. Optical imaging of intrinsic signals was performed with Imager 2001 VSD+ (Optical Imaging, Germantown, NY) by using imaging methods slightly modified from those described previously (White et al., 1999). Briefly, animals were premedicated, anesthetized, and ventilated with similar procedures described for single-unit recordings. Temperature, heart rate, expired CO2, and SpO2 were monitored continuously. A craniotomy was made over the left hemisphere to expose the dorsal area of the occipital cortex. The dura was reflected and the opening was filled with agar (2.5% in saline) and covered with a glass coverslip. First, an image of the vascular pattern of the cortical surface was obtained by illuminating the cortical surface with green filter (∼550 nm) using a tungsten-halogen light source. Images of intrinsic signals were then obtained by using a red filter (∼700 nm). Visual stimulation consisting of high-contrast rectangular wave gratings (8.75/1.25° dark/light phase) was generated on a 21 inch monitor (Sony Trinitron; Sony, Tokyo, Japan) using SGT+ graphics board and STIM software (generously provided by Kaare Christian, Optical Imaging, Germantown, NY). Gratings were presented monocularly at an angle of 0, 45, 90, or 135° and drifted (22.5°/sec) in both directions along the axis orthogonal to the orientation of the grating. A single trial consisted of these four gratings and a blank screen presented to each eye for 9 sec in a pseudorandom sequence, with data acquisition during the last 8 sec. The eye shutters (Optical Imaging) were controlled by the acquisition computer. A total of 20 trials was performed for each eye and the summed images used to obtain a single condition map by subtracting responses to each eye from responses to a blank screen. In these images, dark areas correspond to regions responsive to the stimulated eye. In addition, an ocular dominance image was obtained by subtracting the summed images obtained with the left eye from the summed images obtained with the right eye. In these images, dark areas responded best to stimulation of the right eye, and white areas responded best to stimulation of the left eye. We obtained an ocular dominance profile from these differential images by computing the position of each pixel along a grayscale containing 256 levels of gray. In this scale, the darkest pixel corresponds to an arbitrary value of 0 and represents the largest response to the right eye. The lightest pixel corresponds to an arbitrary value of 255 and represents the best response to the left eye. This ocular dominance profile was quantified from the maps in V1, which is located caudally to the large V2 ipsilateral modules in the ferret (White et al., 1999).
Results
We examined the effects on ocular dominance plasticity of exposure to blood alcohol (254 ± 13 mg/dl) on alternate days starting at P10 or P20. After an alcohol-free period (15-20 d), animals were monocularly deprived starting at P45-P50, the peak of ocular dominance plasticity. Effects of alcohol exposure on ocular dominance plasticity were investigated using single-unit recordings of 1033 striate cortical neurons from 32 animals and optical imaging of intrinsic signals in the primary visual cortex of 13 animals (Table 1).
Table 1.
Groups of animals used in this study
|
|
|
Number of animals (number of cells) |
||
|---|---|---|---|---|
|
|
|
Single unit recordings
|
Optical imaging
|
|
| Normal | No md | 4 (100) | 3 | |
| Untreated | md 3 d | 3 (100) | 3 | |
| md 5 d | 1 (17) | |||
| Saline | md 3 d | 3 (98) | 3 | |
| md 5 d | 2 (46) | |||
| Ethanol P10-P30 | No md | 3 (96) | ||
| md 3 d | 7 (247) | 4 | ||
| md 5 d | 3 (29) | |||
| md 10 d | 3 (83) | |||
| Ethanol P10-P25 | md 3 d | 3 (114) | ||
| Ethanol P20-P40 | md 3 d | 3 (103) | ||
| TOTAL
|
|
32 (1033)
|
13
|
|
Effects of alcohol exposure were studied at the peak of ocular dominance plasticity using single-unit recordings or optical imaging. Two groups of animals were injected with alcohol for 21 d starting at P10 or P20. An additional group was injected for 16 d starting at P10. Control animals were littermates injected with saline and untreated monocularly deprived (md) animals. An additional group of animals included in this study was untreated and nondeprived (normal) animals.
Single-unit responses
After 3 d of deprivation, extracellular recordings were conducted in the binocular region of the primary visual cortex. To quantify ocular dominance of cortical neurons, we calculated an ocular dominance index as described in Materials and Methods. An ocular dominance index of 1.0 indicates that a neuron is responsive only to the left eye, and an ocular dominance index of 0.0 indicates responses only to the right eye.
The primary visual cortex of normal ferrets is characterized by a large number of neurons responsive to visual stimulation of both eyes, but the majority of neurons are dominated by the contralateral eye (Issa et al., 1999). Figure 2a shows the typical ocular dominance profile in untreated ferrets that received normal visual experience. As expected, monocular deprivation of control animals resulted in an almost complete loss of responses to the deprived eye. Figure 2 shows a marked ocular dominance shift in the left hemisphere of deprived ferrets treated with saline (b,c,d) or untreated (e,f,g) relative to normal (a).
Figure 2.

Effects of 3 d of monocular deprivation on cortical binocularity of control animals. a, The histogram with error bars shows the ocular dominance profile for neurons in the primary visual cortex of normal ferrets. The primary visual cortex of these animals was characterized by a large number of binocular cells with most neurons dominated by the contralateral eye. b-g, In contrast, after 3 d of monocular deprivation, histograms for individual animals treated with saline (b,c,d) as well as untreated animals (e,f,g) indicate a markedly shifted distribution of ocular dominance in the direction of the nondeprived ipsilateral eye.
One characteristic of FAS is a high incidence of strabismus (Jones and Smith, 1973; Miller et al., 1981; Stromland, 1985; Majewski, 1993). Strabismus may in turn induce a reduction of cortical neuron binocularity (Daw, 1995). For this reason, we examined whether alcohol-treated ferrets that received visual stimulation through both eyes developed normal cortical binocularity. Figure 3a, which pools together results from alcohol-treated animals that received normal visual experience, shows that most neurons were binocular and dominated by the contralateral eye. This ocular dominance profile is similar to that present in normal animals (compare Figs. 3a and 2a). Monocular deprivation had relatively little effect on the cortical ocular dominance of alcohol-treated ferrets, indicating that most cortical neurons of alcohol-treated ferrets could still be driven by the deprived eye after 3 d of monocular deprivation. The histograms in Figure 3 (b-h) show a marked reduction of the ocular dominance shift in six of seven of these animals. This is in marked contrast with the effect of monocular deprivation observed in untreated and saline-treated animals.
Figure 3.

Reduced ocular dominance plasticity in animals exposed to alcohol from P10-P30. a, The histogram with error bars pools together results from alcohol-treated animals that received normal binocular vision. The primary visual cortex of these animals was characterized by a large number of binocular neurons with a predominance of the contralateral eye, as occurs in normal animals. b-h, After 3 d of monocular deprivation, the histograms for individual animals treated with alcohol show a reduced ocular dominance shift (b-g) with a single exception (f). In these animals, most neurons could still be driven by the deprived contralateral eye.
To quantify the effects of alcohol exposure on ocular dominance plasticity, we calculated a CBI for each animal (see Materials and Methods). A CBI of 0 indicates that the ipsilateral eye dominated all cells measured, whereas a CBI of 1 means that the contralateral eye dominated all cells. Figure 4 shows the distribution of CBI scores for the left hemisphere of individual animals. Control (open symbols) and alcohol-treated (filled symbols) animals that received normal visual experience (no MD) showed similar CBI values. Three days of visual deprivation (right eye) induced a reduction in the CBI values that was more pronounced for the control (saline plus untreated animals) than the alcohol-treated animals. The mean CBI of alcohol-treated animals that had been deprived was significantly higher than that of control deprived animals (p < 0.05; Mann-Whitney Wilcoxon test), indicating that plasticity was impaired in the alcohol-treated group.
Figure 4.

Contralateral bias index scores for individual alcohol-treated and control animals. All recordings are from left hemispheres. Animals that had been injected with alcohol and allowed normal binocular visual experience (no MD) show similar distribution of CBIs as normal animals. Most CBIs are > 0.5, reflecting a predominance of the contralateral eye that is normally found in ferrets. Three days of visual deprivation of the right eye induced a strong shift in ocular dominance, so that the CBIs of control ferrets display very low values, indicating marked predominance of response to stimulation of the ipsilateral nondeprived eye. The CBIs observed in alcohol-treated animals are significantly higher than in control animals (p < 0.05; Mann-Whitney Wilcoxon test), indicating reduced ocular dominance plasticity. Each symbol represents the CBI for an individual ferret.
In view of the reduced effect of monocular deprivation on the ocular dominance of treated animals, we asked whether increasing the duration of deprivation would affect the magnitude of the ocular shift. Animals were deprived for periods of 3, 5, or 10 d, and ocular dominance was assessed using extracellular recording of single-unit responses. Figure 5 shows that the median CBIs decreased as a function of the duration of monocular deprivation for both control and ethanol-treated animals. However, the decrease in the CBI values with duration of monocular deprivation was more pronounced in control than ethanol-treated animals (ANOVA; p < 0.05). Figure 5 also suggests that alcohol-treated animals required 10 d of deprivation to display a shift in ocular dominance, equivalent to that seen after only 3 d of deprivation in control animals. Together, these findings indicate that early alcohol exposure markedly impairs ocular dominance plasticity at a later age.
Figure 5.

Changes in the contralateral bias index with duration of monocular deprivation. Median CBIs are shown for groups of alcohol- and saline-treated animals subjected to 3, 5, or 10 d of monocular deprivation. CBIs show a steeper decline with duration of deprivation for control than that for alcohol-treated animals (p < 0.05; ANOVA). For this reason, 10 d of monocular deprivation were required to induce an ocular dominance shift in alcohol-treated animals similar to that seen after only 3 d of monocular deprivation in control animals.
Optical imaging
To further assess the effects of early alcohol treatment on ocular dominance plasticity, we conducted intrinsic signal-imaging experiments. Figure 6 shows ocular dominance (differential) maps on the left column and single condition maps for right and left eyes on the center and right columns, respectively. Dark areas in single condition maps are regions of strong responsiveness to visual stimulation. Dark areas in ocular dominance maps are regions that respond preferentially to stimulation of the right eye, whereas white areas respond preferentially to stimulation of the left eye. The ocular dominance map in the left hemispheres of a normal animal showed a rostral region of the visual cortex containing large modules (White et al., 1999) dominated by the left (ipsilateral) eye (large white areas) and a more caudal region where smaller modules are driven preferentially by the right or left eye (Fig. 6a). Monocular deprivation for 3 d induced a marked reduction in the area of visual cortex driven by the deprived right eye, as shown in the single-condition images from untreated (Fig. 6b) and saline-treated (Fig. 6c) animals. Also note that in these animals, the differential maps display more areas dominated by the ipsilateral eye (white areas) than in normal animals. In contrast, single-condition and differential maps in alcohol-treated animals (Fig. 6d) show a large area of visual cortex that retained responses to the deprived eye. Figure 6e shows the area of the visual cortex from which recordings were obtained.
Figure 6.
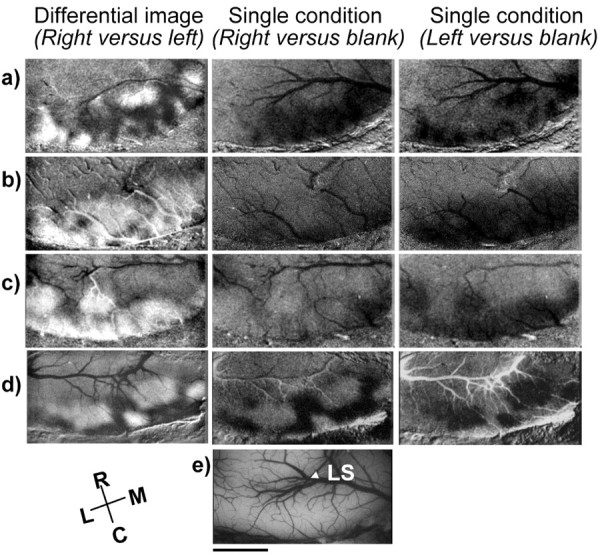
Effects of monocular deprivation on ocular dominance maps revealed by optical imaging of intrinsic signal. Differential maps are shown on the left column, in which dark areas respond best to gratings presented to the right eye and white areas respond best to stimulation of the left eye. Single-condition maps for right and left eye stimulation are shown on the center and right columns, respectively. Dark areas in the single-condition maps represent visual response. All images are from the left hemisphere, with medial represented to the right and rostral to the top of the figure. a shows responses observed in a normal animal, in which a few large ipsilateral domains are evident rostral to the small domains that characterize primary visual cortex. b, c, After 3 d of patterned visual deprivation of the right eye in untreated (b) and saline-treated (c) animals, white predominates in the differential maps, reflecting a dominance of the left (nondeprived) eye. Single-condition maps show marked reduction in response to stimulation of the right eye. In contrast, after 3 d of monocular deprivation in alcohol-treated animals (d), dark regions that respond predominantly to the right (deprived) eye persisted in visual cortex. The single-condition map shows regions of visual cortex with robust response to stimulation of this eye. The craniotomies exposed an area of visual cortex (e) where the representation of the central visual field is known to be located. Scale bar, 3 mm. LS, Lateral sulcus.
Ocular dominance was quantified from the ocular dominance maps located in the caudal region of the visual cortex corresponding to V1 (White et al., 1999). Pixels representing ocular dominance in this region were plotted as a function of the position along a grayscale, as shown in Figure 7. Each point in the plot represents the median number of pixels (percentage) computed from all animals included in each group (Table 1). Darker pixel classes represent responses dominated by the right (contralateral) eye, whereas lighter pixel classes represent responses dominated by the left eye. The ocular dominance curves in untreated and saline-treated animals were shifted to the right after 3 d of deprivation (Fig. 7a), indicating a reduction in the total area of the visual cortex driven preferentially by the deprived eye. Ethanol treatment markedly reduced this shift (Fig. 7b), indicating preservation of the visual cortex area driven by the deprived eye. To quantify the differences in magnitude of these shifts, we computed the proportion of the area under the curves for control and alcohol-treated animals that overlaps the area under the curve for normal animals. A significantly larger overlap was found in the distributions for normal and ethanol-treated animals that had been deprived (Fig. 7e) (dashed area = 73%) than for normal and saline-treated animals (Fig. 7c) (dashed area = 45%) that had been similarly deprived (χ2; p < 0.001). In conclusion, the results obtained with optical imaging also confirm that early alcohol exposure impairs ocular dominance plasticity.
Figure 7.
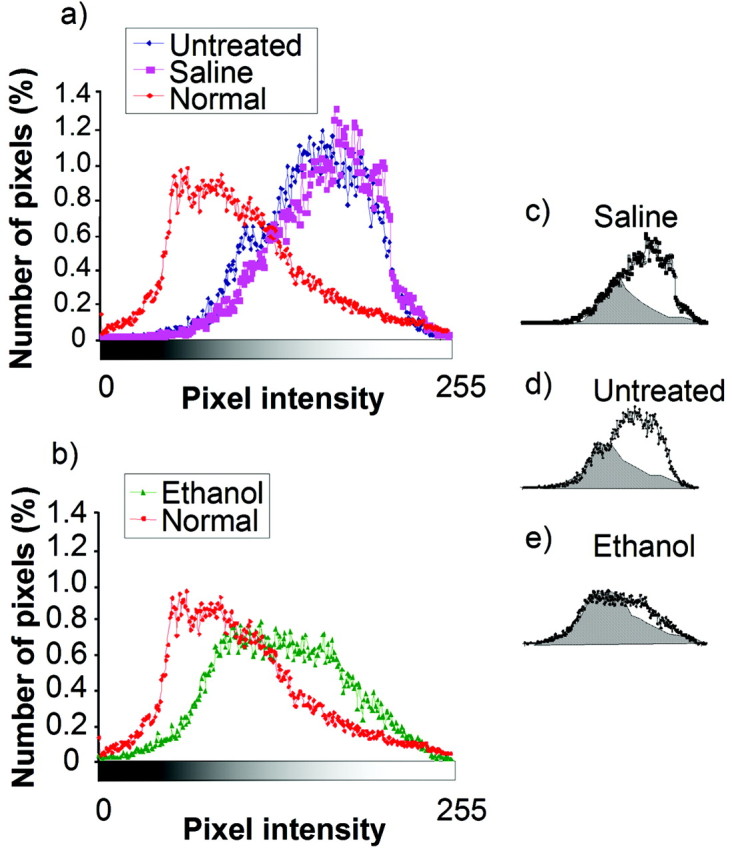
Ocular dominance profiles computed from the maps of intrinsic signal. Ocular dominance profiles were obtained by quantifying the distribution of pixels along a grayscale. Darker pixels represent response dominated by the right (contralateral) eye, whereas light pixels represent responses dominated by stimulation of the left eye. The number of pixels (percentage) is plotted as a function of position along this grayscale. After 3 d of monocular deprivation, a marked shift from normal (n = 3 ferrets) is present in the distribution of pixels from saline-treated (n = 3) and untreated (n = 3) (a) animals. A much smaller shift was present in alcohol-treated animals (n = 4) (b). To compare the differences in magnitude of these shifts, we computed the proportion of the areas under the curves for the deprived control and alcohol-treated animals that overlaps with the area under the distribution for normal animals. The overlap (dashed areas) was 45% in saline-treated animals (c), 41% in untreated animals (d), and 73% in ethanol-treated animals (e). Differences between ethanol-treated animals and the other two groups are statistically significant (χ2; p < 0.001 in both cases).
Visual responsiveness
These striking effects of alcohol exposure on ocular dominance plasticity raise the question of whether visually driven activity is depressed in animals exposed to alcohol. This is an important issue because a pronounced reduction in cortical neuron visual responses may be sufficient to disrupt activity-dependent sensory plasticity. Qualitative assessment of single-unit responses in alcohol-treated ferrets revealed robust visual responses that could not be subjectively distinguished from normal. Analysis of the responses in nondeprived alcohol-treated and normal animals revealed similar mean maximal response (in spikes per second) of cortical neurons to stimulation at the optimal orientation (Fig. 8a) (p = 0.49; t test). Additionally, alcohol treatment did not change spontaneous activity (Fig. 8b) (p = 0.86). In conclusion, the data show that most cortical neurons in ferrets exposed to alcohol on alternate days during a relatively short period of development preserve robust responses to visual stimulation.
Figure 8.
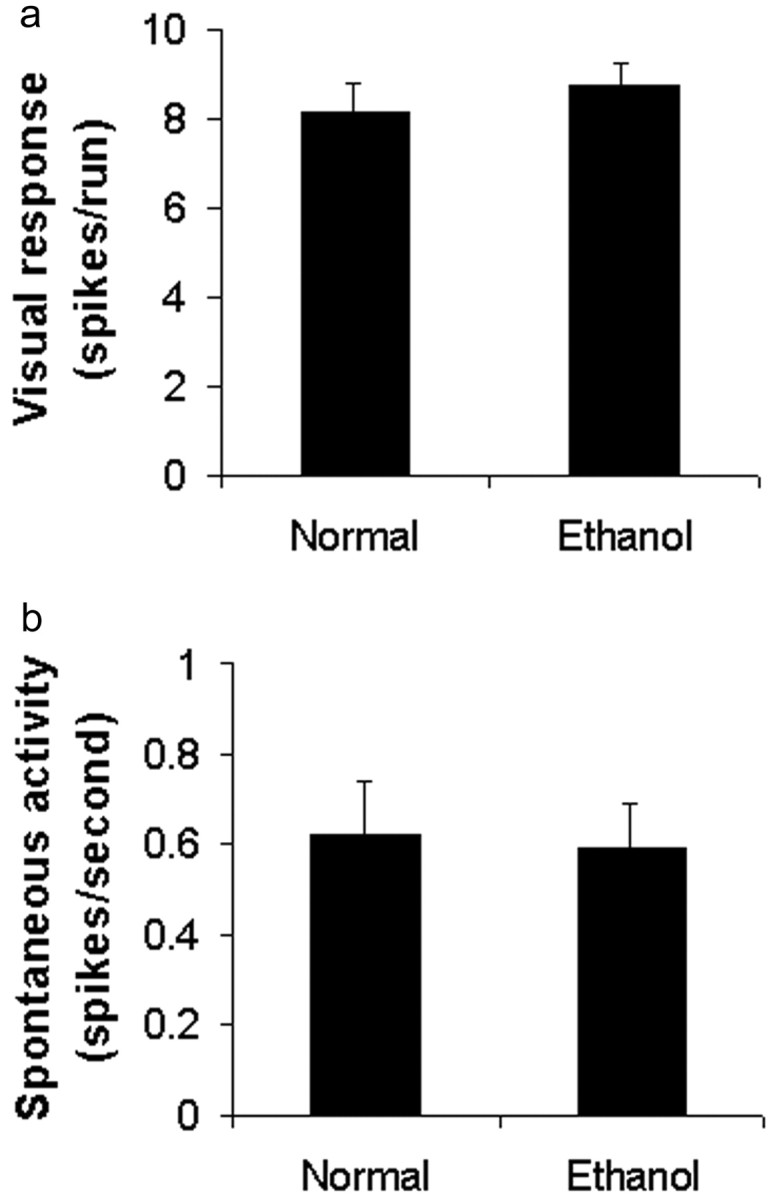
Visual responses of striate cortical cells to a moving bar of light. Alcohol exposure on alternate days from P10-P30 preserved robust responses to visual stimulation. a shows mean maximal response (in spikes per sec) of cortical neurons to stimulation at the optimal orientation. Similar values (p = 0.49; t test) were obtained for nondeprived ethanol-treated (n = 103 cells from 3 animals) and normal animals (69 cells from 3 animals). Additionally, alcohol treatment did not change spontaneous activity (b) (p = 0.86). Bars indicate SEM.
Critical timing and duration of treatment
Next, we wanted to determine whether the effects of alcohol exposure are specific to an early developmental stage. Effects of alcohol exposure were compared in two groups of animals treated for 3 weeks starting at different ages, P10 and P20. The histograms from individual animals in Figure 9 show a pronounced ocular dominance shift after a 3 d of deprivation in animals that had been treated starting at P20. In these animals, monocular deprivation induced a reduction in the CBIs (Fig. 9d), reflecting a loss of responses to the contralateral deprived eye that was similar to that seen in control animals. This is strikingly different from the effects described before for animals treated starting at P10.
Figure 9.
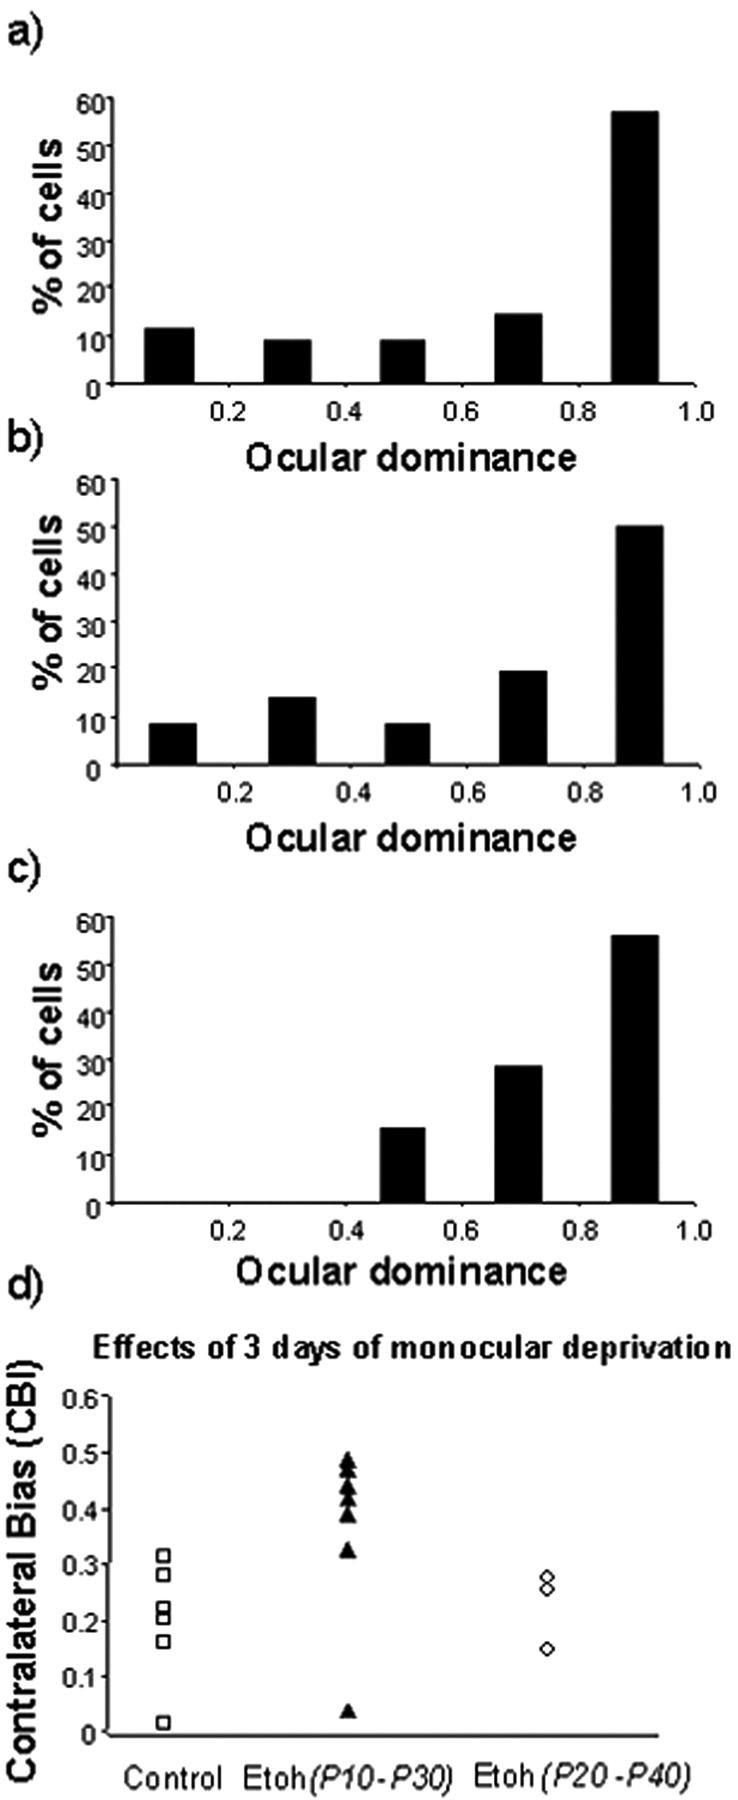
Normal ocular dominance plasticity in animals exposed to alcohol from P20-P40. a-c, The histograms for individual animals treated with alcohol show a pronounced ocular dominance shift after 3 d of monocular deprivation. d, The CBIs of treated animals and control animals have similarly low values, indicating loss of response to the deprived eye.
We also tested the effect of treatment duration. Figure 10 shows the results obtained when we began exposure to ethanol at P10 but terminated it early at P25. A pronounced ocular dominance shift was present in animals exposed to alcohol from P10-P25, and the reduction in their CBIs was similar to that seen in control animals (Fig. 10d). Collectively, these findings indicate that disruption of ocular dominance plasticity depends on the timing and duration of alcohol exposure.
Figure 10.
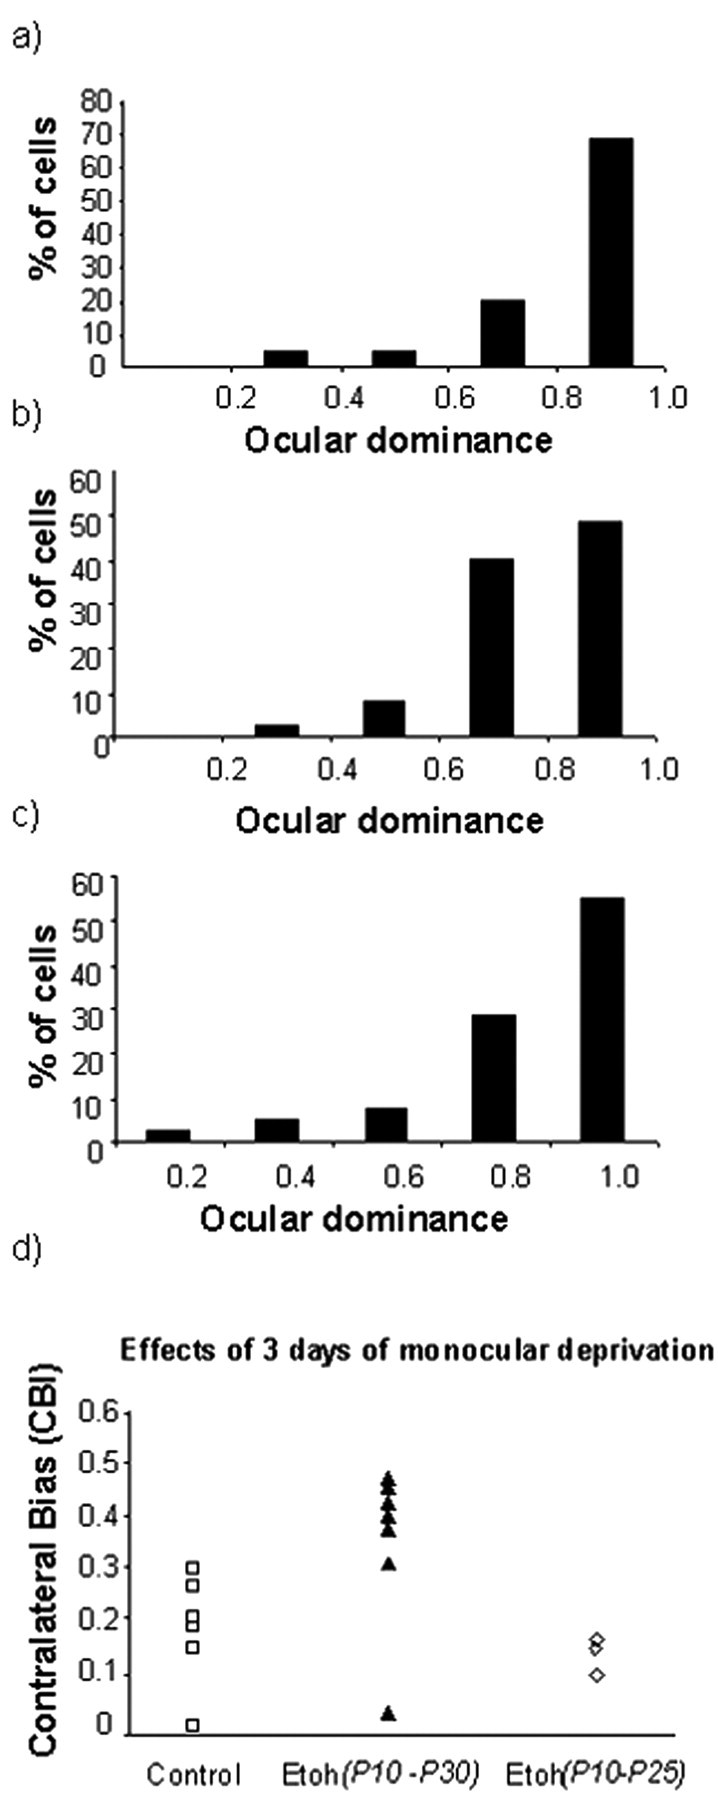
Normal ocular dominance plasticity in animals exposed to alcohol from P10-P25. a-c, The histograms for individual animals show that treatment with alcohol during this period did not prevent a pronounced ocular dominance shift after 3 d of monocular deprivation. d, The CBIs of animals treated from P10-P25 and untreated animals are similar, indicating loss of response to the deprived eye in both groups.
Discussion
A previous study had shown that continuous alcohol ingestion throughout gestation induced a reduction in rodent barrel cortex plasticity that was associated with a suppression of >80% in the level of neuronal responses and spontaneous activity (Rema and Ebner, 1999). These findings suggested that the effects of alcohol on activity-dependent sensory plasticity result from a simple depression of sensory responses. However, the present study demonstrates that exposure of ferrets to alcohol on alternate days from P10-P30, a period of development approximately equivalent to the third trimester of human gestation, impairs ocular dominance plasticity while preserving robust visual responses. The dissociation between effects on neural plasticity and sensory responsiveness indicates that early alcohol exposure disrupts a specific mechanism of neocortex plasticity. The more specific effects on neural plasticity reported here rather than in previous studies may be related to a shorter duration of alcohol exposure and the discontinuous levels of blood alcohol obtained with alternate day injections.
Assessment of cortical plasticity and visual responses was conducted after a prolonged alcohol-free period, indicating that chronic alcohol exposure during early development of the neocortex produces a long-lasting disruption of the ability of cortical neurons to reorganize their connections. The present study also demonstrates that impairment of this type of plasticity does not occur when alcohol exposure is delayed by 10 d or restricted to P10-P25. These findings indicate that both duration and timing of treatment are crucial for the delayed effects of ethanol exposure on neocortex plasticity.
The primary visual cortex was used as a model in these studies because it has been the most studied area of the neocortex, and the monocular deprivation model of neural plasticity has been very well characterized. However, studies on this system should assess the effects of early alcohol exposure on neocortical plasticity in general, and our results will probably not be restricted to the visual cortex. Moreover, one potential implication of the findings reported here is that ethanol exposure might have long-lasting effects when plasticity is very active, such as during adolescence. Use of this monocular deprivation model of neural plasticity may ultimately contribute to our understanding of learning deficits in children with FAS.
Advantages of the ferret model of early alcohol exposure
The ferret may be particularly useful in studies of the effects of alcohol on cortical development and plasticity because its third trimester equivalent of gestation occurs during the first postnatal month of life. This postnatal development and the relatively large size of the ferret kit permit molecular manipulations and alcohol exposure targeted to a particular area of the neocortex during a restricted period of time. Blood alcohol levels can also be readily monitored. In contrast, the third trimester equivalent of human gestation in cats and most primates occurs prenatally, making complex intrauterine surgeries a requirement for some experimental manipulations. Another reason ferrets were used for this study is that they have a highly developed visual cortex characterized by ocular dominance columns and orientation columns (Weliky et al., 1996; White et al., 1999; Ruthazer et al., 1999), which are lacking in rodents but present in humans (Goodyear et al., 2002). The ferret model is also advantageous over rodent models because the frontally placed eyes of the ferret allows for a large binocular representation in the primary visual cortex (Law et al., 1988).
Early alcohol exposure may disrupt mechanisms of visual cortical plasticity at a later age
An explanation of the findings presented in this report is that early alcohol exposure produces a long-term disruption in the expression and activation of factors that are involved in visual plasticity. To understand how alcohol might affect ocular dominance plasticity, it is necessary to first consider what mechanisms regulate this type of neural plasticity. Although a very large number of genes that may be involved in visual cortical plasticity (Prassad et al., 2002) remain to be characterized, information has been obtained on some of the factors that may be required for ocular dominance plasticity. These include NMDA receptors (Bear et al., 1990; Roberts et al., 1998), GABA receptors (Hensch et al., 1998), and neurotrophins (Maffei et al., 1992). Activation of the NMDA receptor appears to be especially important because blocking NMDA receptors with pharmacological agents (Bear et al., 1990; Rauschecker et al., 1990; Galuske et al., 2000) or reducing NMDA receptor function using antisense DNA (Roberts et al., 1998) prevents the loss of responses to the deprived eye after monocular deprivation. Increased calcium influx through the NMDA receptor-associated channel and other membrane calcium channels probably contributes to long-term synaptic changes during monocular deprivation by activating protein kinases, including α calcium-calmodulin kinase type II (Taha et al., 2002), protein kinase A (Beaver et al., 2001), and extracellular signal-regulated kinase (Di Cristo et al., 2001). A common mechanism through which these kinases might act in ocular dominance plasticity is phosphorylation of the cAMP response element-binding protein (CREB) (Pham et al., 1999; Mower et al., 2002), which binds to a consensus sequence known as cAMP response element (Montminy et al., 1990). The role of CREB in ocular dominance plasticity may be to regulate the transcription of plasticity-related genes (Gonzalez et al., 1989; Deisseroth et al., 1996; Finkbeiner et al., 1997) required for loss of connections relaying information from the deprived eye. However, the mechanisms of ocular dominance plasticity are likely to require complex changes occurring both upstream and downstream from each of these factors.
The NMDA receptor and the CREB system of gene activation are especially interesting in the context of FAS research because they are also thought to be important for several experimental models of learning and long-term memory (Silva et al., 1998). Evidence that this system of gene activation may be impaired in FAS has been provided by studies showing that NMDA receptor levels remain reduced for several weeks after fetal alcohol exposure (Savage et al., 1992; Valles et al., 1995; Rema and Ebner, 1999), and that phosphorylation and activity of CREB is also severely attenuated after chronic alcohol exposure (Pandey et al., 2001). Another important issue concerning the NMDA receptor is whether its subunit composition, which is developmentally regulated, might be affected by chronic alcohol exposure. Onset of the critical period of ocular dominance plasticity in the ferret has been shown to be correlated with enhanced expression of the NR2A subunit of the NMDA receptor (Roberts and Ramoa, 1999). This finding raises the possibility that for the critical period of ocular dominance plasticity to occur, subunit combinations with predominance of the NR2B subunit must be replaced by those also containing predominance of the NR2A subunit. Significantly, ethanol exposure has been reported to delay the developmental switch of NR2 subunits in vitro (Snell et al., 2001) and in vivo (Nixon et al., 2002). It should be interesting to examine whether an alcohol-induced modification of the subunit composition of cortical NMDA receptors contributes to the impairment in ocular dominance plasticity reported here. According to this idea, ethanol exposure may delay the period of peak plasticity, a possibility we are currently investigating.
An optimal balance between excitation and inhibition is also probably very important for visual plasticity. Consistent with this idea, genetically modified mice with a reduction in GABA function have impaired ocular dominance plasticity that can be rescued by pharmacologically potentiating the GABA responses (Hensch et al., 1998). Significantly, chronic ethanol administration has been shown to result in a reduction in amplitude of inhibitory potentials several days after the treatment (Durand and Carlen, 1984; Hsiao et al., 1999). These findings raise the intriguing possibility that impaired ocular dominance plasticity may result from inappropriate maturation of intracortical inhibition.
Alcohol in early development of the neocortex
The findings presented here raise the question of why the timing of alcohol exposure is so important. Ferrets were exposed to alcohol during a period of development when major changes occur in the anatomical and functional properties of cortical neurons. Although neurogenesis of layer IV and infragranular neurons is prenatal, layer II-III neurons continue to be generated until P14 and continue to migrate to their final destination until P21 (Jackson et al., 1989). Moreover, lateral geniculate neurons start forming synapses with layer IV neurons during the second week of postnatal life (Herrmann et al., 1994). Ocular dominance columns can be seen as early as 1 week after innervation of this layer (Crowley and Katz, 2000), and orientation selectivity of cortical neurons starts developing well before eye opening (Chapman and Stryker, 1993; Ramoa et al., 2001). When anatomical relationships between thalamus and cortex are still being established, neurons located at subcortical sites already manifest spontaneous action potential activity (Maffei and Galli-Resta, 1990; Meister et al., 1991; McCormick et al., 1995), and visual stimulation through the closed eye lids can activate cortical neurons (Krug et al., 2001). For these reasons, intrinsic and evoked activities have been proposed to help guide the development of cortical connections (Katz and Shatz, 1996). Recently, however, molecular cues have been proposed to play a dominant role, at least in the formation of ocular dominance columns (Crowley and Katz, 2000).
The timing of these important developmental events may help explain why alcohol exposure during this period has long-term effects on the neocortex. Alcohol may disrupt activity-dependent mechanisms of development by inhibiting NMDA receptor function (Lovinger et al., 1989; Mirshahi and Woodward, 1995) and affecting diverse neurotransmitter receptors and membrane electrophysiological properties (Costa et al., 2000) that contribute to intrinsic and evoked activity. Because chronic alcohol exposure has effects on gene expression (Rahman and Miles, 2001), it could also affect expression of molecular cues that contribute to visual system development. Finally, alcohol exposure at these early ages may interfere with cortical development by inducing neurodegeneration (Ikonomidou et al., 2000).
Future studies of the ferret model described here should examine what mechanisms underlying neural plasticity are affected by early alcohol exposure. It will be especially interesting to determine whether early alcohol exposure affects the development of NMDA receptors and intracortical inhibition in the primary visual cortex of the ferret and to see whether CREB activation resulting from monocular deprivation is disrupted. Because learning and memory formation are thought to require neural plasticity, answering these questions may contribute to our understanding of learning disabilities in FAS.
Footnotes
This work was supported by National Institutes of Health-National Institute on Alcohol Abuse and Alcoholism Grant AA-13023 to A.S.R. We thank Leonard White for helping set up the optical imaging system, for guidance on some aspects of data analysis, and for discussions.
Correspondence should be addressed to Ary S. Ramoa, Department of Anatomy and Neurobiology, P.O. Box 0709, Virginia Commonwealth University, 1101 East Marshall Street, Room 12-042, Richmond, VA 23298-0709. E-mail: aramoa@hsc.vcu.edu.
Copyright © 2003 Society for Neuroscience 0270-6474/03/2310002-11$15.00/0
References
- Bear MF, Kleinschmidt A, Gu QA, Singer W ( 1990) Disruption of experience-dependent synaptic modifications in striate cortex by infusion of an NMDA receptor antagonist. J Neurosci 10: 909-925. [DOI] [PMC free article] [PubMed] [Google Scholar]
- Beaver CJ, Ji Q, Fischer QS, Daw NW ( 2001) Cyclic AMP-dependent protein kinase mediates ocular dominance shifts in cat visual cortex. Nat Neurosci 4: 159-163. [DOI] [PubMed] [Google Scholar]
- Chapman B, Stryker MP ( 1993) Development of orientation selectivity in ferret visual cortex and effects of deprivation. J Neurosci 13: 5251-5262. [DOI] [PMC free article] [PubMed] [Google Scholar]
- Church MW, Eldis F, Blakley BW, Bawle EV ( 1997) Hearing, language, speech, vestibular and dentofacial disorders in the fetal alcohol syndrome (FAS). Alcohol Clin Exp Res 21: 227-237. [PubMed] [Google Scholar]
- Costa ET, Savage DD, Valenzuela CF ( 2000) A review of the effects of prenatal or early postnatal ethanol exposure on brain ligand-gated ion channels. Alcohol Clin Exp Res 24: 706-715. [PubMed] [Google Scholar]
- Crowley JC, Katz LC ( 2000) Early development of ocular dominance columns. Science 290: 1321-1324. [DOI] [PubMed] [Google Scholar]
- Daw NW ( 1995) Physiological and anatomical changes that result from optical and motor deficits. In: Visual development, p 115. New York: Oxford UP.
- Deisseroth K, Bito H, Tsien RW ( 1996) Signaling from synapse to nucleus: postsynaptic CREB phosphorylation during multiple forms of hippocampal synaptic plasticity. Neuron 16: 89-101. [DOI] [PubMed] [Google Scholar]
- Di Cristo G, Berardi N, Cancedda L, Pizzorusso T, Putignano E, Ratto GM, Maffei L ( 2001) Requirement of ERK activation for visual cortical plasticity. Science 292: 2337-2340. [DOI] [PubMed] [Google Scholar]
- Durand D, Carlen PL ( 1984) Decreased neuronal inhibition in vitro after long-term administration of ethanol. Science 224: 1359-1361. [DOI] [PubMed] [Google Scholar]
- Ferrer I, Galofre E ( 1987) Dendritic spine anomalies in fetal alcohol syndrome. Neuropediatrics 18: 161-163. [DOI] [PubMed] [Google Scholar]
- Finkbeiner S, Tavazoie SF, Maloratsky A, Jacobs KM, Harris KM, Greenberg ME ( 1997) CREB: a major mediator of neuronal neurotrophin responses. Neuron 19: 1031-1047. [DOI] [PubMed] [Google Scholar]
- Galuske RA, Kim DS, Castren E, Singer W ( 2000) Differential effects of neurotrophins on ocular dominance plasticity in developing and adult cat visual cortex. Eur J Neurosci 12: 3315-33130. [DOI] [PubMed] [Google Scholar]
- Garber JM ( 1982) Steep corneal curvature in the fetal alcohol syndrome: a fetal alcohol syndrome landmark. J Am Optom Assoc 8: 641-644. [PubMed] [Google Scholar]
- Gonzalez GA, Yamamoto KK, Fischer WH, Karr D, Menzel P, Biggs W, Vale WW, Montminy MR ( 1989) A cluster of phosphorylation sites on the cyclic AMP-regulated nuclear factor CREB predicted by its sequence. Nature 337: 749-752. [DOI] [PubMed] [Google Scholar]
- Goodyear BG, Nicolle DA, Menon RS ( 2002) High resolution fMRI of ocular dominance columns within the visual cortex of human amblyopes. Strabismus 10: 129-136. [DOI] [PubMed] [Google Scholar]
- Guerri C ( 1998) Neuroanatomical and neurophysiological mechanisms involved in central nervous system dysfunctions induced by prenatal alcohol exposure. Alcohol Clin Exp Res 22: 304-312. [DOI] [PubMed] [Google Scholar]
- Hensch TK, Fagiolini M, Mataga N, Stryker MP, Baekkeskov S, Kash SF ( 1998) Local GABA circuit control of experience-dependent plasticity in developing visual cortex. Science 282: 1504-1508. [DOI] [PMC free article] [PubMed] [Google Scholar]
- Herrmann K, Antonini A, Shatz CJ ( 1994) Ultrastructural evidence for synaptic interactions between thalamocortical axons and subplate neurons. Eur J Neurosci 6: 1729-1742. [DOI] [PubMed] [Google Scholar]
- Hsiao SH, West JR, Mahoney JC, Frye GD ( 1999) Postnatal ethanol exposure blunts upregulation of GABAA receptor currents in Purkinje neurons. Brain Res 832: 124-135. [DOI] [PubMed] [Google Scholar]
- Ikonomidou C, Bittigau P, Ishimaru MJ, Wozniak DF, Koch C, Genz K, Price MT, Stefovska V, Horster F, Tenkova T, Dikranian K, Olney JW ( 2000) Ethanol-induced apoptotic neurodegeneration and fetal alcohol syndrome. Science 287: 1056-1060. [DOI] [PubMed] [Google Scholar]
- Issa NP, Trachtenberg JT, Chapman B, Zahs KR, Stryker MP ( 1999) The critical period for ocular dominance plasticity in the ferret's visual cortex. J Neurosci 19: 6965-6978. [DOI] [PMC free article] [PubMed] [Google Scholar]
- Jackson CA, Peduzzi JD, Hickey TL ( 1989) Visual cortex development in the ferret. I. Genesis and migration of visual cortical neurons. J Neurosci 9: 1242-1253. [DOI] [PMC free article] [PubMed] [Google Scholar]
- Jones KL, Smith DW ( 1973) Recognition of the fetal alcohol syndrome in early infancy. Lancet 2: 999-1001. [DOI] [PubMed] [Google Scholar]
- Kaneko WM, Riley EP ( 2003) Electrophysiological and behavioral findings in rats prenatally exposed to alcohol. Alcohol 10: 169-178. [DOI] [PubMed] [Google Scholar]
- Katz LC, Shatz CJ ( 1996) Synaptic activity and the construction of cortical circuits. Science 274: 1133-1138. [DOI] [PubMed] [Google Scholar]
- Krug K, Akerman CJ, Thompson ID ( 2001) Responses of neurons in neonatal cortex and thalamus to patterned visual stimulation through the naturally closed lids. J Neurophysiol 85: 1436-1443. [DOI] [PubMed] [Google Scholar]
- Law MI, Zahs KR, Stryker MP ( 1988) Organization of primary visual cortex (area 17) in the ferret. J Comp Neurol 278: 157-180. [DOI] [PubMed] [Google Scholar]
- Lovinger DM, White G, Weight FF ( 1989) Ethanol inhibits NMDA-activated ion current in hippocampal neurons. Science 243: 1721-1724. [DOI] [PubMed] [Google Scholar]
- Maffei L, Galli-Resta L ( 1990) Correlation in the discharges of neighboring rat retinal ganglion cells during prenatal life. Proc Natl Acad Sci USA 87: 2861-2864. [DOI] [PMC free article] [PubMed] [Google Scholar]
- Maffei L, Berardi N, Domenici L, Parisi V, Pizzorusso T ( 1992) Nerve growth factor (NGF) prevents the shift in ocular dominance plasticity in ocular dominance distribuiton of visual cortical neurons in monocularly deprived rats. J Neurosci 12: 4651-4662. [DOI] [PMC free article] [PubMed] [Google Scholar]
- Majewski F ( 1993) Alcohol embryopathy: experience in 200 patients. Dev Brain Dysfunct 6: 248-265. [Google Scholar]
- Mattson SN, Riley E ( 1996) Brain anomalies in fetal alcohol syndrome. In: Fetal alcohol syndrome: from mechanisms to prevention (Abel EL, ed), pp 51-68. Boca Raton, FL: CRC.
- McCormick DA, Trent F, Ramoa AS ( 1995) Postnatal development of synchronized network oscillations in the ferret dorsal lateral geniculate and perigeniculate nuclei. J Neurosci 15: 5739-5752. [DOI] [PMC free article] [PubMed] [Google Scholar]
- Meister M, Wong RO, Baylor DA, Shatz CJ ( 1991) Synchronous bursts of action potentials in ganglion cells of the developing mammalian retina. Science 252: 939-943. [DOI] [PubMed] [Google Scholar]
- Miller M, Israel J, Cuttone J ( 1981) Fetal alcohol syndrome. J Pediatr Ophthalmol Strabismus 18: 6-15. [DOI] [PubMed] [Google Scholar]
- Mirshahi T, Woodward JJ ( 1995) Ethanol sensitivity of heteromeric NMDA receptors: effects of subunit assembly, glycine and NMDAR1 Mg(2+)-insensitive mutants. Neuropharmacology 34: 347-355. [DOI] [PubMed] [Google Scholar]
- Montminy MR, Gonzalez EA, Yamamoto KK ( 1990) Regulation of cAMP-inducible genes by CREB. Trends Neurosci 13: 184-188. [DOI] [PubMed] [Google Scholar]
- Mower AF, Liao DS, Nestler EJ, Neve RL, Ramoa AS ( 2002) cAMP/Ca2+ response element-binding protein function is essential for ocular dominance plasticity. J Neurosci 22: 2237-2245. [DOI] [PMC free article] [PubMed] [Google Scholar]
- Nixon K, Hughes PD, Amsel A, Leslie SW ( 2002) NMDA receptor subunit expression following early postnatal exposure to ethanol. Brain Res Dev Brain Res 139: 295-299. [DOI] [PubMed] [Google Scholar]
- Pandey SC, Roy A, Mittal N ( 2001) Effects of chronic ethanol intake and its withdrawal on the expression and phosphorylation of the CREB gene transcription factor in rat cortex. J Pharmacol Exp Ther 296: 857-868. [PubMed] [Google Scholar]
- Pham TA, Impey S, Storm DR, Stryker MP ( 1999) CRE-mediated gene transcription in neocortical neuronal plasticity during the developmental critical period. Neuron 22: 63-72. [DOI] [PubMed] [Google Scholar]
- Phillips DE ( 1991) Short- and long-term effects of combined pre- and postnatal ethanol exposure (three trimester equivalency) on the development of myelin axons in rat optic nerve. Int J Dev Neurosci 9: 631-647. [DOI] [PubMed] [Google Scholar]
- Prassad SS, Kojic LZ, Li P, Mitchell DE, Hachisuka A, Sawada J, Gu Q, Cynader MS ( 2002) Gene expression patterns during enhanced periods of visual cortex plasticity. Neuroscience 111: 35-45. [DOI] [PubMed] [Google Scholar]
- Rahman S, Miles MF ( 2001) Identification of novel ethanol-sensitive genes by expression profiling. Pharmacol Ther 92: 123-134. [DOI] [PubMed] [Google Scholar]
- Ramoa AS, Mower AF, Liao DS, Jafri SI ( 2001) Suppression of cortical NMDA receptor function prevents development of orientation selectivity in the primary visual cortex. J Neurosci 21: 4299-4309. [DOI] [PMC free article] [PubMed] [Google Scholar]
- Rauschecker JP, Egert U, Kossel A ( 1990) Effects of NMDA antagonists on developmental plasticity in kitten visual cortex. Int J Dev Neurosci 8: 425-435. [DOI] [PubMed] [Google Scholar]
- Rema V, Ebner FF ( 1999) Effect of enriched environment rearing on impairments in cortical excitability and plasticity after prenatal alcohol exposure. J Neurosci 19: 10993-11006. [DOI] [PMC free article] [PubMed] [Google Scholar]
- Roberts EB, Ramoa AS ( 1999) Enhanced NR2A subunit expression and decreased NMDA receptor decay time at the onset of visual cortical plasticity in the ferret. J Neurophysiol 81: 2587-2591. [DOI] [PubMed] [Google Scholar]
- Roberts EB, Meredith AM, Ramoa AS ( 1998) Suppression of NMDA receptor function using antisense DNA blocks ocular dominance plasticity while preserving visual responses. J Neurophysiol 80: 1021-1032. [DOI] [PubMed] [Google Scholar]
- Robinson GC, Conry RF ( 1986) Maternal age and congenital optic nerve hypoplasia: a posiible clue to etiology. Dev Med Child Neurol 28: 294-298. [DOI] [PubMed] [Google Scholar]
- Ruthazer ES, Baker GE, Stryker MP ( 1999) Development and organization of ocular dominance bands in primary visual cortex of the sable ferret. J Comp Neurol 407: 151-165. [PMC free article] [PubMed] [Google Scholar]
- Savage DD, Queen SA, Sanchez CF, Paxton LL, Mahoney JC, Goodlett CR, West JR ( 1992) Prenatal ethanol exposure during the last third of gestation in rat reduces hippocampal NMDA agonist binding site density in 45-day-old offspring. Alcohol 9: 37-41. [DOI] [PubMed] [Google Scholar]
- Silva AJ, Kogan JH, Frankland PW, Kida S ( 1998) CREB and memory. Annu Rev Neurosci 21: 127-148. [DOI] [PubMed] [Google Scholar]
- Snell LD, Bhave SV, Tabakoff B, Hoffman PL ( 2001) Chronic ethanol exposure delays the “developmental switch” of the NMDA receptor 2A and 2B subunits in cultured cerebellar granule neurons. J Neurochem 78: 396-405. [DOI] [PubMed] [Google Scholar]
- Stromland K ( 1985) Ocular abnormalities in the fetal alcohol syndrome. Acta Ophtalmologica 171: 1-50. [PubMed] [Google Scholar]
- Taha S, Hanover JL, Silva AJ, Stryker MP ( 2002) Autophosphorylation of αCaMKII is required for ocular dominance plasticity. Neuron 36: 483-491. [DOI] [PubMed] [Google Scholar]
- Valles S, Felipo V, Montoliu C, Guerri C ( 1995) Alcohol exposure during brain development reduces 3H-MK-801 binding and enhances metabotropic-glutamate receptor-stimulated phosphoinositide hydrolysis in rat hippocampus. Life Sci 56: 1373-1383. [DOI] [PubMed] [Google Scholar]
- Weliky M, Bosking WH, Fitzpatrick D ( 1996) A systematic map of direction preference in primary visual cortex. Nature 379: 725-728. [DOI] [PubMed] [Google Scholar]
- West JR, Kelly SJ, Pierce DR ( 1987) Severity of alcohol-induced deficits in rats during the third trimester equivalent is determined by the pattern of exposure. Alcohol Alcohol 1: 461-465. [PubMed] [Google Scholar]
- White LE, Bosking WH, Williams SM, Fitzpatrick D ( 1999) Maps of central visual space in ferret V1 and V2 lack matching inputs from the two eyes. J Neurosci 19: 7089-7099. [DOI] [PMC free article] [PubMed] [Google Scholar]