

Abstract
Heterogeneity of synaptic inputs onto neocortical layer 5 pyramidal neurons could result from differences in the underlying receptors, yet previous work has shown that functional attributes of AMPA receptors are uniform among synaptic connections onto these neurons. To determine whether NMDA receptors (NMDARs) would be similarly uniform, we compared in the same pyramidal neurons pharmacologically isolated NMDAR-mediated EPSCs evoked by stimulation of two anatomically distinguishable pathways, callosal or intracortical. Based on differences in voltage dependence, decay kinetics, apparent Mg2+sensitivity, and subunit-specific (NR2A, NR2B, and NR2C/D) pharmacology, we found NMDARs at these inputs to be distinct. Furthermore, NMDARs activated by the intracortical pathway were more efficient at integrating EPSPs and bringing the neuron closer to the spike-firing threshold than the callosal pathway. These results suggest that pyramidal neurons encode information differentially depending on the origin of their neocortical inputs and that NMDAR-dependent synaptic plasticity may be pathway specific.
Keywords: NMDA receptors, pyramidal neurons, neocortex, subunit composition, pathway specificity, synaptic integration
Introduction
Layer 5 pyramidal neurons receive a diverse set of thalamocortical, subcortical, and corticocortical excitatory synaptic inputs and are the primary means by which the neocortex communicates with the rest of the brain (Connors and Amitai, 1995). However, it is not known whether information carried by these inputs is processed differentially by these neurons or whether they can differentiate between these pathways (Johnson et al., 1996). One form of differentiation is manifest naturally in their ability to distinguish excitatory from inhibitory inputs via unique neurotransmitter receptor systems. But is a finer discrimination of inputs possible, and if so, how? To explore these issues, we examined differences in biophysical and functional properties of two classes of corticocortical excitatory synaptic inputs onto layer 5 pyramidal neurons in the agranular frontal cortex. These included the long-range projections of the corpus callosum, the principal commissural pathway in the forebrain linking the two cerebral hemispheres, the cells of origin of which are almost entirely pyramidal neurons located in the homotopic contralateral cortex (Pandya and Seltzer, 1986) (for review, see Conti and Manzoni, 1994) and short-range intracortical excitatory afferents that arise locally (Burkhalter and Charles, 1990). Although pathway-specific differences can manifest via postsynaptic and/or presynaptic elements (Gil et al., 1999), we restricted the focus of this paper to postsynaptic receptors exclusively.
Of the two major types of excitatory receptors, AMPA and NMDA, the former are ubiquitous and expressed at most synapses. Recently, we showed that properties of AMPA receptor (AMPAR)-mediated EPSCs evoked by stimulation of callosal and intracortical pathways were similar and that, although synaptic AMPARs could differ physiologically from those expressed extrasynaptically at cell somas, their functional properties appear to be uniform among various synaptic inputs onto these neurons (Kumar and Huguenard, 2001; Kumar et al., 2002). Homogeneity of AMPAR-dependent responses applies not only to neocortical pyramidal cells but has also been reported in hippocampal CA1 pyramidal neurons (Andrasfalvy and Magee, 2001). Whether coexisting NMDA receptors (NMDARs) at these inputs show functional differences is not known, although preliminary studies revealed subtle yet consistent differences in kinetics and voltage dependence of intracortical compared with callosal responses that could potentially arise from unique receptor subunit compositions (Kumar and Huguenard, 2001). However, information regarding the subunit makeup of NMDARs at these synapses is unavailable, and, therefore, it is not known whether neocortical pyramidal neurons show any NMDAR-dependent pathway specificity.
NMDARs are heteromeric structures comprising four to five subunits from three gene families, NR1-NR3. All NMDARs contain multiple NR1 subunits in combination with at least one type of NR2 (NR2A-NR2D). The NR3 subunit does not form functional receptors alone but can coassemble with NR1/NR2 complexes. Many of the unique properties of NMDARs investigated have invariably been attributed to the diversity of the individual subunits and their combinations (for review, see Cull-Candy et al., 2001). Based on physiological experiments and pharmacology, we demonstrate for the first time differences in NMDAR subunit compositions of two convergent synaptic inputs onto the same neocortical pyramidal neurons. These pathway-specific differences in subunits directly translate into differences in functional properties of the underlying receptors. Our results further enable us to specify a putative subunit composition for NMDARs at these synapses and, from information regarding the role of specific subunits involved, to suggest that neocortical pyramidal neurons might indeed be able to distinguish between inputs on the basis of their stoichiometry
Materials and Methods
In vitro slice preparation and electrophysiology. Coronal slices (300 μm) were cut from brains of Sprague Dawley rats ranging in age between postnatal day 13 (P13) and P21 and were anesthetized with pentobarbital (50 mg/kg). These slices were prepared according to the methods described by Kumar et al. (2002). Briefly, slices were cut in a chilled (4°C) low-Ca2+, low-Na+ cutting solution and were allowed to equilibrate in oxygenated artificial CSF (aCSF) containing the following (in mm): 126 NaCl, 26 NaHCO3, 2.5 KCl, 1.25 NaH2PO4, 2 MgCl2, 2 CaCl2, and 10 glucose, pH 7.4, first at 32°C for 1 hr and subsequently at room temperature before being transferred to the recording chamber. Recordings were obtained at 32 ± 1°C from layer 5 pyramidal neurons in the agranular frontal cortex (Paxinos and Watson, 1986). Recording electrodes (1.2-2 μm tip diameters; 3-6 MΩ) contained the following (in mm): for voltage-clamp experiments, 120 cesium gluconate, 1 MgCl2, 1 CaCl2, 11 KCl, 10 HEPES, 2 NaATP, 0.3 NaGTP, 1 QX-314, and 11 EGTA (pH 7.3 was corrected with Cs-OH, 290 mOsm); for current-clamp experiments, 105 potassium gluconate, 30 KCl, 10 HEPES, 10 phosphocreatine, 4 MgATP, and 0.3 GTP (adjusted to pH 7.3 with KOH). Slices were maintained in oxygenated (95% O2-5% CO2) aCSF, and drugs and chemicals were applied via the perfusate (2 ml/min) and/or a local perfusion system that allowed fast exchange of media at the level of the synapse (Kumar et al., 2002) (Fig. 1 A).
Figure 1.
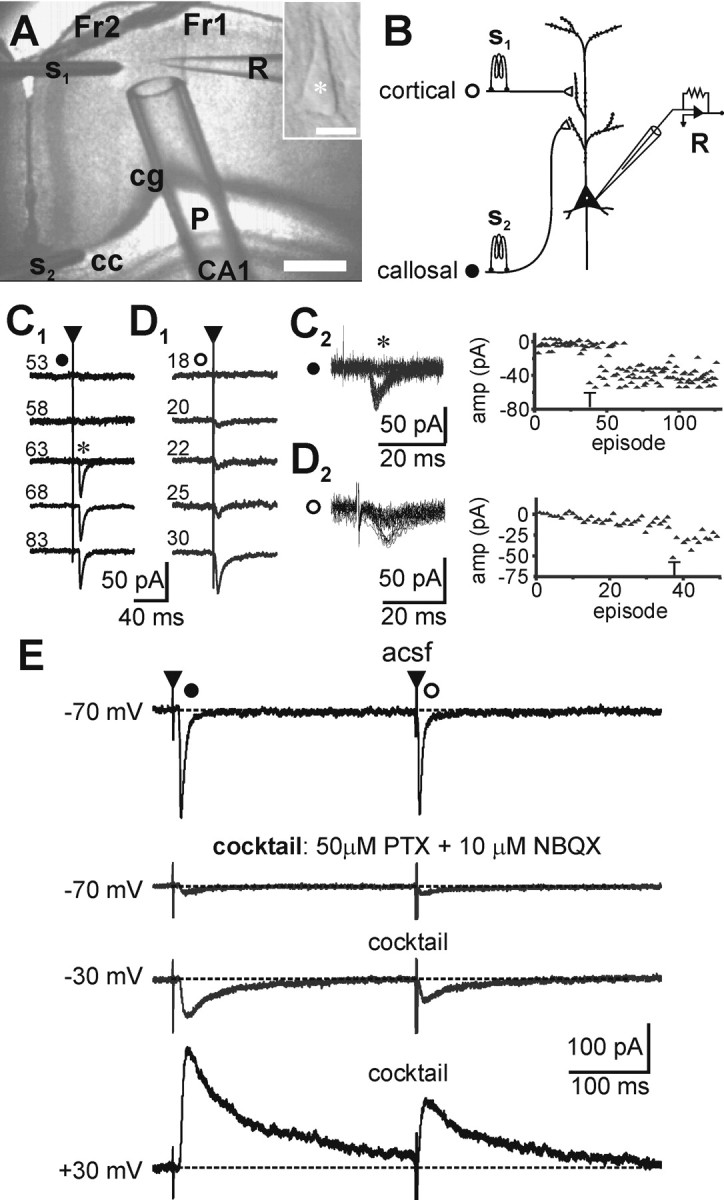
Synaptically activated NMDA currents in neocortical layer 5 pyramidal neurons. A, B, Experimental arrangement and schematic of the model for studying properties of pharmacologically isolated EPSCs evoked in pyramidal cells (A, inset) during minimal stimulation of the callosal (•) and intracortical (○) pathways. Scale bar, 20 μm. A, Cortical slice preparation used in the study showing placement of stimulating (S1, intracortical; S2, callosal), local perfusion pipette (P), and recording (R) electrodes: Fr1, Fr2, frontal-cortex areas 1 and 2; CA1, region of hippocampus; cg, cingulum; cc, corpus callosum (principal commissural pathway linking both cerebral hemispheres). Scale bar, 1 mm. C, D, Establishing minimal responses in both pathways during concomitant alternate stimulation. Traces are averaged consecutive records (≥10) of EPSCs evoked in one cell (-70 mV) at the indicated stimulus intensities [expressed as the width (in microseconds) of a 0.75 mA current pulse]. Note the all-or-none nature of the callosal (C1) and intracortical (D1) responses. The threshold (T) is characterized by intermittent failures (*), as can be seen from the overlapped traces and their respective plots of EPSC amplitude versus episode number (C2, D2). Stimulus parameters were determined relative to threshold and were held constant just above threshold (∼1.2 T) throughout the remainder of the experiment. Note the fixed latency of the responses from respective stimulus onsets (▴). E, Pharmacological scheme for isolating the pure NMDAR-mediated responses. Examples of averaged records from the same neuron in which callosal and intracortical EPSCs were concomitantly evoked under the indicated conditions. Note that, in both pathways, EPSCs at -70 mV were fast, rapidly decaying, and mediated mostly by AMPARs as they were blocked by NBQX in the mixture (50 μm PTX and 10 μm NBQX). Depolarization to ±30 mV in the presence of the mixture reveal late, slowly decaying responses that are mediated purely by NMDARs (blocked by APV; data not shown). The above approach was used to isolate the pure NMDAR-mediated component in all subsequent experiments.
Concentric bipolar electrodes (CB-XRC75; Frederick Haer Company, Bowdoinham, ME) with 75 μm tip diameters were positioned on the callosal tract and/or intracortically in close proximity to the recorded neuron (Fig. 1 A), and constant current pulses 50-300 μsec in duration and 100-500 μA in amplitude were applied at low frequencies (0.1-0.3 Hz). Callosal stimulation activates fibers potentially in both orthodromic and antidromic directions, each of which in turn activates monosynaptic excitatory connections onto the recorded pyramidal neuron (Kumar and Huguenard, 2001). Thus, this model consists of activating a well defined, relatively homogeneous population of intracortical excitatory connections. Stimulation parameters were determined by increasing current strength until postsynaptic responses could be evoked and were held constant at ∼1.2 × the threshold for obtaining a detectable response throughout the remainder of the experiment (thresholds were characterized by a large proportion of failures) (Dobrunz and Stevens, 1997). EPSCs and EPSPs were recorded with an Axopatch-1D and pClamp software (Axon Instruments, Foster City, CA), filtered at 1-2 kHz (10 kHz for current clamp), digitized at 10-20 kHz, and stored on VHS videotapes (Neurocorder DR-484; NeuroData Instruments, Delaware Water Gap, PA). Series resistance was monitored continuously, and those experiments in which this parameter exceeded 15 MΩ or changed by >20% were rejected. Series resistance compensation was not used.
Time constants for postsynaptic currents were obtained from single-exponential fits of averaged records using Clampfit (Axon Instruments). Traces shown in the figures are averages of 10-20 consecutive responses (0.25-0.33 Hz), and all values are expressed as mean ± SEM. I-V values were recorded by changing membrane potential according to a predetermined randomized sequence to avoid discrepancies associated with any long-term changes in the responses. Statistical differences were measured using either the Student's t test or the Kolmogorov-Smirnov test (in which data were not normally distributed) unless indicated otherwise. The following compounds were applied by bath and/or locally perfused as required for specific protocols: d(-)-2-amino-5-phosphonopentanoic acid (d-APV), 2,3-dihydro-6-nitro-7-sulfamoyl-benzo(F)quinoxaline (NBQX) [diluted in dimethylsulphoxide (DMSO), <0.1% final concentration], N,N,N′N′-tetrakis(2-pyridyl-methyl)ethylenediamine (TPEN) (diluted in DMSO), and picrotoxin (PTX) (all from Research Biochemicals, St. Albans, UK and Sigma, St. Louis, MO). Ifenprodil [α-(4 hydroxyphenyl)-bets-methyl-4-benzyl-1-piperidineethanol] was obtained from Tocris Cookson (Bristol, UK), and (+/-)-cis-1-(phenanthren-2yl-carbonyl)-piperazine-2,3-dicarboxylic acid (PPDA) was kindly provided by Drs. Daniel T. Monaghan (University of Nebraska, Omaha, NE) and David E. Jane (University of Bristol, Bristol, UK).
Data analysis. The conductance-voltage (g-V) relationships for each cell were obtained using the following equation:
 |
1 |
where I is the averaged peak amplitude of 10 or more consecutive EPSCs evoked by stimulation of a given path while holding the membrane potential of the cell constant at V. Erev is the reversal potential for the currents measured from linear fits between -15 and +30 mV of the respective I-Vs. The maximal conductance (gmax) was obtained by fitting the g-V curves for each cell with the following Boltzmann equation:
 |
2 |
where V0.5 is the potential at which g/gmax = 0.5, and γ is the slope of the curve.
The normalized g (i.e., g/gmax)-V data were refitted with the following equation:
 |
3 |
where KMg is the apparent dissociation constant for Mg2+ block at 0 mV membrane potential, δ is the electrical distance of the Mg2+ binding site in the membrane field, V is the membrane potential (in volts), F (9.648 × 10⁴ C/mol) is the Faraday constant, z (+2) is the valence, R (8.315 J · K-1 · mol-1) is the gas constant, and T (32°C/305.2°K) is the temperature (Mayer et al., 1989; Chen and Huang, 1992). The final ionic activity was computed as the product of its activity coefficient (γ) and the corresponding molar concentration (m). γMg was estimated as 0.724 (MgCl2 at 2 mm) according to Pitzer and Mayorga (1973) using the following equation:
 |
4 |
and normalized g-V data were fitted with a nonlinear least-squares fitting method (based on the Levenberg-Marquardt algorithm) using Origin (version 6.0; Microcal Software, Northampton, MA).
Results
Isolation of synaptically activated NMDAR currents
Whole-cell voltage-clamp recordings were obtained from visually identified pyramidal neurons in layer 5 of the agranular frontal cortex close to midline (Fig. 1A). EPSCs were evoked by alternate stimulation (0.3 Hz) of the corpus callosum (long-range) and local intracortical (short-range) afferents in close proximity (typically intralaminar) to the recorded neuron (Fig. 1B). Stimulus intensity in each pathway was adjusted to the minimum value that reliably evoked a single EPSC without failures (Fig. 1C1,D1). The threshold was characterized by intermittent failures (Fig. 1C2,D2), which are typical of an all-or-none postsynaptic response (Dobrunz and Stevens, 1997). We characterized these responses previously and concluded the following: (1) near-threshold stimulation of these pathways can activate NMDAR-mediated monosynaptic EPSCs in addition to the non-NMDA or AMPA components and (2) the postsynaptic properties of AMPAR-mediated EPSCs were common to most synapses on these neurons (Kumar and Huguenard, 2001; Kumar et al., 2002). To examine the contribution of NMDARs in detail, EPSCs were pharmacologically isolated in a mixture containing 50 μm PTX to block GABAA-mediated inhibition and 10 μm NBQX to block all AMPA-kainate receptors. Recording electrodes contained cesium ions to block GABAB-mediated K+ currents. Note that, at -70 mV, both intracortical and callosal responses were substantially reduced by the mixture, indicating minimal participation of NMDARs at this voltage, most likely attributable to Mg2+ blockade (Nowak et al., 1984), which was relieved by depolarization (-30 mV) (Fig. 1E). EPSCs were outward at +30 mV with reversal potential being close to 0 mV and could be completely antagonized with 50 μmd-APV (data not shown; compare Fig. 5A2).
Figure 5.

Integration of EPSPs is influenced by NMDAR subunit composition. A1, A2, Effects of ifenprodil (5 μm) and APV (50 μm) on the properties of the 100 Hz response envelope. A1, Time course of changes in the envelope height during the indicated pharmacological manipulations taken from one experiment. Each point on the plot represents the averaged height (percentage of control) of four consecutive responses evoked at 0.25 Hz. Error bars, where these are greater than the size of the symbol, indicate SEM. The inset in A1 represents minimally evoked cortical (○) and callosal (•) EPSPs (stimulus intensities used were 129.6 and 4.6 nC for cortical and callosal responses, respectively). Note that suppression of cortical response by ifenprodil is greater for the cortical pathway than for the callosal pathway in contrast with APV, which suppress both responses equally. A2, Averages of all responses during the numbered time periods (bars) indicated on the time plot in A1. Application of the mixture (50 μm PTX, 10 μm NBQX, and 50 μm APV) completely blocks both responses. B, Population data (n = 5) of the percentage change in areas and heights of the 100 Hz cortical and callosal response envelopes during application of ifenprodil and APV. Note the pathway-specific effects of ifenprodil in contrast with APV. *p < 0.05 and **p < 0.01; ns, not statistically significant.
Differences in voltage-dependent properties of NMDAR-mediated EPSCs
Voltage dependence of the pure NMDAR-mediated responses in the two pathways was examined by measuring peak EPSC amplitudes at various holding potentials in the range -70 to +30 mV (Fig. 2A1). The I-V relationships for both callosal and intracortical responses displayed prominent regions of negative slope (Fig. 2A2) (Mayer et al., 1984; Mayer and Westbrook, 1987). The resulting g-V plots were therefore sigmoidal and could be best fitted with Boltzmann functions (Fig. 2A2, insets). The composite I-V relationships for the two synaptic responses (n = 6 neurons) (Fig. 2B) were qualitatively similar, although minimal callosal responses were smaller than intracortical responses, and inward currents for the two pathways peaked at different holding potentials (-15 ± 5 mV for the callosal pathway compared with -25 ± 5 mV for the intracortical). Both EPSCs reversed polarity close to the expected reversal potential of 0 mV (averaged Erev was 2.9 ± 1.7 for callosal and 1.4 ± 1.6 mV for intracortical EPSCs; p > 0.5; Student's t test; n = 6) (Fig. 2B, inset), suggesting that the observed differences in the I-V relationships are not because of errors in voltage clamp of the synapses. To quantify differences in voltage dependence of NMDAR-mediated EPSCs in the two pathways, intracortical and callosal g-V data for each cell were normalized to its respective maximal conductance (gmax) obtained from individual Boltzmann fits (as described in Materials and Methods, Data analysis). The composite normalized g-V plots and Boltzmann fits are shown superimposed in Figure 2C. The g-V curve for the cortical pathway was left shifted compared with the callosal pathway. The half-maximal membrane potential (V0.5), corresponding to g/gmax = 0.5, for the cortical response (-31.3 ± 2.3 mV) was significantly more hyperpolarized compared with V0.5 for the callosal response (-22.9 ± 2.7 mV; p < 0.05), thus confirming the differences in voltage dependence of NMDARs activated by the two pathways.
Figure 2.
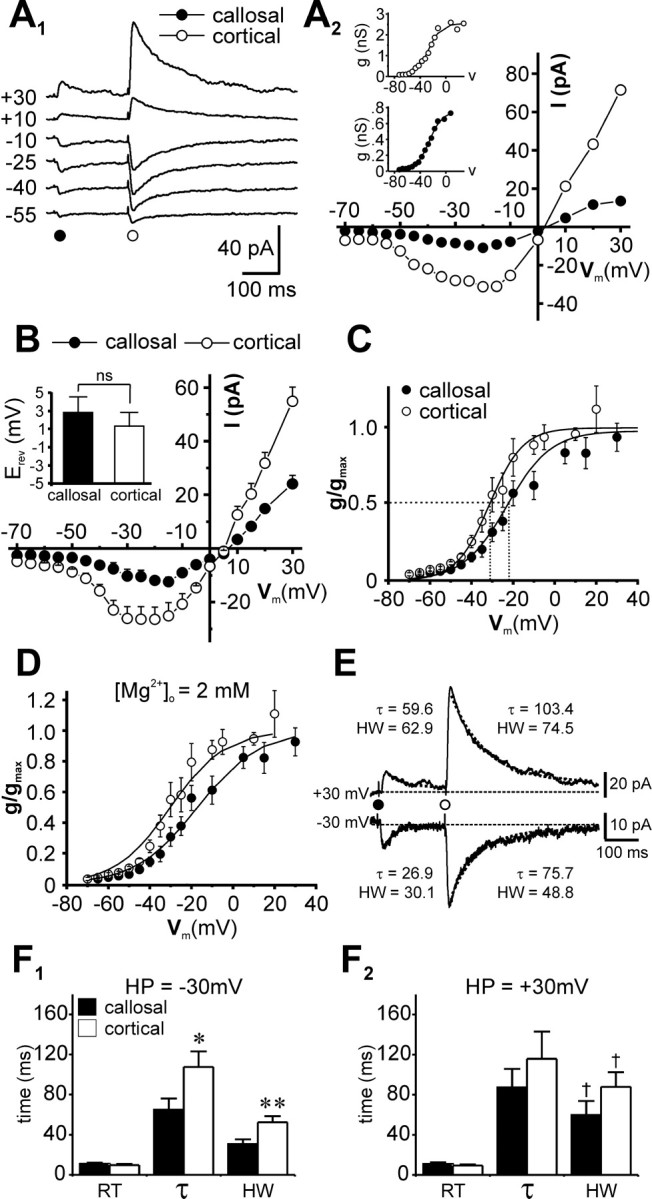
Differences in voltage-dependent and kinetic properties of pharmacologically isolated NMDAR-mediated synaptic currents evoked by callosal (•) and intracortical (○) stimulation. A-C, Voltage-dependent properties: averaged records of NMDAR-mediated EPSCs from a neuron at the indicated holding potentials (A1) and the corresponding I-Vs for the two responses (A2). The corresponding g-V plots for this individual neuron are shown as insets and are fitted with Boltzmann curves (gmax, slope, and V at 0.5 gmax are 2.5 ± 0.08 nS, 9.9 ± 0.9 nS/V, 27.2 ± 1.2 mV for the cortical and 0.75 ± 0.02 nS, 10.3 ± 0.6 nS/V, 25.9 ± 0.8 mV for the callosal plots, respectively). B, Composite I-V relationships of data pooled from several experiments show similar trends. Each point on the plot represents an ensemble average of six experiments, and error bars represent SEM, where this is greater than the size of the symbol. The bar plot in the inset shows the averaged EPSC Erev in each pathway. C, Ensemble average of normalized g-V data, obtained from callosal and intracortical responses for each cell in B (n = 6) superimposed with Boltzmann curves, the parameters of which are averaged from individual fits (callosal, gmax = 0.97 ± 0.08 nS, γ = -10.5 ± 1.4 nS/V; intracortical, gmax = 1.6 ± 0.24 nS, γ = -7.8 ± 1.1 nS/V). Note the leftward shift in V0.5 for the cortical g-V curve relative to the callosal (V0.5intracortical = -31.3 ± 2.3 vs V0.5callosal = -22.9 ± 2.7 mV; p < 0.05). D, Data in C fitted with the equation to determine the dissociation constants (KMg) for Mg2+ at the indicated extracellular concentration and the degree of voltage-dependent Mg2+ blockade in both pathways. E, F, Kinetic properties: pathway-specific differences in RT, decay time constant (τ), and the half-maximal amplitude of NMDAR-mediated EPSCs (all in milliseconds) under the indicated conditions (E). Bar plots depict mean differences in the kinetic properties of the two responses at ±30 mV (F1, F2; n = 7). *p < 0.05; **p < 0.01; NS, p > 0.5; †p < 0.05, cross-comparisons of parameters for respective pathways at the indicated holding potentials (HPs).
An estimate of voltage-dependent Mg2+ blockade
Differences in voltage dependence for NMDAR-mediated currents in the two pathways could manifest from altered affinity of the underlying receptor channels for Mg2+ (Mayer et al., 1989; Chen and Huang, 1992; Guo and Huang, 2001). Thus, NMDAR channels activated at more hyperpolarized potentials would be expected to have a lower Mg2+ affinity and reduced voltage-dependent Mg2+ block compared with those requiring stronger depolarization for activation. We estimated the degree of voltage-dependent Mg2+ blockade in both pathways from the apparent dissociation constants (KMg) for Mg2+at a single fixed extracellular concentration ([Mg2+] at 2 mm) and a membrane potential of 0 mV (Fig. 2D). Dissociation constants were obtained from fits of respective g-V relationships (Fig. 2C) using Equation 3 (see Materials and Methods) (Mayer et al., 1989) with KMg and δ, the electrical distance of the Mg2+ binding site in the membrane field, as the only free parameters. Ionic activities instead of concentrations were used in the computations (aMg = γMg [Mg2+] = 1.45; activity coefficient for Mg2+, γMg = 0.724) (for details, see Materials and Methods, Data analysis). Although the estimated values for δ for the two pathways were similar (δcallosal = 0.87 ± 0.06; δintracortical = 0.99 ± 0.1), KMg for NMDARs activated via the intracortical pathway was approximately three times higher than that for the callosal pathway [KMg callosal = 6.4 ± 0.9 mmaKMg = 4.6 ± 0.6 mm); KMg intracortical = 18.7 ± 5.2 mmaKMg = 13.6 ± 3.8 mm)] (for an example of subunit-specific modulation of KMg by the binding of monovalent cations, see Zhu and Auerbach, 2001).
Pathway-specific differences in kinetic properties of NMDAR-mediated EPSCs
We next compared the kinetic properties of callosal and intracortical NMDAR-mediated EPSCs evoked in the same pyramidal neuron by minimal stimulation at two different holding potentials ±30 mV (-30 mV was the approximate midpoint of the region of negative slope on the I-Vs where the membrane is sufficiently depolarized to activate a sizeable NMDAR-dependent EPSC). Rise times (RT) (10-90%) and response durations, characterized in terms of widths at half-maximum amplitude (HW), were determined from EPSCs averaged from 10 or more consecutive responses, whereas time courses, measured in terms of decay time constants (τ), were obtained from single-exponential fits (Hestrin, 1992) of the traces as shown in Figure 2E. Note that, as expected for short- versus long-range synaptic inputs, intracortical EPSCs had shorter latencies from stimulus onset compared with callosal (3.1 ± 0.2 vs 6.1 ± 0.2 msec; n = 14; p < 0.001). Although rise times for the two responses were comparable at both ±30 mV (RT-30,callosal = 10.9 ± 1.1 vs RT-30,intracortical = 9.6 ± 1.2 msec; RT+30,callosal = 10.8 ± 1.7 vs RT+30,intracortical = 9.4 ± 1.0 msec; p > 0.1; n = 7) (Fig. 2F1,F2), cortically evoked EPSCs at -30 mV decayed at a significantly slower rate than callosal EPSCs (τintracortical = 107.61 ± 15.5 vs τcallosal = 64.9 ± 11.4 msec; p < 0.05; n = 7) and had significantly larger half-widths (HWintracortical = 52.4 ± 6.1 vs HWcallosal = 30.6 ± 4.8 msec; p < 0.01) (Fig. 2F1). Similar trends were also observed at +30 mV (τ = 115.9 ± 27.1 and 87.4 ± 18.4 msec and HW = 87.9 ± 14.6 and 59.8 ± 13.9 msec for intracortical and callosal responses, respectively) (Fig. 2F2). Half-widths for NMDAR-mediated currents at -30 mV were smaller than those measured at +30 mV for both callosal and intracortical pathways (p < 0.05) (Hestrin, 1992). These data imply differences in voltage sensitivity of the underlying NMDA channel kinetics, and, together with the differences in voltage dependence (of peak EPSC amplitude) and apparent Mg2+ affinity, they strongly suggest that the subunit composition of the underlying receptor population is different for the two pathways.
Pharmacology supporting distinct NMDAR subunits at the two synapses
Given that the apparent affinity of NMDARs for glutamate and the characteristically prolonged time course of decay of NMDAR-mediated EPSCs are both influenced strongly by the identity of the NR2 subunits involved (Vicini et al., 1998), we assayed specifically for NR2-related differences in NMDAR stoichiometry at the two synapses. To probe the subunit composition for NR2B and NR2A, we examined the effects of ifenprodil, an NR2B subunit-specific antagonist of NMDARs (Williams, 1993; Tovar and Westbrook, 1999; Cull-Candy et al., 2001), and TPEN, a Zn2+ chelator, on callosal and intracortical EPSC amplitude. PPDA, an NMDAR antagonist with an ∼10- to 30-fold higher affinity for NR2C/D than for NR2A/B (Hrabetova et al., 2000), was used to reconfirm any pathway-specific differences with the other compounds and assay the potential involvement of NR2C/D subunits. NMDAR-mediated responses were isolated in the presence of the mixture (50 μm PTX and 10 μm NBQX) while holding the cell at -30 mV. Based on differences in decay times observed for the two responses in this study and decay times measured in human embryonic kidney 293 cells transfected with distinct NMDAR subunit cDNAs, which ranged from tens of milliseconds for the NR1a/NR2A combination to hundreds of milliseconds for NR1a/NR2B and NR1a/NR2C combinations (Vicini et al., 1998), ifenprodil and TPEN would be expected to differentially affect intracortical and callosal EPSCs, respectively.
Indeed, bath application of ifenprodil (3 μm) selectively antagonized the intracortical EPSCs but left the callosal responses intact (Fig. 3A1, inset). The pooled data, representing the ensemble average across eight experiments, show that the effect is robust and consistent (Fig. 3A1), although ifenprodil acts slowly and is poorly reversible when applied via the bathing medium (see Fig. 5A1 for the effects of local perfusion). The mean amplitude of intracortically evoked EPSCs were -34.81 ± 5.4 pA in control, -23.92 ± 2.5 pA during ifenprodil (p < 0.01; paired t test; n = 8), and -19.46 ± 2.7 pA (n = 7) during 3-5 min of washout, whereas the corresponding values for callosally mediated responses were -24.25 ± 4.2 pA (control), -24.01 ± 3.9 pA (ifenprodil; p > 0.5; paired t test; n = 8), and -20.66 ± 4.2 pA (washout; n = 7). Thus, although callosal EPSCs remained unchanged in the presence of the drug (99.04 ± 11.4% of control), intracortical EPSCs were significantly suppressed (68.71 ± 6.8%; p < 0.05; n = 8) (Fig. 3A2). These data suggest that NMDARs underlying the intracortical inputs but not the callosal inputs are composed of the NR2B subunit.
Figure 3.
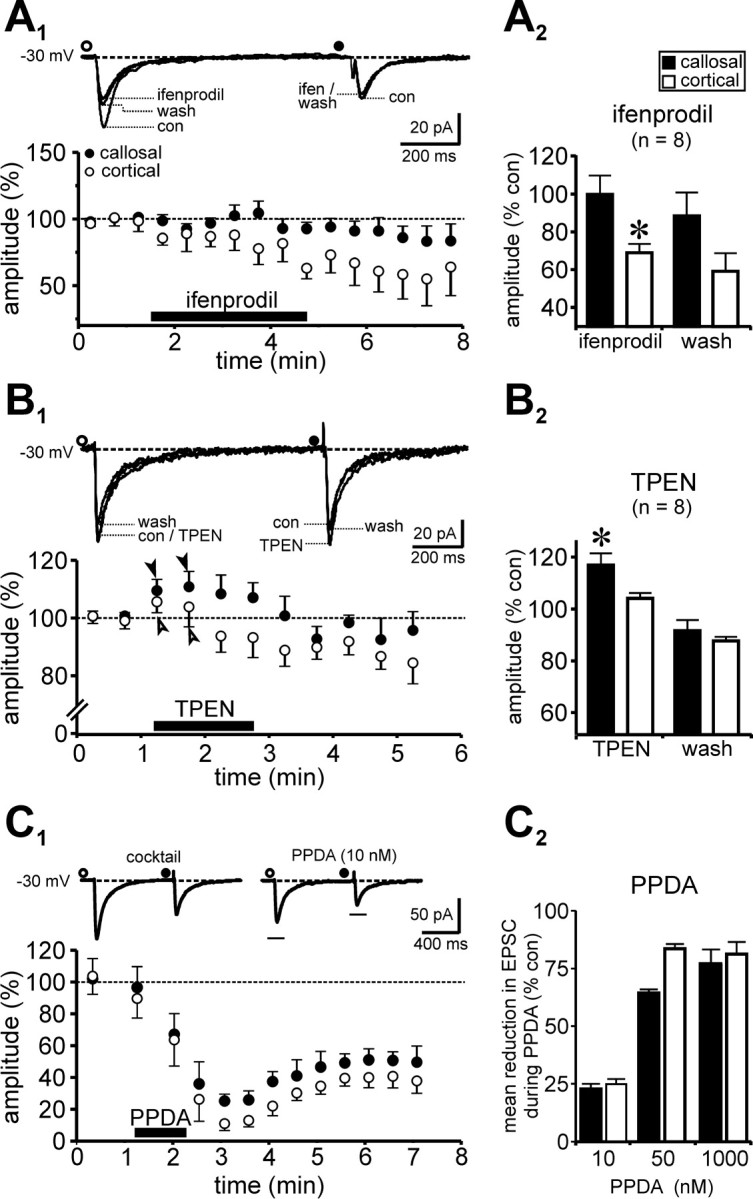
Differential pharmacology of callosal and intracortical EPSCs indicates distinct NMDAR subunits at the two synapses. A1, A2, Effects of bath application of ifenprodil (3 μm), an NR2B subunit-specific antagonist, on pharmacologically isolated callosal (•) and intracortical (○) NMDAR-mediated EPSCs. Traces (A1, inset) are averaged consecutive records (≥20) of EPSCs evoked in a single neuron (-30 mV). Note that the cortical EPSC amplitude is selectively diminished in the presence of the drug. Time course of changes in response amplitude (percentage of control) in the presence of ifenprodil applied at the time indicated (black bar; 100% indicates average of all control values) are shown in the plot of the pooled data in which each point represents the ensemble average across eight experiments of 10 consecutive measurements of EPSC amplitude. A2, Bar plots showing the averaged percentage change in amplitude for both responses under the indicated conditions. Intracortical EPSCs were 68.71 ± 6.8% of control in ifenprodil as opposed to 99.04 ± 11.4% for callosal EPSCs (p < 0.05; t test; n = 8). Note that the ifenprodil effect does not reverse quickly when the drug is applied through the bath perfusate. B1, B2, The Zn2+ chelator TPEN affects callosal and intracortical NMDAR-dependent EPSCs differently than ifenprodil. B1, When applied locally, TPEN (1 μm) selectively potentiates callosal EPSCs but not the cortical EPSCs (B1, inset). The plot in B1 represents pooled data in which each point represents the ensemble average across eight experiments. The filled arrows indicate transient increase in EPSC amplitude for both responses at the beginning of the application period. However, although callosal responses stay potentiated during the course of the drug application, cortical responses are eventually diminished. B2, Bar plots showing the percentage change in amplitude for both responses in the presence of the drug for the indicated number of experiments. Averaged intracortical EPSCs were 102.9 ± 3.5% of their control values in TPEN as opposed to 114.3 ± 5.8 for the callosal EPSCs (p < 0.05; t test; n = 8). Statistical comparisons in A2 and B2 are between mean percentage changes for the two pathways. Error bars represent SEM, where this is greater than the size of the symbol. C1, C2, Unlike ifenprodil (A1, A2) or TPEN (B1, B2), PPDA, an antagonist with an ∼10- to 30-fold higher affinity for NR2C/D than for NR2A/B, suppresses both callosal and intracortical responses. C1, An experiment demonstrating the effects of local perfusion of PPDA (10 nm) on EPSC amplitude. Each point on the plot represents an ensemble average of 10 consecutive responses evoked at 0.3 Hz. Traces (C1, inset) are averaged records (≥10) of EPSCs evoked in the same neuron (-30 mV) under the indicated conditions. Note that the PPDA effect is widely irreversible and that the magnitude and rate of suppression (data not shown) of EPSC amplitude for the two pathways are different. C2, Summary of the mean percentage reduction in EPSC amplitude as a function of drug concentration (n = 4). Note that suppression of cortical EPSCs is already maximal at 50 nm PPDA compared with callosal EPSCs. Error bars in C2 indicate SEM of ≥15 consecutive responses during application of the drug. *p < 0.05.
The mechanism of action of TPEN has been reported to be mediated by chelation of Zn2+ ions, which tonically inhibit NMDARs by binding to the Zn2+ binding site on the NR2A subunit (Paoletti et al., 1997). Although never tested before in this preparation, this compound would be expected to selectively enhance responses from NR2A-containing receptors and distinguish them from those containing the NR2B subunit (Misra et al., 2000; Tovar et al., 2000; Cull-Candy et al., 2001; Billups et al., 2002; Joshi and Wang, 2002). Indeed, local perfusion of TPEN (1 μm) increased differentially the callosal EPSCs but not the intracortical EPSCs (Fig. 3B1,B2). During local application of the drug, we observed a small initial enhancement of both responses (Fig. 3B1, arrows), possibly mediated by charge screening in the local vicinity of the synaptic inputs caused by chelation of Zn2+ ions. However, although callosal responses remained modestly potentiated in the presence of TPEN, intracortical responses were on average unaffected. The mean amplitude of intracortically evoked EPSCs in this series were -53.61 ± 5.3 pA in control, -55.13 ± 5.4 pA during TPEN (p > 0.3; paired t test; n = 8), and -46.3 ± 2.7 pA (n = 7) during washout, whereas the corresponding values for callosally mediated responses were -41.7 ± 7.9 pA (control), -47.7 ± 8.2 pA (TPEN; p < 0.005; paired t test; n = 8), and -37.6 ± 7.9 pA (washout; n = 7). Thus, although intracortical EPSCs were only 102.9 ± 3.5% of control (100%) in the presence of the drug, callosal EPSCs were potentiated significantly (mean, 114.3 ± 5.8%; p < 0.05; n = 8) (Fig. 3B2). These data suggest that NMDARs underlying the callosal inputs but not the intracortical inputs contain the NR2A subunit. These differences in subunit composition are consistent with differences in decay kinetics of NR2A/NR2B-mediated NMDA currents observed in this study and in recombinant systems in which it is possible to assay the functional properties of NMDARs conferred by specific subunits (for review, see Vicini et al., 1998).
When applied locally, PPDA, unlike ifenprodil or TPEN, suppressed both intracortical and callosal responses (Fig. 3C1). However, we generally observed a faster (data not shown) and greater suppression of the intracortical response compared with the callosal response during application of PPDA in all neurons tested (n = 4) (Fig. 3C2). Lowering the drug concentration slowed the suppression of both responses, whereas increasing it produced the opposite effect. These differences in dose-dependent effects of PPDA between callosal and intracortical pathways provide additional support for the conclusion that the underlying composition of NMDARs at the two synapses is dissimilar. Thus, although NMDARs containing the NR2C/D subunits could occur at both synapses, they would be more predominant at intracortical as opposed to callosal synapses.
Pathway-specific differences in the integrative properties of underlying NMDARs
To examine what effects, if any, input-specific differences in NMDAR subunit composition might have on the ability of layer 5 pyramidal neurons to integrate trains of EPSPs in these pathways and determine whether there were any differences in the processing of these inputs, we obtained current-clamp recordings of minimally evoked callosal and intracortical EPSPs at various frequencies (eight stimuli; 5-100 Hz) (Fig. 4A). These experiments were performed with normal aCSF, because we found that, at resting membrane potential, NMDAR-dependent EPSPs (isolated in the PTX/NBQX mixture) were quite small. Thus, to determine how NMDARs contribute to synaptic integration in a physiological setting, we left AMPAR-mediated synaptic responses intact because the latter provided the necessary depolarization to activate a substantial number of NMDARs. The mean amplitudes of the unitary EPSPs (evoked at 0.25 Hz; control) for callosal and intracortical responses were 1.92 ± 0.25 and 2.21 ± 0.32 mV, respectively (n = 15; p > 0.5) (Fig. 4D). We observed that, although the composite responses (averaged from ≥20 consecutive EPSP trains) of the two pathways were virtually indistinguishable in terms of their integration at lower frequencies (<40 Hz), the response obtained with trains at frequencies ≥40 Hz were significantly larger for the intracortical pathway despite comparable amplitudes for the single responses. At a stimulus frequency of 100 Hz, neurons often generated action potentials (APs) that fired off the composite EPSP envelope for cortical (72%) but not the callosal (9%) inputs. Of the neurons, 19% did not fire from either cortical or callosal envelopes. To quantify integration in the two pathways, the peak amplitude of each EPSP (measured from a common baseline) (Fig. 4B, inset) in the train was normalized to the first (100%) and the ensemble average across experiments plotted as a function of stimulus number (Fig. 4B). Although there were no differences between callosal and intracortical EPSPs at low stimulus frequencies (5, 10, or 20 Hz), intracortical responses at 40 Hz (n = 9) and 100 Hz (n = 7) were significantly larger than callosal responses (p < 0.0001; repeated-measures ANOVA).
Figure 4.

NMDARs at intracortical synapses are more effective at integrating EPSPs and bringing the neuron to spike-firing threshold than those activated by callosal stimulation. A, Current-clamp recordings of minimally evoked EPSPs (top trace) during stimulation of the intracortical (○) and callosal (•) pathways at the indicated frequencies (8 stimuli). Traces shown are averages of (≥20) consecutive responses in aCSF. Note that, although the two responses are indistinguishable in terms of their integrative properties at lower frequencies (<40 Hz), the response envelopes generated at frequencies >40 Hz are significantly larger for the cortical pathway despite comparable amplitudes of the control responses. At 100 Hz, neurons often (72%) fired off the envelope generated in response to cortical but not callosal stimulation (9%); 19% of neurons did not fire from either cortical or callosal envelopes. B, Plot of the composite amplitude (measured as shown in the inset) of each EPSP in the train (normalized to the first, 100%) as a function of stimulus number. Although there were no differences in the EPSP summation between callosal and intracortical pathways at 5, 10, or 20 Hz stimulation, cortical EPSPs generated by 40 and 100 Hz stimulation were significantly larger than callosal EPSPs. ***p < 0.0001 (repeated-measures ANOVA). C1, C2, An example from another cell showing similar differences in envelope attributes. Note how the respective envelopes are differentially affected when stimulus intensity in both pathways is increased proportionally (C2). D, Bar plots showing the mean amplitudes of the control EPSP for both pathways. Error bars indicate SEM.
Differences in integration between callosal and intracortical pathways persisted when stimulus intensity was proportionately increased in each pathway (Fig. 4C1,C2). As can be seen from Figure 4C2, increments in stimulus intensity (four increments of ∼30% at 40 Hz) led to a progressive buildup of the intracortical but not the callosal response envelope and eventually to the firing of action potentials from the resulting depolarization. As before, note the differences in the size and shape of the depolarizations for the two pathways when stimulus frequency was increased to 100 Hz (Fig. 4C1). We quantified these differences based on the heights and areas of the EPSP envelopes generated at 20, 40, and 100 Hz. The average composite heights for the cortically evoked response were greater than for the callosal response at all frequencies tested (40 Hz, 3.23 ± 0.4 vs 2.16 ± 0.4 mV, n = 12, p < 0.01; 100 Hz, 4.17 ± 0.6 vs 2.74 ± 0.4 mV, n = 14, p < 0.05; data not shown). Similar trends were observed for the corresponding areas, although the variability in this parameter was much greater (40 Hz, 485.6 ± 108.8 vs 335.9 ± 65.1; 100 Hz, 382.1 ± 75.7 vs 276.3 ± 51.6).
Summation of EPSPs is influenced by NMDAR subunit composition
To directly confirm that the above differences in EPSP summation between the two pathways were mediated by differences in subunit composition of the underlying NMDARs and not simply a result of variation in their numbers or polysynaptic effects, we examined the effects of ifenprodil (by far the most specific and widely used of the three NMDAR antagonists tested in this study that selectively suppresses the NR2B-containing intracortical responses; 5 μm) or APV (50 μm), a broad-spectrum antagonist of NMDARs, on the 100 Hz response envelopes generated by the respective pathways. Figure 5A1 depicts the time course of changes in envelope height for the two responses during the local application of ifenprodil and APV typically seen in these experiments. Each point on the plot is the averaged amplitude (percentage of control) of four consecutive responses evoked at 0.25 Hz. Note that the suppression of intracortical response by ifenprodil was far greater for the cortical pathway than for the callosal pathway and in sharp contrast with the effects of APV, which suppressed both responses equally. Averaged responses from the numbered time periods indicated on the time plot (Fig. 5A1, bars) are shown superimposed in Figure 5A2. Note that both responses were blocked during subsequent application of the mixture (50 μm PTX, 10 μm NBQX, and 50 μm APV).
Pooled data across experiments (n = 5) show that relative reductions by ifenprodil were significantly greater for the intracortical than callosal pathway (height, 63.14 ± 8 vs 31.76 ± 7.5%, p < 0.05; area, 70.64 ± 8.6 vs 26.81 ± 8.7%, p < 0.01). In contrast, APV had similar effects on both pathways (height, 47.96 ± 12.6 vs 36.58 ± 8.3%, p > 0.4; area, 62.17 ± 15.1 vs 44.6 ± 6.5%, p > 0.3) (Fig. 5B). Note that, as before, ifenprodil-mediated suppression of intracortical responses is significantly more pronounced (p < 0.001 for both area and height; repeated-measures ANOVA) compared with callosal (p > 0.05). The specificity of ifenprodil indicates that these effects are likely caused by differences in NMDARs on the pyramidal cells rather than purely a difference in synaptic release or receptor number. The partial blockade of the callosal response by ifenprodil may be attributable to increased neurotransmitter release evoked by high-frequency stimulation resulting in activation of noncallosal NMDARs. These data suggest that intracortically activated NMDARs are therefore more efficient at integrating EPSPs and bringing the neuron closer to the spike-firing threshold than NMDARs activated by the callosal pathway and that these differences are manifest by virtue of their unique subunit compositions.
Discussion
Cortico-cortical connections mediate high-order information processing (Braitenberg and Schüz, 1991). Our results demonstrate that the subunit composition of NMDARs underlying long-range callosal inputs onto neocortical pyramidal neurons is distinct from the mainly local, short-range, noncallosal inputs activated by intracortical stimulation. The main distinction appears to be in the NR2 class of subunits: NMDARs underlying intracortical inputs are mainly composed of the NR2B subunit but not NR2A. Conversely, NMDARs at callosal inputs mostly contain the NR2A subunit but not NR2B. Furthermore, although receptors containing the NR2C/D subunits could occur at both synapses, differences in the magnitude and onset of the PPDA effect would be consistent with a more prominent role in intracortical than callosal synapses. These distinct subunit compositions could account for the differences in activation threshold for NMDAR-mediated currents, apparent affinity of the receptors for Mg2+, and kinetic properties of NMDAR-mediated EPSCs observed between the two pathways. Interestingly, AMPA receptors that coexpress at these synapses do not show pathway specificity. Thus, in contrast to NMDARs, pharmacologically isolated AMPAR-mediated EPSCs at callosal and intracortical synapses are physiologically indistinguishable (Kumar et al., 2002). These data suggest that the identity of synaptic inputs onto these neurons is governed in part by the unique subunit composition of the underlying NMDARs.
The putative subunit composition of synaptic NMDARs
An open question arising from studies of recombinant NMDARs is whether synaptic NMDARs are diheteromeric or triheteromeric. Diheteromeric receptors contain one or more of the NR1 subunit in combination with any one type of NR2, whereas triheteromeric NMDARs contain three different types of subunits, one of which is invariably NR1. Thus, according to the diheteromeric scheme, NMDARs at callosal inputs would be composed exclusively of NR1 and NR2A subunits, whereas those at intracortical synapses would consist only of NR1 and NR2B. If this scheme were indeed true, we would expect PPDA, the NMDAR antagonist with significantly higher affinity for NR2C/D than for NR2A/B, to have no effect whatsoever on callosal or intracortical EPSCs at the concentrations used (Hrabetova et al., 2000). The fact that PPDA affected both responses, albeit in a dose-dependent manner (Fig. 3C2), suggests that NMDARs at these synapses are most likely triheteromeric assemblies. Based on biophysical and pharmacological properties of the responses in each pathway, and considering the observations that NR2D subunits are found predominantly in midbrain structures and that the NR1/NR2D combination has been identified with mostly extrasynaptic receptors (Cull-Candy et al., 1998, 2001; Misra et al., 2000; Momiyama, 2000), we propose the NR1-NR2B-NR2C combination for intracortical NMDARs and either NR1-NR2A-NR2C or NR1-NR2A-NR3 combination for NMDARs at callosal synapses. Note that NR3 subunits can also coassemble with NR2A (Das et al., 1998; Perez-Otano et al., 2001). Inclusion of NR2C in the subunit composition for intracortical NMDARs is consistent with a reduced Mg2+ sensitivity observed for receptors assembled with this subunit (Cull-Candy et al., 2001), thereby making it likely for these receptors to operate at more negative membrane potentials (Chen and Huang, 1992; Guo and Huang, 2001). However, establishing their precise role in regulating the response properties of NMDARs at the two synapses warrants additional experimentation. Finally, differences in decay kinetics of callosal and intracortical responses are as expected for NR2A- and NR2B-mediated NMDA currents observed in recombinant receptors (Vicini et al., 1998) and within intact single cells, respectively (Flint et al., 1997), although decay time constants for synaptically activated NMDAR-mediatedEPSCs in layer 5 neocortical pyramidal neurons appear to be somewhat smaller than those reported in studies using heterologous expression systems. One factor that likely contributes significantly to these differences is the temperature at which recordings are made (Hestrin et al., 1990; Clark and Cull-Candy, 2002).
Heterogeneity of synaptic NMDARs within neurons
Synapse-specific differences in NMDAR properties have been either reported or suggested in other systems and found to be applicable to both divergent and convergent inputs onto neurons. These include the spiny stellate cells in layer 4 of the mouse barrel cortex (Fleidervish et al., 1998; cf. Gil et al., 1999), CA3 (Ito et al., 1997) and CA1 (Otmakhova et al., 2002) pyramidal cells in the hippocampus and the hippocampal mossy fiber-CA3 (Lei and McBain, 2002), and CA1 feedforward inhibitory interneuron systems (Maccaferri and Dingledine, 2002). Interestingly, it appears that NMDAR-mediated pathway specificity is expressed in excitatory neurons but not in inhibitory neurons. Thus, although NMDARs underlying convergent inputs onto an excitatory neuron (e → e) could be functionally heterogeneous (Fleidervish et al., 1998; Kumar and Huguenard, 2001; Otmakhova et al., 2002), NMDARs underlying excitatory inputs onto an inhibitory neuron (e → i) are most likely homogenous (Maccaferri and Dingledine, 2002; Szinyei et al., 2003). Hence, there may be far more inhibitory neurons than excitatory neurons that can be classified as being distinct based solely on the type of NMDARs they express (Lei and McBain, 2002). How then is synapse specificity of excitatory afferents onto inhibitory interneurons expressed? Surprisingly, the answer seems to be through differences in AMPAR subtypes (Toth and McBain, 1998, 2000; Walker et al., 2002). Finally, synapse specificity in principal cells appears to be dependent on NMDA as opposed to AMPARs (Andrasfalvy and Magee, 2001; Kumar et al., 2002). This difference could be attributable to the fact that, among the glutamate receptor subtypes, NMDARs are stably integrated into the postsynaptic density, whereas AMPARs move in and out of the postsynaptic membrane in a dynamic manner (Luscher et al., 1999; Hass, 2001) (for review, see Sheng, 2001; cf. Barria and Malinow, 2002).
Functional significance
NMDARs have been implicated in a large variety of cellular phenomena ranging from neuronal development and synaptic plasticity to peripheral inflammation and pain. Here, we examined how differences in NMDAR subunit composition affect synaptic integration of two convergent inputs onto a pyramidal neuron. Specifically, we showed that the intracortical synapses likely containing the NR2B subunit are superior integrators compared with callosal synapses that do not contain this subunit. Thus, intracortical inputs are capable of generating significantly larger responses at higher frequencies (>40 Hz) compared with callosal inputs, thereby making them more efficient in bringing the neuron to spike-firing threshold. Furthermore, by contrasting the effects of ifenprodil, the subunit-specific antagonist for NR2B, with APV, the general purpose NMDAR blocker, we were able to confirm directly that pathway-specific differences in synaptic integration were not attributable to factors such as fiber recruitment, number of receptors, short-term presynaptic plasticity, or polysynaptic activation but rather by virtue of the differences in subunit composition of the NMDARs activated.
Although overexpression studies and investigations using knock-out animals have highlighted the critical role of NR2B (Tang et al., 1999; Lu et al., 2001; Clayton et al., 2002) and NR2A (Philpot et al., 2001) subunits in plasticity and memory formation in the hippocampus and the cortex, there has been a considerable debate in the literature regarding underlying mechanisms and the identity of the subunits involved. Our results with callosal and intracortical pathways provide a unique opportunity for a direct comparison of the integrative properties of synaptic NR2A- and NR2B-containing NMDARs. Based on differences in NMDAR subunit composition at these inputs, we predict that the intracortical pathway would be more favorable to plasticity than the callosal pathway. However, as observed in the barrel cortex (Stern et al., 2001), expression of NMDAR-mediated plasticity in the frontal cortex could also be mediated by changes in cortical-cortical connections and be regulated on a layer-specific or even synapse-specific basis within a given region. NMDAR subunit-specific plasticity is also regulated developmentally (for review, see Monyer et al., 1994; Barth and Malenka, 2001). However, maturational changes did not appear to affect the results described here, because similar changes were noted in all animals in the age group tested (P13-P21).
Coincident detection versus synaptic integration
It has been known for some time now that NMDARs play a major role in determining whether APs shunt EPSPs (Hausser et al., 2001). Thus, EPSPs with slow kinetics (i.e., NMDA) are shunted less than those with faster kinetics (i.e., AMPA) and, hence, are more effective at temporal summation. This feature also restricts the temporal window for integration in neurons that lack mechanisms to prevent shunting of EPSPs during rapid firing of APs. Thus, the slower NMDAR-dependent EPSPs evoked in the intracortical pathway will be less susceptible to shunting by APs and therefore more efficient at synaptic integration compared with the callosal pathway the NMDAR-mediated responses of which are kinetically much faster. In essence, the temporal windows for summation of callosal and intracortical synaptic inputs could be different, and AP-mediated shunting of EPSPs generated in these pathways may influence the way in which pyramidal neurons integrate these synaptic inputs.
Given that NMDARs at callosal inputs are poor integrators, are they then better coincident detectors? Kinetically fast EPSPs are usually efficient coincidence detectors but less effective synaptic integrators, whereas the opposite is true for slow EPSPs (König et al., 1996; Geiger et al., 1997; Maccaferri and Dingledine, 2002). Because callosal EPSPs, which are mediated by NMDARs likely containing the NR2A subunit, have faster kinetics than NR2B-mediated intracortical EPSPs, the possibility that the two inputs are processed differently by pyramidal neurons cannot be ruled out. Thus, neocortical pyramidal neurons could be considered as integrate-and-fire devices from the perspective of NMDAR-dependent local intracortical information processing, whereas they could operate as detectors of temporal coincidence of synaptic inputs and synchrony from the viewpoint of long-range information processing mediated by the callosum. Postsynaptic potentials are processed differently in the coincidence detection and temporal integration schemes, and these represent two fundamentally distinct modes of information processing dynamics within complex neural networks (Shadlen and Newsome, 1994; König et al., 1996). The novelty of our observations lies not so much in the fact that NMDARs can mediate these differences by expressing different subunits but rather in the possibility that both modes of information processing can be simultaneously manifest within individual neocortical pyramidal neurons.
Footnotes
This work was supported by an American Epilepsy Society research training fellowship to S.S.K and by grants from the National Institutes of Health. We are indebted to Drs. Daniel T. Monaghan (University of Nebraska, Omaha, NE) and David E. Jane (University of Bristol, Bristol, UK) for their gift of the subtype-selective NMDA receptor antagonist PPDA.
Correspondence should be addressed to Dr. John R. Huguenard at the above address. E-mail: john.huguenard@stanford.edu.
S. S. Kumar's present address: Department of Comparative Medicine, Stanford University Medical Center, Stanford, CA 94305-5342.
Copyright © 2003 Society for Neuroscience 0270-6474/03/2310074-10$15.00/0
References
- Andrasfalvy BK, Magee JC ( 2001) Distance-dependent increase in AMPA receptor number in the dendrites of adult hippocampal CA1 pyramidal neurons. J Neurosci 21: 9151-9159. [DOI] [PMC free article] [PubMed] [Google Scholar]
- Barria A, Malinow R ( 2002) Subunit-specific NMDA receptor trafficking to synapses. Neuron 35: 345-353. [DOI] [PubMed] [Google Scholar]
- Barth AL, Malenka RC ( 2001) NMDAR EPSC kinetics do not regulate the critical period for LTP at thalamocortical synapses. Nat Neurosci 4: 235-236. [DOI] [PubMed] [Google Scholar]
- Billups D, Liu YB, Birnstiel S, Slater NT ( 2002) NMDA receptor-mediated currents in rat cerebellar granule and unipolar brush cells. J Neurophysiol 87: 1948-1959. [DOI] [PubMed] [Google Scholar]
- Braitenberg V, Schüz A ( 1991) Anatomy of the cortex: statistics and geometry. Berlin: Springer-Verlag.
- Burkhalter A, Charles V ( 1990) Organization of local axon collaterals of efferent projection neurons in rat visual cortex. J Comp Neurol 302: 920-934. [DOI] [PubMed] [Google Scholar]
- Chen L, Huang LY ( 1992) Protein kinase C reduces Mg2+ block of NMDA-receptor channels as a mechanism of modulation. Nature 356: 521-523. [DOI] [PubMed] [Google Scholar]
- Clark BA, Cull-Candy SG ( 2002) Activity-dependent recruitment of extrasynaptic NMDA receptor activation at an AMPA receptor-only synapse. J Neurosci 22: 4428-4436. [DOI] [PMC free article] [PubMed] [Google Scholar]
- Clayton DA, Mesches MH, Alvarez E, Bickford PC, Browning MD ( 2002) A hippocampal NR2B deficit can mimic age-related changes in long-term potentiation and spatial learning in the Fischer 344 rat. J Neurosci 22: 3628-3637. [DOI] [PMC free article] [PubMed] [Google Scholar]
- Connors BW, Amitai Y ( 1995) Functions of local circuits in neocortex: synchrony and laminae. In: The cortical neuron (Gutnick MJ, Mody I, eds), pp 123-155. New York: Oxford UP.
- Conti F, Manzoni T ( 1994) The neurotransmitters and postsynaptic actions of callosally projecting neurons. Behav Brain Res 64: 37-53. [DOI] [PubMed] [Google Scholar]
- Cull-Candy SG, Brickley SG, Misra C, Feldmeyer D, Momiyama A, Farrant M ( 1998) NMDA receptor diversity in the cerebellum: identification of subunits contributing to functional receptors. Neuropharmacology 37: 1369-1380. [DOI] [PubMed] [Google Scholar]
- Cull-Candy S, Brickley S, Farrant M ( 2001) NMDA receptor subunits: diversity, development and disease. Curr Opin Neurobiol 11: 327-335. [DOI] [PubMed] [Google Scholar]
- Das S, Sasaki YF, Rothe T, Premkumar LS, Takasu M, Crandall JE, Dikkes P, Conner DA, Rayudu PV, Cheung W, Chen HS, Lipton SA, Nakanishi N ( 1998) Increased NMDA current and spine density in mice lacking the NMDA receptor subunit NR3A. Nature 393: 377-381. [DOI] [PubMed] [Google Scholar]
- Dobrunz LE, Stevens CF ( 1997) Heterogeneity of release probability, facilitation and depletion. Neuron 18: 995-1008. [DOI] [PubMed] [Google Scholar]
- Fleidervish IA, Binshtok AM, Gutnick MJ ( 1998) Functionally distinct NMDA receptors mediate horizontal connectivity within layer 4 of mouse barrel cortex. Neuron 21: 1055-1065. [DOI] [PubMed] [Google Scholar]
- Flint AC, Maisch US, Weishaupt JH, Kriegstein AR, Monyer H ( 1997) NR2A subunit expression shortens NMDA receptor synaptic currents in developing neocortex. J Neurosci 17: 2469-2476. [DOI] [PMC free article] [PubMed] [Google Scholar]
- Geiger JR, Lubke J, Roth A, Frotscher M, Jonas P ( 1997) Submillisecond AMPA receptor-mediated signaling at a principal neuron-interneuron synapse. Neuron 18: 1009-1023. [DOI] [PubMed] [Google Scholar]
- Gil Z, Connors BW, Amitai Y ( 1999) Efficacy of thalamocortical and intracortical synaptic connections: quanta, innervation, and reliability. Neuron 23: 385-397. [DOI] [PubMed] [Google Scholar]
- Guo H, Huang LY ( 2001) Alteration in the voltage dependence of NMDA receptor channels in rat dorsal horn neurones following peripheral inflammation. J Physiol (Lond) 537: 115-123. [DOI] [PMC free article] [PubMed] [Google Scholar]
- Hass K ( 2001) Directing AMPA receptor traffic. Trends Neurosci 24: 137. [DOI] [PubMed] [Google Scholar]
- Hausser M, Major G, Stuart GJ ( 2001) Differential shunting of EPSPs by action potentials. Science 291: 138-141. [DOI] [PubMed] [Google Scholar]
- Hestrin S ( 1992) Developmental regulation of NMDA receptor-mediated synaptic currents at a central synapse. Nature 357: 686-689. [DOI] [PubMed] [Google Scholar]
- Hestrin S, Sah P, Nicoll RA ( 1990) Mechanisms generating the time course of dual component excitatory synaptic currents recorded in hippocampal slices. Neuron 5: 247-253. [DOI] [PubMed] [Google Scholar]
- Hrabetova S, Serrano P, Blace N, Tse HW, Skifter DA, Jane DE, Monaghan DT, Sacktor TC ( 2000) Distinct NMDA receptor subpopulations contribute to long-term potentiation and long-term depression induction. J Neurosci 20: RC81(1-6). [DOI] [PMC free article] [PubMed] [Google Scholar]
- Ito I, Futai K, Katagiri H, Watanabe M, Sakimura K, Mishina M, Sugiyama H ( 1997) Synapse-selective impairment of NMDA receptor functions in mice lacking NMDA receptor epsilon 1 or epsilon 2 subunit. J Physiol (Lond) 500: 401-408. [DOI] [PMC free article] [PubMed] [Google Scholar]
- Johnson RR, Jiang X, Burkhalter A ( 1996) Regional and laminar differences in synaptic localization of NMDA receptor subunit NR1 splice variants in rat visual cortex and hippocampus. J Comp Neurol 368: 335-355. [DOI] [PubMed] [Google Scholar]
- Joshi I, Wang LY ( 2002) Developmental profiles of glutamate receptors and synaptic transmission at a single synapse in the mouse auditory brainstem. J Physiol (Lond) 540: 861-873. [DOI] [PMC free article] [PubMed] [Google Scholar]
- König P, Engel AK, Singer W ( 1996) Integrator or coincidence detector? The role of cortical neuron revisited. Trends Neurosci 19: 130-137. [DOI] [PubMed] [Google Scholar]
- Kumar SS, Huguenard JR ( 2001) Properties of excitatory synaptic connections mediated by the corpus callosum in the developing rat neocortex. J. Neurophysiol 86: 2973-2985. [DOI] [PubMed] [Google Scholar]
- Kumar SS, Bacci A, Kharazia V, Huguenard JR ( 2002) A developmental switch of AMPA receptor subunits in neocortical pyramidal neurons. J Neurosci 22: 3005-3015. [DOI] [PMC free article] [PubMed] [Google Scholar]
- Lei S, McBain CJ ( 2002) Distinct NMDA receptors provide differential modes of transmission at mossy fiber-interneuron synapses. Neuron 33: 921-933. [DOI] [PubMed] [Google Scholar]
- Lu HC, Gonzalez E, Crair MC ( 2001) Barrel cortex critical period plasticity is independent of changes in NMDA receptor subunit composition. Neuron 32: 619-634. [DOI] [PubMed] [Google Scholar]
- Luscher C, Xia H, Beattie EC, Carroll RC, von Zastrow M, Malenka RC, Nicoll RA ( 1999) Role of AMPA receptor cycling in synaptic transmission and plasticity. Neuron 24: 649-658. [DOI] [PubMed] [Google Scholar]
- Maccaferri G, Dingledine R ( 2002) Control of feedforward dendriti inhibition by NMDA receptor dependent spike timing in hippocampal interneurons. J Neurosci 22: 5462-5472. [DOI] [PMC free article] [PubMed] [Google Scholar]
- Mayer ML, Westbrook GL ( 1987) Permeation and block of N-methyl-d-aspartic acid receptor channels by divalent cations in mouse cultured central neurones. J Physiol (Lond) 394: 501-527. [DOI] [PMC free article] [PubMed] [Google Scholar]
- Mayer ML, Westbrook GL, Guthrie PB ( 1984) Voltage-dependent block by Mg2+ of NMDA responses in spinal cord neurones. Nature 309: 261-263. [DOI] [PubMed] [Google Scholar]
- Mayer ML, Vyklicky Jr L, Westbrook GL ( 1989) Modulation of excitatory amino acid receptors by group IIB metal cations in cultured mouse hippocampal neurones. J Physiol (Lond) 415: 329-350. [DOI] [PMC free article] [PubMed] [Google Scholar]
- Misra C, Brickley SG, Farrant M, Cull-Candy SG ( 2000) Identification of subunits contributing to synaptic and extrasynaptic NMDA receptors in Golgi cells of the rat cerebellum. J Physiol (Lond) 524: 147-162. [DOI] [PMC free article] [PubMed] [Google Scholar]
- Momiyama A ( 2000) Distinct synaptic and extrasynaptic NMDA receptors identified in dorsal horn neurones of the adult rat spinal cord. J Physiol (Lond) 523: 621-628. [DOI] [PMC free article] [PubMed] [Google Scholar]
- Monyer H, Burnashev N, Laurie DJ, Sakmann B, Seeburg PH ( 1994) Developmental and regional expression in the rat brain and functional properties of four NMDA receptors. Neuron 12: 529-540. [DOI] [PubMed] [Google Scholar]
- Nowak L, Bregestovski P, Ascher P, Herbet A, Prochiantz A ( 1984) Magnesium gates glutamate-activated channels in mouse central neurones. Nature 307: 462-465. [DOI] [PubMed] [Google Scholar]
- Otmakhova NA, Otmakhov N, Lisman JE ( 2002) Pathway-specific properties of AMPA and NMDA-mediated transmission in CA1 hippocampal pyramidal cells. J Neurosci 22: 1199-1207. [DOI] [PMC free article] [PubMed] [Google Scholar]
- Pandya DN, Seltzer B ( 1986) The topography of commissural fibers. In: Two hemispheres—one brain: functions of the corpus callosum (Lepore F, Ptito M, Jasper HH, eds), pp 47-73. New York: Liss.
- Paoletti P, Ascher P, Neyton J ( 1997) High-affinity zinc inhibition of NMDA NR1-NR2A receptors. J Neurosci 17: 5711-5725. [DOI] [PMC free article] [PubMed] [Google Scholar]
- Paxinos G, Watson C ( 1986) The rat brain in stereotaxic coordinates, Ed 2. San Diego: Academic.
- Perez-Otano I, Schulteis CT, Contractor A, Lipton SA, Trimmer JS, Sucher NJ, Heinemann SF ( 2001) Assembly with the NR1 subunit is required for surface expression of NR3A-containing NMDA receptors. J Neurosci 21: 1228-1237. [DOI] [PMC free article] [PubMed] [Google Scholar]
- Philpot BD, Weisberg MP, Ramos MS, Sawtell NB, Tang YP, Tsien JZ, Bear MF ( 2001) Effect of transgenic overexpression of NR2B on NMDA receptor function and synaptic plasticity in visual cortex. Neuropharmacology 41: 762-770. [DOI] [PubMed] [Google Scholar]
- Pitzer KS, Mayorga G ( 1973) Thermodynamics of electrolytes. II. Activity and osmotic coefficients for strong electrolytes with one or both ions univalent. J Phys Chem 77: 2300-2308. [Google Scholar]
- Shadlen MN, Newsome WT ( 1994) Noise, neural codes and cortical organization. Curr Opin Neurobiol 4: 569-579. [DOI] [PubMed] [Google Scholar]
- Sheng M ( 2001) Molecular organization of the postsynaptic specialization. Proc Natl Acad Sci USA 98: 7058-7061. [DOI] [PMC free article] [PubMed] [Google Scholar]
- Stern EA, Maravall M, Svoboda K ( 2001) Rapid development and plasticity of layer 2/3 maps in rat barrel cortex in vivo Neuron 31: 305-315. [DOI] [PubMed] [Google Scholar]
- Szinyei C, Stork O, Pape HC ( 2003) Contribution of NR2B subunits to synaptic transmission in amygdaloid interneurons. J Neurosci 23: 2549-2556. [DOI] [PMC free article] [PubMed] [Google Scholar]
- Tang YP, Shimizu E, Dube GR, Rampon C, Kerchner GA, Zhuo M, Liu G, Tsien JZ ( 1999) Genetic enhancement of learning and memory in mice. Nature 401: 63-69. [DOI] [PubMed] [Google Scholar]
- Toth K, McBain CJ ( 1998) Afferent-specific innervation of two distinct AMPA receptor subtypes on single hippocampal interneurons. Nat Neurosci 1: 572-578. [DOI] [PubMed] [Google Scholar]
- Toth K, McBain CJ ( 2000) Target-specific expression of pre- and postsynaptic mechanisms. J Physiol (Lond) 525: 41-51. [DOI] [PMC free article] [PubMed] [Google Scholar]
- Tovar KR, Westbrook GL ( 1999) The incorporation of NMDA receptors with a distinct subunit composition at nascent hippocampal synapses in vitro. J Neurosci 19: 4180-4188. [DOI] [PMC free article] [PubMed] [Google Scholar]
- Tovar KR, Sprouffske K, Westbrook GL ( 2000) Fast NMDA receptor-mediated synaptic currents in neurons from mice lacking the ϵ2 (NR2B) subunit. J Neurophysiol 83: 616-620. [DOI] [PubMed] [Google Scholar]
- Vicini S, Wang JF, Li JH, Zhu WJ, Wang YH, Luo JH, Wolfe BB, Grayson DR ( 1998) Functional and pharmacological differences between recombinant N-methyl-d-aspartate receptors. J Neurophysiol 79: 555-566. [DOI] [PubMed] [Google Scholar]
- Walker HC, Lawrence JJ, McBain CJ ( 2002) Activation of kinetically distinct synaptic conductances on inhibitory interneurons by electrotonically overlapping afferents. Neuron 35: 161-171. [DOI] [PubMed] [Google Scholar]
- Williams K ( 1993) Ifenprodil discriminates subtypes of the N-methyl-d-aspartate receptor: selectivity and mechanisms at recombinant heteromeric receptors. Mol Pharmacol 44: 851-859. [PubMed] [Google Scholar]
- Zhu Y, Auerbach A ( 2001) K(+) occupancy of the N-methyl-d-aspartate receptor channel probed by Mg(2+) block. J Gen Physiol 117: 287-298. [DOI] [PMC free article] [PubMed] [Google Scholar]