

Abstract
Many bitter stimuli are believed to bind to specific G-protein-coupled membrane receptors on taste cells. Despite the compelling evidence for its pivotal role in bitter taste sensation, a direct involvement of the G-protein subunit α-gustducin in bitter taste transduction in taste cells has not been demonstrated in situ at the cellular level. We recorded activation of taste cells by bitter stimuli using Ca2+ imaging in lingual slices and examinedα-gustducin immunoreactivity in the same cells. In mice vallate papillae, many, but not all, bitter-responsive cells expressed α-gustducin. In agreement with this correlation, the incidence of cells responding to bitter stimuli was reduced by 70% in mutant mice lacking α-gustducin. Nevertheless, some taste cells lacking α-gustducin responded to bitter stimuli, suggesting that other G-protein α subunits are involved. We found that the G-protein α subunit Gαi2 is present in most bitter-responsive cells and thus may also play a role in bitter taste transduction. The reduced behavioral sensitivity to bitter stimuli in α-gustducin knock-out mice thus appears to be the consequence of a reduced number of bitter-activated taste cells, as well as reduced sensitivity.
Keywords: taste bud, bitter, chemical senses, sensory coding, G-protein, tongue, transduction
Introduction
Detection of many bitter stimuli is initiated by the interaction of chemical compounds with G-protein-coupled receptors in the apical membranes of taste receptor cells. A large family of G-protein-coupled receptors, named T2Rs in humans and T2rs in mice, expressed in taste cells has been identified (Adler et al., 2000; Matsunami et al., 2000). T2Rs map to regions of human and mouse chromosomes implicated in sensitivity to various bitter compounds (Adler et al., 2000; Matsunami et al., 2000). One murine T2r receptor (mT2r5), when expressed in heterologous cells, responded to the bitter stimulus cycloheximide at a concentration comparable with the murine threshold for aversion (Chandrashekar et al., 2000). In addition to bitter-sensitive taste receptors, several G-protein subunits (e.g., α-gustducin, rod α-transducin, Gαi2, Gβ3, and Gγ13) and effector enzymes (e.g., phospholipase C β2 and adenylyl cyclase) have now been detected in taste cells. Biochemical studies have implicated a number of these proteins in second-messenger responses to bitter compounds, but conclusively showing that any of theses proteins is involved in bitter taste transduction requires functional validation in vivo.
There is compelling evidence that the G-protein subunit α-gustducin plays a role in bitter taste sensation. In vitro biochemical assays and in vivo analysis of α-gustducin knock-out mice have shown that α-gustducin is involved in bitter taste detection (Wong et al., 1996; Ming et al., 1998). α-Gustducin knock-out mice have reduced aversion to bitter compounds (Wong et al., 1996) and reduced responses to bitter tastants in gustatory nerves (Wong et al., 1996). T2R receptors are only expressed in a subset of α-gustducin-positive taste receptor cells (Adler et al., 2000), and individual T2R receptors couple selectively to α-gustducin (Chandrashekar et al., 2000).
However, despite the evidence for a pivotal role in bitter taste sensation, the involvement of α-gustducin in bitter detection has not been studied at the cellular level in taste buds. In this study, we characterized responses of taste cells to bitter stimuli using Ca2+ imaging (Caicedo et al., 2000; Caicedo and Roper, 2001). Responses were then correlated with the immunohistochemical expression of α-gustducin in the same taste cells. We found that many, but not all, bitter-sensitive taste cells expressed α-gustducin. In addition, we examined Ca2+ responses in taste cells from α-gustducin knock-out mice. In knock-out mice, the incidence of bitter-responsive cells was reduced by >70%. These results suggest that the decreased sensitivity to bitter compounds in α-gustducin knock-out mice is the result of a reduced number of bitter-activated taste cells and that there is a significant contribution of non-gustducin, non-T2R-mediated transduction in bitter taste.
Materials and Methods
All experimental protocols were approved by the University of Miami Care and Use Committee, and procedures have been described in detail previously (Caicedo et al., 2000). Mice (41 DBA/2J and 11 C57BL/6B mice, ∼8 weeks old) were killed in a closed chamber containing CO2, followed by cervical dislocation. Seven α-gustducin-deficient mice and six of their heterozygous littermates (Wong et al., 1996) were also included in this study.
Tongues were removed and immersed in cold Tyrode's solution [in mm: 130 NaCl, 5 KCl, 8 CaCl2, 1 MgCl2, 10 HEPES, 10 glucose, 10 Na-pyruvate, and 5 NaHCO3, pH 7.4 (300–310 mOsm)]. Calcium green 1 dextran (CaGD; molecular weight, 3000; Kd of 259 nm; Molecular Probes, Eugene, OR) was injected iontophoretically (1 mm in H2O; –3.5 μA; 10 min) through a glass micropipette (40 μm tip) into the vallate papillae. Next, the tongues were sliced (100–150 μm) on a vibroslicer (Campden Instruments, Leicester, UK). CaGD-loaded taste cells in tongue slices were excited at 488 nm using an argon laser attached to an Olympus Optical (Melville, NY) Fluoview scanning confocal microscope. Confocal images were collected, and changes in CaGD fluorescence over time were then analyzed offline using Fluoview software (Olympus Optical). Solutions bathing the slices were maintained at 30°C.
With our technique, taste cells are loaded with CaGD at the taste pore. Thus, it is likely that we loaded CaGD into and recorded selectively from taste cells that extend their apical processes into the taste pore. By definition, these cells represent mature taste receptor cells (Lindemann, 1996).
We measured the mean intensity of CaGD fluorescence in cell bodies of individual taste cells at 2.5 sec intervals. We expressed the fluorometric signals as relative fluorescence change: ΔF/F = (F – F0)/F0. Using ΔF/F corrects for variations in baseline fluorescence, cell thickness, total dye concentration, and illumination (Helmchen, 2000). We did not measure responses from cells with extreme ranges of resting fluorescence (F0), either near-saturating or threshold levels for the photodetector. Peak ΔF/F constituted the response amplitude. Our criteria for accepting Ca 2+ responses included (1) that responses could be repeated at least once and (2) that the peak ΔF/F was twice the baseline ΔF/F fluctuation.
The setup for focal apical stimulation at the taste pore was adapted from Stevens et al. (2001). We used glass micropipettes (tip diameter of 5 μm) filled with different chemical stimuli. Stimuli were ejected with pressure (Picospritzer; General Valve, Fairfield, NJ). The bathing solution superfused the preparation countercurrent to the stimulus such that stimulation was limited to taste bud pores and to the apical chemosensitive tips of taste receptor cells.
All stimulus solutions contained 2 μm fluorescein or 100 μm Lucifer yellow (for citric acid) to monitor stimulus application, duration, and concentration. Serial dilutions showed that the fluorescence intensity of the stimulus solution was linearly related to the stimulus concentration. To estimate stimulus concentrations applied to the taste cells during the experiment, we measured the fluorescence intensity of the stimulus solution at the taste pore using the calibrations established by the aforementioned procedure. Fluorescence was calibrated for all stimulus solutions before each experiment. We measured concentration–response relationships by varying the quantity of chemical stimulus released from the pipette.
With focal apical stimulation, we were able to stimulate taste cells with tastant concentrations that elicit behavioral responses in mice. For convenience and simplicity, we used the human psychophysical characterization “bitter” to describe the taste stimuli that are aversive to mice. The stimuli were cycloheximide, quinine sulfate (quinine), and denatonium benzoate (denatonium). We used citric acid as a control stimulus. Stimuli were dissolved in Tyrode's solution. Stimulus concentrations in the micropipette were as follows: cycloheximide, 100 μm; quinine, 5 mm; denatonium, 5 mm; and citric acid, 50 mm. The stimulus concentration at the taste pore was varied by changing the duration and intensity of the pressure pulse applied to the barrel of the pipette. Thus, we could apply a range of concentrations that spanned at least two orders of magnitude for each stimulus.
Lingual tissue slices from which we recorded Ca 2+ responses were processed for immunohistochemistry using antibodies for the G-protein subunits α-gustducin (rabbit polyclonal; Santa Cruz Biotechnology, Santa Cruz, CA), Gαi1–2 (rabbit polyclonal; Biomol, Plymouth Meeting, PA), or Gαi2 (mouse monoclonal; Santa Cruz Biotechnology). Tissue was fixed for 30–60 min in 4% paraformaldehyde in PBS and cryoprotected in 30% sucrose. To improve tissue penetration of the antibodies, we froze and thawed the slices three times. Slices were then rinsed three times in PBS and incubated for 2 hr in PBS containing 0.3% Triton X-100, 1% goat serum, and 3% bovine serum albumin. Slices were incubated in primary antibodies (1:1000) for ≥48 hr at 4°C. Thereafter, slices were washed three times in PBS, incubated for ≥4 hr in Alexa Fluor 568- or Alexa Fluor 647-conjugated secondary antibodies (1:500; Molecular Probes), and then washed again three times in PBS. We used tyramide signal amplification methods for immunohistochemistry (PerkinElmer Life Sciences, Boston MA) (Hunyady et al., 1996).
To examine colocalization of the immunohistochemical signal and CaGD labeling, we imaged slices on the laser scanning confocal microscope using krypton and argon lasers and photomultiplier tube emission filters for CaGD and Alexa Fluor 568. The dual-fluorescence images were matched with those obtained during the Ca 2+ imaging recordings from the living tissue to relocate specific cells (movies 1–3; available at www.jneurosci.org). We used cells that had retained CaGD fluorescence as well as slice contours as guidance to relocate bitter-responsive cells. In some cases, however, shrinkage of the slices attributable to fixation precluded further examination. Data were only included in our analyses when the match between immunostained images and Ca 2+ imaging images was unambiguous. We selected data based on the following criteria: (1) taste cells had an identifiable cell body, (2) background fluorescence was low to be able to discern cells, (3) overlap between CaGD labeling (as observed during the calcium imaging) and immunostaining was >50% of the cell, and (4) immunostaining was homogeneous in the taste bud (see below).
α-Gustducin immunostaining in our experiments resembled immunostaining published by others for this G-protein subunit (Boughter et al., 1997). To avoid possible false negative immunostaining results (e.g., failure to immunostain attributable to poor penetration of antibodies into the tissue slices), we analyzed data only from taste buds that had strong immunostaining in several cells throughout the taste bud.
Results
Cycloheximide, quinine, and denatonium evoked concentration-dependent increases in intracellular Ca2+ in mouse taste cells. Ca2+ responses elicited by these stimuli were rapid and transient (Fig. 1), as reported previously for rats (Caicedo and Roper, 2001). The different bitter stimuli had characteristic activation threshold concentrations (Fig. 1). Responses to cycloheximide focally applied onto the apical pore of taste buds were elicited at concentrations as low as 8 μm (Figs. 1, 2). Quinine and denatonium were less potent stimuli: their activation thresholds were ∼300 and ∼550 μm, respectively. These concentrations are consistent with taste responses: response thresholds for all three stimuli were similar to the behavioral thresholds in C57BL/6B mice (8 vs 0.1–8 μm for cycloheximide, 300 vs 100–400μm for quinine, and 550 vs 500μm for denatonium) (Lush, 1984) (J. Glendinning, personal communication). C57BL/6B mice are less sensitive to cycloheximide than DBA/2 mice in behavioral tests (Lush and Holland, 1988). Ca2+ responses to cycloheximide in taste cells from DBA/2 mice were shifted to lower concentrations compared with C57BL/6B mice (Fig. 2). Because the concentration–response relationships for Ca2+ responses in taste cells resemble those in behavioral tests, we conclude that Ca2+ transients elicited by bitter stimuli represent taste responses.
Figure 1.

Ca 2+ responses elicited by the bitter stimuli cycloheximide (1–100 μm; A), quinine (10–5000μm; B), and denatonium (10–3000μm; C) were concentration dependent and had similar time courses. Shown are representative responses in three different taste cells at progressively higher stimulus concentrations. D, Concentration–response relationships show different potencies for cycloheximide (•), quinine (○), and denatonium (▴) in C57BL/6B mice. Data shown are means ± SEM of response amplitudes. Responses are from at least five cells. Detection thresholds for these compounds are similar to those found in behavioral studies in C57BL/6B mice (double-headed arrows above abscissa, cycloheximide ≪ quinine < denatonium) (for references, see Results).
Figure 2.

Ca 2+ responses vary with cycloheximide sensitivity of the mouse strain. Concentration–response relationships for cycloheximide in C57BL/6B (•) and DBA/2J (○) mice show that taste cells are more sensitive to cycloheximide in DBA/2J mice. The corresponding behavioral thresholds show the same sequence (double-headed arrows above abscissa) (for references, see Results). Values shown are amplitudes of responses at varying concentrations. Responses are from seven (C57BL/6B mice) and 17 (DBA/2J) cells.
To test whether functional responses correlated with the presence of α-gustducin, slices of mouse (DBA/2) tongues from which we recorded bitter responses were processed for immunohistochemistry. Recorded cells could be relocated because they retained CaGD fluorescence. CaGD and α-gustducin immunostaining could readily be colocalized (Fig. 3) (movies 1–3; available at www.jneurosci.org). In taste buds with a visible taste pore (i.e., midsaggital section), three to five taste cells were immunostained in 10-μm-thick optical sections (Fig. 3). With a taste bud diameter of ∼50 μm and a total taste cell population of ∼70 cells, we estimated that ∼30% of the taste cells in a taste bud were α-gustducin immunoreactive, which is consistent with previous reports (Boughter et al., 1997). Significantly, α-gustducin immunostaining was present in many but not all taste cells that responded to cycloheximide (Fig. 3) and quinine (data not shown). Nineteen of 42 of the cycloheximide-responsive cells and 5 of 10 of the quinine-responsive cells were α-gustducin immunoreactive. Thus, approximately one-half of the cells that were sensitive to bitter stimuli expressed α-gustducin. Conversely, not all α-gustducin-immunoreactive cells were bitter responsive (Fig. 3), consistent with a role for α-gustducin in other taste qualities (Wong et al., 1996; Ruiz-Avila et al., 2001). The amplitudes of the responses appeared somewhat smaller in cells lacking α-gustducin cycloheximide when stimulated with 50 μm cycloheximide, but the difference at this concentration was not significant (Fig. 4). Interestingly, at this concentration, there was also no difference in the response amplitudes between cells of α-gustducin knock-out mice and those of the heterozygous littermates expressing α-gustducin (see below). It is possible, however, that there were significant differences in the amplitudes at concentrations closer to the response thresholds, but this was not tested.
Figure 3.

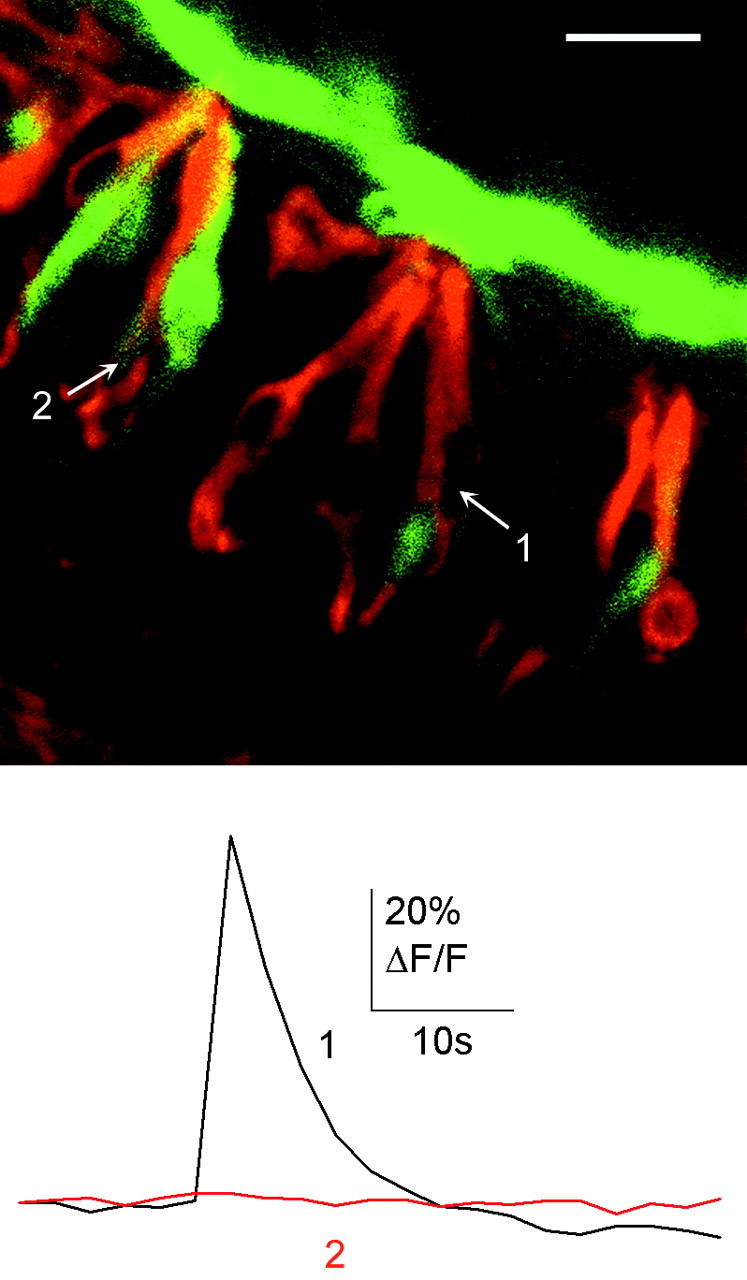
Bitter-sensitive cells express α-gustducin. A–C, α-Gustducin immunostaining (B) was present in many taste cells that were loaded with calcium green dextran (A). D, E, Stimulation with cycloheximide (100 μm) induced responses in two different cells in the same taste bud. Cells 1 and 2 responded to cycloheximide. Cell 1 was α-gustducin immunoreactive. Top image was acquired during calcium imaging (colors indicate pixel intensity mapping), and bottom image shows α-gustducin immunostaining (red) and calcium green dextran (green) after imaging. Scale bars: (in A) A–C, 20 μm; D, 10 μm.
Figure 4.

Responses to cycloheximide (50 μm, bath applied) were similar in α-gustducin-immunopositive (gust +) and -immunonegative (gust –) taste cells. A, Superimposed Ca 2+ transients from four and five cells, respectively. B, Amplitudes of cycloheximide-elicited Ca 2+ transients ofα-gustducin-immunoreactive taste cells (n = 13) were not significantly different from those of taste cell lacking α-gustducin (n = 11; Student's t test; p = 0.21).
We used α-gustducin knock-out mice to test whether the absence of α-gustducin affects responses of taste cells to bitter compounds. We conducted the experiments blindly. To verify the phenotypes for each experimental animal, we immunostained lingual slices after the recordings. As expected, α-gustducin immunostaining was absent in α-gustducin knock-out mice (Fig. 5). Ca2+ responses elicited by cycloheximide and quinine could be recorded in taste cells from α-gustducin knock-out mice (Fig. 6). However, somewhat higher concentrations of stimuli (∼8- to 10-fold higher) were needed to elicit Ca2+ responses to cycloheximide and quinine in taste cells from α-gustducin knock-out mice than in their heterozygous littermates (Fig. 6). The most striking finding was that the proportions of cells responding to cycloheximide, quinine, and denatonium were significantly reduced in α-gustducin knock-out mice (Student's t test; p < 0.01) (Fig. 7). The magnitude of the reduction was similar for each of the bitter stimuli (Fig. 7). Responses to citric acid were unaffected. The single order of magnitude reduction in sensitivity may not wholly explain the changes in behavioral sensitivity these knock-out mice manifest to bitter tastants (∼40- to 100-fold decrease in bitter sensitivity). Perhaps the combination of decreased sensitivity and decreased numbers of responding cells explains the in vivo differences.
Figure 5.

α-Gustducin immunostaining in mutant mice lacking α-gustducin (right, –/–) and their heterozygous littermates (left, +/–). Shown are sections (40 μm) of vallate papillae. Scale bar, 50 μm.
Figure 6.

Bitter responses in taste cells of mice lacking α-gustducin. A, C, Ca 2+ transients elicited by cycloheximide (1–100 μm; A) and quinine (10–5000 μm; C) in two different taste cells from mice lacking α-gustducin were similar to those of wild-type mice (see Fig. 1). B, D, Taste cells inα-gustducin knock-out mice were less sensitive than those of heterozygous littermates. Note that α-gustducin knock-out mice (○) did not have taste cells sensitive to low concentrations of cycloheximide (< 10 μm) and quinine (< 500 μm).
Figure 7.

The incidence of bitter-responsive cells was significantly reduced in α-gustducin knock-out mice (Student's t test; p < 0.01). Black bars, Heterozygous mice. White bars, Homozygous α-gustducin knock-out mice. Citric acid responses, which are not transduced throughα-gustducin, had the same incidence of occurrence in homozygous and heterozygous mice. Only taste buds with cells that showed responses to bitter stimuli and citric acid were included in this analysis. Results are from 12 taste buds from four homozygous mice and 10 taste buds from three heterozygous mice. Responses are from at least five taste cells. Proportion of cells = responsive cells/total cells tested. CX, Cycloheximide (100 μm); qui, quinine (5 mm); den, denatonium (5 mm); cit, citric acid (50 mm).
Because some bitter-responsive cells in wild-type mice did not express α-gustducin and because some taste cells in α-gustducin knock-out mice responded to bitter compounds, presumably G-protein α-subunits other than α-gustducin play a role in bitter taste transduction. These may include Gαi2, a G-protein α-subunit that is expressed in taste cells and whose distribution greatly overlaps with other proteins that have been implicated in bitter transduction (e.g., phospholipase C β2) (Asano-Miyoshi et al., 2000). Twelve of 19 cycloheximide-responsive cells were Gαi2 immunoreactive (Fig. 8). Expression of Gαi2 overlaps with that α-gustducin in taste buds (Asano-Miyoshi et al., 2000); however, more taste cells express Gαi2 than α-gustducin. We therefore tested whether bitter-sensitive cells express either Gαi2 or α-gustducin. We found that, from three slice preparations, six of seven cycloheximide-sensitive cells were immunoreactive for either Gαi2 (n = 3) or Gαi2 and α-gustducin (n = 3) (Fig. 9), suggesting that some cycloheximide-responsive receptors may couple to α-gustducin, others to Gαi2, perhaps some to both α subunits, and maybe some to other G-proteinα subunits. Given that T2Rs, including cycloheximide-responsive mT2r5, are only expressed in α-gustducin-positive cells (which are also Gαi2 positive), there must be T2r-independent cycloheximide detection mechanisms in the α-gustducin-negative cells.
Figure 8.
Bitter-sensitive cells expressed the G-proteinα subunit Gαi2. Gαi2 immunostaining was present in many taste cells that were loaded with calcium green dextran. Stimulation with cycloheximide (60 μm) induced a response in cell 1, which was Gαi2 immunoreactive. Cell 2 was Gαi2 immunoreactive but did not respond to cycloheximide. Scale bar, 20 μm.
Figure 9.

Most bitter-sensitive cells express the G-protein α subunit Gαi2orboth Gαi2and Gα-gustducin.A, Cells loaded with CaGD. Cells 1–3 respond to cycloheximide (80μm). B, Immunoreactivity to α-gustducin. C, Immunoreactivity to Gαi2. D, Immunostaining and CaGD superimposed. E, Responses to cycloheximide (80 μm). Cycloheximide-sensitive cells (cells 1–3) were immunoreactive for Gαi2 alone (cell 2) or both Gαi2 andα-gustducin (cell 3). Cell 1 was not immunoreactive for either G-protein subunit. Cell 4 was Gαi2 immunoreactive but did not respond to cycloheximide. Scale bar, 20 μm.
Discussion
Our results show, at the single cell level, that α-gustducin is required for bitter taste transduction in many but not all taste cells. By combining Ca2+ imaging and immunohistochemistry, we show that approximately one-half of the bitter-sensitive taste cells in mouse taste buds express α-gustducin and that α-gustducin knockout mice have significantly fewer bitter-sensitive taste cells. Bitter-responsive cells in α-gustducin knock-out mice are 8- to 10-fold less sensitive to bitter tastants. These findings suggest that the 40- to 100- fold reduction in bitter taste sensation in α-gustducin knock-out mice is the consequence of the smaller number of taste cells that respond to bitter stimuli and to the reduction in the sensitivity of individual cells.
Furthermore, our findings indicate that there are alternative signaling pathways that do not include α-gustducin or T2rs for transducing bitter stimuli. Indeed, it is known that other G-protein α subunits are expressed in α-gustducin-positive taste cells (Asano-Miyoshi et al., 2000), and α-gustducin-independent pathways may function in these cells (Ruiz-Avila et al., 2001). Whether α-gustducin-independent pathways mediate bitter responses in taste cells of the gustducin lineage is not known. Most of the bitter-sensitive taste cells expressed Gαi2 alone or together with α-gustducin. This suggests that Gαi2 may also play a role in bitter taste transduction, although strictly speaking our findings only show a correlation between bitter responses and Gαi2 expression, not causality. It is possible that Gαi2 couples to the same β and γ subunits as α-gustducin, namely β3 and γ13 (Huang et al., 1999). Release of β3 and γ13 during receptor activation is believed to increase IP3 via activation of phospholipase C β2, leading to Ca2+ release from intracellular stores. Recently, Zhang et al. (2003) showed that phospholipase C β2 is involved in bitter detection. α-Gustducin, Gαi2, and phospholipase C β2 are coexpressed in the same subset of taste cells (Asano-Miyoshi et al., 2000). That Ca2+ responses evoked by cycloheximide and quinine had similar temporal profiles in α-gustducin knock-out mice and wild-type mice supports the idea that α-gustducin and Gαi2 couple to a common second-messenger cascade for bitter taste. Nevertheless, bitter-responsive cells in α-gustducin knockout mice were somewhat less sensitive (∼8- to 10-fold) to bitter stimuli. This indicates that the alternative G-protein α subunits may couple less effectively to second messengers and/or that they may change receptor-binding properties.
A recent report by Ueda et al. (2003) describes a novel heterologous expression system for examining how T2R (bitter) taste receptors couple to G-proteins. The authors concluded that T2Rs can couple to G-proteins other than α-gustducin that are found in taste cells, including Gαi2, and thus that Gαi2 may be involved in bitter taste perception. That finding neatly complements the present data indicating that there are non-α-gustducin pathways for bitter taste in mouse taste cells.
Our results also confirm the importance of α-gustducin for bitter taste transduction. The involvement of α-gustducin in bitter taste has now been demonstrated at three levels of description: receptor cell responses, gustatory nerve recordings (Wong et al., 1996), and behavioral tests (Wong et al., 1996). With the use of α-gustducin knock-out mice, a strong causal link between the expression of α-gustducin in taste cells and bitter responsiveness has been established. Our results showing that much fewer taste cells respond to cycloheximide, quinine, or denatonium in the absence of α-gustducin indicate that, at least for responses to these bitter substances, there is a subpopulation of taste cells that requires α-gustducin for bitter taste transduction. In these cells, α-gustducin plays more than a modulatory role. That responses to bitter substances are not completely abolished in α-gustducin knock-out mice can be explained by activation of alternative G-protein α subunits and points at the complexity of transduction mechanisms present in taste buds.
Footnotes
This work was supported by National Institute on Deafness and Other Communication Disorders–National Institues of Health Grants DC04525-01 (A.C.), DC03155 (R.F.M.), and DC00374 (S.D.R.) and a research award from the Stanley Glaser Foundation (A.C.).
Correspondence should be addressed to Alejandro Caicedo, Department of Ophthalmology, University of Miami School of Medicine, 1638 NW Tenth Avenue, Miami, FL 33136. E-mail: acaicedo@chroma.med.miami.edu.
Copyright © 2003 Society for Neuroscience 0270-6474/03/239947-06$15.00/0
References
- Adler E, Hoon MA, Mueller KL, Chandrashekar J, Ryba NJ, Zuker CS ( 2000) A novel family of mammalian taste receptors. Cell 100: 693–702. [DOI] [PubMed] [Google Scholar]
- Asano-Miyoshi M, Abe K, Emori Y ( 2000) Co-expression of calcium signaling components in vertebrate taste bud cells. Neurosci Lett 283: 61–64. [DOI] [PubMed] [Google Scholar]
- Boughter Jr JD, Pumplin DW, Yu C, Christy RC, Smith DV ( 1997) Differential expression of α-gustducin in taste bud populations of the rat and hamster. J Neurosci 17: 2852–2858. [DOI] [PMC free article] [PubMed] [Google Scholar]
- Caicedo A, Roper SD ( 2001) Taste receptor cells that discriminate between bitter stimuli. Science 291: 1557–1560. [DOI] [PMC free article] [PubMed] [Google Scholar]
- Caicedo A, Jafri MS, Roper SD ( 2000) In situ Ca 2+ imaging reveals neurotransmitter receptors for glutamate in taste receptor cells. J Neurosci 20: 7978–7985. [DOI] [PMC free article] [PubMed] [Google Scholar]
- Chandrashekar J, Mueller KL, Hoon MA, Adler E, Feng L, Guo W, Zuker CS, Ryba NJ ( 2000) T2Rs function as bitter taste receptors. Cell 100: 703–711. [DOI] [PubMed] [Google Scholar]
- Helmchen F ( 2000) Calibration of fluorescent calcium indicators. In: Imaging neurons. A Laboratory Manual, Chap 32 (Yuste R, Lanni F, Konnerth A, eds). Cold Spring Harbor, NY: Cold Spring Harbor Laboratory. [DOI] [PubMed]
- Huang L, Shanker YG, Dubauskaite J, Zheng JZ, Yan W, Rosenzweig S, Spielman AI, Max M, Margolskee RF ( 1999) Ggamma13 colocalizes with gustducin in taste receptor cells and mediates IP3 responses to bitter denatonium. Nat Neurosci 2: 1055–1062. [DOI] [PubMed] [Google Scholar]
- Hunyady B, Krempels K, Harta G, Mezey E ( 1996) Immunohistochemical signal amplification by catalyzed reporter deposition and its application in double immunostaining. J Histochem Cytochem 44: 1353–1362. [DOI] [PubMed] [Google Scholar]
- Lindemann B ( 1996) Taste reception. Physiol Rev 76: 718–766. [DOI] [PubMed] [Google Scholar]
- Lush IE ( 1984) The genetics of tasting in mice. III. Quinine. Genet Res 44: 151–160. [DOI] [PubMed] [Google Scholar]
- Lush IE, Holland G ( 1988) The genetics of tasting in mice. V. Glycine and cycloheximide. Genet Res 52: 207–212. [DOI] [PubMed] [Google Scholar]
- Matsunami H, Montmayeur JP, Buck LB ( 2000) A family of candidate taste receptors in human and mouse. Nature 404: 552–553. [DOI] [PubMed] [Google Scholar]
- Ming D, Ruiz-Avila L, Margolskee RF ( 1998) Characterization and solubilization of bitter-responsive receptors that couple to gustducin. Proc Natl Acad Sci USA 95: 8933–8938. [DOI] [PMC free article] [PubMed] [Google Scholar]
- Ruiz-Avila L, Wong GT, Damak S, Margolskee RF ( 2001) Dominant loss of responsiveness to sweet and bitter compounds caused by a single mutation in α-gustducin. Proc Natl Acad Sci USA 98: 8868–8873. [DOI] [PMC free article] [PubMed] [Google Scholar]
- Stevens DR, Seifert R, Bufe B, Muller F, Kremmer E, Gauss R, Meyerhof W, Kaupp UB, Lindemann B ( 2001) Hyperpolarization-activated channels HCN1 and HCN4 mediate responses to sour stimuli. Nature 413: 631–635. [DOI] [PubMed] [Google Scholar]
- Ueda T, Ugawa S, Yamamura H, Imaizumi Y, Shimada S ( 2003) Functional interaction between T2R taste receptors and G-protein subunits expressed in taste receptor cells. J Neurosci 23: 7376–7380. [DOI] [PMC free article] [PubMed] [Google Scholar]
- Wong GT, Gannon KS, Margolskee RF ( 1996) Transduction of bitter and sweet by gustducin. Nature 381: 796–800. [DOI] [PubMed] [Google Scholar]
- Zhang Y, Hoon MA, Chandrashekar J, Mueller KL, Cook B, Wu D, Zuker CS, Ryba NJ ( 2003) Coding of sweet, bitter, and umami tastes: different receptor cells sharing similar signaling pathways. Cell 112: 293–301. [DOI] [PubMed] [Google Scholar]