

Abstract
The occurrence of cells that encode spatial location (place cells) or head direction (HD cells) in the rat limbic system suggests that these cell types are important for spatial navigation. We sought to determine whether place fields of hippocampal CA1 place cells would be altered in animals receiving lesions of brain areas containing HD cells. Rats received bilateral lesions of anterodorsal thalamic nuclei (ADN), postsubiculum (PoS), or sham lesions, before place cell recording. Although place cells from lesioned animals did not differ from controls on many place-field characteristics, such as place-field size and infield firing rate, the signal was significantly degraded with respect to measures of outfield firing rate, spatial coherence, and information content. Surprisingly, place cells from lesioned animals were more likely modulated by the directional heading of the animal. Rotation of the landmark cue showed that place fields from PoS-lesioned animals were not controlled by the cue and shifted unpredictably between sessions. Although fields from ADN-lesioned animals tended to have less landmark control than fields from control animals, this impairment was mild compared with cells recorded from PoS-lesioned animals. Removal of the prominent visual cue also led to instability of place-field representations in PoS-lesioned, but not ADN-lesioned, animals. Together, these findings suggest that an intact HD system is not necessary for the maintenance of place fields, but lesions of brain areas that convey the HD signal can degrade this signal, and lesions of the PoS might lead to perceptual or mnemonic deficits, leading to place-field instability between sessions.
Keywords: navigation, ideothetic, path integration, landmark, postsubiculum, anterodorsal thalamic nucleus, spatial orientation, rat
Introduction
Limbic system structures have been implicated in the control of navigational behavior. Animals with lesions of the hippocampus and related structures exhibit a variety of spatial deficits (O'Keefe and Nadel, 1978; Morris et al., 1982; Jarrard, 1993). Furthermore, the limbic system contains several types of cells that encode allocentric spatial information. Place cells, found primarily in the hippocampus, discharge when the animal is located at a particular location in a familiar environment (O'Keefe and Dostrovsky, 1971). Different place cells have different preferred locations (place fields), potentially allowing the activity from the overall population of place cells to form a representation of external space, or cognitive map, that the animal might use for navigation (O'Keefe and Nadel, 1978). Head direction (HD) cells, found primarily in the postsubiculum (PoS; dorsal presubiculum) (Taube et al., 1990a), anterior dorsal thalamus (Taube, 1995), and lateral mammillary nuclei (LMN) (Stackman and Taube, 1998), signal the directional heading of the animal within an environment (for review, see Taube, 1998; Sharp et al., 2001a). As in the preferred locations of place cells, individual HD cells are tuned to different preferred directions, and it is thought that the combined activity of the HD cell population accurately reflects the animal's perceived directional heading.
Place cells and HD cells share a number of characteristics. For example, when normally stable visual landmarks are rotated in the absence of the animal, place fields and preferred firing directions shift a similar amount when the animal is returned to the apparatus (O'Keefe and Conway, 1978; Muller and Kubie, 1987; Taube et al., 1990b). However, if visual cues are removed from the apparatus during a recording session, the spatial signals of both cell types are relatively stable for a period of time despite ongoing movement (Muller and Kubie, 1987; Quirk et al., 1990; Goodridge et al., 1998). In the absence of visual landmarks, it is thought that both place cells and HD cells maintain their stable spatial correlates through the use of movement-related (ideothetic) cues, such as vestibular, proprioceptive, and motor efferent copy, a process known as path integration (Mittelstaedt, 1983; Taube and Burton, 1995; McNaughton et al., 1996). Finally, when place cells and HD cells show unstable representations between recording sessions, the spatial signals from both cell types typically shift similar amounts (Knierim et al., 1995), supporting the idea that they are part of an interconnected navigational system.
Several theories have suggested that place cells use the signal from the HD system to establish and maintain place-field activity (McNaughton et al., 1996; Touretzky and Redish, 1996; Sharp, 1999). Given this possibility, one might expect alteration in place-field characteristics after lesions that disrupt the activity of HD cells. Goodridge and Taube (1997) found that lesions of the anterodorsal thalamic nuclei (ADN) eliminated HD cell activity in PoS, whereas lesions of PoS resulted in ADN HD cell activity that was less influenced by the prominent visual landmark in the recording apparatus. Given these findings, and the possibility that the HD signal is used by place cells to maintain a stable spatial correlate, lesions of ADN or PoS might potentially alter place-field activity. Here, we report the finding of intact, although degraded, place-field representations of hippocampal place cells after lesions of ADN or PoS.
Materials and Methods
Subjects and apparatus. Thirty-one female Long–Evans rats, 3–6 months of age, served as subjects. Free feeding weights ranged from 250 to 350 gm at the start of the study. Rats were singly housed in Plexiglas cages and maintained on a 12 hr light/dark cycle. Although water was available ad libitum, access to food was restricted as necessary to maintain body weights in the range of 85–90% of free feeding weights.
Before all surgical procedures, rats were trained to forage for food pellets randomly dropped onto the floor of a painted gray, wooden cylindrical enclosure (76 cm diameter; 51 cm high) that also served as the test enclosure during recording sessions. The inside of the enclosure was featureless, except for a white card occupying ∼100° of arc attached to the wall. The floor of the enclosure consisted of gray paper that could be changed as necessary between sessions. A black curtain (2.5 m diameter) completely enclosed the enclosure from floor to ceiling, effectively eliminating external visual landmarks. Four or eight lights arranged symmetrically and mounted on the ceiling provided illumination.
During recording sessions, the position and directional orientation of the rat was monitored using an automated tracking system (Ebtronics, Elmont, NY). A color video camera mounted on the ceiling enabled the detection of a red light-emitting diode (LED) and a green LED secured ∼10 cm apart above the snout and back of the animal, respectively. The video tracking hardware provided X and Y coordinates of each LED to a spatial resolution of 3.8 mm square in the x-y plane of the cylinder floor. The animal's location in the cylinder was defined as the point from the red LED that was 0.25 of the distance between the two LEDs, a position that approximately corresponded to the center of the animal's head. The head direction of the animal was determined by the relative position of the red and green LEDs.
Surgical procedures. All animals received implantation of the recording electrodes using standard surgical procedures. The recording electrodes were constructed using methods described by Kubie (1984). Briefly, each electrode array consisted of a bundle of 10 25-μm-diameter wires that were insulated, except at the tip. The wires were threaded through a stainless steel cannula that was moveable in the dorsoventral direction after being fixed to the skull using dental acrylic. Animals were anesthetized with intraperitoneal Nembutal (50 mg/kg) and also given atropine sulfate (2.5 mg) to prevent respiratory distress. After exposure of the skull, a hole was drilled and the electrode was implanted just dorsal to the CA1 region of the right hippocampus based on coordinates (3.8 mm posterior to bregma, 2.7 mm lateral to bregma, and 1.5 mm below the cortical surface) provided by Paxinos and Watson (1998).
In addition to electrode implantation, some animals also received bilateral excitotoxic lesions of the ADN (n = 9) or PoS (n = 8). The anterior thalamic nuclei consist of three distinct nuclei: anterodorsal (ADN), anteroventral, and anteromedial (including the interanterior medial). The anteroventral nucleus has connectivity similar to that seen for the ADN (van Groen and Wyss, 1995), but both the ADN and anteroventral nuclei have different connections compared with the anteromedial nucleus (van Groen et al., 1999). However, because HD cells have been identified primarily in the ADN (Taube, 1995) and because lesions confined to the ADN abolish direction-specific activity in the PoS (Goodridge and Taube, 1997), our intentions were only to lesion the ADN. The lesions were produced by delivering the excitotoxin through either a Hamilton (Reno, NV) syringe or a calibrated glass micropipette mounted on a Kopf (Tujunga, CA) stereotaxic manipulator. Stereotaxic coordinates for these lesions are shown in Table 1. ADN lesions were produced by injecting two 0.15 μl injections of 100 mm NMDA (Sigma, St. Louis, MO) into each hemisphere. PoS lesions were produced by injecting four (n = 3) or five (n = 5) 0.1–0.15 μl injections of ibotenic acid (10 mg/ml; Bioresearch Technologies, San Rafael, CA) into each hemisphere. The remaining animals (n = 14) received electrode implantation, but no excitotoxic lesions, and served as controls.
Table 1.
Injection coordinates for ADN and PoS lesions
|
Posterior |
Lateral |
Ventral |
|---|---|---|
| ADN lesions (2 injection sites) | ||
| 1.1 | 1.4 | 5.0 |
| 1.5 | 1.4 | 5.0 |
| PoS lesions (4 injection sites) | ||
| 6.7 | 2.5 | 2.6 |
| 7.3 | 3.5 | 3.5 |
| 7.6 | 3.4 | 3.0 |
| 8.0 | 3.3 | 2.4 |
| PoS lesions (5 injection sites) | ||
| 6.7 | 2.7 | 2.6 |
| 7.3 | 2.8 | 3.6 |
| 7.3 | 3.5 | 2.4 |
| 7.6 | 3.4 | 3.0 |
| 8.0
|
3.3
|
2.4
|
Posterior and lateral values are shown in millimeters with respect to bregma; ventral values are in millimeters with respect to the cortical surface. All injections were bilateral.
Recording procedures. To detect single-unit activity, electrical signals recorded from the brain were passed through a field-effect transistor in a source–follower configuration. Signals were amplified by a factor of 10,000–50,000 (Grass Instruments, West Warwick, RI), bandpass filtered (300–10,000 Hz, 3 dB/octave), and sent through a dual-window discriminator (BAK Electronics, Mt. Airy, MD) for spike discrimination. Screening for place cells involved examining the electrical signal on each of the 10 implanted wires while the animal foraged in the recording cylinder. If no location-specific activity was detected, the cannula containing the wires was advanced 25–50 μm, the animal was returned to its home cage, and no additional screening for cellular activity occurred for at least 6 hr. If a cell displaying location-specific firing was isolated, the animal was removed from the cylinder and the apparatus was prepared for recording. Thus, cells in the present study were selected for additional analysis only if they contained a place field and not if they contained a complex spike waveform (Ranck, 1973; Fox and Ranck, 1981). This procedure may have biased the selection of cells but, as described in Results, we encountered a similar percentage of place cells during recordings from control and lesion groups using this procedure.
Experimental manipulations. Place cell activity was monitored in the recording cylinder over one or more 16 min sessions, during which the rat chased food pellets dropped randomly from above. In some cases, cells were recorded in more than one session to determine the stability of place fields between sessions and the amount of landmark control exerted by the cue card. Unless specified otherwise, before each session the floor paper was changed and the rat was given disorientation treatment consisting of an experimenter placing the animal in a covered cardboard box and spinning the box slowly (0.2–0.5 Hz) while simultaneously walking around the recording cylinder at least twice. In cases in which multiple sessions were recorded in sequence, the animal was usually not disconnected from the recording cable between sessions.
Figure 1 shows each of the different experimental sessions. In the standard session, cellular activity was monitored while the animal foraged in the recording cylinder with the white cue card centered on the east wall, the center of which is defined as the 0° position. Whereas all cells were recorded in this first session, some cells were also recorded during one or two additional experiments in which the cue card was manipulated. The cue-rotation experiment consisted of three separate sessions (Fig. 1 B). In the first session (pre-rotation), cell activity was monitored with the cue centered at the standard position. This session was followed by the rotation session, in which the cue was rotated 90° in either the counterclockwise direction (50 cells) or clockwise direction (5 cells). In the third session, the cue was returned to the original 0° position (counter-rotation). The rotation of the cue always occurred with the animal in the cardboard box (i.e., out of the view of the animal).
Figure 1.

Diagram of cue card position and order of sessions during the standard session (A), cue-rotation experiment (B), and cue-removal experiment (C).
Cue-removal experiments usually followed cue-rotation experiments immediately if cell isolation remained intact and a clearly defined place field was present in the previous session. The cue-removal experiment also consisted of three separate sessions (Fig. 1C). In the pre-removal session, cellular activity was recorded with the cue card centered at the standard position. In the cue-removal session, recordings were made after the floor paper was changed, the cue card was removed, and the rat was returned to the cylinder without disorientation treatment. This session was followed by a cue-return session in which the cue card was replaced in the standard position without changing the floor paper or removing the animal from the apparatus.
When possible, individual cells were tested sequentially on the same day in all three experiments in the order listed above. For these cells, the first standard session (pre-rotation) was used for measuring place cell properties and also served as the control session for the cue-rotation experiment. The counter-rotation session that followed the cue-rotation session usually served as the control session for the cue-removal experiment. Sequentially administered sessions were typically separated by only 1–2 min, the time necessary to make adjustments to the room. Occasionally, after repeated sessions, the animal became unmotivated to retrieve food pellets and did not move around the apparatus sufficiently during recording. For these cells, different experimental series were administered on different days. In these latter instances, the experimental sessions (e.g., cue-rotation or cue-removal) were always bracketed with two standard sessions.
Data analysis. The firing rate of the recorded cell and the position of the animal as indicated by the red and green LEDs were recorded on a personal computer at a rate of 60 Hz using a National Instruments (Austin, TX) DIO-96 data acquisition board. Data analysis was accomplished off-line using custom software written in LabView (National Instruments). For each cell, a color-coded place/firing rate map was constructed using the methods of Muller et al. (1987). To summarize, the floor was divided into a grid of 32 × 32 pixels, and each pixel was displayed as a certain color based on the average firing rate of the cell when the head of the animal was located at that position. Pixels displayed as white represent positions that were not visited by the animal. Yellow pixels represent firing rates of zero. Other pixels were displayed as orange, red, green, blue, or purple, based on the firing rate in ascending order. The cutoff values between these levels were determined such that the number of pixels of a given color were 0.8 as many as the number of pixels of the next lower color (Muller et al., 1987). No additional smoothing was applied to the place/rate plots. After generation of the place/rate plot for a given cell, the place field was defined as the largest contiguous group of pixels possessing a firing rate ≥10% of the average firing rate of the three highest firing rate pixels that were sampled at least 15 times (0.25 sec). For two pixels to be considered contiguous, they had to share a common side (i.e., adjoining corners were not considered contiguous). For some cells, there was more than one contiguous area that qualified as a place field. For these cells, the largest place field was used for the analyses. There was no notable difference between groups in terms of the frequency of finding cells with multiple place fields (F(2,91) = 1.58; p > 0.05); the mean number of place fields per cell was 1.29 ± 0.08, 1.53 ± 0.19, and 1.53 ± 0.13 for control, ADN-lesioned, and PoS-lesioned animals, respectively.
Standard session analyses. For each place cell, the place/rate plot during the standard session was examined to determine: (1) place field size; (2) mean overall firing rate; (3) mean infield firing rate; (4) maximum infield firing rate; (5) mean outfield (background) firing rate; (6) spatial coherence; (7) sparsity; (8) spatial information content; and (9) directional information content. The size of the place field was calculated as the percentage of the visited apparatus occupied by the place field. The mean overall firing rate was determined by dividing the number of spikes that occurred over the entire session by the duration of the session. Mean infield and outfield firing rates were defined as the mean values for the firing rates of all pixels within (infield) and outside (outfield) the place field. The maximum infield firing rate was the maximum firing rate of all the pixels within the place field of the cell. Spatial coherence is a measure of the smoothness of firing rate contours. It was calculated using the method of Kubie et al. (1990), which involves correlating the firing rate of individual pixels with immediately surrounding pixels. Sparsity is a measure of how compact the firing field is relative to the recording apparatus and was calculated according to the methods described by Jung et al. (1994). The more confined the firing field of the place cell, the lower the sparsity measure. Spatial information content and directional information content describe how much information is conveyed regarding the spatial position and HD of the animal, respectively, by each spike discharge. These two information content measures were calculated using the methods described by Skaggs et al. (1993). Because these measures may be inaccurate for very low firing rate cells, it is notable that our lowest firing rate cell had 163 spikes in the initial session, which is more than enough activity to accurately determine these parameters. The values of place cell characteristics between different groups were compared using ANOVAs and Fisher's least significant difference (LSD) post hoc tests. Statistical significance was defined as p < 0.05.
Cue-rotation and cue-removal analyses. Location-specific firing activity during the cue-rotation and cue-removal experiments was used to assess the stability of place fields across multiple sessions and after cue card manipulations. Comparisons of location-specific firing activity between sessions were accomplished by: (1) calculating Pearson r correlations between the corresponding place/rate maps; and (2) estimating the amount of angular rotation of the place/rate maps between sessions. This latter value was determined by rotating the place/rate plot of the second session in 6° increments to determine the position at which the rotated plot was maximally correlated with the place/rate plot of the first session. The number of degrees the place/rate plot was shifted to produce the maximal Pearson r correlation was considered to be the amount of angular shift of location-specific activity between the two sessions (Muller and Kubie, 1987). Because rotation of central fields is less likely to affect place-field location, cells with fields restricted to the central 50% of the chamber were excluded from this analysis. Rayleigh tests (Batschelet, 1981) were used to determine whether the distribution of angular shifts observed between two sessions for each group of cells was nonrandom, as would be expected if shifts of location-specific activity relative to the location of the cue card were minimal. In cases in which the distribution of shifts was significantly nonrandom, between-group comparisons of the variability of angular shifts were performed. This analysis was accomplished using a modified F test of the concentration parameter (mean vector), with the associated degrees of freedom determined by n – 1 for each group (Batschelet, 1981).
A second analysis determined the absolute value of the deviation between the expected and observed place-field locations. The expected place-field location was defined as the angular location relative to the position of the cue card, or to the position of the field in the previous session in the case of the cue-removal experiment. Absolute values were used in this case to prevent equal, but opposite, deviations from canceling, as occurs when performing circular statistics using the mean vector (e.g., shifts of 90° and –90° would otherwise result in an average deviation of 0°). The absolute deviations were then compared between groups using Fisher's LSD tests.
Histology. After electrodes were advanced ∼2–3 mm into the brain, animals were anesthetized and a small anodal current (∼15 μA) was passed through one recording wire for 20 sec to conduct a Prussian blue reaction. After perfusing the animals with 10% formalin, brains were removed and stored in formalin for at least 24 hr. Brains were then placed in a solution of 10% formalin plus 2% potassium ferrocyanide for 24 hr, followed by several 24 hr formalin rinses. Brains were then placed in a 20% sucrose solution for 24 hr before sectioning (40 μm), staining with cresyl violet, coverslipping, and examination under high-power magnification to determine the location of electrode tracts and lesion extent. Lesion extent was determined by selecting four (ADN) or six (PoS) anatomical plates from Paxinos and Watson (1998) that spanned the extent of each structure in the rostrocaudal dimension. For each brain, tracings of lesion extent were made from stained sections corresponding to each anatomical plate. The lesion percentage of each plate was multiplied by the proportion of the total brain structure represented by each individual plate, and the resulting values were summed to produce a final estimation of lesion extent for each animal.
Results
Histology
An examination of each sectioned brain for the location and extent of the electrode tract indicated that the electrode wires passed through the CA1 region of the hippocampus in all animals from which place cells were recorded. One rat in the ADN-lesioned group and two rats in the PoS-lesioned group showed sparing of >50% of the target area. One of these animals had a unilateral PoS lesion on the same side of the brain as the recording sites, and the results from this animal will be discussed separately. Data from the other two animals with >50% sparing of the target area have been excluded from additional analysis. Figure 2, A and B, shows the extent of the largest and smallest lesions for the eight remaining ADN-lesioned animals and six remaining PoS-lesioned animals. For the eight ADN-lesioned animals, the lesion was complete in all but one animal. This animal showed lesioning of ∼75% of the ADN, with sparing in the dorsal aspect of the rostral ADN on the right side and the ventral aspect of the caudal ADN on this same side. In general, ADN lesions also tended to encroach on thalamic areas lateral and ventral to our target region, with most animals showing partial damage to anteroventral, mediodorsal, and laterodorsal thalamic nuclei. The anteroventral nucleus lies adjacent to the ADN and has connectivity similar to that seen for the ADN (van Groen and Wyss, 1995) but has not been shown to contain HD cells. In contrast, cells with direction-specific firing have been identified in the laterodorsal thalamic nuclei (Mizumori and Williams, 1993), but lesions of this area do not disrupt HD cell activity in PoS (Golob et al., 1998). Mizumori et al. (1994) found that temporary inactivation of laterodorsal thalamus diminished the spatial selectivity of some place cells but facilitated the spatial selectivity of an equal number of other cells, leading us to doubt the possibility of measurable effects from the incomplete (always <50%) incidental damage to this area in our animals. No damage to the dentate gyrus or other subfields of the hippocampus was found in ADN-lesioned animals.
Figure 2.
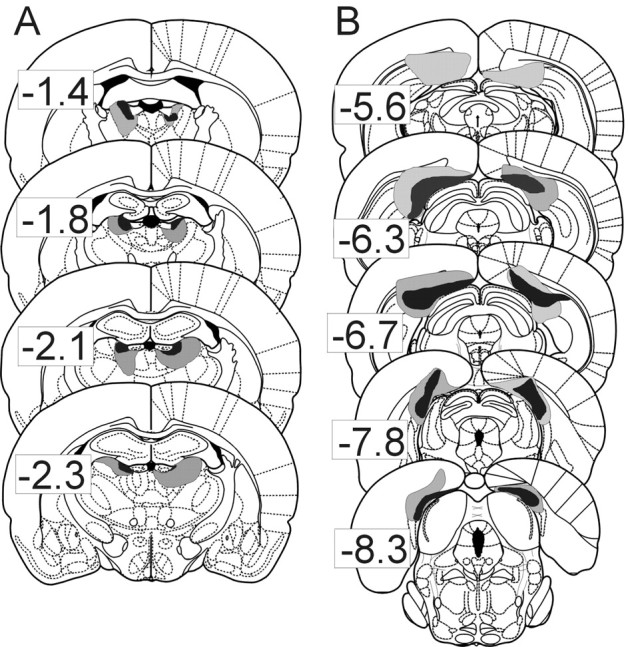
Diagram showing the location and extent of the smallest (black) and largest (gray) lesion observed in animals with ADN lesions (A) or PoS lesions (B). Values located beside each plate represent the distance in millimeters relative to bregma in the rostrocaudal dimension. Plates were reproduced from Paxinos and Watson (1998).
PoS lesions were more variable, with only one animal showing a complete lesion and remaining animals showing a range of 75–98% lesioning of PoS. Damage to areas adjacent to PoS was minimal. For three of the animals, the lesion continued anteriorly from PoS for up to 1 mm. Three PoS animals showed slight damage to the forceps major of the corpus callosum, two animals showed small areas of damage to one blade of the dentate gyrus, and there was usually slight damage to retrosplenial cortex adjacent to PoS.
Lesion effects on behavior
Animals receiving lesions of ADN or PoS did not show any obvious differences in behavior relative to control animals. In support of this observation, the average movement speed during each recording episode failed to vary significantly across the three groups, with means of 2.1 ± 0.04, 2.0 ± 0.06, and 2.0 ± 0.05 m/min for control, ADN-lesioned, and PoS-lesioned animals, respectively (F(2,91) = 1.21; p > 0.05). Likewise, the percentage of the apparatus visited was similar for the three groups of animals (means of 99.2 ± 0.3, 99.4 ± 0.2, and 99.1 ± 0.2% of enclosure sampled for control, ADN-lesioned, and PoS-lesioned animals, respectively; F < 1; p > 0.05).
Cell population
A total of 607 cells were isolated from 28 animals. Ninety-eight of these cells (16%) exhibited location-specific modulation of activity and, hence, were classified as place cells. The percentage of cells showing location-specific modulation did not differ across the three groups of animals, with 16.1% (45 of 280) of cells in control animals, 17.1% (18 of 105) of cells in ADN-lesioned animals, and 15.8% (35 of 222) of cells in PoS-lesioned animals categorized as place cells. These similar proportions of cells showing location-specific modulation are evidence that our lesions did not greatly influence the numbers of place cells found in CA1 hippocampus. Although our electrode configuration allows us to simultaneously monitor the activity of 10 electrode channels, in only three instances did we acquire simultaneous data on more than one place cell over a single recording session. In each of these instances, a pair of place cells was simultaneously recorded. Given our small sample size, therefore, we are precluded from reaching a firm conclusion regarding how the responses of simultaneously recorded cells correlated during the cue-rotation and cue card-removal manipulations.
Lesion effects on intrasession place-field characteristics
Representative place/rate plots of place cells recorded from each group of animals are shown in Figure 3. As shown, place fields from animals with lesions of ADN or PoS failed to differ markedly from those of controls. Table 2 summarizes the basic properties of place cells from each group during the first standard session. Cells from animals with lesions did not differ significantly from those of control animals on measures of place-field size, mean overall firing rate, mean infield firing rate, maximum infield firing rate, and sparsity. Spatial information content was noticeably lower in both lesioned groups, with the difference between control and PoS-lesioned animals being significant when tested as a planned comparison, but the omnibus F test of these differences failed to reach significance (F(2,91) = 2.04; p > 0.05). However, cells from both groups of lesioned animals were significantly different from those of controls with respect to measures of spatial coherence (F(2,91) = 5.58; p < 0.01), average outfield firing rate (F(2,91) = 5.52; p < 0.01), and directional information content (F(2,91) = 5.96; p < 0.01). Although significant, these differences were subtle. To show the magnitude of the average differences in spatial coherence and outfield firing rate, cells presented in the first column of Figure 3 were chosen because they were representative of their respective groups in spatial coherence (smoothness of firing rate contours), and cells presented in the second column were chosen because they were, likewise, representative of their respective groups in average outfield firing rate.
Figure 3.

Representative place/rate plots of standard sessions obtained from three control cells (top row), three cells from ADN-lesioned animals (middle row), and three cells from PoS-lesioned animals (bottom row). The highest firing rate pixels are shown in purple, with firing rates in descending order shown in blue, green, red, and orange. Yellow pixels represent firing rates of zero, and white pixels represent unsampled locations. Cells in the first column were chosen because they were representative of their respective groups in spatial coherence (smoothness of firing rate contours), and cells in the second column were chosen because they were, likewise, representative of their respective groups in the average outfield firing rate.
Table 2.
Comparison of intrasession hippocampal place cell firing properties in control, ADN-lesioned, and PoS-lesioned animals
|
|
Control (n = 45) |
ADN lesion (n = 17) |
PoS lesion (n = 32) |
|---|---|---|---|
| Place-field size (% of total visited area) | 16.6 ± 1.8 | 13.9 ± 3.7 | 14.7 ± 2.9 |
| Mean overall firing rate (spikes/sec) | 1.67 ± 0.22 | 1.89 ± 0.34 | 1.70 ± 0.32 |
| Mean infield firing rate (spikes/sec) | 7.08 ± 0.56 | 7.80 ± 1.35 | 6.16 ± 0.58 |
| Mean outfield firing rate (spikes/sec) | 0.57 ± 0.06 | 0.98 ± 0.15* | 0.80 ± 0.08* |
| Maximum infield firing rate (spikes/sec) | 28.78 ± 2.79 | 25.88 ± 5.17 | 31.16 ± 6.16 |
| Spatial coherence | 0.62 ± 0.03 | 0.50 ± 0.06* | 0.50 ± 0.03* |
| Sparsity | 0.27 ± 0.02 | 0.30 ± 0.04 | 0.32 ± 0.03 |
| Spatial information content (bits/spike) | 1.61 ± 0.13 | 1.37 ± 0.21 | 1.25 ± 0.10 |
| Directional information content (bits/spike)
|
0.25 ± 0.03
|
0.48 ± 0.10*
|
0.48 ± 0.08*
|
Values are mean ± SEM. Comparisons relative to controls using Fisher's least significant difference test. *p<0.05.
Place cells recorded from intact animals in an open-field environment typically do not show a high degree of head direction sensitivity within the place field of the cell (Muller et al., 1994, their Fig. 1). Relative to cells from control animals, however, place cell activity in animals with lesions of ADN or PoS was influenced more by the head direction of the animal, as evidenced by significantly higher scores for directional information content. This result was unexpected because the lesions were intended to eliminate HD cell activity, thereby potentially leaving the hippocampus without directional heading information. Figure 4A shows a frequency histogram of directional information content for the three groups of cells. Although all groups had cells with low directional information content scores (<0.4), animals with ADN or PoS lesions had a greater proportion of cells with higher scores for directional information content. Whereas only 15.6% (7 of 45) of place cells recorded from control animals had directional information content scores of >0.4, 47.1% (8 of 17) and 46.9% (15 of 32) of place cells recorded from animals with ADN or PoS lesions, respectively, had directional information content scores of >0.4, a difference that was significant (Fisher's exact test; p < 0.01).
Figure 4.

Analysis of the directional modulation of place cell activity. A, Histogram showing the distribution of directional information content scores across the three conditions. B, Place/rate plots of two place cells from PoS-lesioned animals showing directional modulation of location-specific activity. For each panel, central plots show location-specific activity across all head directions in the session. The eight plots located around each central plot represent the location-specific activity of the cell when the head of the animal was pointing in the direction represented by the position of the plot (i.e., plots located above the central plot indicate the firing activity of the cell when the animal was facing in the northerly direction). C, A typical cell from a control animal.
To determine the nature of this directionally sensitive location-specific activity, we computed eight separate place/rate plots for each cell, using the activity of the cell when the animal was facing each of the eight cardinal directions. The most typical type of directionally sensitive response is seen in the example cell from a PoS-lesioned animal shown in the left panel of Figure 4B. For this cell, location-specific firing was present only when the head direction of the animal was within an ∼90° range centered around the north (90°) plot. Interestingly, two cells from PoS-lesioned animals showed a pattern in which the location of the place field appeared to shift for different head direction orientations. One of these cells is shown in the right panel of Figure 4B. This cell appeared to have two place fields: one in the southwestern quadrant and a broader field spread out over the eastern quadrant (center map). In this cell, the place field was located in the southwestern quadrant when the animal was facing south or southeast, and the place field was located in the eastern quadrants when the animal was facing north, northwest, west, or southwest. Although we cannot rule out the possibility that we were recording from two cells with similar waveforms, only one waveform was evident in the records. For comparison, Figure 4C shows a representative control cell with a field that was invariant with respect to the head direction of the animal.
In many cases, the place field of the recorded cell was located near the wall of the cylinder, preventing the animal from assuming certain directional orientations within the field. This artifact, however, cannot account for the differences in directional information content between lesioned and control animals, because this directionality measure was calculated only for cell activity when the animal was within the place field of the recorded cell and unsampled directions did not contribute to the directional information content score.
Intrasession place-field characteristics after a unilateral PoS lesion
As discussed previously, histological analysis showed that one animal contained a nearly complete PoS lesion on the right side (79% lesioned), whereas the left PoS was completely spared. Seven place cells from this animal were recorded in the standard session, giving us the opportunity to assess the effects of a unilateral PoS lesion located ipsilateral to the recording site. In general, these cells tended to have fields that were less degraded than cells from animals with bilateral lesions. In measures of spatial coherence and outfield firing rate, these cells tended to be more similar to controls (mean spatial coherence, 0.609 ± 0.043; mean outfield firing rate, 0.607 ± 0.185 spikes/sec), without being significantly different from cells from bilaterally lesioned animals. Interestingly, these cells were similar to bilaterally lesioned animals in showing significantly higher directional information content relative to controls (mean, 0.612 ± 0.105 bits/spike; p < 0.05).
Lesion effects on intersession place-field characteristics: cue-rotation experiments
To examine lesion effects on place-field stability across multiple sessions and the influence of visual landmarks on place-field location, 18 cells from control animals, 11 cells from ADN-lesioned animals, and 17 cells from PoS-lesioned animals were recorded in the cue-rotation experiments. Figure 5 shows representative place-field plots for cells receiving these additional sessions.
Figure 5.
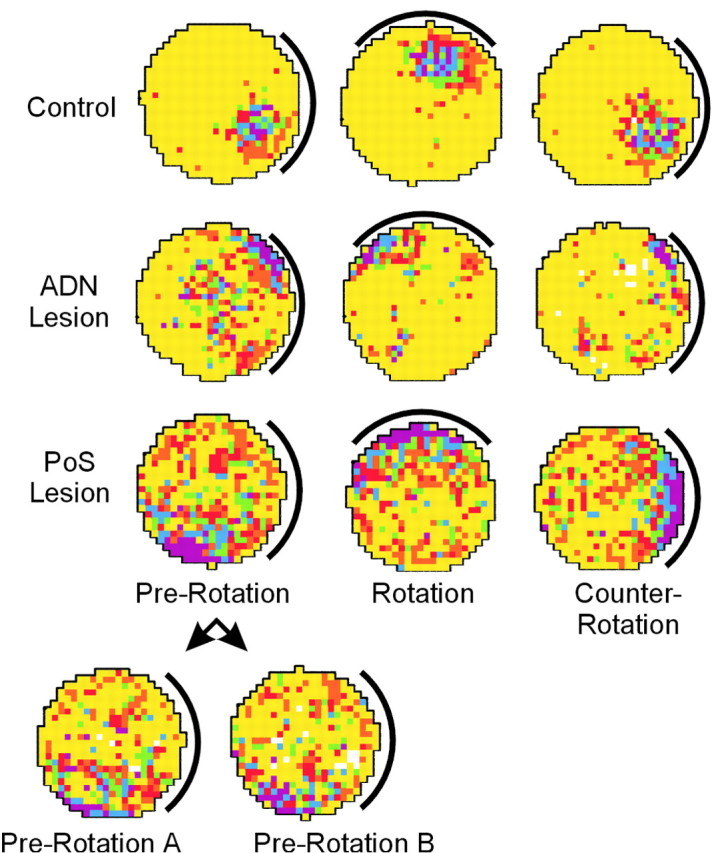
Place/rate plots showing the response of representative place cells from each condition during the three sessions of the cue-rotation experiment. The bottom two plots, Pre-Rotation A and Pre-Rotation B, show the first- and second-half activity of the pre-rotation session shown from the PoS lesion group.
Maintenance of location-specific activity across multiple sessions
Despite the presence of a well established place field in the prerotation session, some place cells from each group failed to exhibit a discriminable place field after cue card manipulations in rotation or counter-rotation sessions. In each of these instances, the extracellular waveform of the cell remained unchanged, indicating that cell isolation was maintained. For descriptive purposes, cells were classified as having an intact field or absent field in each of the two card manipulation sessions, leading to four categories of cells: intact rotation/intact counter-rotation, absent rotation/intact counter-rotation, intact rotation/absent counterrotation, and absent rotation/absent counter-rotation. The numbers and relative proportion of cells in each category across each condition are shown in Table 3. Although these numbers, overall, are relatively similar, there was an interesting tendency. Among those cells in the control and ADN-lesion conditions that failed to show a place field in one or both of the card manipulations, the most common category of cell was absent rotation/intact counter-rotation. That is, when cells from control and ADN-lesioned animals lost their place fields, this loss tended to occur during the cue-rotation session, and the cell would usually exhibit a place field again after replacement of the cue to the standard position. Such a pattern is suggestive that the context of the rotation session was treated by these cells as an environment that differed from the standard environment, and, thus, the cell temporarily showed place-field “remapping” in this new environment. In contrast, although a slightly greater proportion of cells from PoS-lesioned animals showed a loss of place fields, none of these losses proved to be temporary. Cells from PoS-lesioned animals that lost their place fields in the rotation session did not show a return of place-field activity in the counter-rotation session. Furthermore, unlike in the other two groups, four cells from PoS-lesioned animals lost their place fields in the counterrotation session despite having an intact field in the previous two sessions. We interpret this as a tendency for place cells from animals with PoS lesions to be less stable than cells from the other animals, as measured by the presence of a definable place field across multiple sessions. Although only 11.1% (2 of 18) and 9.1% (1 of 11) of cells from control animals and ADN-lesioned animals, respectively, failed to demonstrate location-specific firing for the counter-rotation session, this value was 41.2% (7 of 17) for cells recorded from animals with PoS lesions, a difference that failed to reach significance (p < 0.06) by a few cells. This finding is notable because Goodridge and Taube (1997) reported that ADN HD cells from PoS-lesioned animals showed a decreased tendency to shift their preferred firing direction after similar cuerotation sessions, suggesting that the PoS plays an important role in processing visual landmark information. Moreover, because ADN lesions do not significantly interfere with cue control in place cells, landmark visual information most likely projects directly to the PoS from retrosplenial cortex (Wyss and van Groen, 1992) or areas 17 and 18 (Vogt and Miller, 1983), and the ADN does not contribute a significant role to processing landmark information. Under normal (nonlesion) conditions, the ADN probably receives information about visual landmarks from afferent projections from the PoS (van Groen and Wyss, 1990).
Table 3.
Presence of location-specific firing activity across multiple sessions
|
|
Control |
ADN lesion |
PoS lesion |
|---|---|---|---|
| Cue-rotation experiment | |||
| Total cells | 18 | 11 | 17 |
| Intact rotation/intact counter-rotation | 13 (72.2%) | 7 (63.7%) | 10 (58.8%) |
| Absent rotation/intact counter-rotation | 3 (16.7%) | 3 (27.3%) | 0 (0%) |
| Intact rotation/absent counter-rotation | 0 (0%) | 0 (0%) | 4 (23.5%) |
| Absent rotation/absent counter-rotation | 2 (11.1%) | 1 (9.1%) | 3 (17.6%) |
| Cue-removal experiment | |||
| Total cells | 15 | 10 | 10 |
| Intact removal/intact return | 10 (66.7%) | 8 (80.0%) | 7 (70.0%) |
| Absent removal/intact return | 3 (20.0%) | 1 (10.0%) | 1 (10.0%) |
| Intact removal/absent return | 1 (6.7%) | 0 (0%) | 1 (10.0%) |
| Absent removal/absent return
|
1 (6.7%)
|
1 (10.0%)
|
1 (10.0%)
|
Not included above are two control cells from the cue-removal experiment, in which isolation was lost for the return session. One of these cells was from the category intact removal, and the other cell was from absent removal.
For the rotation sessions in which a place field remained, we assessed the amount of control exerted by the cue card in the rotation and counter-rotation sessions. Although the initial cue card rotation was in the counterclockwise direction for the majority of cells, this card rotation was in the opposite direction for some cells (n = 5). To equilibrate for this difference in our analysis and graphical presentation, the direction of the place-field rotation observed in the latter group of cells was inverted (e.g., an angular shift observed in the place field of 80° clockwise was treated as an angular shift of 80° counterclockwise). In the case of complete cue card control of place-field location, we would expect the location of the place field to rotate an equal amount and in an equal direction relative to the cue card (Muller and Kubie, 1987). Because the amount of place-field shift observed between a pair of sessions was calculated relative to the first session, a cell with perfect cue card control would exhibit angular shift scores of 90° between the pre-rotation and rotation sessions (when the cue had been rotated clockwise), –90° between the rotation and counter-rotation sessions, and 0° between the pre-rotation and counter-rotation sessions. One cell each from the control and PoS-lesioned groups exhibited a central field and was, therefore, excluded from this rotation analysis. Figure 5 presents example place/rate plots from each of the groups for the cuerotation experiment. Overall, place fields from control and ADN-lesioned animals tended to shift along with the cue card. In contrast, place fields from PoS-lesioned animals often appeared to shift randomly, regardless of cue card location. As an example, the place field of the cell shown in Figure 5 rotated ∼160° after the initial card rotation and then followed the card for the return session.
Figure 6A presents the distribution of angular shift scores after cue card rotation and return of the cue card to the standard position. A Rayleigh test of these angular shift values (Fig. 6A, first column) found that after the initial cue card rotation, place fields from control and ADN-lesioned animals showed angular shifts that were significantly distributed nonrandomly relative to the cue card (mean vector lengths, r = 0.94 and 0.68, respectively; mean vectors, m = 80.6° and 87.7°, respectively; p < 0.05). These groups were not equivalent, however, because shifts from animals with ADN lesions were significantly more variable than those of controls (F(6,11) = 5.84; p < 0.01). Across the population, place fields from PoS-lesioned animals showed angular shifts that were not significantly different from random during this initial cue card rotation (r = 0.24; m = 65.8; p > 0.05), indicating that their place fields did not rotate with the cue card. This difference is highlighted further by comparing the amount of absolute angular shift observed in the rotated session relative to the position of the cue card. If the cue card exerted perfect control of angular place-field location, we would expect an average absolute deviation of 0° between the expected and observed place-field locations. For the three groups of animals, absolute deviations were 17.5 ± 3.9°, 36.0 ± 16.3°, and 72.9 ± 14.0° for control, ADN-lesioned, and PoS-lesioned animals, respectively. The omnibus ANOVA of these values was significant (F(2,29) = 6.53; p < 0.05). Post hoc comparisons showed a significant difference (p < 0.05) between control and PoS-lesioned animals on these absolute deviation scores.
Figure 6.
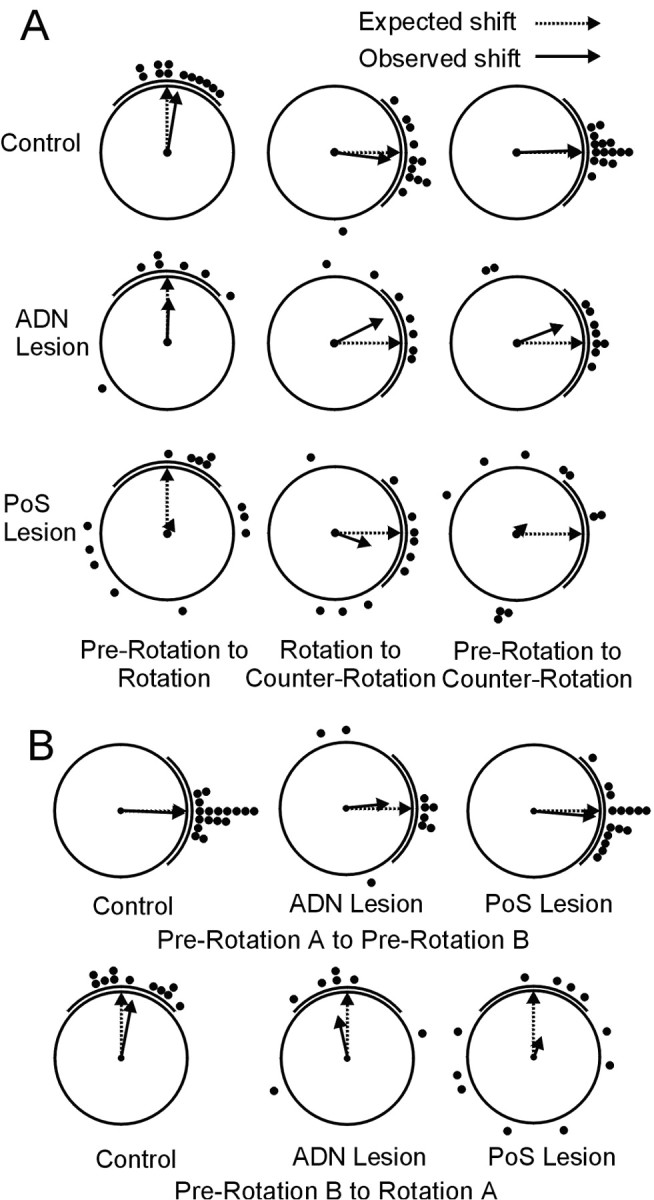
A, Scatter diagrams showing the amount of angular shift between sessions during cue-rotation experiments. Each plot shows the angular shift of location-specific activity observed between pairs of sessions. The left column shows the amount of angular shift observed in the rotation session relative to the pre-rotation session. The middle column shows the amount of angular shift observed in the counter-rotation session relative to the rotation session. The right column shows the amount of angular shift observed in the counter-rotation session relative to the pre-rotation session. The thick line outside each plot indicates the position of the cue card for the second session in each pair. B, Scatter diagrams showing the amount of angular shift between the first and second halves of pre-rotation sessions (top row) and between the second half of pre-rotation and the first half of rotation sessions (bottom row). In A and B, the angular position of the filled circles represents the angular shift of individual cells between the two sessions. The dotted arrow denotes the expected mean vector angle if the angular shift is perfectly predicted by the cue card, and the solid arrow denotes the observed mean vector angle. The length of the solid arrow denotes the mean vector length, with a length of 1.0 (no variability in shift scores) represented by a vector spanning the radius of the circle.
When the cue card was returned to the standard position from the rotated position (Fig. 6A, middle column), place fields from all three groups showed angular shifts significantly distributed nonrandomly relative to the cue card (r = 0.87, 0.82, and 0.58; m = –97.4°, –63.5°, and –109.6° for control, ADN-lesioned, and PoS-lesioned animals, respectively; p < 0.01), and there was no difference in the variability of shift distributions between these groups (p > 0.05). Additionally, absolute shift deviations relative to the card were not significantly different between conditions (means of 23.5 ± 6.3°, 33.4 ± 12.8°, and 46.8 ± 12.8° for control, ADN-lesioned, and PoS-lesioned animals, respectively). There was an interesting tendency for cells from ADN-lesioned animals to under-rotate during this manipulation, but this difference was not significant.
When comparing shifts between pre-rotation and counter-rotation sessions (Fig. 6A, right column), control and ADN-lesioned animals again showed better landmark control of place-field location. Shift scores from these groups were distributed nonrandomly (r = 0.99 and 0.75; m = 2.0° and 20.9° for control and ADN-lesioned animals, respectively; p < 0.01), whereas shifts observed from PoS-lesioned animals were distributed randomly (r = 0.21; m = 43.1°; p > 0.05). Although the shifts observed in cells from control and ADN-lesioned animals were both distributed around zero, these groups were not equivalent. Specifically, shifts from ADN-lesioned cells were significantly more variable than shifts from control cells (F(9,14) = 20.40; p < 0.01), suggesting that place fields from animals with ADN lesions tended to shift more between the two standard sessions than place fields from control animals.
When the amount of shift between the pre-rotation and counter-rotation sessions was compared regardless of shift direction (absolute shift deviation), cells from control and ADN-lesioned animals again showed significantly less shift between the two conditions than PoS-lesioned animals (means of 6.8 ± 1.7°, 31.8 ± 13.6°, and 77.4 ± 14.2° for control, ADN-lesioned, and PoS-lesioned animals, respectively; F(2,32) = 13.56; p < .001).
As a final test of landmark control of place-field location, we correlated location-specific activity between pre-rotation and counter-rotation sessions. Mean Pearson r correlation values between standard sessions were 0.362 ± 0.051, 0.309 ± 0.068, and 0.129 ± 0.022 for cells from control, ADN-lesioned, and PoS-lesioned animals, respectively. These correlation values were significantly different (F(2,33) = 5.30; p < 0.05), with values from control and ADN-lesioned animals being significantly higher (p < 0.05) than those from PoS-lesioned animals.
Within-session analyses
The seemingly random angular shifts in place-field location observed between sessions for cells from animals with PoS lesions might be explained by a gradual shift occurring continuously within a session or alternatively by an abrupt shift occurring between sessions. A gradual shift occurring within a session might indicate deficits in both ideothetic and landmark control of place-field location. Conversely, the presence of a stable place field within a session that abruptly shifts between two sessions could be expected in the case of an intact ideothetic navigational system (responsible for keeping track of location within a session), but a deficit in landmark control of place-field location (assuming ideothetic control is disrupted between sessions by the disorientation treatment and the place field is reestablished in normal animals by orienting to landmark cues). The impairment of within-session place-field characteristics such as spatial coherence and spatial information content that we observed would be expected in the case of a gradual shift within a recording session, and so it is important to assess this possibility. To examine this issue, we calculated the amount of angular shift in place-field location observed between the first and second halves of prerotation sessions. Despite the typically large angular shifts observed between sessions in cells from PoS-lesioned animals, these same cells were much more stable within the session. This finding can be seen in the example of a cell from a PoS-lesioned animal shown in the bottom two plots of Figure 5, where the place field is located in the same general location for both the first half (prerotation A) and second half (pre-rotation B) of the pre-rotation session.
Figure 6B (top row) displays the angular shift values between the first and second halves of the pre-rotation sessions for all three groups. Supporting the view that cells from PoS-lesioned animals were likely to maintain stable place fields within individual sessions, these within-session angular shifts were significantly centered around zero for all three groups (r = 0.99, 0.66, and 0.95; m =–2.5°, 5.6°, and –5.0° for control, ADN-lesioned, and PoS-lesioned groups, respectively; p < 0.05). However, shifts from cells in ADN- and PoS-lesioned animals showed significantly more variability than cells from control animals (ADN vs control: F(8,16) = 34.53, p < 0.01; PoS vs control: F(14,16) = 5.21, p < 0.05), providing evidence of an increase in within-session variability in lesioned animals. Interestingly, cells from PoS-lesioned animals were also significantly less variable than those from ADN-lesioned animals (F(8,14) = 6.63; p < 0.01). A comparison of the absolute shift deviation between the two sessions further highlighted these findings. The omnibus F test of these values was significant (F(2,38) = 4.83; p < 0.05). Post hoc comparisons revealed that control and PoS-lesioned animals had significantly less shift than ADN-lesioned animals (means of 6.0 ± 1.5°, 14.4 ± 3.5°, and 34.0 ± 14.4° for control, PoS-lesioned, and ADN-lesioned animals, respectively). Based on these analyses, we conclude that place fields from lesioned animals were somewhat more prone to shift within an individual recording session than fields from control animals. This result is an important finding, because it presents the possibility that the shift observed between sessions for lesioned animals simply reflects the accumulation of within-session instability over an extended time period.
To assess this possibility, we sought to compare within-session instability with between-session instability over a similar time period by shortening the between-session analysis to include only data collected during the 8 min before and 8 min after the cue card rotation (pre-rotation B and rotation A conditions). The shift scores from this between-session analysis are presented in the bottom row of Figure 6B. Despite the fact that the data producing these shift scores span a similar period of time as the within-session shift scores (notwithstanding the 1–2 min required to produce the cue manipulation), the shifts observed in PoS-lesioned animals were dramatically and significantly greater than the pre-rotation within-session shift scores, as evidenced from the fact that the directional shifts were now distributed randomly relative to the position of the cue card (r = 0.154; m = –19.87°; p < 0.05). Interestingly, cells from control (but not ADN-lesioned) animals also showed greater between-session shifts than within-session shifts (F test of concentration parameters, F(10,16) = 8.13; p < 0.01), but this difference was modest relative to the effect seen in PoS-lesioned animals. ADN-lesioned animals showed similar within-session and between-session shifts. A comparison of the absolute angular shifts also supports the premise that between-session shifts were greater than withinsession shifts for PoS and control animals [means of 21.8 ± 4.3° vs 6.0 ± 1.5° for control animals (p < 0.01), 79.1 ± 15.9° vs 14.4 ± 3.6° for PoS-lesioned animals (p < 0.01), and 37.7 ± 15.75° vs 34.0 ± 14.4° for ADN-lesioned animals (p > 0.05)].
To summarize the comparison of within-session and between-session instability, both lesion groups presented modest within-session instability relative to control animals. When examined over a comparable period of time, however, the addition of a cue card manipulation did nothing to increase this instability for ADN-lesioned animals, suggesting that the between-session instability found after cue card manipulations can be accounted for by the cumulative buildup of small error present within a session for this lesion group. In contrast, the much more dramatic between-session instability seen in PoS-lesioned animals cannot be attributed to accumulation of error present within individual sessions and points rather to a qualitatively different deficit in cue control for these animals.
Cue-removal experiments
The cue-removal experiment was used to assess whether place cells in lesioned animals could maintain a stable spatial correlate in the absence of visual landmarks. If lesions of the HD system affect the use of ideothetic cues to maintain a spatial correlate, this deficit might not be apparent unless visual landmarks are eliminated from the apparatus. Indeed, McNaughton et al. (1995) hypothesized that in the absence of HD cell input into the hippocampal system, place fields would become annular if the animals were recorded in a circular environment without the presence of a polarizing landmark cue. Seventeen cells from control animals, 10 cells from ADN-lesioned animals, and 10 cells from PoS-lesioned animals received testing in the cue-removal experiment. Of these, five control cells, two ADN-lesioned cells, and two PoS-lesioned cells failed to show discriminable place fields in the no-cue session (Table 3). Figure 7A shows place/rate plots representative of the remaining cells in the cue-removal and cue-return sessions. The prediction of McNaughton et al. (1995) was not supported, because there was no evidence that the shape of place fields from either ADN-lesioned or PoS-lesioned animals became more annular in the no-cue sessions. As shown in the representative cells, the location of place fields from control and ADN-lesioned cells tended to be stable when the card was removed between pre-removal and cue-removal sessions, and again when the card was returned between cue-removal and cuereturn sessions. In contrast, cells from PoS-lesioned animals exhibited place fields that tended to shift unpredictably between these sessions. Figure 7B displays the angular shift scores of these cells after removal and return of the cue card. Supporting the observation that place-field location was stable between these sessions for control and ADN-lesioned cells, these shift scores were distributed nonrandomly after removal of the cue card (r = 0.59 and 0.98; m = -9.3° and 1.6°; p < 0.05) and after the return of the cue card (r = 0.61 and 0.99; m = 30.1° and 1.5°; p < 0.05). These groups were not equivalent, however, because shift scores from ADN-lesioned cells were significantly more concentrated (less variable) than shift scores from control animals in both of these manipulations (F(8,7) = 16.7 and 26.0 for cue-removal and cue-return manipulations; p < 0.01). The distribution of shift scores from PoS-lesioned cells was not significantly different from random between pre-removal and cue-removal sessions (r = 0.13; m = 60.5°; p > 0.05) and between cue-removal and cue-return sessions (r = 0.21; m = 16.2°; p > 0.05).
Figure 7.
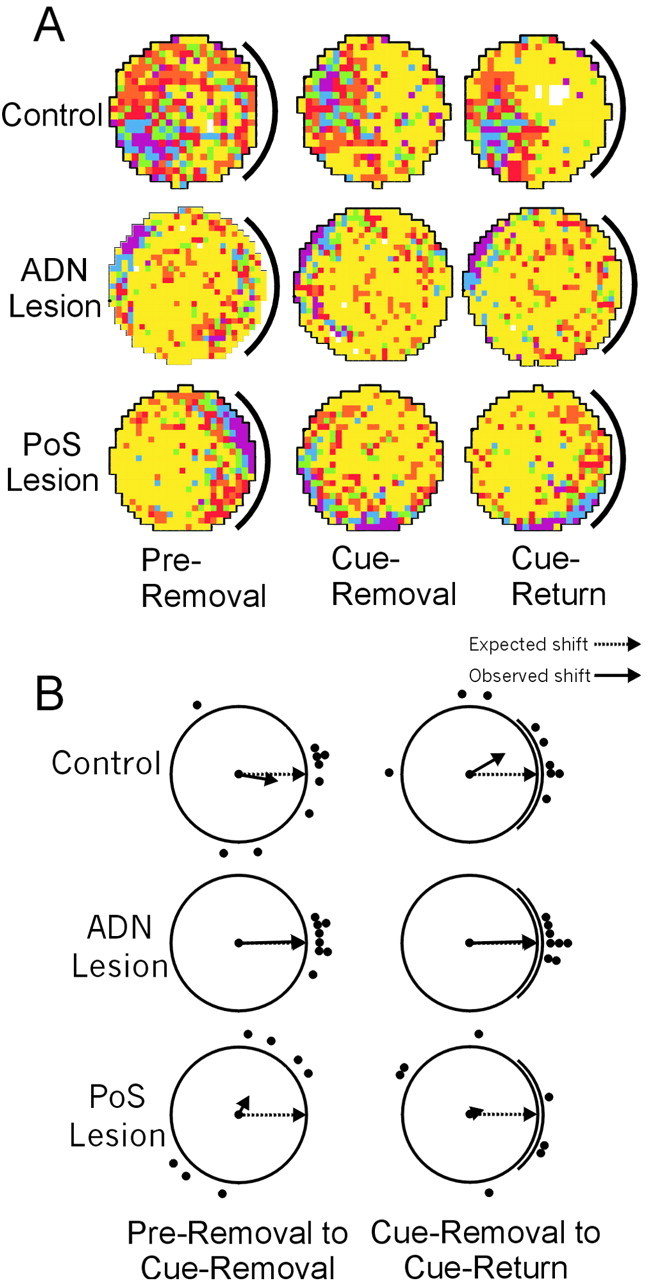
A, Representative place/rate plots of cells recorded in the cue-removal experiment. B, Scatter diagrams showing the amount of angular shift observed between consecutive sessions of the cue-removal experiment. In each plot, the dotted arrow denotes the expected mean vector angle if there is no shift between conditions, and the solid arrow denotes the observed mean vector angle. The length of the solid arrow denotes the mean vector length, with a length of 1.0 (no variability in shift scores) represented by a vector spanning the radius of the circle. Group data reflect results similar to those seen for the representative plots shown in A.
An examination of the absolute deviation of angular shift scores also supports the conclusion that place fields from control and ADN-lesioned animals were more stable between these sessions. Between the pre-removal and cue-removal sessions, control and ADN-lesioned animals showed significantly less absolute deviation relative to PoS-lesioned animals (F(2,21) = 8.02; p < 0.01), with means of 42.7 ± 14.9°, 10.5 ± 2.7°, and 85.7 ± 16.3°, respectively for the three groups. The omnibus F test of absolute deviation between the cue-removal and cue-return sessions was also significant (F(2,21) = 3.79; p < 0.05). Post hoc comparisons revealed that that cells from ADN-lesioned animals showed significantly less absolute deviation than PoS-lesioned animals, with no other comparisons being significant (means of 48.7 ± 19.9°, 7.5 ± 2.4°, and 74.6 ± 21.3° for control, ADN-lesioned, and PoS-lesioned animals, respectively).
Discussion
The discovery of cells in the rat nervous system providing information about allocentric position and directional orientation has led to much speculation about how these signals might be combined as part of an interconnected navigational network. HD cells have been found in the PoS and ADN, two limbic structures sharing reciprocal connections. The PoS projects to the superficial layers of the entorhinal cortex (Caballero-Bleda and Witter, 1993), a major source of input to the hippocampus complex, so relatively direct anatomical pathways exist for bringing HD information into the hippocampus. After lesions of ADN or PoS, we found that: (1) place cells continued to exhibit location-specific activity, but the place fields were somewhat degraded and cells were more directionally sensitive; and (2) place fields in animals with PoS lesions shifted unpredictably between sessions regardless of the position of the major visual landmark, suggesting that the visual landmark no longer exerted significant stimulus control over the place fields of the cells.
Despite predictions that the HD signal is an important feature for place cell activity, this study found that place cell activity within the hippocampus was normal in many respects after lesions of either ADN or PoS. Place cells were found in equal numbers in control and lesioned animals. An examination of place-field characteristics found that place cells from lesioned animals exhibited place fields that were slightly noisier (less spatial coherence, increased outfield firing rate, decreased information content) and more sensitive to the HD of the animal. However, other measures of intrasession place-field characteristics, such as place-field size and mean infield firing rates, were unaffected in lesioned animals. These results are in contrast to the more detrimental effects to place cell discharge after inactivation of the vestibular labyrinth, in which place cells lose their location-specific firing altogether (Stackman et al., 2002).
Given the nature of the signal carried by the HD system, the finding that place cells were more responsive to directional heading after ADN or PoS lesions merits additional consideration. Previous work has shown that the degree to which place cells are normally responsive to directional heading depends on the recording environment and the behavioral task performed by the animal. Within environments that constrain the path and direction of movement, such as when the animal is performing on a radial arm maze or task-specific behavior on a linear track, place cells usually show directional modulation (McNaughton et al., 1983; Muller et al., 1994; Markus et al., 1995). In contrast, in open-field environments such as the recording cylinder used for the present study, place cell activity normally occurs independently of directional control. One potential explanation for the increase in directional modulation of place fields in lesioned animals is that input from the HD system is used to cancel the directionally dependent features of other signals converging on the place cell system. For instance, assuming that the visual signal contributes to place-field activity, one could postulate a relationship by which the HD system serves to catalog the different “local views” of a given place into a cohesive nondirectional spatial representation. Without an intact HD system, the convergence of directionally dependent sensory information onto the place cell system could result in “directional fragmentation” of the place field, giving the appearance of a place field modulated by the directional heading of the animal.
Intersession effects after lesions of HD system
It was apparent that there were larger differences in place-field stability between sessions. Cells recorded from animals with PoS lesions showed place fields that tended to rotate unpredictably between sessions, regardless of the position of the major visual landmark in the apparatus. In contrast, cells from ADN-lesioned animals more closely resembled cells from control animals and usually showed tight coupling of place-field location with landmark position. It is notable that we did not find evidence for diminishing cue control after repeated experimental disorientation (Knierim et al., 1995), possibly because of frequent nondisoriented exposure to the apparatus during training and cell screening.
The finding that animals with PoS lesions showed relatively stable place fields within recording sessions but showed fields that moved unpredictably between cue-rotation sessions might lead to the conclusion that PoS lesions disrupted landmark control but not ideothetic control of place-field location. In this framework, because path integration had presumably been disabled by giving the animal disorientation treatment between sessions, the animal would be forced to reorient in the second session solely on the basis of landmark cues. In support of this possibility, Goodridge and Taube (1997) found that landmark control of ADN HD cells recorded between sessions was disrupted after PoS lesions, although the HD signal was stable within single sessions. One aspect of the present study, however, leads us to question whether these animals suffered only from an inability to use landmark cues. We found that place fields of PoS-lesioned animals also shifted unpredictably when the animal was placed in the apparatus in the absence of the landmark without first being disoriented.
The finding that place fields in PoS-lesioned animals were unstable from one session to the next, regardless of the presence or absence of the visual landmark and regardless of the availability of ideothetic cues, points to the possibility that place cells in these animals treated each session as an exposure to a different environment. Place cells have been shown to change or cease their location-specific activity when the animal is placed in a different environment or if changes of landmark cues in a known environment occur, a phenomenon referred to as remapping (Muller and Kubie, 1987; Bostock et al., 1991). Such a phenomenon might be expected if animals with PoS lesions suffered from mnemonic or perceptual deficits, as has been shown in a radial arm maze task requiring the use of spatial working memory (Taube et al., 1992).
Interestingly, a recent study examining the effects of perirhinal cortex lesions on hippocampal place cell activity also reported between-session place-field instability in lesioned animals (Muir and Bilkey, 2001), suggesting that this instability could be related to a general disruption of information flow into the hippocampus, rather than to a decrement in the HD system. However, the place-field instability observed with perirhinal lesions was more transient, occurring on some sessions but not others, even for the same cells. Furthermore, unlike the present findings, perirhinal lesions did not disrupt cue control by the landmark, because the place fields of most cells rotated similar amounts when the rectangular chamber and prominent visual cues were rotated together 180°.
Our results can also be compared with two other lesion studies concerned with place cells. One study inactivated the retrosplenial cortex while recording hippocampal place cells and found that the locations of place fields from inactivated animals were initially unstable, although this instability subsided over time within the same recording session (Cooper and Mizumori, 2001). This finding somewhat resembles our results, because we found that place-field locations were unstable across recording sessions but were mostly stable within sessions. Although the retrosplenial cortex sends a direct projection to the entorhinal cortex, it also sends a projection to the PoS, which in turn projects to the entorhinal cortex (Wyss and van Groen, 1992). Thus, it is possible that the effect of retrosplenial cortex inactivation on hippocampal place cells is mediated via the PoS. Additionally, Miller and Best (1980) reported that hippocampal place cells recorded from animals with entorhinal cortex lesions showed less robust location-specific firing and that place fields did not follow the extra-maze cues when the radial arm maze was rotated. These findings are similar to our results and suggest that the PoS→entorhinal pathway contributes to the processing of landmark information.
Implications for navigational models
There have been various attempts to model the relationship between HD and place-field signals. One feature consistent with these models is that the HD signal can be used by the place cell network to localize allocentric position (McNaughton et al., 1996; Touretzky and Redish, 1996; Sharp, 1999). These models imply that the HD cell system is a necessary component for maintaining the place-field representations in the absence of visual landmarks. However, our results from the cue-removal experiments demonstrate that place-field representations can remain stable in the absence of both HD cell and visual landmark information, because place fields for ADN-lesioned animals were as stable as those of controls. This result would, thus, be at odds with these models.
One possible explanation for this contradiction is that directional information still managed to converge on the place cell system despite our lesions. Since first being discovered in the PoS and thalamus, HD cells have been found in other brain areas that are not part of the LMN→ ADN→ PoS axis, including retrosplenial cortex (Chen et al., 1994; Cho and Sharp, 2001), lateral dorsal thalamus (Mizumori and Williams, 1993), and the dorsal striatum (Wiener, 1993). Recent findings of angular head velocity signals converging on LMN (Bassett and Taube, 2001; Sharp et al., 2001b) and the finding that LMN lesions disrupt HD activity in ADN (Tullman and Taube, 1998; Blair et al., 1999) have strengthened the view that the HD signal is generated subcortically and the anterior thalamus serves as a point of convergence between vestibular and proprioceptive information carried by subcortical structures and visual landmark and efferent copy signals descending from cortical areas (McNaughton et al., 1996; Taube, 1998). However, the presence of cells in the retrosplenial and medial prestriate cortex that carry directional information (Chen et al., 1994), and the fact that it has not been experimentally verified that ADN lesions eliminate these cortical HD signals, allows for the possibility that directional information was able to enter the hippocampus despite lesions of ADN. Although the lateral dorsal thalamus and dorsal striatum do not contain a high percentage of cells that encode directional heading, it is still possible that directional information may have been conveyed to the hippocampus from these areas via indirect routes through the entorhinal cortex or subicular areas. Nonetheless, the present study shows that removal of the principal areas in which HD cells have been studied, ADN and PoS, does not abolish the hippocampal place cell signal but leaves it less robust within sessions and less stable across sessions.
Footnotes
This work was supported by grants from the National Institute on Deafness and Other Communication Disorders (DC00236), the National Institute of Mental Health (MH48924 and MH01286), and NASA through the NASA Cooperative Agreement NCC 9-58 with the National Space Biomedical Research Institute. We thank Joshua Bassett, Russell Frohardt, Edward Golob, and Gary Muir for helpful discussions. Previous versions of these experiments were published in abstract form (Dudchenko et al., 1995; Archey et al., 1997).
Correspondence should be addressed to Dr. Jeffrey S. Taube, Department of Psychological and Brain Sciences, Dartmouth College, 6207 Moore Hall, Hanover, NH 03755. E-mail: jeffrey.taube@dartmouth.edu.
J. L. Calton's present address: Department of Psychology, California State University–Sacramento, 6000 J Street, Sacramento, CA 95819. E-mail: calton@csus.edu.
R. W. Stackman's present address: Department of Behavioral Neuroscience, L470, Oregon Health and Science University, 3181 Southwest Sam Jackson Park Road, Portland, OR 97239-3098. E-mail: stackman@ohsu.edu.
P. A. Dudchenko's present address: Department of Psychology, University of Stirling, FK9 4LA Stirling, UK. E-mail: p.a.dudchenko@stir.ac.uk.
Copyright © 2003 Society for Neuroscience 0270-6474/03/239719-13$15.00/0
References
- Archey WB, Stackman RW, Goodridge JP, Dudchenko PA, Taube JS ( 1997) Place cells show directionality in an open field following lesions of the head direction cell system. Soc Neurosci Abstr 23: 504. [Google Scholar]
- Bassett JP, Taube JS ( 2001) Neural correlates for angular head velocity in the rat dorsal tegmental nucleus. J Neurosci 21: 5740–5751. [DOI] [PMC free article] [PubMed] [Google Scholar]
- Batschelet E ( 1981) Circular statistics in biology. London: Academic.
- Blair HT, Cho J, Sharp PE ( 1999) The anterior thalamic head-direction signal is abolished by bilateral but not unilateral lesions of the lateral mammillary nucleus. J Neurosci 19: 6673–6683. [DOI] [PMC free article] [PubMed] [Google Scholar]
- Bostock E, Muller RU, Kubie JL ( 1991) Experience-dependent modifications of hippocampal place cell firing. Hippocampus 1: 193–206. [DOI] [PubMed] [Google Scholar]
- Caballero-Bleda M, Witter MP ( 1993) Regional and laminar organization of projections from the presubiculum and parasubiculum to the entorhinal cortex: an anterograde tracing study in the rat. J Comp Neurol 328: 115–129. [DOI] [PubMed] [Google Scholar]
- Chen LL, Lin LH, Green EJ, Barnes CA, McNaughton BL ( 1994) Head-direction cells in the rat posterior cortex. I. Anatomical distribution and behavioral modulation. Exp Brain Res 101: 8–23. [DOI] [PubMed] [Google Scholar]
- Cho J, Sharp PE ( 2001) Head direction, place, and movement correlates for cells in the rat retrosplenial cortex. Behav Neurosci 115: 3–25. [DOI] [PubMed] [Google Scholar]
- Cooper BG, Mizumori SJY ( 2001) Temporary inactivation of the retrosplenial cortex causes a transient reorganization of spatial coding in the hippocampus. J Neurosci 21: 3986–4001. [DOI] [PMC free article] [PubMed] [Google Scholar]
- Dudchenko P, Goodridge JP, Taube JS ( 1995) The effects of lesions of the postsubiculum on hippocampal place cell activity. Soc Neurosci Abstr 21: 945. [Google Scholar]
- Fox SE, Ranck Jr JB ( 1981) Electrophysiological characteristics of hippocampal complex-spike and theta cells. Exp Brain Res 41: 399–410. [DOI] [PubMed] [Google Scholar]
- Golob EJ, Wolk DA, Taube JS ( 1998) Recordings of postsubicular head direction cells following lesions of the lateral dorsal thalamic nucleus. Brain Res 780: 9–19. [DOI] [PubMed] [Google Scholar]
- Goodridge JP, Taube JS ( 1997) Interaction between postsubiculum and anterior thalamus in the generation of head direction cell activity. J Neurosci 17: 9315–9330. [DOI] [PMC free article] [PubMed] [Google Scholar]
- Goodridge JP, Dudchenko PA, Worboys KA, Golob EJ, Taube JS ( 1998) Cue control and head direction cells. Behav Neurosci 112: 749–761. [DOI] [PubMed] [Google Scholar]
- Jarrard LE ( 1993) On the role of the hippocampus in learning and memory in the rat. Behav Neural Biol 60: 9–26. [DOI] [PubMed] [Google Scholar]
- Jung MW, Wiener SI, McNaughton BL ( 1994) Comparison of spatial firing characteristics of units in dorsal and ventral hippocampus of the rat. J Neurosci 14: 7347–7356. [DOI] [PMC free article] [PubMed] [Google Scholar]
- Knierim JJ, Kudrimoti HS, McNaughton BL ( 1995) Place cells, head direction cells, and the learning of landmark stability. J Neurosci 15: 1648–1659. [DOI] [PMC free article] [PubMed] [Google Scholar]
- Kubie JL ( 1984) A driveable bundle of microwires for collecting single-unit data from freely-moving rats. Physiol Behav 32: 115–118. [DOI] [PubMed] [Google Scholar]
- Kubie JL, Muller RU, Bostock E ( 1990) Spatial firing properties of hippocampal theta cells. J Neurosci 10: 1110–1123. [DOI] [PMC free article] [PubMed] [Google Scholar]
- Markus EJ, Qin YL, Leonard B, Skaggs WE, McNaughton BL, Barnes CA ( 1995) Interactions between location and task affect the spatial and directional firing of hippocampal neurons. J Neurosci 15: 7079–7094. [DOI] [PMC free article] [PubMed] [Google Scholar]
- McNaughton BL, Barnes CA, O'Keefe J ( 1983) The contributions of position, direction, and velocity to single unit activity in the hippocampus of freely-moving rats. Exp Brain Res 52: 41–49. [DOI] [PubMed] [Google Scholar]
- McNaughton BL, Knierim JJ, Wilson MA ( 1995) Vector encoding and the vestibular foundations of spatial cognition: neurophysiological and computational mechanisms. In: The cognitive neurosciences (Gazzaniga M, ed), pp 585–595. Cambridge, MA: MIT.
- McNaughton BL, Barnes CA, Gerrard JL, Gothard K, Jung MW, Knierim JJ, Kudrimoti H, Qin Y, Skaggs WE, Suster M, Weaver KL ( 1996) Deciphering the hippocampal polyglot: the hippocampus as a path integration system. J Exp Biol 199: 173–185. [DOI] [PubMed] [Google Scholar]
- Miller VA, Best PJ ( 1980) Spatial correlates of hippocampal unit activity are altered by lesions of the fornix and entorhinal cortex. Brain Res 194: 311–323. [DOI] [PubMed] [Google Scholar]
- Mittelstaedt H ( 1983) The role of multimodal convergence in homing path integration. Fortschr Zool 28: 197–212. [Google Scholar]
- Mizumori SJY, Williams JD ( 1993) Directionally selective mnemonic properties of neurons in the lateral dorsal nucleus of the thalamus of rats. J Neurosci 13: 4015–4028. [DOI] [PMC free article] [PubMed] [Google Scholar]
- Mizumori SJY, Miya DY, Ward KE ( 1994) Reversible inactivation of the lateral dorsal thalamus disrupts hippocampal place representation and impairs spatial learning. Brain Res 644: 168–174. [DOI] [PubMed] [Google Scholar]
- Morris RGM, Garrud P, Rawlins JNP, O'Keefe J ( 1982) Place-navigation impaired in rats with hippocampal lesions. Nature 297: 681–683. [DOI] [PubMed] [Google Scholar]
- Muir GM, Bilkey DK ( 2001) Instability in the place field location of hippocampal place cells after lesions centered on the perirhinal cortex. J Neurosci 21: 4016–4025. [DOI] [PMC free article] [PubMed] [Google Scholar]
- Muller RU, Kubie JL ( 1987) The effects of changes in the environment on the spatial firing properties of hippocampal complex-spike cells. J Neurosci 7: 1951–1968. [DOI] [PMC free article] [PubMed] [Google Scholar]
- Muller RU, Kubie JL, Ranck JB ( 1987) Spatial firing patterns of hippocampal complex-spike cells in a fixed environment. J Neurosci 7: 1935–1950. [DOI] [PMC free article] [PubMed] [Google Scholar]
- Muller RU, Bostock E, Taube JS, Kubie JL ( 1994) On the directional firing properties of hippocampal place cells. J Neurosci 14: 7235–7251. [DOI] [PMC free article] [PubMed] [Google Scholar]
- O'Keefe J, Conway DH ( 1978) Hippocampal place units in the freely moving rat: why they fire where they fire. Exp Brain Res 31: 573–590. [DOI] [PubMed] [Google Scholar]
- O'Keefe J, Dostrovsky J ( 1971) The hippocampus as a spatial map: preliminary evidence from unit activity in the freely-moving rat. Brain Res 34: 171–175. [DOI] [PubMed] [Google Scholar]
- O'Keefe J, Nadel L ( 1978) The hippocampus as a cognitive map. Oxford: Clarendon.
- Paxinos G, Watson C ( 1998) The rat brain in stereotaxic coordinates, Ed 4. San Diego: Academic.
- Quirk GJ, Muller RU, Kubie JL ( 1990) The firing of hippocampal place cells in the dark depends on the rat's recent experience. J Neurosci 10: 2008–2017. [DOI] [PMC free article] [PubMed] [Google Scholar]
- Ranck Jr JB ( 1973) Studies on single neurons in dorsal hippocampal formation and septum in unrestrained rats. I. Behavioral correlates and firing repertoires. Exp Neurol 41: 461–531. [DOI] [PubMed] [Google Scholar]
- Sharp PE ( 1999) Complimentary roles for hippocampal versus subicular/entorhinal place cells in coding place, context, and events. Hippocampus 9: 432–443. [DOI] [PubMed] [Google Scholar]
- Sharp PE, Blair HT, Cho J ( 2001a) The anatomical and computational basis of the rat head direction cell signal. Trends Neurosci 24: 289–294. [DOI] [PubMed] [Google Scholar]
- Sharp PE, Tinkelman A, Cho J ( 2001b) Angular velocity and head direction signals recorded from the dorsal tegmental nucleus of gudden in the rat: implications for path integration in the head direction cell circuit. Behav Neurosci 115: 571–588. [PubMed] [Google Scholar]
- Skaggs WE, McNaughton BL, Gothard KM, Markus EJ ( 1993) An information-theoretic approach to deciphering the hippocampal code. In: Advances in neural information processing systems, Vol 5 (Hanson SJ, Cowan JD, Giles CL, eds), pp 1030–1037. San Mateo, CA: Morgan Kaufmann. [Google Scholar]
- Stackman RW, Taube JS ( 1998) Firing properties of rat lateral mammillary nuclei single units: head direction, head pitch, and angular head velocity. J Neurosci 18: 9020–9037. [DOI] [PMC free article] [PubMed] [Google Scholar]
- Stackman RW, Clark AS, Taube JS ( 2002) Hippocampal spatial representations require vestibular input. Hippocampus 12: 291–303. [DOI] [PMC free article] [PubMed] [Google Scholar]
- Taube JS ( 1995) Head direction cells recorded in the anterior thalamic nuclei of freely moving rats. J Neurosci 15: 70–86. [DOI] [PMC free article] [PubMed] [Google Scholar]
- Taube JS ( 1998) Head direction cells and the neurophysiological basis for a sense of direction. Prog Neurobiol 55: 225–256. [DOI] [PubMed] [Google Scholar]
- Taube JS, Burton HL ( 1995) Head direction cell activity monitored in a novel environment and during a cue conflict situation. J Neurophysiol 74: 1953–1971. [DOI] [PubMed] [Google Scholar]
- Taube JS, Muller RU, Ranck Jr JB ( 1990a) Head-direction cells recorded from the postsubiculum in freely moving rats. I. Description and quantitative analysis. J Neurosci 10: 420–435. [DOI] [PMC free article] [PubMed] [Google Scholar]
- Taube JS, Muller RU, Ranck Jr JB ( 1990b) Head-direction cells recorded from the postsubiculum in freely moving rats. II. Effects of environmental manipulations. J Neurosci 10: 436–447. [DOI] [PMC free article] [PubMed] [Google Scholar]
- Taube JS, Kesslak P, Cotman CW ( 1992) Lesions of the rat postsubiculum impair performance on spatial tasks. Behav Neural Biol 57: 131–143. [DOI] [PubMed] [Google Scholar]
- Touretzky DS, Redish AD ( 1996) Theory of rodent navigation based on interacting representations of space. Hippocampus 6: 247–270. [DOI] [PubMed] [Google Scholar]
- Tullman ML, Taube JS ( 1998) Lesions of the lateral mammillary nuclei abolish head direction cell activity in the anterior dorsal thalamus. Soc Neurosci Abstr 24: 1912. [Google Scholar]
- van Groen T, Wyss JM ( 1990) The postsubicular cortex in the rat: characterization of the fourth region of the subicular cortex and its connections. Brain Res 529: 165–177. [DOI] [PubMed] [Google Scholar]
- van Groen T, Wyss JM ( 1995) Projections from the anterodorsal and anteroventral nucleus of the thalamus to the limbic cortex in the rat. J Comp Neurol 358: 584–604. [DOI] [PubMed] [Google Scholar]
- van Groen T, Kadish I, Wyss JM ( 1999) Efferent connections of the anteromedial nucleus of the thalamus of the rat. Brain Res Rev 30: 1–26. [DOI] [PubMed] [Google Scholar]
- Vogt BA, Miller MW ( 1983) Cortical connections between rat cingulate cortex and visual, motor, and postsubicular cortices. J Comp Neurol 216: 192–210. [DOI] [PubMed] [Google Scholar]
- Wiener SI ( 1993) Spatial and behavioral correlates of striatal neurons in rats performing a self-initiated navigation task. J Neurosci 13: 3802–3817. [DOI] [PMC free article] [PubMed] [Google Scholar]
- Wyss JM, van Groen T ( 1992) Connections between the retrosplenial cortex and the hippocampal formation in the rat: a review. Hippocampus 2: 1–11. [DOI] [PubMed] [Google Scholar]