

Abstract
We have investigated possible roles of the Eph family receptor tyrosine kinases and their ligand ephrins in the developing primary olfactory nerve pathway in the moth Manduca sexta. The Manduca homologs of the Eph receptor (MsEph) and ephrin ligand (MsEphrin) are most closely related to Drosophila Eph and ephrin, respectively. In situ labeling with Fc-fusion probes, in which IgG Fc was linked to the extracellular domain of MsEph (Eph-Fc) or MsEphrin (ephrin-Fc), reveals that both Eph receptors and ephrins are expressed on axons of olfactory receptor cells (ORCs) during their ingrowth to the primary center, the antennal lobe (AL). Interestingly, Eph receptors and ephrins are differentially distributed among identifiable glomeruli such that glomeruli with high receptor staining show little or no ligand staining, and vice versa, suggesting a complementary Eph-ephrin expression by subsets of ORC axons innervating a particular set of glomeruli. In contrast, neither Eph receptors nor ephrins are detectable in intrinsic components of the AL. In vitro, ephrin-Fc and Eph-Fc, when present homogeneously in the substratum, inhibit neurite outgrowth from olfactory epithelial explants. Moreover, in patterned substratum, neurites growing on the standard substratum turn or stop after encountering the test substratum containing ephrin-Fc. These in vitro observations indicate that MsEphrin can act as an inhibitor/repulsive cue for ORC axons. Based on results from in situ and in vitro experiments, we hypothesize that Eph receptors and ephrins mediate axon sorting and fasciculation through repulsive axon-axon interactions.
Keywords: Eph receptor, ephrin, olfactory system, sensory mapping, axon guidance, insect
Introduction
Eph receptor tyrosine kinases (RTKs) and their ligands, ephrins, have been shown to play key roles in spatial patterning of the nervous system by directing the migration of cells and growth cones (for review, see Flanagan and Vanderhaeghen, 1998; O'Leary and Wilkinson, 1999; Holder and Klein, 1999; Wilkinson, 2001). Although there is increasing evidence for attractive-adhesive functions, Eph signaling initiated by ephrin binding generally evokes a repulsive response, preventing neurons and growth cones expressing Eph receptors from entering inappropriate regions (Wilkinson, 2001). Although this signaling has been implicated in a diverse array of developmental processes, its function is best characterized in organizing the retinotectal-retinocollicular projection. In this system, retinal axons and their target region express EphA receptors and ephrin-As, respectively, in complementary gradients along the anterior-posterior axis (Cheng et al., 1995; Drescher et al., 1995). A number of studies have shown that Eph-ephrin interactions provide positionally specific repulsive signals required for retinotopic map formation (Nakamoto et al., 1996; Monschau et al., 1997; Frisen et al., 1998; Brown et al., 2000; Feldheim et al., 2000).
In contrast to the graded and continuous organization of retinal projections, the primary olfactory pathway is arranged in a non-graded and discontinuous manner. The olfactory map is formed by the convergence of the axonal projections of olfactory receptor cells (ORCs) expressing a particular odorant receptor (OR), which are widely scattered within an area of the sensory epithelium, onto a specific set of glomeruli in the primary center (Ressler et al., 1994; Vassar et al., 1994; Mombaerts et al., 1996; Wang et al., 1998; Gao et al., 2000; Vosshall et al., 2000). The molecular mechanisms underlying the sorting and guidance of ORC axons are not fully understood (Key and St. John, 2002), but, Eph receptors and ephrins are thought to be important. Many Eph receptors and ephrins are expressed in the developing rat primary olfactory pathway, with dynamic spatiotemporal patterns (St. John et al., 2000, 2002; St. John and Key, 2001). Because the Eph-ephrin expression and the axonal projection patterns are highly complex, the actual roles of these molecules are just beginning to be characterized. A recent study, however, suggests that ephrin-As, through differential expression in distinct subpopulations of ORC axons, participate in targeting of like axons (Cutforth et al., 2003).
Here, we describe the initial characterization of Eph receptor-ephrin signaling in the olfactory system of the moth Manduca sexta. We have identified Manduca homologs of the Eph receptor and ephrin, MsEph and MsEphrin. In situ labeling with Fc-fusion affinity probes shows that both the Eph and ephrin proteins are expressed on ORC axons in a complementary manner during ORC axon ingrowth and glomerulus formation. In contrast, neither Eph nor ephrin is detected in the targets of ORC axons. In vitro studies using olfactory sensory explants reveal that MsEphrin acts as a repulsive-inhibitory factor for ORC neurites. Our results suggest that in the Manduca ORC projections, axonally expressed Eph receptors, and ephrins may mediate segregation of Eph-positive and ephrin-positive axons through repulsive interaxonal interactions.
Materials and Methods
Animals and reagents. Manduca sexta (Lepidoptera: Sphingidae) were reared in the departmental insect rearing facility on an artificial diet on a long-day photoperiod regimen (17 hr light/7 hr dark) at 26°C, as described previously (Sanes and Hildebrand, 1976a). Metamorphic adult development proceeds over 18 stages, each stage lasting 1-4 d, beginning at the time of pupation and ending with the emergence of the adult moth. Pupae were staged by the criteria described by Tolbert et al. (1983) and Oland and Tolbert (1987), based on morphological changes in the structures visible through the cuticle under a dissecting microscope with bright illumination. Animals were anesthetized on ice before dissection. All chemicals and antibodies were purchased from Sigma (St. Louis, MO) and Jackson ImmunoResearch (West Grove, PA), respectively, unless otherwise indicated.
Cloning and sequence analyses of cDNAs. Total RNA isolated from antennae or brains of stage 6 pupae was used as the template for reverse-transcription PCR with degenerate oligo primers. The primers for Eph were designed against amino acid sequences within the catalytic domain that are conserved in the Eph family RTKs but not found in unrelated RTKs: Q/HFDHPN (5′-CAITTYGAYCAYCCNAAY-3′) and MLDCW (5′-CCARCARTCNARCAT-3′). The primers for ephrin were designed based on an ephrin-like sequence (ce-1480) found in Bombyx mori (Bombyx Genome Database, University of Tokyo, Tokyo, Japan); YKDYYFI (5′-TAYAARGAYTAYTAYTTYAT-3′) and CCKPED (5′-TCYTCNGGYTTRCARCA-3′). The DNA fragments produced by PCR amplification were subcloned into the vector pSTBlue-1 and sequenced. Clones with high-sequence homology to Drosophila Eph and ephrin were used to screen a Manduca antenna cDNA library. This library was constructed by generating oligo-dT-primed double-stranded cDNA from 5 μg of poly(A+) RNA isolated from stage 5 antennae and then packaging the cDNA into the Lambda ZAPII vector (Stratagene, La Jolla, CA). [α - 32P]dCTP-labeled probes were generated by random priming and hybridized under standard high-stringency conditions. After three rounds of screening, multiple positive phage clones were chosen (8 for Eph and 16 for ephrin) and in vivo excised as pBluescript SK(-) phagemids. After an initial restriction analysis showed that all the clones for each gene showed a similar pattern, the longest clone from each was chosen for sequencing. The sequence of the coding region was confirmed from both strands. All sequencing procedures were performed in the core facility of the university.
The deduced amino acid sequences were analyzed with protein domain-motif search programs online. To construct phylogenetic trees, amino acid sequences for several Eph receptors and ephrin ligands were retrieved through the National Center for Biotechnology Information (NCBI) web server and aligned using CLUSTAL W (Thompson et al., 1994) on the European Bioinformatics Institute online service with minimal manual adjustments. Phylogenetic relationships were determined on PHYLIP 3.5 (Phylogeny Inference Package) (version 3.5c; J. Felsenstein, 1993; Department of Genetics, University of Washington, Seattle, WA).
Genomic Southern blot analyses. Manduca genomic DNA was isolated from pupal thoracic tissue using DNAzol (Invitrogen, Gaithersburg, MD). Twenty μg of DNA was digested with either EcoRI or XbaI at 37°C overnight, separated on 0.8% agarose gel, and transferred to a nylon membrane. Two different conditions were used: high-stringency hybridization in a solution containing 50% formamide with the final wash at 50°C and low-stringency hybridization in 28% formamide-based solution with the final wash at 37°C. Washed blots were exposed to x-ray films at -80°C overnight.
Expression of recombinant proteins. The expression plasmids for the Fc-fusion affinity probes in which the extracellular domain (ECD) of MsEph or MsEphrin was linked to human IgG Fc were constructed based on the protocol originally described by Capon et al. (1989) and later modified by Winslow et al. (1995). Briefly, cDNAs corresponding to the coding region of human IgG and MsEph ECD or MsEphrin ECD were ligated into a mammalian protein expression vector pCEP4 (Invitrogen). All cDNAs were generated by PCR amplification using suitable 5′ and 3′ primers with added restriction sites and a proofreading DNA polymerase (Expand High Fidelity PCR system; Roche, Basel, Switzerland). The template for IgG Fc was kindly provided by Genentech (San Francisco, CA) (Winslow et al., 1995). Clones stably expressing Fc-fusion probes were established in 293-EBNA cells (Invitrogen), a cell line derived from human embryonic kidney (HEK) cells that have been transformed with the Epstein-Barr nuclear antigen (EBNA). These cells were grown in DMEM with 10% fetal bovine serum and 250 μg/ml G418 (Invitrogen). The plasmid DNA was transfected into 293-EBNA cells using Lipofectamine (Invitrogen), and hygromycin B (200 μg/ml)-resistant clones were individually selected and expanded. Clones were screened for expression of the Fc-fusion probe by ELISA, and those showing the highest titer were selected for further expansion.
To collect Fc-fusion probes, culture medium was switched to a serum-free medium (OptiMEM I; Invitrogen), conditioned for 5-6 d and stored at -20°C until purification. Approximately 500 ml of pooled conditioned medium was applied to a protein-A column (HiTrap rProtein A FF; Amersham Pharmacia Biotech, Piscataway, NJ) using a peristaltic pump at a flow rate of 1 ml/min. The column was washed with 10 ml of 0.2 m phosphate buffer, pH 7.0, and then the bound proteins were eluted with 0.1 m citrate buffer, pH 4.0. The eluants were buffer-exchanged with standard PBS, pH 7.0, and concentrated at 4°C using a centrifugal filter unit (Biomax-5; Millipore, Bedford, MA) to a final concentration of 1-2 mg/ml. Purified Fc-fusion probes were analyzed by SDS-PAGE combined with colloidal blue staining or immunoblotting with horseradish peroxidase (HRP)-conjugated goat anti-human IgG Fc.
An expression plasmid for the full-length MsEph protein tagged C-terminally with green fluorescent protein (GFP) was constructed by ligating cDNAs encoding MsEph and GFP in tandem into pCEP4. The template for GFP cDNA was obtained from Gene Therapy Systems, Inc. HEK293-EBNA cells stably expressing MsEph-GFP (Eph-GFP/293-EBNA) were cloned as described above.
Binding assays. After serum-starvation overnight, Eph-GFP/293-EBNA cells were treated with ephrin-Fc 1 μg/ml in HBSS with 0.5 mg/ml BSA at room temperature for 60 min, washed, and fixed in 4% paraformaldehyde (PFA). After blocking with PBS containing 0.2% Triton X-100, 5% NGS, and 3% BSA, cells were incubated with rabbit anti-GFP antibody (Santa Cruz Biotechnology, Santa Cruz, CA) with 1:200 dilution at room temperature for 60 min. The ephrin-Fc and anti-GFP antibody bound to the cells were visualized by Cy3-conjugated anti-human IgG Fc and fluorescein-conjugated anti-rabbit antibodies (both made in goats), respectively. Negative control experiments included (1) treatment of mock-transfected cells with ephrin-Fc and (2) treatment of Eph-GFP/293-EBNA with Fc.
Phosphotyrosine assays. Eph-GFP/293-EBNA cells were serum-starved overnight and incubated with the clustered or unclustered forms of ephrin-Fc (30-300 ng/ml in OptiMEM I) or Fc (300 ng/ml) at 37°C for 10 min. Clustering was done by incubating the ephrin-Fc or Fc with polyclonal anti-human IgG Fc antibodies (molar ratio 5:1) at room temperature for 30 min. After the treatment, cells were lysed on ice for 30 min. After removing the insoluble fraction and determining the protein concentration, cellular lysates containing equal amounts of proteins were incubated with anti-GFP antibodies (2 μg/ml) at 4°C for 2 hr. The immune complex was precipitated by incubating with protein A-sepharose at 4°C for 2 hr, separated by SDS-PAGE, and probed with monoclonal antiphosphotyrosine antibody (PY-20; Transduction Laboratories, Lexington, KY). The blots were then reacted with HRP-conjugated goat anti-mouse IgG, followed by color development with 4-chloro-1-naphthol.
Northern blot analyses. Northern blot analyses were performed according to Nighorn et al. (1998). Briefly, total RNA samples isolated from animals at various metamorphic stages as well as with poly(A+)-selected RNA from stage 4-5 animals were electrophoresed on 1% agarose-formaldehyde gels and transferred onto nylon membranes. The membranes were hybridized with [α - 32P]dCTP-labeled probes for 16 hr at 42°C, washed in a series of increasing stringency conditions, and then placed on x-ray films at -80°C for ∼2 weeks. Two different probes for each MsEph and MsEphrin were tested separately. To confirm equal loading of RNA in each lane, the membranes were later probed for Manduca eukaryotic elongation factor (EEF).
In situ RNA hybridization. Digoxigenin-labeled riboprobes were generated by run-off in vitro transcription using T7- or T3-RNA polymerase. The riboprobes were then alkaline-hydrolyzed to an average size of 200 nucleotides (Angerer and Angerer, 1992). The brains of stage 6 pupae were dissected into PBS, fixed in 4% PFA at 4°C for 4-6 hr, sectioned on a cryostat at 20 μm thickness, and mounted on glass slides (Superfrost Plus; Fisher Scientific, Houston, TX). The antennae from the stage 5/6 animals were dissected into PBS, immediately frozen in liquid propane, sectioned at 20 μm, and fixed in 4% PFA at room temperature for 5 min. Both brain and antenna sections were treated with 0.1% diethylpyrocarbonate in PBS and hybridized with riboprobes at 58°C for ∼40 hr. After a series of washes, the specimens were incubated with alkaline phosphatase-labeled sheep anti-digoxigenin IgG (Roche) (1:1000) at 4°C overnight. The staining was developed with nitroblue tetrazolium and 5-bromo-4-chloro-3-indolyl-phosphate (both from Invitrogen). Images were digitally photographed using Spot software (Diagnostic Instruments, Inc., Sterling Heights, MI) and a CCD camera mounted on a Nikon E600 microscope.
Detection of Eph receptor and ephrin ligand proteins in the Manduca brain using the Fc-fusion probes. Brains from pupae at various stages were dissected in cold PBS, blocked with 1× blocking solution (BS) (PBS with 10% NGS and 2% BSA) for 1 hr, and incubated with ephrin-Fc, Eph-Fc, or Fc (5 μg/ml in BS) on a shaker for 4 hr. The incubation time of 4 hr was chosen based on pilot experiments as a compromise between the retention of the tissue morphology in the antennal lobe (AL) and the penetration of the probes. The specimens were then washed in PBS four to six times for 30-60 min each and fixed in 4% PFA overnight. On the next day, the tissue was blocked with 0.5× BS with 0.2% Triton X-100 (0.5× BS-T) for 1 hr, followed by incubation with Cy3-conjugated goat anti-human Fc antibody (1:250 in 0.5× BS-T) overnight. The samples were washed in PBS with 0.2% Triton X-100 (PBS-T) 5 times for 1 hr each, and then processed for either vibratome sections or whole-mount brain preparations. For vibratome sections, samples were embedded in 7% low-melting temperature agarose, sectioned at 100 μm, and mounted with 60% glycerol. For whole brain preparations, the samples were dehydrated in an ethanol series and mounted with methyl salicylate.
To determine the spatial relationship between the ORC axons and the receptor-ligand localization, the Fc-fusion probe labeling was coupled with anterograde tracing of ORC axons. ORC axons were first mass-filled with dextran dye by placing a small piece of crystallized dextran-tetramethylrhodamine (molecular weight, 3000; lysine-fixable; Molecular Probes, Eugene, OR) onto the surface of the olfactory epithelium through a small hole made on the outer cuticle of live pupae at stage 5. After dye application, the removed piece of cuticle was put back in place and sealed with melted wax. The pupae were then returned to the incubator, allowing the dye to spread in axons for 48 hr. The brains were then dissected at stage 6 and processed for Fc-fusion probe labeling in whole-mount preparations as described above, except that Alexa 488-conjugated goat anti-IgG Fc was used. Serial optical sections cut in the frontal plane were imaged with a laser-scanning confocal microscope, at an interval of 2.5 μm spanning from the anterior tip to the posterior end of the AL. For each sample, all optical sections were printed out as a montage and the labeling patterns of Eph-Fc and ephrin-Fc were compared in sections at similar anteroposterior positions.
Stage 6 brains were also double-labeled for Eph receptors-ephrin ligands and Manduca fasciclin II (MfasII). First, the tissue was incubated with Fc-fusion probes as described above, fixed, and vibratome-sectioned. The tissue was then incubated with the anti-Mfas II antibody (C3), generously supplied by Dr. James B. Nardi (University of Illinois) (1992), at 1:4000 dilution overnight. The labeling was visualized with Cy3-conjugated goat anti-human Fc and fluorescein-conjugated goat anti-mouse IgG (both 1:250 dilutions). All procedures for in situ protein detection were performed at 4°C unless otherwise noted.
Preparation of the olfactory epithelial explants and double labeling with Fc-fusion probes and tubulin immunocytochemistry. Explants were prepared from the sensory epithelium of the antenna of stage 4 pupae according to a protocol optimized for the Manduca antennal explant (Oland et al., 2003). Briefly, the antenna was dissected out in ice-cold PBS, and the nonsensory side of the epithelium (Sanes and Hildebrand, 1976b) was discarded. The remaining sensillar (sensory) side of the epithelium was treated with 0.05 mg/ml collagenase and 0.2 mg/ml dispase in HBSS at 37°C for 2 min, and then triturated gently with a glass pipette five to eight times, yielding explants of 0.1-0.2 mm in diameter. Explants were grown in the supplemented L15 medium (Hayashi and Hildebrand, 1990) in miniwells made in 35 mm plastic culture dishes in a humidified incubator with normal air at 26°C. Miniwells were made by cutting 8 mm holes in the bottom of 35 mm plastic culture dishes and then sealing glass coverslips to the bottom with Sylgard (Dow Corning, Midland, MI). Unless otherwise noted, miniwells were exposed to 50 μl of the standard substrate solution containing 167 μg/ml concanavalin A (conA) and 1.7 μg/ml mouse laminin for 2 hr at 37°C in a humidified incubator.
The expression of Eph receptors and ephrins in the explant was examined by Fc-fusion probe binding. After 2 d in culture, the explants were briefly rinsed in a HEPES-buffered saline and incubated with 10 μg/ml Eph-Fc, ephrin-Fc, or Fc protein in HBSS containing BSA (1 mg/ml) for 60 min at 4°C. The explants were then washed in HBSS, fixed with 4% PFA, and blocked with 2% NGS and 0.5% Triton X-100 in PBS for 1 hr. The samples were then incubated with monoclonal anti-tubulin antibody (clone TUB-1A2, T-9028; Sigma) (1:800 in the blocking solution) for 2 hr. Bound Fc-fusion probes and anti-tubulin antibodies were visualized with Cy3-conjugated anti-human Fc IgG (1:250) and Alexa 488-conjugated anti-mouse IgG (1:500) (both made in goats). Samples were mounted with 60% glycerol in PBS and photographed using confocal microscopy.
Neurite outgrowth assay. Neurite outgrowth was examined in explants grown on a uniform substratum to which ephrin-Fc, Eph-Fc, or Fc was bound. Culture dishes were coated with the substrate solution containing the ephrin-Fc, Eph-Fc, or Fc protein at a concentration of 0.01-0.1 μm, in addition to conA/laminin. In several experiments, the ephrin-Fc and the Fc were clustered as described above (see Materials and Methods for phosphotyrosine assays). The explants were grown for 38-40 hr, after which they were fixed in 4% PFA and subjected to immunocytochemistry for tubulin as described above.
Neurite outgrowth was quantified by determining the total area occupied by the neurites in a method similar to that described by Bilsland et al. (1999). The criteria to choose explants for quantitative analyses were the original diameter being 90-110 μm and good isolation from surrounding explants. Five explants in each dish that fulfilled these criteria were randomly selected for quantification. To quantify the area occupied by the neurites, grayscale images of the explants stained for tubulin were converted to binary images by a segmentation function using Simple32 software (Compix Inc.. Cranberry Township, PA). This function sets the upper and lower density limits of the object such that the epithelium and the neurites are highlighted but background staining is not. Once the segmentation range was defined, any pixel falling within this range in the image was automatically counted. The area occupied by the original explant was subtracted from the automatic pixel count. For statistical analyses, the neurite area was then normalized to the area of the explant body. In each experiment, two dishes were prepared for each substrate group, and experiments were repeated three times. Because there were no statistically significant differences in Fc-control groups between experiments, all measurements in each substrate group were pooled, and the data were analyzed by a one-way ANOVA and Tukey's multiple comparison (InStat; GraphPad Software, Inc., San Diego, CA).
Because tubulin is not a specific marker for neurons, the cellular processes labeled with tubulin immunocytochemistry could include both neuronal and non-neuronal components. To verify that the area measured in the tubulin-stained explants represents the area actually occupied by the neurites, the quantification was performed also in explants that were labeled using immunocytochemistry with antibodies against HRP. These antibodies have been shown to label neuron-specific molecules in insect neurons (Jan and Jan, 1982; Snow et al., 1987) and were also useful in reliably identifying Manduca antennal neurons in culture (Torkkeli and French, 1999). The neurite area was compared between tubulin-labeled explants and HRP-labeled explants, grown on Fc-substrate (0.3 μm) or on ephrin-Fc-substrate (0.3 μm with clustering). The neurite areas measured in HRP-labeled explants, for both Fc and ephrin-Fc groups, were not significantly different from those measured in tubulin-labeled explants, although the former tended to be slightly larger than the latter. Therefore, it was decided that the area quantification performed with tubulin labeling sufficiently represented the neurites.
Substratum choice assay. Substratum choice assays were performed according to Birgbauer et al. (2001) with modifications. Briefly, ephrin-Fc, Eph-Fc, or Fc was diluted in sterile distilled water to a concentration of 0.01 or 0.1 μm, to which Cy3-anti-human IgG Fc was added at 1:500 as a fluorescent marker for later visualization of the test substratum. One microliter drops of this mixture were placed on miniwells (average six drops per miniwell) of the culture dish that had been coated with conA/laminin as described. The dishes were then incubated at 37°C for 2 hr, and the miniwells were rinsed with sterile water. Explants from stage 4 animals grown for 2 d on these spotted dishes were stained for tubulin as described above. Images of the explants were then taken using confocal microscopy; only explants with radial neurite outgrowth, at least initially, and with neurites reaching the border between the standard and test substrata, were selected for analyses. Neurites that had reached the border were scored as either crossing over the border/growing onto the test substratum (non-responding), or stopping at or turning away from the border (responding) (Birgbauer et al., 2001). The mean response rate per explant was obtained by dividing the number of “responding” neurites by the total number of neurites that had reached the border and then calculating the mean of all explants analyzed. The statistical test for mean response rate was performed as described for neurite outgrowth assays.
Image processing. The images of the fluorescently labeled specimens were captured using a confocal laser scanning microscopy on PCM 2000 (Nikon, Tokyo, Japan) equipped with a Nikon E800 microscope and argon, green He-Ne, and red He-Ne lasers, together with appropriate filter combinations. Digital images were processed with Simple32 (Compix Inc.), Corel Photopaint, and Corel Draw (Corel Corp., Ottawa, Canada). Digital images were edited solely to enhance contrast, to merge images from doubly labeled tissue, and to provide pseudocolors.
Results
MsEph and MsEphrin encode a Manduca homolog of Eph receptor and ephrin ligand
Through cDNA library screening, we isolated cDNAs of 4.3 and 2.5 kb that encode a putative Eph receptor (named MsEph) and an ephrin (named MsEphrin), respectively (GenBank accession numbers AY327249 and AY327250). MsEph and MsEphrincDNAs have single open reading frames (ORFs) encoding proteins of 1011 and 780 amino acids, respectively. The sizes of these cDNAs are significantly smaller than those detected in Northern blot analyses (see below), suggesting that they are not full-length cDNAs. However, because both the MsEph and MsEphrin ORFs are flanked by multiple in-frame and out-of-frame stop codons, the isolated cDNAs likely include the entire ORFs.
The predicted MsEph protein contains all of the hallmark features of Eph receptors (Fig. 1) (Flanagan and Vanderhaeghen, 1998). The extracellular domain of MsEph is composed of an N-terminal globular domain, a cysteine-rich region, and two fibronectin type III repeats. The intracellular domain contains the juxtamembrane motif Y(I/V)DPxTYEDP, a tyrosine kinase catalytic domain, and a sterile α motif (SAM) domain. In addition, three residues at the C terminus, FLV, fit the consensus motif of F-x-V/I that binds to one group of PDZ (postsynaptic density 95/Discs large/zone occludens-1) domain-containing proteins such as p55, Tiam-1, and AF-6 (Songyang et al., 1997). Notably, the catalytic domain and the ligand-binding domain are highly homologous to the corresponding domains of D-Eph (Fig. 1A,B). Because MsEph is equally similar to the A and B subclass Eph receptors, both overall and in each domain, MsEph cannot readily be classified as either an EphA or EphB. Instead, MsEph may represent a prototypical Eph family member as suggested for D-Eph (Scully et al., 1999).
Figure 1.
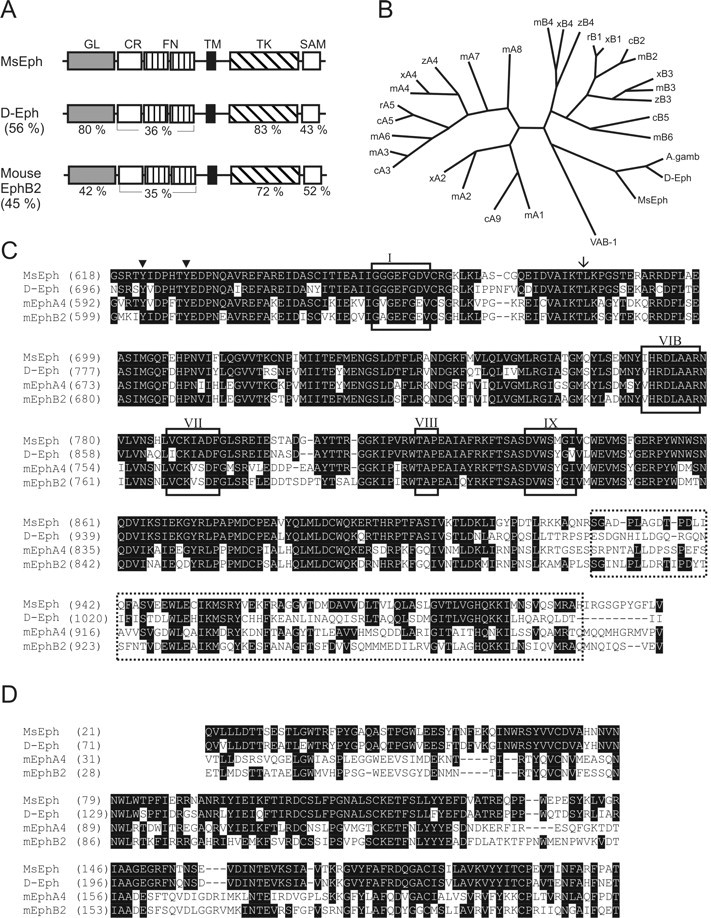
Alignment of MsEph with Eph receptors of Drosophila and mouse. A, Schematic diagram comparing MsEph with D-Eph and mouse EphB2. Domains and motifs of MsEph were searched using SMART (Simple Modular Architecture Research Tool; Schultz et al., 1998) at the Expert Protein Analysis System (ExPASy) proteomics server of the Swiss Institute of Bioinformatics and InterPro Scan at the European Bioinformatics Institute server (Apweiler et al., 2001). Domains are denoted by (from N terminus) GL, globular (ligand binding) domain; CR, cystein-rich domain; FN, fibronectin type-III repeats; TM, transmembrane segment; TK, protein tyrosine kinase domain; and SAM, sterile α motif. Amino acid identities between corresponding domains are shown in percent. The overall identity is indicated in parentheses. Identities between MsEph and mouse EphA4 (data not shown) are very similar to those between MsEph and EphB2. B, Phylogenetic tree of Eph receptors. For clarity, when possible, human, rat, and chick homologs are omitted, focusing on only mouse, Xenopus, and zebrafish genes. Inclusion of all known homologs does not alter the basic tree structure. The length of lines correlates with the degree of amino acid differences. A. gamb, Anopheles gambiae; c, chick; m, mouse; r, rat; x, Xenopus laevis; z, zebrafish; VAB-1, C. elegans Eph. C, D, Amino acid alignment of the MsEph cytoplasmic portion (C) and the MsEph ligand binding domain (D) with D-Eph, mouse EphA4 and EphB2. Sequences were aligned using CLUSTAL W. Identical amino acids are represented in white lettering on black background. C, Cytoplasmic portion. MsEph contains the highly conserved catalytic subdomains (van der Geer et al., 1994). Rectangles with Roman numerals indicate subdomain I, catalytic loop VIB, subdomains VII and IX; also, an invariant lysine residue within subdomain II is marked by an arrow. The SAM domain is marked by a dotted box. D, Amino acid alignment of MsEph ligand binding domain with D-Eph, mouse EphA4, and EphB2. Sequences of EphA4, EphB2, and D-Eph were obtained using GenBank accession numbers M68513, L25890, and AF132028, respectively.
The sequence analyses of the MsEphrin protein predict an N-terminal secretion signal peptide and a GPI-anchoring motif near the C terminus (Fig. 2A). In addition, MsEphrin shows high similarity in its central region to the conserved ephrin core domain that is believed to mediate receptor binding. This core domain of MsEphrin is highly homologous to Dephrin (83% identity) (Fig. 2A,B), consistent with the high similarity in the ligand-binding domain between MsEph and D-Eph. The overall structure of MsEphrin, however, differs from Dephrin; MsEphrin has a putative GPI-anchoring motif whereas Dephrin is predicted to be a transmembrane protein (Bossing and Brand, 2002). Also, MsEphrin appears not to have the N-terminal extension of ∼200 amino acids present in Dephrin. Whereas the core domain of MsEphrin is marginally more similar to B-subclass ephrins, its overall structure as a GPI-anchored protein resembles the A-subclass ephrins.
Figure 2.

Alignment of MsEphrin with other members of the ephrin family and genomic Southern blot analyses for MsEph and MsEphrin. A, Structural comparison of MsEphrin with Dephrin and a vertebrate A class and B class ephrin. Numbers in percentages indicate the amino acid identity of the ephrin core domain of MsEphrin to those in other ephrins. Conserved ephrin core domains (hatched boxes), GPI-anchoring motifs (arrowheads), transmembrane segments (black boxes), and secretion signal peptides (shaded boxes) are indicated. B, Phylogenetic tree analysis of the ephrin core domains. Species are indicated as c, chick; m, mouse; x, Xenopus laevis; z, zebrafish. C. elegans ephrins, EFN1-4, are all GPI-anchored. See also the legend for Figure 1, C and D. C, Amino acid alignment of the ephrin core domain. Identical residues are printed in white lettering on black background. Asterisks indicate the conserved cysteine residues that have been crystallographically shown to form disulfide bonds (Himanen et al., 2001; Toth et al., 2001). Numbers are amino acid positions. Sequences of Dephrin, mouse ephrin-A4, and -B2 were obtained from GenBank accession numbers AF216287, U90663, and U16819, respectively. D, Genomic Southern blot analyses for MsEph and MsEphrin. Lanes 1-4 are for MsEph and lanes 5-8 are for MsEphrin. Restriction endonucleases used are indicated as E, EcoRI and X, XbaI. Hybridization-washing conditions are indicated as either high-stringency (high) or low-stringency (low) at the bottom. Note that two bands clearly seen at 2 and 3 kb in MsEphrin low-stringency condition (lane 8) were also detected, albeit faintly, in the high-stringency condition (lane 6).
The relationships between MsEph and other Eph receptors and between MsEphrin and other ephrins are illustrated in the phylogenetic tree analysis (Figs. 1C, 2C). MsEph, together with D-Eph, mosquito Eph, and Caenorhabditis elegans VAB-1, segregates from the A- and B-subclass of vertebrate Eph receptors (Fig. 1C). The tree structure for ephrins is remarkably similar to the Eph cladogram; MsEphrin shows a close relation to Dephrin and separates from both the A and B subgroups of vertebrate ephrins (Fig. 2C).
In vertebrates, the Eph and ephrin families consist of many members. In contrast, invertebrate species seem to have one Eph and one or a few ephrins. The Drosophila genome appears to encode only a single Eph and ephrin (Scully et al., 1999; Adams et al., 2000; Bossing and Brand, 2002; Dearborn et al., 2002), whereas C. elegans has four GPI-anchored ephrins and one Eph (George et al., 1998; Chin-Sang et al., 1999; Wang et al., 1999). A search in the recently completed Anopheles gambiae genome sequence detected a single Eph-like gene that is highly similar to D-Eph (M. Kaneko, unpublished data). In Manduca, we have found so far one Eph and one ephrin. The question of whether the Manduca genome contains additional members was addressed by genomic Southern blot analyses. For both MsEph and MsEphrin, the low-stringency condition yielded a hybridization pattern that was indistinguishable from that in the high-stringency condition (Fig. 2D). This observation suggests an absence of genomic regions closely related to MsEph or MsEphrin. However, the possibility that more than one Eph and/or ephrin exist in Manduca cannot be excluded.
Analyses of deduced amino acid sequences predict that MsEph and MsEphrin are members of Eph and ephrin families. To further confirm that they have the biochemical properties of these families, we tested whether MsEphrin binds and activates MsEph. For this purpose, we used the ECD of MsEphrin fused with IgG Fc (ephrin-Fc), and full-length MsEph tagged with GFP (Eph-GFP). Fc-fusion probes such as receptor-Fc and ligand-Fc have proven very useful for biochemically identifying ephrin ligands, characterizing Eph receptor activation by ephrins, localizing their binding partners in situ, and perturbing normal Eph-ephrin interactions in vitro and in vivo (Davis et al., 1994; Winslow et al., 1995; Gale et al., 1996; Ciossek et al., 1998; Mann et al., 2002). An example of the purified Fc-fusion probes that we generated is shown in Figure 3A. Western blot analyses of Eph-GFP are shown in Figure 3B. Under nonpermeabilizing conditions, Eph-GFP/293-EBNA cells were positively labeled with the ephrin-Fc; this labeling coincided with the GFP immunoreactivity (Fig. 3C). In contrast, no significant labeling was observed in Eph-GFP/293-EBNA cells incubated with Fc (Fig. 3C) or in mock-transfected cells incubated with ephrin-Fc (data not shown). These results suggest that MsEphrin can bind MsEph present on the cell surface.
Figure 3.
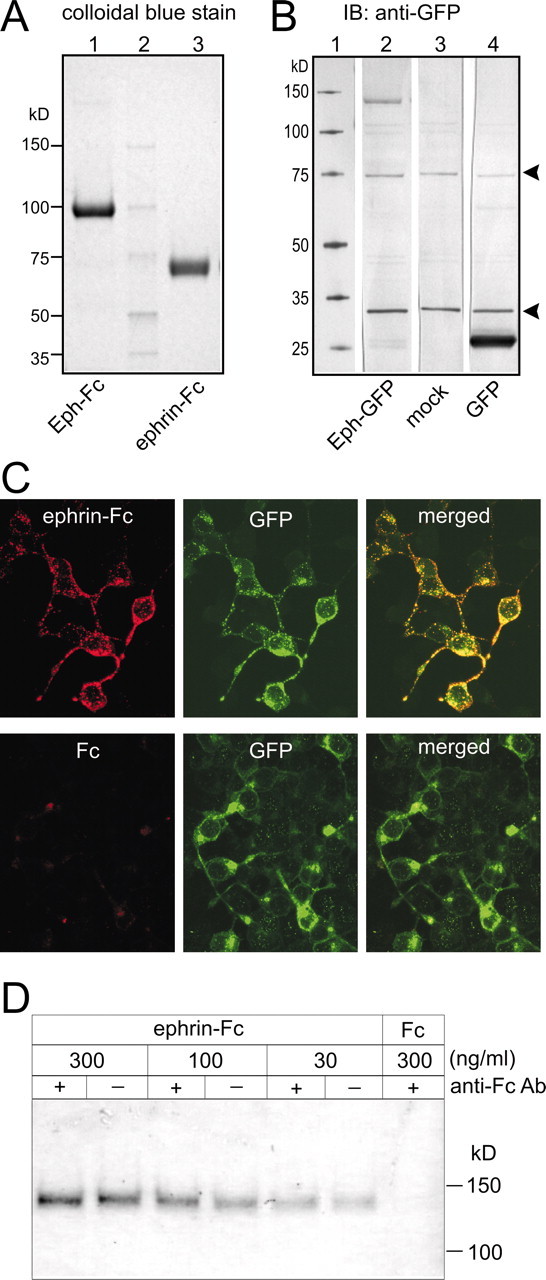
The ECD of MsEphrin can bind the MsEph ECD and induce tyrosine phosphorylation. A, Characterization of Fc-fusion affinity probes by polyacrylamide gel electrophoresis. Colloidal blue gel staining of Eph-Fc (lane 1) and ephrin-Fc (lane 3) proteins purified from conditioned media of stably expressing 293-EBNA cell lines. These proteins were also recognized by anti-Fc antibodies in Western blot analyses (data not shown). Lane 2 contains molecular mass markers. B, Immunoblots with anti-GFP antibodies using cellular lysates from COS-7 cells transiently transfected with Eph-GFP/pCEP4 (lane 2), unfused GFP/pCEP4 (lane 3), and empty pCEP4 (lane 4). Two thin bands at 75 and 30 kDa (marked with arrowheads) are likely to be nonspecific antibody binding because they are also seen in mock-transfected cells. The band at ∼140 kDa in lane 2 likely represents the Eph-GFP protein, whereas the one at just above 25 kDa in lane 4 is likely the unfused GFP protein. These positions are in good agreement with theoretical molecular masses calculated from their amino acid sequences (137 kDa for Eph-GFP and 27 kDa for unfused GFP). C, Ephrin-Fc binding to 293-EBNA cells expressing Eph-GFP. Ephrin-Fc labeling and immunocytochemical detection of GFP are shown in red and green, respectively. Eph-GFP proteins appear to localize in the peripheral region of cells including processes. A punctate expression pattern of Eph-GFP is consistent with observations in previous studies in which vertebrate Eph receptors were expressed in heterologous cell lines. Binding of Fc to Eph-GFP/293-EBNA cells was negligible. Mock-transfected cells exhibited no significant staining with either ephrin-Fc or anti-GFP antibodies (data not shown). D, Increase in MsEph phosphotyrosine level after ephrin-Fc treatment. Eph-GFP/293-EBNA cells were incubated with ephrin-Fc in either the clustered form (+) or unclustered form (-). Clustering was done by incubating ephrin-Fc with polyclonal anti-Fc antibodies (molar ratio 1:5) at room temperature for 30 min. Numbers indicate the concentration of ephrin-Fc and Fc in nanograms per milliliter. Lysates of treated cells were precipitated with anti-GFP antibodies, which were then electrophoresed and immunoblotted with anti-phosphotyrosine antibodies.
Whether MsEphrin binding to MsEph leads to activation of MsEph was tested in phosphotyrosine assays. In these assays, treatment of the Eph-GFP/293-EBNA cells with ephrin-Fc increased the level of phosphotyrosine in the Eph-GFP protein in a concentration-dependent manner, whereas no phosphotyrosine was detected in the cells treated with Fc alone (Fig. 3D). The clustered form of the ephrin-Fc did not significantly increase the phosphotyrosine level as compared with the unclustered form (Fig. 3D). For vertebrate Eph receptors, the clustered form of the ephrin-Fc is generally more potent in activating Eph receptors than the unclustered dimeric form (Davis et al., 1994; Gale and Yancopoulos, 1997). Yet, in particular combinations of EphA receptors and ephrin-As, the two forms of ligand are equally effective (Gale and Yancopoulos, 1997), which might be the case for the MsEph-MsEphrin interaction. However, it is possible that the C-terminal GFP-tag used in our assays disrupted clustering of MsEph proteins by interfering with homotypic SAM domain interactions (Thanos et al., 1999) and/or with recognition of the C-terminal F-L-V motif of MsEph by PDZ-domain-containing proteins (Songyang et al., 1997). In fact, functional assays using cultured olfactory explants demonstrated that clustering the ephrin-Fc did enhance its effect (see the results of neurite outgrowth assays), suggesting that MsEph proteins in the native form are maximally activated by aggregated MsEphrin proteins. Nevertheless, the results from the binding assay and the phosphotyrosine assay provide evidence supporting the hypothesis that MsEphrin can act as a ligand for MsEph.
MsEph and MsEphrin are expressed in the antenna during the period of ORC axonal growth
Northern blot analyses using antennal RNAs isolated from various stages of adult development demonstrate developmentally regulated expression of both MsEph and MsEphrin in the antenna (Fig. 4A,B). Their expression is upregulated during the first half of metamorphosis, with a peak during stages 3 through 5 and a decline afterward. Because the ORC axons grow into the AL from late stage 3 through stage 9, the temporal expression patterns of MsEph and MsEphrin in the antenna suggest their possible involvement in ORC axonal growth or pathfinding. MsEph signals are comprised of multiple bands, showing the existence of at least three splice variants. Multiple probes from the cloned cDNA fragment all recognize the same three bands, suggesting that the variability lies outside of the open reading frame. Indeed, although only a single band appears to be present for MsEph, it is so large that slightly different splice variants would probably not be detectable on a Northern blot. Therefore, the possible existence of different protein isoforms for either the MsEph or the MsEphrin cannot be ruled out based on the current evidence.
Figure 4.
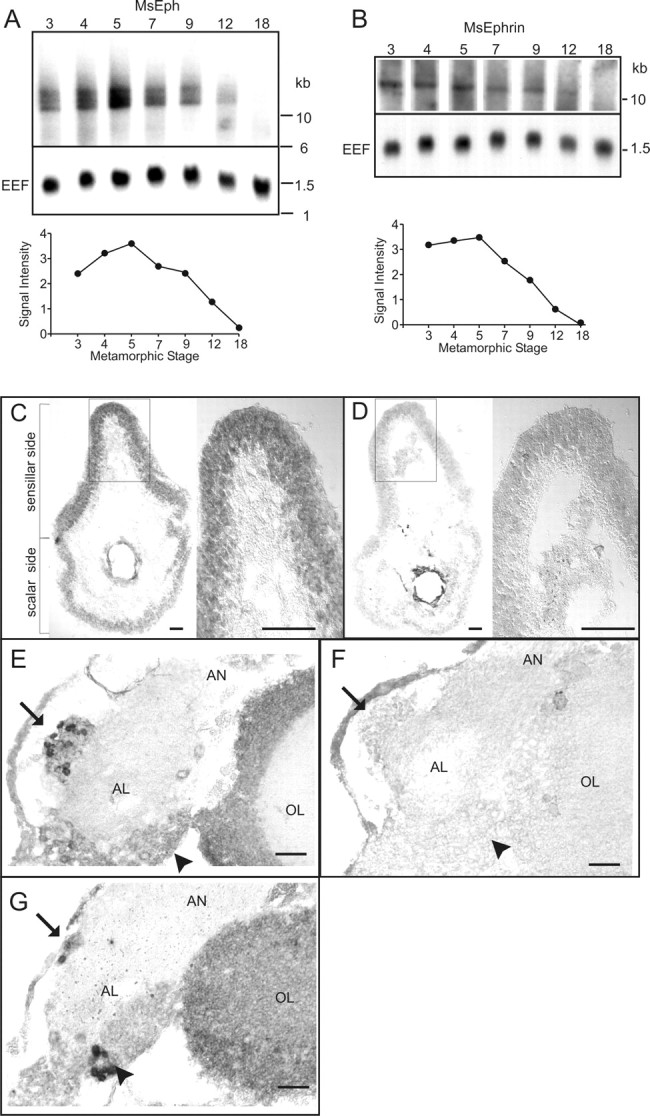
Analyses of MsEph and MsEphrin expression using Northern blots and in situ RNA hybridization. A, B, Northern blot analyses reveal developmental regulation in MsEph and MsEphrin expression in the antenna during metamorphosis. Blots hybridized with random-primed probes made against the entire MsEph or MsEphrin cDNA are shown here. Hybridization with probes made against a part of the catalytic domain of MsEph, and the core domain of MsEphrin produced indistinguishable patterns (data not shown). The Manduca EEF was used as a positive control. The graphs show relative intensities of MsEph and MsEphrin signals at each stage and are normalized to EEF signals of the same stage. C—G, Localization of the MsEph transcripts in the primary olfactory pathway by in situ RNA hybridization. Cross-sections of the antenna (C, D) and frontal sections of the AL (E-G) from stage 6 animals were hybridized with antisense probes (C, E, G) and sense probes (D, F). In C and D, left and right panels show the whole section and higher magnification images of the boxed region, respectively. In the AL, arrows and arrowheads indicate the position of the medial and lateral AL neuron packets, respectively. E-G are dorsal up and lateral to the right. AN, Antennal nerve; AL, antennal lobe; OL, optic lobe. Scale bars, 50 μm.
In situ hybridization of riboprobes to the brain and antenna of stage 6 animals revealed that MsEph transcripts are present in the olfactory nerve pathway. In the antenna, a subset of cells in the sensillar side of the epithelium (sensory epithelium) was labeled more strongly than the cells in the scalar side (Fig. 4C,D). The positively labeled cells were distributed over the sensillar epithelium without a discernible pattern. These observations raise the possibility that MsEph is expressed by ORCs, because they are found only in the sensillar epithelium. However, it was not possible to identify these positively labeled cells as ORCs based on morphology in these specimens. In the AL, transcripts for MsEph were detected in a subset of AL neurons in both the medial group and lateral group (Fig. 4E-G). The medial group is composed mostly, if not entirely, of projection neurons, whereas the lateral group contains both local interneurons and projection neurons (Matsumoto and Hildebrand, 1981; Homberg et al., 1988). Based on their anteromedial position within the lateral group, the MsEph-positive neurons in the lateral group are likely to also be projection neurons (L. A. Oland, personal communication). Although Northern blots showed MsEphrin expression in the antenna, MsEphrin transcripts were not clearly detected above the background level in stage 5/6 antennae.
Both Eph receptors and ephrins are expressed on ORC axons
To obtain information on possible functions of MsEph and MsEphrin, it is necessary to determine where interactions of these proteins occur. To localize these proteins in the primary olfactory pathway, we used ephrin-Fc and Eph-Fc. Fc-fusion probes have been valuable tools to detect cognate receptor and ligand proteins in situ (Flanagan, 2000). Because Eph receptors bind multiple ligands and ephrins bind multiple Eph receptors, the overall distribution of ligands and receptors can be observed with Eph-Fc and ephrin-Fc, respectively (Gale et al., 1996). Because in Manduca, the presence of additional Eph receptors and ephrins cannot be excluded, and therefore Eph-Fc and ephrin-Fc might interact with other ephrins and Eph receptors in addition to MsEphrin and MsEph proteins, respectively, we refer to those detected by Eph-Fc and ephrin-Fc generically as ephrins and Eph receptors, respectively.
Eph receptors and ephrins were first detectable unambiguously in the AL at stage 4 (Fig. 5A,G) when a fair number of ORC axons had accumulated in the antennal nerve after they had begun entering the AL at late stage 3. Both the receptor and the ligand seemed to be present on ORC axons, in the antennal nerve (AN), and in the perimeter of the AL at early stage 5 (Fig. 5B,H). This perimeter region is likely to correspond to the border of neuropil-associated glial cells, through which the growing ORC axons travel (Oland et al., 1998), but the granular labeling pattern in the perimeter of the AL might also include expression by glial cells that reside in this region (neuropil-associated glia; Oland et al., 1999). No MsEph transcripts were, however, found in glial cells in the AL. During the next several stages, the intensity and the volume of the labeling increased, presumably reflecting the increase in the number of ORC axons reaching the AL. At mid stage 5 (Fig. 5C,I), both the receptor and the ligand were present on ORC axons, with stronger labeling in the axon terminal regions that have started to form small spherical aggregates called protoglomeruli (Oland et al., 1990). At this stage, the labeling patterns of the receptor and ligand were indistinguishable in the AL, except that in the male AL, the lateral pole region where the AN enters the AL was labeled more intensely for the ligand (Fig. 5I) than for the receptor (Fig. 5C). The labeling in this region may correspond to the primordium of the macroglomerular complex (MGC), male-specific glomeruli that, in adult, have three subdivisions, but has not yet compartmentalized at this stage (Rössler et al., 1998). In fact, two major subdivisions of MGC showed strong labeling for ephrins in later stages when they became morphologically identifiable (Fig. 6F). At late stage 6, when the full complement of glomeruli have formed and become discrete structural units (Oland and Tolbert, 1996), prominent labeling for both the receptor and ligand was observed in glomeruli and some of the ORC axon fascicles (Fig. 5D,J). In general, the labeling within the glomeruli appeared to be concentrated in the outer region where ORC axons form terminal arbors. Also, at this stage, it appeared that the glomeruli were not labeled uniformly across the AL; a subset of glomeruli seemed to be stained more intensely than others, and some looked unlabeled. This possible differential distribution among glomeruli was observed for both Eph receptors and ephrin ligands. After the staining intensity peaked at late stage 6 to stage 7, a remarkable decline in staining was observed at stage 8 (Fig. 5E,K), which seemed to correlate with the antennal mRNA levels demonstrated in the Northern blots. In stage 18 animals, just before eclosion, no significant level of receptor or ligand was detectable in the AL (data not shown).
Figure 5.
Distribution of the Eph receptor and ephrin proteins in the antennal lobe during early stages of adult development. Eph receptor and ephrin proteins were detected by in situ labeling with ephrin-Fc (A-E) and Eph-Fc (G-K), respectively. A, G, Stage 4; B, H, early stage 5; C, I, mid stage 5; D, J, stage 6; E, K, stage 8; F, stage 6 with Fc control probe; L, stage 6 with premixed ephrin-Fc + Eph-Fc. All images are frontal views of the AL, with dorsal up and lateral to the right. A-C and G-I are stacks of five optical sections, 2.5 μm apart, positioned approximately midway along the anterior-posterior (A-P) axis. D-F and J-L are stacks of 10 optical sections that are anterior to the middle in the A-P axis so that the shape of some glomeruli can be seen. The Fc control probe produced no significant staining in ALs from animals at stage 6 (shown in F) as well as stages 4, 5, and 8 (data not shown). Arrows in J indicate an intense staining in the overlying and adjacent perineurial sheath. Scale bars, 50 μm.
Figure 6.
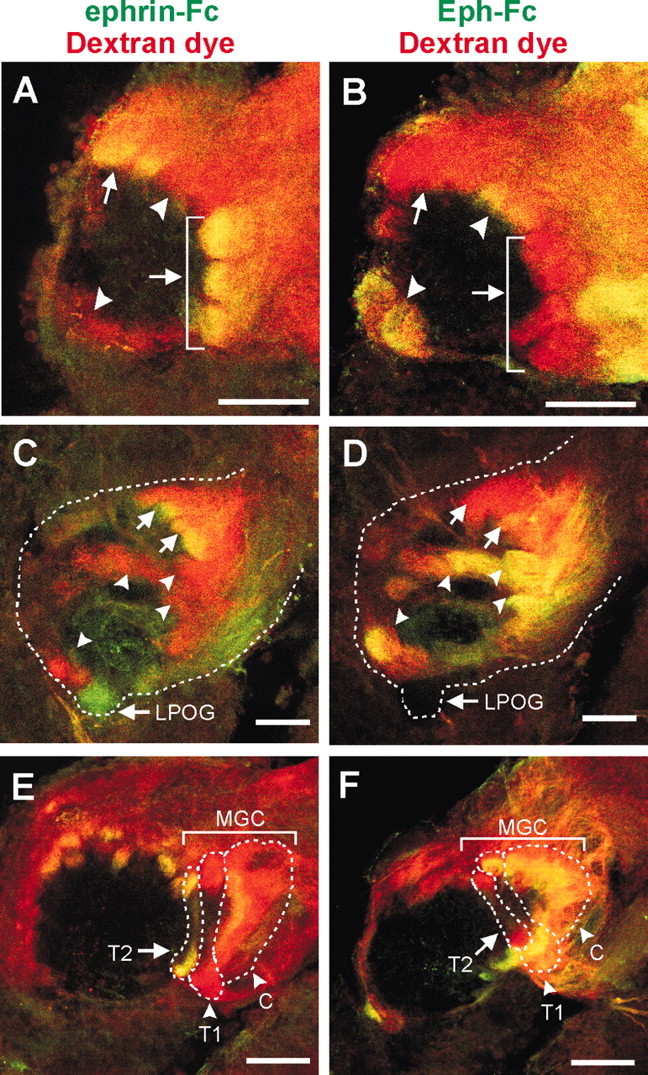
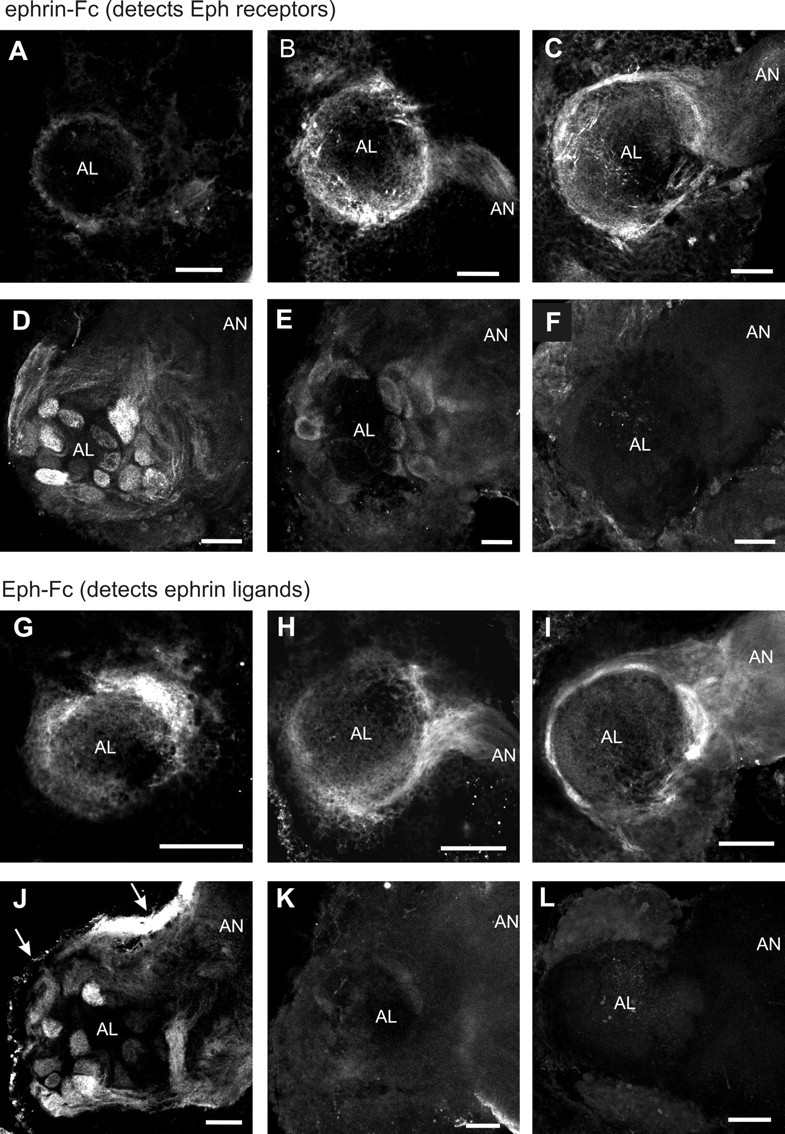
Comparison of distribution patterns between Eph receptors and ephrins in stage 6 antennal lobes. To visualize a major population of ORC axons, the axons were filled anterogradely with dextran tetramethylrhodamine (shown in red). Eph receptors and ephrins are localized with ephrin-Fc (A, C, E) and Eph-Fc (B, D, F), respectively. Arrows, Glomeruli with strong ephrin-Fc labeling and weak or no Eph-Fc labeling. Arrowheads, Glomeruli with strong Eph-Fc labeling and weak or no ephrin-Fc labeling. All images are in the frontal view, medial to the left. A, B, Anterior AL. C, D, Posterior AL. The labial pit organ glomerulus (LPOG) is exclusively innervated by sensory neurons in the labial pit organ, but not by ORCs in the antenna; therefore it was devoid of dextran-dye fill. The margin of the AL is indicated by dotted lines. E, F, The macroglomerular complex (MGC). Three subdivisions of the MGC are indicated as: C, cumulus; T1, toroid 1; and T2, toroid 2. The borders of the subdivisions are indicated by dotted lines. Scale bars, 50 μm.
No significant labeling was observed in the central neuropil region of the AL at any stage examined, suggesting that neither Eph receptors nor ephrins were present in the AL neuron dendrites. Besides the ORC axons, the ephrin ligand appeared to be strongly expressed in the perineurial sheath cells of the AN, both proximally (Fig. 5J) and distally (data not shown) along the AN. Control experiments using the unfused Fc protein showed very weak labeling in the AL (Fig. 5F) as well as other brain regions. In an additional control experiment, incubation of Eph-Fc with ephrin-Fc at an equimolar ratio before application to the brain tissue resulted in markedly reduced staining (Fig. 5L). In the higher order olfactory pathway, Eph receptors were detected in the inner antennocerebral tract (IACT) and the mushroom body calyces (data not shown). Because transcripts for MsEph were detected in a subset of AL projection neurons, many of which project their axons through the IACT and arborize in the calyces (Homberg et al., 1988), Eph receptor proteins localized in these structures may reflect the targeting of MsEph proteins to the axonal compartment.
To confirm axonal expression of Eph receptors and ephrins, we combined Fc-fusion probe labeling with anterograde ORC axon tracing using dextran tetramethylrhodamine. These double-labeling experiments show the ephrin-Fc/Eph-Fc labeling overlapping with the dextran-dye staining, confirming that the detected Eph receptors and the ephrin ligands are indeed present on ORC axons in stage 6 ALs (Fig. 6). Moreover, it is clearly seen that ephrin-Fc and Eph-Fc each labeled only a subset of glomeruli. Therefore, we next examined whether the glomeruli innervated by Eph-positive axons are different from those innervated by ephrin-positive axons.
Distribution of Eph receptors and ephrins on ORC axons is complementary
To determine the distribution of Eph-positive and ephrin-positive glomeruli, we compared AL samples labeled with ephrin-Fc/dextran dye to those labeled with Eph-Fc/dextran dye. A total of 50 ALs (26 with ephrin-Fc and 24 with Eph-Fc) were suitable for the comparison, based on adequate filling of ORC axons with dextran dye and the proper plane of optical sections. Because of the relatively small number as well as stereotypical locations and shapes of glomeruli in the moth AL (Rospars and Hildebrand, 2000), it was possible to unambiguously identify 29 glomeruli, of a total of 63. Examples of these identified glomeruli are shown in several different planes along the anterior to posterior axis of the AL in Figure 6. These comparisons revealed strikingly distinct localization patterns between Eph receptors and the ephrins. The receptor- and ligand-positive glomeruli were distributed in a complementary manner; glomeruli with a strong receptor labeling showed only a weak or no ligand labeling, and vice versa. Some of the most prominent examples were the labial pit organ glomerulus (LPOG) and the MGC. The LPOG is easily identifiable because of its large size and ventralmost location in the AL. Because the LPOG is exclusively innervated by sensory neurons residing in the pit organs of the labial palps, but not by ORCs in the antenna (Kent et al., 1986, 1999), this glomerulus was unlabeled by antennal ORC axon tracing with the dextran dye. Axons innervating the LPOG appeared to express Eph receptors but not ephrins (Fig. 6C,D). As described above, the MGC comprises three compartments: cumulus, toroid 1, and toroid 2. The ligand was strongly detected in the cumulus and toroid 1 but was undetectable in toroid 2, whereas the receptor expression was intense in toroid 2, weak in the cumulus, and undetectable in toroid 2 (Fig. 6E,F). It should be noted that although these expression patterns were complementary, they were not mutually exclusive. For example, the cumulus was strongly ephrin-positive but also weakly Eph-positive (Fig. 6F).
Fasciclin II and Eph-ephrin may provide combinatorial signals for axon sorting
To gain further insights into possible interplay between Eph-ephrin signaling and other molecules mediating axon-axon communication, we combined Fc-fusion probe labeling in the stage 6 AL with Manduca fasciclin II (MfasII) immunocytochemistry. Fasciclin II is a member of the immunoglobulin-related superfamily of cell adhesion molecules (CAMs) with structural similarity to vertebrate N-CAM (Cunningham et al., 1987) and O-CAM (Yoshihara et al., 1997). The transmembrane isoform of Mfas II has been shown to be expressed by a subset of ORC axons that segregate from Mfas II-negative axons in the sorting zone and innervate a specific set of glomeruli (Rössler et al., 1999; Higgins et al., 2002), suggesting its involvement in axonal sorting through homophilic adhesion. The double-labeling experiments revealed that the Eph-positive or the ephrin-positive glomeruli were distributed in a partially overlapping pattern with MfasII-positive glomeruli (Fig. 7). In the ephrin-Fc/Mfas II double labeling, for example, some glomeruli were labeled only for Eph receptors, some were predominantly MfasII-positive (shown in green), and yet others apparently expressed both. In addition, among those expressing both Eph receptors and Mfas II, each glomerulus appeared to be labeled in a different shade from one another, varying from yellow to orange, suggesting that the relative expression levels of Eph receptors and/or Mfas II varies among the Eph-positive glomeruli (Fig. 7A). Similar results were observed for the distribution of ephrin-Mfas II positive glomeruli (Fig. 7B).
Figure 7.
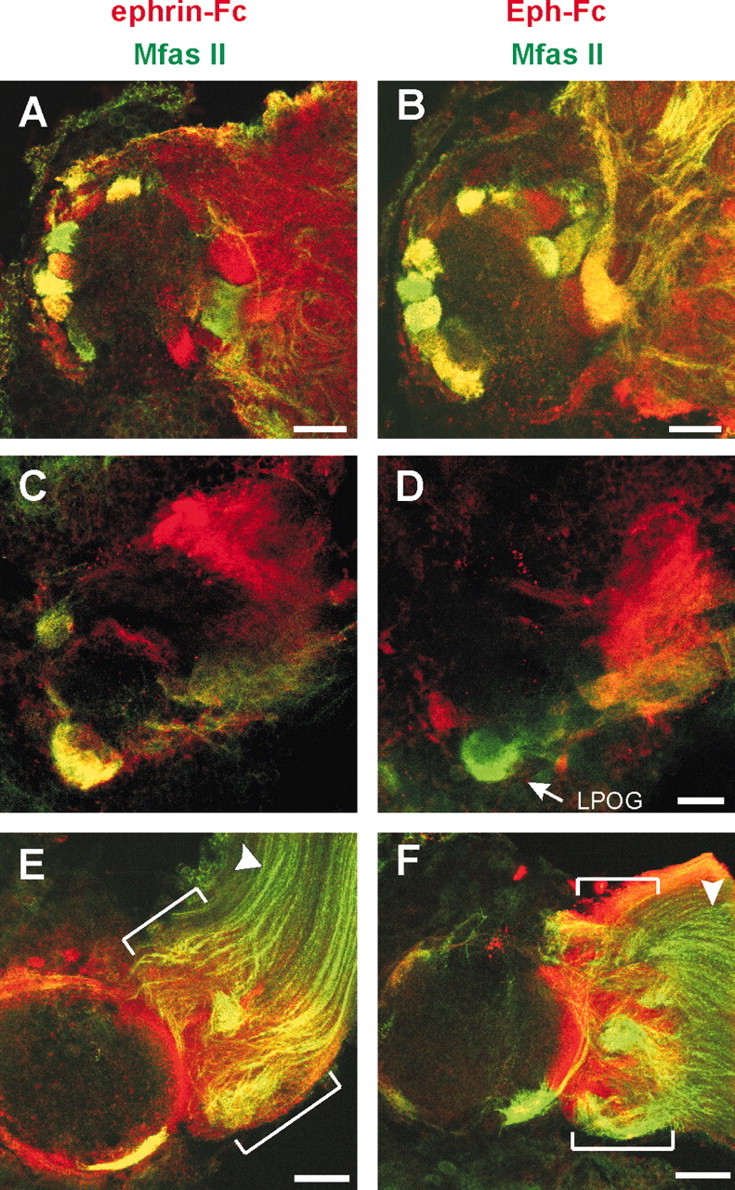
Double labeling of the AL for Manduca fasciclin II (Mfas II) and Eph receptors or ephrins. Labeling with ephrin-Fc (A, C, E) and Eph-Fc (B, D, F) is shown in red; and Mfas II immunocytochemistry is in green. All images are in the frontal view, medial to the left. A, B, Slightly anterior to the middle of the stage 6 AL, stack of eight optical sections (2.5 μm apart). C, D, Posterior plane of the stage 6 AL, stack of four optical sections. The LPOG is easily identifiable because of Mfas II immunoreactivity (Higgins et al., 2002) as well as its size and position (see also Fig. 6C). The complementary expression pattern of Eph receptors and ephrins is seen at the lateral AL where the ephrin-Fc labeling is stronger at the dorsal-medial part, whereas the Eph-Fc labeling is located at the ventral-lateral part. E, F, Mid stage 5 AL. Stack of four optical sections located midway along the A-P axis. Labeling with ephrin-Fc and Eph-Fc is stronger in the axon sorting zone (SZ), an AN region just before the ORC axons enter the AL (brackets). The AN segment distal to the SZ (arrowheads) is weakly labeled for Eph receptors and ephrins, whereas the positive staining for Mfas II confirms the presence of ORC axons and integrity of the specimen in this region. Scale bars, 50 μm.
Double labeling for Eph-ephrin with Mfas II revealed another interesting feature, as shown in Figure 7, E and F. Labeling with ephrin-Fc and Eph-Fc was very weak in the distal AN segment where positive Mfas II staining verified the presence of ORC axons, whereas the labeling was clearly seen in the AN segment just before axons enter the AL. This proximal AN segment seems to correspond to the sorting zone (Oland et al., 1998; Rössler et al., 1999), where ORC axons undergo dramatic changes in direction of growth, establish new axonal associations, and exit in fascicles destined for particular glomeruli. The increase in labeling intensity in the sorting zone suggests that expression of cell-surface Eph receptors and ephrins might be upregulated on ORC axonal segments once they reach this region.
Extracellular domains of MsEph and MsEphrin inhibit neurite outgrowth
To begin to understand the function of Eph-ephrin interactions in the primary olfactory pathway, we chose to manipulate Eph-ephrin signaling in cultured neurons. For this, we first tested whether explants of olfactory epithelium express Eph receptors and ephrins. As shown in Figure 8, neurites of explants were positively labeled with both ephrin-Fc (Fig. 8A) and Eph-Fc (Fig. 8C), whereas plain Fc gave little staining (Fig. 8E). When compared with labeling with anti-tubulin antisera (Fig. 8B,D,F), it appears that both Eph receptors and ephrins were present on all or almost all neurites along their entire length. This is in contrast to the labeling patterns in situ in which only a subset of ORC axons is positive for the receptor or the ligand, and may reflect dysregulation of protein expression in vitro. Such dysregulation has been noted for cell surface molecules such as L1 and EphBs in spinal cord explants (Imondi et al., 2000) as well as for Mfas II in Manduca olfactory explants (M. Kaneko, unpublished observation). Nevertheless, the positive ephrin-Fc and Eph-Fc labeling of explant neurites provided the basis for further in vitro experiments.
Figure 8.
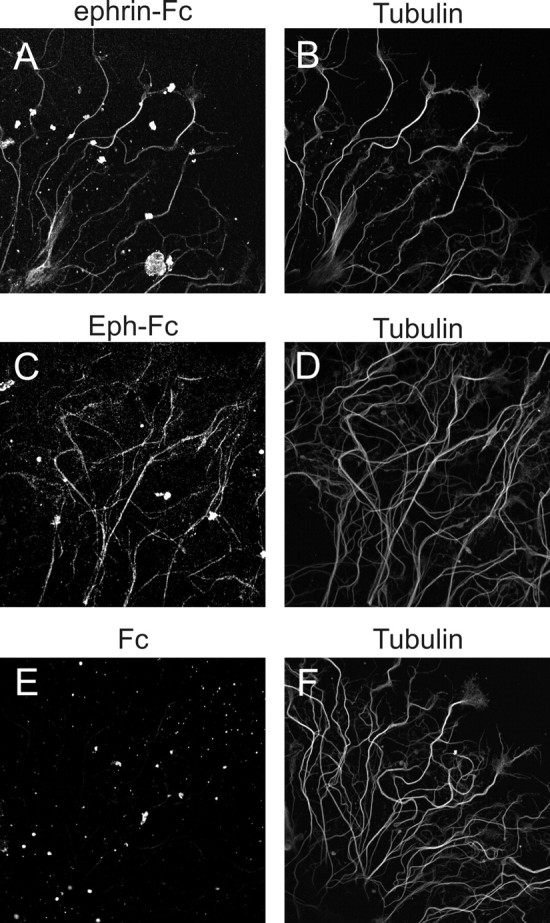
Detection of Eph receptors and ephrin ligands expressed by neurites of olfactory epithelial explants. Explants of stage 4 antennae were cultured for 2 d and examined for binding of ephrin-Fc (A), Eph-Fc (C), and Fc (E) onto neurites of olfactory epithelial explants, combined with simultaneous labeling for tubulin (B, D, F). Bound Fc-fusion probes were visualized with Cy3-anti-human Fc and tubulin with Alexa 488-anti-mouse IgG. Most of neuritis are positively labeled with ephrin-Fc (compare A, B) and Eph-Fc (compare C, D), whereas very little binding of Fc was observed (E).
We examined the effect of MsEph and MsEphrin, presented as the exogenous Fc-fusion probes, on neurite outgrowth from antennal explants. Although neurite outgrowth on the dish coated with the Fc-fusion probes was not significantly different from that on standard con-A/laminin substrate, neurite extension was significantly reduced in explants in the presence of substrate-bound Eph-Fc or ephrin-Fc (Fig. 9). In addition to a dose-dependence, the outgrowth inhibition by ephrin-Fc was dependent on the form presented. The clustered form of ephrin-Fc was more effective in inhibiting the outgrowth than was the unclustered form (p < 0.05, clustered vs unclustered) (Fig. 9I). For the Eph-Fc, however, clustering did not enhance its inhibition of outgrowth (p = 0.1; clustered vs unclustered). The enhanced inhibitory effect of the clustered form of ephrin-Fc seems inconsistent with the result of the phosphotyrosine assays in which the clustered form was not more effective than the unclustered form of ephrin-Fc. Those assays however, included a C-terminal GFP-tag that may have disrupted the clustering of MsEph proteins. In addition, Manduca olfactory explants express both Eph receptors and ephrin ligands, making it possible that endogenous Eph-ephrin interactions are already in place between adjacent neurites. Thus, outgrowth inhibition by ephrin-Fc could result from either blocking endogenous interactions or overactivating Eph receptors. Although we cannot distinguish between these possibilities, the observation that the clustered form of ephrin-Fc was more potent than the dimerized form suggests that activation of Eph receptors underlies outgrowth inhibition by ephrin-Fc. As to the effect of Eph-Fc, it could arise from interfering with endogenous Eph-ephrin interactions or from excessively activating ephrin (reverse) signaling. Signal transduction through ephrin-A ligands has been demonstrated in cell culture experiments (Davy et al., 1999; Davy and Robbins 2000; Huai and Drescher, 2001), and ephrin-As expressed on axons have been implicated in axon targeting of vomeronasal and normal ORC projections in mice (Knöll et al., 2001; Cutforth et al., 2003). At this moment, however, we cannot speculate on the mode of Eph-Fc action.
Figure 9.
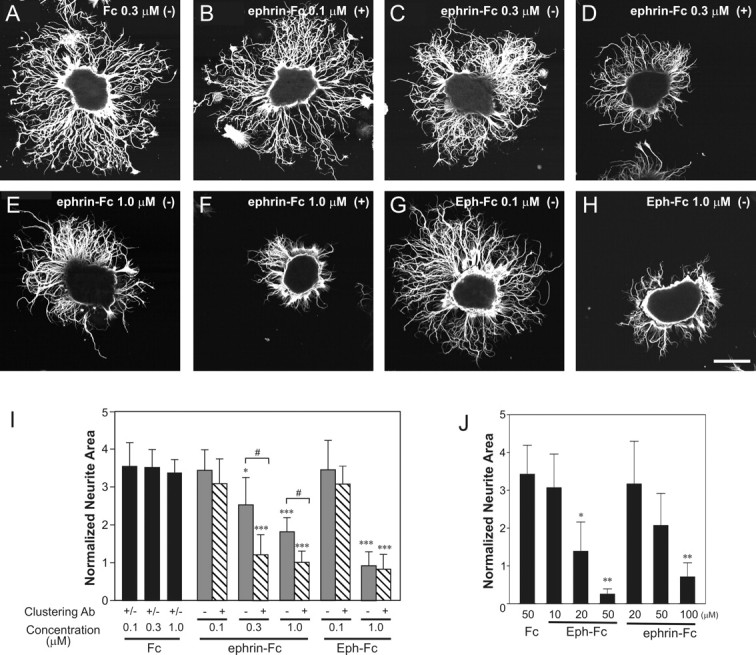
Inhibition of neurite outgrowth in olfactory epithelial explants by ephrin-Fc and Eph-Fc. A-H, Neurite outgrowth of explants grown on the dish coated with a substrate containing Fc (A), ephrin-Fc (B-F), and Eph-Fc (G, H) were visualized by tubulin immunocytochemistry. Plus and minus signs in parentheses indicate the clustered and unclustered forms, respectively. Scale bar, 100 μm. I, Quantitative analysis of neurite outgrowth assays in which Fc, ephrin-Fc, and Eph-Fc were substrate-bound. The neurite area measurements from clustered Fc and unclustered Fc groups were pooled because there was no significant difference between these two groups. Sample numbers are 28-30 explants per condition. Data are presented as mean ± SD. *p < 0.05 and ***p < 0.01 compared with the same concentration of Fc. #p < 0.01 between the clustered and unclustered form at the same concentration of ephrin-Fc. J, Quantification of neurite outgrowth in assays in which Fc, ephrin-Fc, and Eph-Fc were mixed into the culture medium. The data represent the average of 15 explants (± SD). *p < 0.05 and **p < 0.01 compared with Fc 50 μm group.
In another set of experiments, neurite outgrowth was examined in explants that were treated with the ephrin-Fc or Eph-Fc in a different manner; Eph-Fc or ephrin-Fc was mixed in the culture medium, instead of being bound to the substratum. Using a similar method, St. John et al. (2000) demonstrated that EphA5-Fc, but not ephrinA5-Fc, reduced axonal outgrowth in the olfactory epithelial explant from the embryonic rat. In the present study, when added to the culture medium, not only Eph-Fc but also ephrin-Fc significantly decreased neurite outgrowth in a dose-dependent manner as compared with the Fc control (Fig. 9J). An approximately twofold higher concentration of ephrin-Fc than that of Eph-Fc was needed to reduce the outgrowth to the same degree (100 vs 50 μm).
Neurites of olfactory epithelial explants avoid growing onto MsEphrin-containing regions
In the neurite outgrowth assays described above, the Eph and ephrin proteins were present homogeneously in the substratum, whereas in vivo, they are localized in limited areas that axons encounter during navigation. To more closely mimic the in vivo condition, we used substratum choice assays. Patterned substrata were prepared by spotting a small amount of Eph-Fc, ephrin-Fc, or Fc protein onto the miniwells, and the behavior of neurites from olfactory epithelial explants was analyzed at the border region at which neurites were confronted with the substratum containing one of the Fc-fusion probes. Two different concentrations of Eph-Fc and ephrin-Fc were tested in this assay: 0.01 and 0.1 μm. These concentrations were chosen because they were not inhibitory in the neurite outgrowth assays. The neurites appeared unaffected by the Fc-containing substratum, freely crossing the border and growing onto the Fc-spotted region (Fig. 10A). On the other hand, when neurites encountered the ephrin-Fc-containing substratum, they made turns at the border and grew less on the ephrin-Fc-spotted region (Fig. 10B-D). Although the behavior of the neurites showed considerable variation at the border of the substratum made with 0.01 μm ephrin-Fc (Fig. 10B), in cultures spotted with 0.1 μm ephrin-Fc, very few neurites crossed and grew onto this substratum (Fig. 10C,D). Interestingly, when explants landed within the ephrin-Fc-spotted region, their neurites appeared to freely cross the border and grow from inside to outside of the test substratum (Fig. 10E, ephrin-Fc[in→out]). In contrast to ephrin-Fc, Eph-Fc appeared not to affect neurite behavior (Fig. 10F); most neurites that reached the border crossed it and grew onto the Eph-Fc-spotted region in a pattern similar to the growth in the Fc control experiment. The observation of unaffected growth in the Eph-Fc-substratum group and in the ephrin-Fc[in→out] group indicates that the avoidance behavior of neurites is specific to ephrin-Fc and that the border between normal and test substrata constitutes no physical barrier.
Figure 10.
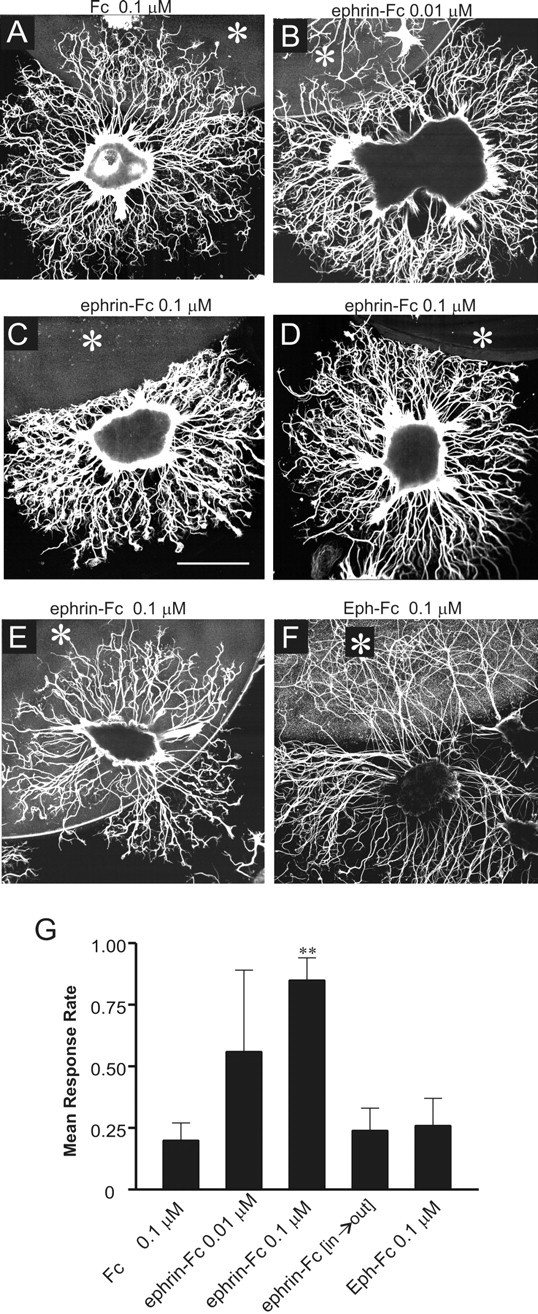
Substratum choice assays. A-F, Response of explant neurites to the test substrate containing Fc (A), ephrin-Fc (B-E), or Eph-Fc (F). Although neurites showed varied responses to the test region made with a substrate containing 0.01 μm ephrin-Fc (B), most neurites responded to the region with higher ephrin-Fc (C, D). Both neurites encountering the ephrin-Fc substratum early in their growth (C) and those that do so after growing for a substantial length (D) exhibited a high response rate, suggesting that the sensitivity of the neurites to the ephrin ligand is not related to their growth stage. Neurites growing on the test substratum show little response to the standard substrate after encountering it, freely crossing the border, and extending on the standard substratum (E). Eph-Fc-containing substratum appeared to elicit no significant neurite responses (F). Asterisks in A-E indicate test substratum regions. Scale bar: C (for A-F), 100 μm. G, Quantitative analysis of neurite responses in substratum choice assays. The response rate per explant is a fraction of the responding neurites (stopping or turning at the border between test and standard substrata). Data are presented as the average (± SD) of 10-12 explants per each group. **p < 0.01 compared with the Fc control group.
These results were quantified for each substratum type by examining the ratio of neurites responding to the border to the total neurites reaching the border (Fig. 10G). The mean response rates per explant for Fc, Eph-Fc, and ephrin-Fc[in→out] were not significantly different from each other (n = 20 explants per substratum type). Because of the large variability in response rates for individual explants (ranging from 15 to 68%), the mean response rate of the ephrin-Fc 0.01 μm group did not statistically differ from that of the Fc control group. In contrast, the mean response rate of the ephrin-Fc 0.1 μm group was significantly greater than that of the Fc control group (p < 0.01). Thus, the substratum choice assays show that neurites of olfactory epithelial explants specifically avoid the region containing the extracellular domain of MsEphrin.
Discussion
This study examined a potential role for Eph receptors and their ligands in the developing primary olfactory pathway of Manduca sexta. We identified cDNAs encoding an Eph receptor (MsEph) and an ephrin ligand (MsEphrin), which are most homologous to Drosophila Eph and ephrin, respectively. Expression of both Eph receptors and ephrins are observed in ORC axons, but are undetectable in their targets during the period of axon ingrowth to the AL. The population of glomeruli innervated by Eph-positive axons appears complementary to that innervated by ephrin-positive axons. In vitro, neurites of olfactory epithelial explants showed decreased outgrowth on homogenous ephrin-Fc or Eph-Fc containing substratum. In substratum choice assays, explant neurites avoided growing onto areas containing ephrin-Fc. These results suggest that repulsive interactions between Eph- and ephrin-bearing axons can mediate aspects of ORC axon sorting.
Localization of Eph and ephrin proteins was examined using an in situ protein labeling technique with Fc-fusion probes. This technique provides advantages such as high specificity and capability of detecting all interacting partners, but is less sensitive than immunocytochemistry (Flanagan, 2000). Several lines of evidence support the presence of both Eph and ephrin proteins on ORC axons. First, the labeling intensity increases in the AL after many ORC axons have entered the AL. Second, labeling patterns during stages 5-7 for both Eph receptors and ephrins in the AL are consistent with morphological development of ORC axons, including ORC axon terminals coalescing to form protoglomeruli at stage 5 and prominently fasciculated axons terminating mostly in the outer half of glomeruli at the later stage (Oland and Tolbert, 1996). Third, the decline and disappearance of protein labeling coincide with temporal changes in the antennal mRNA level. Fourth, the Eph-ephrin labeling in the AL overlaps with the ORC axon anterograde tracing. During stages mid 5-7, cells that would interact with ORC axons (glial cells and AL neuron dendrites) lack clear labeling with Fc-fusion probes. These Eph-ephrin localization patterns suggest that Eph-ephrin interactions should occur between axons during stages mid 5-7.
What effect does interaxonal Eph-ephrin interaction mediate? One clue comes from the observation that the distribution of Eph-positive and ephrin-positive glomeruli is complementary among identifiable glomeruli. This pattern suggests that ORC axons strongly expressing Eph receptors segregate from ephrin-bearing axons through repulsive responses. It should be noted, however, that we currently do not know (1) expression patterns in the glomeruli that were unidentifiable and (2) whether any glomeruli are both Eph- and ephrin-negative, because our analyses focused on positively labeled glomeruli and Eph-Fc/ephrin-Fc double labeling was not possible. In addition, as the detection method used does not allow us to resolve Eph-ephrin expression in individual axons, it is not clear whether all axons innervating Eph- and ephrin-positive glomeruli express Eph receptors and ephrins, respectively.
Although axonal colocalization of Eph receptors and ephrins has been observed in several neural populations such as RGCs (Cheng et al., 1995; Marcus et al., 1996; Brennan et al., 1997; Monschau et al., 1997; Connor et al., 1998; Hornberger et al., 1999), ORCs (St. John et al., 2000, 2002; St. John and Key, 2001), and spinal motoneurons (Iwamasa et al., 1999; Eberhart et al., 2000), its functional significance is not well understood. One model proposes that ephrin-As expressed in RGC axons modulate sensitivity of EphA receptors to tectal ephrin ligands (Dütting et al., 1999; Hornberger et al., 1999). Another hypothesis is that EphB receptors and ephrin-Bs expressed in retinal axons in complementary dorsoventral gradients mediate intraretinal pathfinding through repulsive reverse signaling (Birgbauer et al., 2000, 2001). The idea of Eph-ephrin repulsion mediating axon sorting in the Manduca olfactory pathway is in some way related to the latter case. This mode of action might also exist in other systems.
To test whether Eph-ephrin interaction indeed elicits inhibitory/repulsive responses in ORC axons, we examined the effects of exogenous MsEph and MsEphrin on neurites of olfactory epithelial explants using two sets of assays, neurite outgrowth and substratum choice assays. In substratum choice assays, neurites of explants that landed within the test substratum grew well on it. This is similar to previous observations in culture assays of the retinotectal system. Temporal retinal axons can grow well on a homogenous membrane carpet made of either anterior or posterior tectum, yet they avoid posterior membrane lanes in stripe assays in which they are given a choice between anterior and posterior tectal membranes (Walter et al., 1987). Although the interpretation of neurite responses to ephrin-Fc-substratum is complicated by the coexpression of Eph receptors and ephrins on neurites, our substratum choice assays clearly demonstrate that MsEphrin can act as a repellent for olfactory explants. However, in contrast to the in situ expression, most, if not all, explant neurites seem to express Eph receptors and ephrins, which presumably have caused rather uniform neurite responses in our culture assays. Therefore, we were unable to show differential responses among sensory neurites, which would be a stronger piece of evidence for our model. These results support out hypothesis about a general inhibitory role for Eph receptor-ephrin interactions, but the dysregulation of protein expression in explant cultures makes it impossible to show subsets of cells behaving differentially as would be expected in vivo.
Eph-Fc and ephrin-Fc labeling in the sorting zone (SZ) was consistently stronger than in the more distal portion of the AN. This labeling pattern might result from the segregation of ORC axons into Eph-positive and ephrin-positive bundles, which would condense cell surface Eph receptors and ephrins reactive to Fc-fusion probes. Alternatively, surface expression of Eph and ephrin proteins might be upregulated once axons reach the SZ. Spatially regulated expression of receptors for guidance cues is well known in midline navigation of commissural axons, including vertebrate EphB1 (Imondi et al., 2000; Brittis et al., 2002) and TAG-1/L1 (Dodd et al., 1998) as well as Drosophila Robo (Kidd et al., 1998). The Manduca SZ is rich in glial cells, which are important for axon sorting in vivo (Rössler et al., 1999) and are capable of changing growth cone behaviors in vitro (Tucker and Tolbert, 2003). Therefore, the SZ glia might provide signals upregulating surface Eph-ephrin proteins.
Based on the results of this study, we propose a model for Eph-ephrin signaling in ORC axon sorting. Sorting is one of the prominent behaviors of ORC axons both in Manduca and rodents. In both systems, ORC axons grow out from the sensory epithelium maintaining original near-neighbor relationships. This relationship is shed and axons undergo a dramatic rearrangement at the SZ in Manduca and the nerve fiber layer in rodents. Here, axons defasciculate, sort out, and refasciculate into like-axon bundles as they project to specific topographic sites (Mombaerts et al., 1996; Whitesides and LaMantia, 1996; Rössler et al., 1999). Presumably, these processes mediate association among axons of functionally similar ORCs (i.e., expressing a particular OR), facilitating axonal targeting to specific glomeruli (Potter et al., 2001; Treloar et al., 2002). In our model, ORC axons growing in the AN segment distal to the SZ would be little affected by Eph-ephrin-mediated repulsion possibly because of low levels of expression and/or signaling. When axons reach the SZ, Eph-ephrin signaling is triggered or increased through upregulation of expression of cell surface Eph-ephrin and/or activation of transduction pathways for growth cone retraction. This, in turn, intensifies repulsive interactions between axons, segregating Eph-expressing axons from ephrin-bearing axons.
Our double-labeling experiments revealed partially overlapping, mosaic distribution between MfasII and Eph-ephrin among glomeruli across the AL. Individual glomeruli with overlapping labeling showed different shades grading from reddish orange to greenish yellow, suggesting that these molecules were expressed at various levels. This is consistent with observations that MfasII immunoreactivity was strong in some glomeruli and moderate in others (Higgins et al., 2002) and that the intensity of Fc-fusion probe labeling varied from one glomerulus to another (Fig. 5). Overall, this differential labeling appears to give each glomerulus a unique combinatorial molecular marker. Thus, Eph-ephrin, together with Mfas II and possibly other adhesion and repulsion molecules, might constitute a combinatorial signaling system for ORC axon sorting, with which differential adhesive and repulsive forces between axons determine the balance of fasciculation and segregation and determine which axons finally target specific glomeruli.
The results reported in this study present an intriguing possibility for a role of Eph receptors and ephrins in ORC axon sorting in Manduca. Further studies using gain- and loss-of-function approaches for MsEph/MsEphrin as well as identifying and characterizing other molecular components in the “combinatorial sorting system” will be necessary to elucidate a precise role of Eph-ephrin signaling. This, in turn, may provide new insight into mechanisms of organizing projecting axons into complex, discontinuously segregated patterns such as those in higher-order brain centers.
Footnotes
This work was supported by National Institutes of Health National Institute on Deafness and Other Communication Disorders Grant DCO4292. We are indebted to Drs. Leslie Tolbert, Lynn Oland, and Nick Gibson for technical advice, insightful discussions, and critical review of this manuscript. We thank Chad Collmann for thorough review of this manuscript. We also thank Mark Higgins and Eric Tucker for their advice on immunocytochemistry, Patricia Jansma for assisting confocal microscopy, Carole Turner for maintaining the Division's cell culture facility, and A. A. Osman for rearing Manduca sexta.
Correspondence should be addressed to Alan Nighorn, Arizona Research Laboratories Division of Neurobiology, Room 611, Gould-Simpson Building, The University of Arizona, Tucson, AZ 85721-0077. E-mail: nighorn@neurobio.arizona.edu.
Copyright © 2003 Society for Neuroscience 0270-6474/03/2311523-16$15.00/0
References
- Adams MD, Celniker SE, Holt RA, Evans CA, Gocayne JD, Amanatides PG, Scherer SE, Li PW, Hoskins RA, Galle RF, George RA, Lewis SE, Richards S, Ashburner M, Henderson SN, Sutton GG, Wortman JR, Yandell MD, Zhang Q, Chen LX, et al. ( 2000) The genome sequence of Drosophila melanogaster. Science 287: 2185-2195. [DOI] [PubMed] [Google Scholar]
- Angerer LM, Angerer RC ( 1992) In situ hybridization to cellular RNA with radiolabeled RNA probes. In: In situ hybridization: a practical approach, pp 16-32. New York: Oxford UP.
- Apweiler R, Attwood TK, Bairoch A, Bateman A, Birney E, Biswas M, Bucher P, Cerutti L, Corpet F, Croning MDR, Durbin R, Falquet L, Fleischmann W, Gouzy J, Hermjakob H, Hulo N, Jonassen I, Kahn D, Kanapin A, Karavidopoulou Y, Lopez R, Marx B, Mulder NJ, Oinn TM, Pagni M, Servant F, Sigrist CJA, Zdobnov EM ( 2001) The InterPro database, an integrated documentation resource for protein families, domains and functional sites. Nucleic Acids Res 29: 37-40. [DOI] [PMC free article] [PubMed] [Google Scholar]
- Bilsland J, Rigby M, Young L, Harper S ( 1999) A rapid method for semi-quantitative analysis of neurite outgrowth from chick DRG explants using image analysis. J Neurosci Methods 92: 75-85. [DOI] [PubMed] [Google Scholar]
- Birgbauer E, Cowan CA, Sretavan DW, Henkemeyer M ( 2000) Kinase independent function of EphB receptors in retinal axon pathfinding to the optic disc from dorsal but not ventral retina. Development 127: 1231-1241. [DOI] [PubMed] [Google Scholar]
- Birgbauer E, Oster SF, Severin CG, Sretavan DW ( 2001) Retinal axon growth cones respond to EphB extracellular domains as inhibitory axon guidance cues. Development 128: 3041-3048. [DOI] [PubMed] [Google Scholar]
- Bossing T, Brand A ( 2002) Dephrin, a transmembrane ephrin with a unique structure, prevents interneuronal axons from exiting the Drosophila embryonic CNS. Development 129: 4205-4218. [DOI] [PubMed] [Google Scholar]
- Brittis PA, Lu Q, Flanagan JG ( 2002) Axonal protein synthesis provides a mechanism for localized regulation at an intermediate target. Cell 110: 223-235. [DOI] [PubMed] [Google Scholar]
- Brennan C, Monschau B, Lindberg R, Guthrie B, Drescher U, Bonhoeffer F, Holder N ( 1997) Two Eph receptor tyrosine kinase ligands control axon growth and may be involved in the creation of the retinotectal map in the zebrafish. Development 124: 655-664. [DOI] [PubMed] [Google Scholar]
- Brown A, Yates PA, Burrola P, Ortuno D, Vaidya A, Jessell TM, Pfaff SL, O'Leary DD, Lemke G ( 2000) Topographic mapping from the retina to the midbrain is controlled by relative but not absolute levels of EphA receptor signaling. Cell 102: 77-88. [DOI] [PubMed] [Google Scholar]
- Capon DJ, Chamow SM, Mordenti J, Marsters SA, Gregory T, Mitsuya Hm Byrn RA, Lucas C, Wurn FM, Groopman JE, Broder S, Smith DH ( 1989) Designing CD4 immunoadhesins for AIDS therapy. Nature 337: 525-531. [DOI] [PubMed] [Google Scholar]
- Cheng H-J, Nakamoto M, Bergemann AD, Flanagan JG ( 1995) Complementary gradients in expression and binding of ELF-1 and Mek4 in development of the topographic retinotectal projection map. Cell 82: 371-381. [DOI] [PubMed] [Google Scholar]
- Chin-Sang ID, George SE, Ding M, Moseley SL, Lynch AS, Chisholm AD ( 1999) The ephrin VAB-2/EFN-1 functions in neuronal signaling to regulate epidermal morphogenesis in C. elegans. Cell 99: 781-790. [DOI] [PubMed] [Google Scholar]
- Ciossek T, Monschau B, Kremoser C, Löschinger J, Lang S, Müller BK, Bonhoeffer F, Drescher U ( 1998) Eph receptor-ligand interactions are necessary for guidance of retinal ganglion cell axons in vitro. Eur J Neurosci 10: 1574-1580. [DOI] [PubMed] [Google Scholar]
- Connor RJ, Menzel P, Pasquale EB ( 1998) Expression and tyrosine phosphorylation of Eph receptors suggest multiple mechanisms in patterning of the visual system. Dev Biol 193: 21-35. [DOI] [PubMed] [Google Scholar]
- Cunningham BA, Hemperly JJ, Murray BA, Prediger EA, Bracckenbury R, Edelman GM ( 1987) Neural cell adhesion molecule: structure, immunoglobulin-like domains, cell surface modulation, and alternative RNA splicing. Science 236: 799-806. [DOI] [PubMed] [Google Scholar]
- Cutforth T, Moring L, Mendelsohn M, Nemes A, Shah NM, Kim MM, Frisén J, Axel R ( 2003) Axonal ephrin-As and odorant receptors: coordinate determination of the olfactory sensory map. Cell 114: 311-322. [DOI] [PubMed] [Google Scholar]
- Davis S, Gale NW, Aldrich TH, Maisonpierre PC, Lhotak V, Pawson T, Goldfarb M, Yancopoulos GD ( 1994) Ligands for Eph-related receptor tyrosine kinases that require membrane attachment or clustering for activity. Science 266: 816-819. [DOI] [PubMed] [Google Scholar]
- Davy A, Robbins SM ( 2000) Ephrin-A5 modulates cell adhesion and morphology in an integrin-dependent manner. EMBO J 19: 5396-5405. [DOI] [PMC free article] [PubMed] [Google Scholar]
- Davy A, Gale NW, Murray EW, Klinghoffer RA, Soriano P, Feuerstein C, Robbins SM ( 1999) Compartmentalized signaling by GPI-anchored ephrin-A5 requires the Fyn tyrosine kinase to regulate cellular adhesion. Genes Dev 13: 3125-3135. [DOI] [PMC free article] [PubMed] [Google Scholar]
- Dearborn Jr R, He Q, Kunes S, Dai Y ( 2002) Eph receptor tyrosine kinase-mediated formation of a topographic map in the Drosophila visual system. J Neurosci 22: 1338-1349. [DOI] [PMC free article] [PubMed] [Google Scholar]
- Dodd J, Morton SB, Karagogeos D, Yamamoto M, Jessell TM ( 1998) Spatial regulation of axonal glycoprotein expression on subsets of embryonic spinal neurons. Neuron 1: 105-116. [DOI] [PubMed] [Google Scholar]
- Drescher U, Kremoser C, Handwerker C, Loschinger J, Noda M, Bonhoeffer F ( 1995) In vitro guidance of retinal ganglion cell axons by RAGS, a 25 kDa tectal protein related to ligands for Eph receptor tyrosine kinases. Cell 82: 359-370. [DOI] [PubMed] [Google Scholar]
- Dütting D, Handwerker C, Drescher U ( 1999) Topographic targeting and pathfinding errors of retinal axons following overexpression of ephrinA ligands on retinal ganglion cell axons. Dev Biol 216: 297-311. [DOI] [PubMed] [Google Scholar]
- Eberhart J, Swartz M, Koblar SA, Pasquale EB, Tanaka H, Krull CE ( 2000) Expression of EphA4, ephrin-A2 and ephrin-A5 during axon outgrowth to the hindlimb indicates potential roles in pathfinding. Dev Neurosci 22: 237-250. [DOI] [PubMed] [Google Scholar]
- Feldheim DA, Kim Y-I, Bergemann AD, Frisen J, Barbacid M, Flanagan JG ( 2000) Genetic analysis of ephrin-A2 and ephrin-A5 shows their requirement in multiple aspects of retinocollicular mapping. Neuron 25: 563-574. [DOI] [PubMed] [Google Scholar]
- Flanagan JG ( 2000) In situ analysis of embryos with receptor or ligand fusion protein probes. Curr Biol 10: R52-R53. [DOI] [PubMed] [Google Scholar]
- Flanagan JG, Vanderhaeghen P ( 1998) The ephrins and Eph receptors in neural development. Annu Rev Neurosci 21: 309-345. [DOI] [PubMed] [Google Scholar]
- Frisen J, Yates PA, McLaughlin T, Friedman GC, O'Leary DDM, Barbacid M ( 1998) Ephrin-A5 (AL-1/RAGS) is essential for proper retinal axon guidance and topographic mapping in the mammalian visual system. Neuron 20: 235-243. [DOI] [PubMed] [Google Scholar]
- Gale NW, Yancopoulos GD ( 1997) Ephrin and their receptors: a repulsive topic? Cell Tissue Res 290: 227-241. [DOI] [PubMed] [Google Scholar]
- Gale NW, Holland SJ, Valenzuela DM, Flenniken A, Pan L, Ryan TE, Henkemeyer M, Strebhardt K, Hirai H, Wilkinson DG, Pawson T, Davis S, Yancopoulos GD ( 1996) Eph receptors and ligands comprise two major specificity subclasses and are reciprocally compartmentalized during embryogenesis. Neuron 17: 9-19. [DOI] [PubMed] [Google Scholar]
- Gao Q, Yuan B, Chess A ( 2000) Convergent projections of Drosophila olfactory neurons to specific glomeruli in the antennal lobe. Nat Neurosci 3: 780-785. [DOI] [PubMed] [Google Scholar]
- George SE, Simokat K, Hardin J, Chisholm AD ( 1998) The VAB-1 Eph receptor tyrosine kinase functions in neural and epithelial morphogenesis in C. elegans. Cell 92: 633-643. [DOI] [PubMed] [Google Scholar]
- Hayashi JH, Hildebrand JG ( 1990) Insect olfactory neurons in vitro: morphological and physiological characterization of cells from the developing antennal lobes of Manduca sexta. J Neurosci 10: 848-859. [DOI] [PMC free article] [PubMed] [Google Scholar]
- Higgins MR, Gibson NJ, Eckholdt PA, Nighorn A, Copenhaver PF, Nardi J, Tolbert LP ( 2002) Different isoforms of fasciclin II are expressed by a subset of developing olfactory receptor neurons and by olfactory-nerve glial cells during the formation of glomeruli in the moth Manduca sexta. Dev Biol 244: 134-154. [DOI] [PubMed] [Google Scholar]
- Himanen J-P, Rajasjankar KR, Lackmann M, Cowan CA, Henkemeyer M, Nikolov DB ( 2001) Crystal structure of an Eph receptor-ephrin complex. Nature 414: 933-938. [DOI] [PubMed] [Google Scholar]
- Holder N, Klein R ( 1999) Eph receptors and ephrins: effectors of morphogenesis. Development 126: 2033-2044. [DOI] [PubMed] [Google Scholar]
- Homberg U, Montague RA, Hildebrand JG ( 1988) Anatomy of antenno-cerebral pathways in the brain of the sphinx moth Manduca sexta. Cell Tissue Res 254: 255-281. [DOI] [PubMed] [Google Scholar]
- Hornberger MR, Dütting D, Ciossek T, Yamada T, Handwerker C, Lang S, Weth F, Huf J, Weβel R, Logan C, Tanaka H, Drescher U ( 1999) Modulation of EphA receptor function by coexpressed ephrinA ligands on retinal ganglion cell axons. Neuron 22: 731-742. [DOI] [PubMed] [Google Scholar]
- Huai J, Drescher U ( 2001) An ephrin-A-dependent signaling pathway controls integrin function and is linked to the tyrosine phosphorylation of a 120-kDa protein. J Biol Chem 276: 6689-6694. [DOI] [PubMed] [Google Scholar]
- Imondi R, Wideman C, Kaprielian Z ( 2000) Complementary expression of transmembrane ephrins and their receptors in the mouse spinal cord: a possible role in constraining the orientation of longitudinally projecting axons. Development 127: 1397-1410. [DOI] [PubMed] [Google Scholar]
- Iwamasa H, Ohta K, Yamada T, Ushijima K, Terasaki H, Tanaka H ( 1999) Expression of Eph receptor tyrosine kinases and their ligands in chick embryonic motor neurons and hindlimb muscles. Dev Growth Differ 41: 685-698. [DOI] [PubMed] [Google Scholar]
- Jan LY, Jan YN ( 1982) Antibodies to horseradish peroxidase as specific neuronal markers in Drosophila and in grasshopper embryos. Proc Natl Acad Sci USA 79: 2700-2704. [DOI] [PMC free article] [PubMed] [Google Scholar]
- Kent KS, Harrow ID, Quartararo P, Hildebrand JG ( 1986) An accessory olfactory pathway in Lepidoptera: the labial pit organ and its central projections in Manduca sexta and certain other sphinx and silk moths. Cell Tissue Res 245: 237-245. [DOI] [PubMed] [Google Scholar]
- Kent KS, Oland LA, Hildebrand JG ( 1999) Development of the labial pit organ glomerulus in the antennal lobe of the moth Manduca sexta: the role of afferent projections in the formation of identifiable olfactory glomeruli. J Neurobiol 40: 28-44. [DOI] [PubMed] [Google Scholar]
- Key B, St. John JA ( 2002) Axon navigation in the mammalian primary olfactory pathway: Where to next? Chem Senses 27: 245-260. [DOI] [PubMed] [Google Scholar]
- Kidd T, Brose K, Mitchell KJ, Fetter RD, Tessier-Lavigne M, Goodman CS, Tear G ( 1998) Roundabout controls axon crossing of the CNS midline and defines a novel subfamily of evolutionarily conserved guidance receptors. Cell 92: 205-215. [DOI] [PubMed] [Google Scholar]
- Knöll B, Zarbalis K, Wurst W, Drescher U ( 2001) A role for the EphA family in the topographic targeting of vomeronasal axons. Development 128: 895-906. [DOI] [PubMed] [Google Scholar]
- Mann F, Ray S, Harris WA, Holt CE ( 2002) Topographic mapping in dorsoventral axis of the Xenopus retinotectal system depends on signaling through ephrin-B ligand. Neuron 35: 461-473. [DOI] [PubMed] [Google Scholar]
- Marcus RC, Gale NG, Morrison ME, Mason CA, Yancopoulos GD ( 1996) Eph family receptors and their ligands distribute in opposing gradients in the developing mouse retina. Dev Biol 180: 786-789. [DOI] [PubMed] [Google Scholar]
- Matsumoto SG, Hildebrand JG ( 1981) Olfactory mechanisms in the moth Manduca sexta: response characteristics and morphology of central neurons in the antennal lobes. Proc R Soc Lond B Biol Sci 213: 249-277. [Google Scholar]
- Mombaerts P, Wang F, Dulac C, Chao SK, Nemes A, Mendelsohn M, Edmondson J, Axel R ( 1996) Visualizing an olfactory sensory map. Cell 87: 675-686. [DOI] [PubMed] [Google Scholar]
- Monschau B, Kremoser C, Ohta K, Tanaka H, Kaneko T, Yamada T, Handwerker C, Hornberger MR, Löschinger J, Pasquale EB, Siever DA, Verderame MF, Müller BK, Bonhoeffer F, Drescher U ( 1997) Shared and distinct functions of RAGS and ELF-1 in guiding retinal axons. EMBO J 16: 1258-1267. [DOI] [PMC free article] [PubMed] [Google Scholar]
- Nakamoto M, Cheng H-J, Friedman GC, McLaughlin T, Hansen MJ, Yoon CH, O'Leary DDM, Flanagan JG ( 1996) Topographically specific effects of ELF-1 on retinal axon guidance in vitro and retinal axon mapping in vivo. Cell 86: 755-766. [DOI] [PubMed] [Google Scholar]
- Nardi JB ( 1992) Dynamic expression of a cell surface protein during rearrangement of epithelial cells in the Manduca wing monolayer. Dev Biol 152: 161-171. [DOI] [PubMed] [Google Scholar]
- Nighorn A, Gibson NJ, Rivers DM, Hildebrand JG, Morton DB ( 1998) The nitric oxide-cGMP pathway may mediate communication between sensory afferents and projection neurons in the antennal lobe of Manduca sexta. J Neurosci 18: 7244-7255. [DOI] [PMC free article] [PubMed] [Google Scholar]
- Oland LA, Tolbert LP ( 1987) Glial patterns during early development of antennal lobes of Manduca sexta: a comparison between normal lobes and lobes deprived of antennal axons. J Comp Neurol 255: 196-207. [DOI] [PubMed] [Google Scholar]
- Oland LA, Tolbert LP ( 1996) Multiple factors shape development of olfactory glomeruli: insights from an insect model system. J Neurobiol 30: 92-109. [DOI] [PubMed] [Google Scholar]
- Oland LA, Orr G, Tolbert LA ( 1990) Construction of a protoglomerular template by olfactory axons initiates the formation of olfactory glomeruli in the insect brain. J Neurosci 10: 2096-2112. [DOI] [PMC free article] [PubMed] [Google Scholar]
- Oland LA, Pott WM, Higgins MR, Tolbert LP ( 1998) Targeted ingrowth and glial relationships of olfactory receptor axons in the primary olfactory pathway of an insect. J Comp Neurol 398: 119-138. [PubMed] [Google Scholar]
- Oland LA, Marrero HG, Burger I ( 1999) Glial cells in the developing and adult olfactory lobe of the moth Manduca sexta. Cell Tissue Res 297: 527-545. [DOI] [PubMed] [Google Scholar]
- Oland LA, Pott WM, Howard CT, Inlow M, Buckingham J ( 2003) A diffusible signal attracts olfactory axons toward their target in the developing brain of the moth. J Neurobiol 56: 24-40. [DOI] [PubMed] [Google Scholar]
- O'Leary DDM, Wilkinson DG ( 1999) Eph receptors and ephrins in neural development. Curr Opin Neurobiol 9: 65-73. [DOI] [PubMed] [Google Scholar]
- Potter SM, Zheng C, Koos DS, Feinstein P, Fraser SE, Mombaerts P ( 2001) Structure and emergence of specific olfactory glomeruli in the mouse. J Neurosci 21: 9713-9723. [DOI] [PMC free article] [PubMed] [Google Scholar]
- Ressler K, Sullivan SL, Buck LB ( 1994) Information coding in the olfactory system: evidence for a stereotyped and highly organized epitope map in the olfactory bulb. Cell 79: 1245-1255. [DOI] [PubMed] [Google Scholar]
- Rospars JP, Hildebrand JG ( 2000) Sexually dimorphic and isomorphic glomeruli in the antennal lobes of the sphinx moth Manduca sexta. Chem Senses 25: 119-129. [DOI] [PubMed] [Google Scholar]
- Rössler W, Tolbert LP, Hildebrand JG ( 1998) Early formation of sexually dimorphic glomeruli in the developing olfactory lobe of the brain of the moth Manduca sexta. J Comp Neurol 396: 415-428. [PubMed] [Google Scholar]
- Rössler W, Oland LA, Higgins MR, Hildebrand JG, Tolbert LP ( 1999) Development of a glial-rich axon-sorting zone in the olfactory pathway of the moth Manduca sexta. J Neurosci 19: 9865-9877. [DOI] [PMC free article] [PubMed] [Google Scholar]
- Sanes JR, Hildebrand JG ( 1976a) Structure and development of antennae in a moth, Manduca sexta. Dev Biol 51: 282-299. [PubMed] [Google Scholar]
- Sanes JR, Hildebrand JG ( 1976b) Origin and morphogenesis of sensory neurons in an insect antenna. Dev Biol 51: 300-319. [DOI] [PubMed] [Google Scholar]
- Schultz J, Milpetz F, Bork P, Ponting CP ( 1998) SMART, a simple modular architecture research tool: identification of signaling domains. Proc Natl Acad Sci USA 95: 5857-5864. [DOI] [PMC free article] [PubMed] [Google Scholar]
- Scully AL, McKeown M, Thomas JB ( 1999) Isolation and characterization of Dek, a Drosophila Eph receptor protein tyrosine kinase. Mol Cell Neurosci 13: 337-347. [DOI] [PubMed] [Google Scholar]
- Snow PM, Patel NH, Harrelson AL, Goodman CS ( 1987) Neural-specific carbohydrate moiety shared by many surface glycoproteins in Drosophila and grasshopper embryos. J Neurosci 7: 4137-4144. [DOI] [PMC free article] [PubMed] [Google Scholar]
- Songyang Z, Fanning AS, Fu C, Xu J, Marfatia SM, Chishti AH, Crompton A, Chan AC, Anderson JM, Cantley LC ( 1997) Recognition of unique carboxyl-terminal motifs by distinct PDZ domains. Science 275: 73-77. [DOI] [PubMed] [Google Scholar]
- St. John JA, Key B ( 2001) EphB2 and two of its ligands have dynamic protein expression patterns in the developing olfactory system. Dev Brain Res 126: 43-56. [DOI] [PubMed] [Google Scholar]
- St. John JA, Tisay KT, Caras IW, Key B ( 2000) Expression of EphA5 during development of the olfactory nerve pathway in rat. J Comp Neurol 416: 540-550. [DOI] [PubMed] [Google Scholar]
- St. John JA, Pasquale EB, Key B ( 2002) EphA receptors and ephrin-A ligands exhibit highly regulated spatial and temporal expression patterns in the developing olfactory system. Dev Brain Res 138: 1-14. [DOI] [PubMed] [Google Scholar]
- Thanos CD, Goodwill KE, Bowie JU ( 1999) Oligomeric structure of the human EphB2 receptor SAM domain. Science 283: 833-836. [DOI] [PubMed] [Google Scholar]
- Thompson JD, Higgins DG, Gibson TJ ( 1994) Clustal W: improving the sensitivity of progressive multiple sequence alignment through sequence weighting, position-specific gap penalties and weight matrix choice. Nucleic Acids Res 11: 4673-4680. [DOI] [PMC free article] [PubMed] [Google Scholar]
- Tolbert LP, Matsumoto SG, Hildebrand JG ( 1983) Development of synapses in the antennal lobes of the moth Manduca sexta during metamorphosis. J Neurosci 3: 1158-1175. [DOI] [PMC free article] [PubMed] [Google Scholar]
- Torkkeli PH, French AS ( 1999) Primary culture of antennal mechanoreceptor neurons of Manduca sexta. Cell Tissue Res 297: 301-309. [DOI] [PubMed] [Google Scholar]
- Toth J, Cutforth TC, Gelinas AD, Bethoney KA, Bard J, Harrison CJ ( 2001) Crystal structure of an ephrin ectodomain. Dev Cell 1: 83-92. [DOI] [PubMed] [Google Scholar]
- Treloar HB, Feinstein P, Mombaerts P, Greer CA ( 2002) Specificity of glomerular targeting by olfactory sensory axons. J Neurosci 22: 2469-2477. [DOI] [PMC free article] [PubMed] [Google Scholar]
- Tucker ES, Tolbert LP ( 2003) Reciprocal interactions between olfactory receptor axons and olfactory nerve glia cultured from the developing moth Manduca sexta Dev Biol 260: 9-30. [DOI] [PubMed] [Google Scholar]
- van der Geer P, Hunter T, Lindberg RA ( 1994) Receptor protein-tyrosine kinases and their signal transduction pathways. Annu Rev Cell Biol 10: 251-337. [DOI] [PubMed] [Google Scholar]
- Vassar R, Chao SK, Setcheran R, Nunez JM, Vosshall LB, Axel R ( 1994) Topographic organization of sensory projections to the olfactory bulb. Cell 79: 981-991. [DOI] [PubMed] [Google Scholar]
- Vosshall LB, Wong AM, Axel R ( 2000) An olfactory sensory map in the fly brain. Cell 102: 147-159. [DOI] [PubMed] [Google Scholar]
- Walter J, Kern-Veits B, Huf J, Stolze B, Bonhoeffer F ( 1987) Recognition of position-specific properties of tectal cell membranes by retinal axons in vitro. Development 101: 685-696. [DOI] [PubMed] [Google Scholar]
- Wang F, Nemes A, Mendelsohn M, Axel R ( 1998) Odorant receptors govern the formation of a precise topographic map. Cell 93: 47-60. [DOI] [PubMed] [Google Scholar]
- Wang X, Roy PJ, Holland SJ, Zhang LW, Culotti JG, Pawson T ( 1999) Multiple ephrins control cell organization in C. elegans using kinase-dependent and -independent functions of the VAB-1 Eph receptor. Mol Cell 4: 903-913. [DOI] [PubMed] [Google Scholar]
- Whitesides JG, LaMantia AS ( 1996) Differential adhesion and the initial assembly of the mammalian olfactory nerve. J Comp Neurol 373: 240-254. [DOI] [PubMed] [Google Scholar]
- Wilkinson DG ( 2001) Multiple roles of Eph receptors and ephrins in neural development. Nat Rev Neurosci 2: 155-164. [DOI] [PubMed] [Google Scholar]
- Winslow JW, Moran P, Valverde J, Shih A, Yuan JQ, Wong SC, Tsai SP, Goddard A, Henzel WJ, Hefti F, Beck KD, Caras IW ( 1995) Cloning of AL-1, a ligand for an Eph-related tyrosine kinase receptor involved in axon bundle formation. Neuron 14: 973-981. [DOI] [PubMed] [Google Scholar]
- Yoshihara Y, Kawasaki M, Tamada A, Fujita H, Hayashi H, Kagamiyama H, Mori K ( 1997) OCAM: A new member of the neural cell adhesion molecule family related to zone-to-zone projection of olfactory and vomeronasal axons. J Neurosci 17: 5830-5842. [DOI] [PMC free article] [PubMed] [Google Scholar]