

Abstract
Flicker stimuli of variable frequency (2-90 Hz) elicit a steady-state visual-evoked response (SSVER) in the electroencephalogram (EEG) with the same frequency as the stimulus. In humans, the amplitude of this response peaks at ∼15 Hz, decreasing at higher stimulation frequencies. It was not known whether this peak response corresponds to increased synaptic activity in the visual cortex or to other mechanisms [for instance, the temporal coherence (phase summation) of evoked responses]. We studied the SSVER in 16 normal volunteers by means of visual stimulation at 14 different frequencies (from 5 to 60 Hz) while recording the EEG. In nine subjects of the group, we measured regional cerebral blood flow (rCBF) with positron emission tomography (PET)-H215O at rest and during visual stimulation at five different frequencies: 5, 10, 15, 25, and 40 Hz. We confirmed that the amplitude of the SSVER in occipital regions peaks at 15 Hz stimulation. Applying to the PET rCBF data a contrast weighted by the amplitude of the SSVER, we determined that the primary visual cortex rCBF follows an activation pattern similar to the SSVER. This finding suggests that the amplitude of the SSVER corresponds to increased synaptic activity, specifically in Brodmann's area 17. Additionally, this study showed that visual stimulation at 40 Hz causes selective activation of the macular region of the visual cortex, and that a region in the dorsal aspect of the Crus I lobule of the left cerebellar hemisphere is activated during repetitive visual stimulation.
Keywords: steady-state visual-evoked potentials, gamma oscillatory activity, regional cerebral blood flow, positron emission tomography, cerebellum, visual cortex
Introduction
Flicker stimuli of variable frequency (2-70 Hz) evoke an oscillatory response with the same frequency as the stimulus rate in areas 17 and 18 of the cat visual cortex (Rager and Singer, 1998) and in the human lateral geniculate body and visual cortex (Krolak-Salmon et al., 2003). Similarly, in EEG recordings in humans, a few hundred milliseconds after the onset of repetitive stimulation, a steady-state visual-evoked response (SSVER) appears in the occipital leads (Regan, 1966). The amplitude of the response is not the same for all stimulation frequencies. Flickering light at frequencies from 1 to 100 Hz in 1 Hz steps elicited steady-state oscillations with the largest amplitude at ∼15 Hz (Herrmann, 2001). Repetitive visual stimulation at ∼15 Hz is most effective in eliciting generalized photoparoxysmal responses, another indication of the propensity for visual neuronal networks to resonate at this frequency (Takahashi and Tsukahara, 1998; da Silva et al., 1999).
The mechanisms underlying SSVER amplitude in humans continue to be debated. The increment of the SSVER amplitude observed at ∼15 Hz could result merely from the overlapping of early components of the visual-evoked potential (VEP), because in the auditory system, the formation of steady-state responses was postulated to result from the superimposition of transient auditory middle-latency components (Basar et al., 1987; Santarelli et al., 1995; Gutschalk et al., 1999). Or, as with other event-related potentials, the SSVER could represent stimulus-induced resetting of the phase of ongoing field potential oscillations or reflect changes in the activity of neuronal assemblies (Makeig et al., 2002). It is also possible that several mechanisms are involved, and even that the topography of each is different. An increase in the activity of neuronal assemblies, with increased synaptic activity, would be reflected in a rise in regional cerebral blood flow (rCBF) (Pastor et al., 2002). However, recording rCBF changes with positron emission tomography (PET) during repetitive visual stimulation, the maximal rCBF response was obtained at ∼8 Hz, declining in amplitude at higher frequencies (Fox and Raichle, 1985; Mentis et al., 1997). Thus, the rCBF behavior seems to differ from the EEG responses, with the highest at stimulation frequencies of ∼15 Hz. To try to clarify this paradox, we studied SSVER and rCBF in the same subjects, hypothesizing that the apparent discrepancy could be attributable to a different topography of the two responses.
Repetitive stimulation at 40 Hz merits study, because this frequency seems to play a role in visual perception and sensory integration. In areas 17 and 18 of the cat visual cortex, the firing probability of neurons, in response to the presentation of optimally aligned light bars within their receptive field, oscillates with a peak frequency near 40 Hz (Gray et al., 1989). In humans, oscillatory EEG activity at 40 Hz has been detected phase-locked to nonoscillatory visual stimuli (Tallon-Baudry et al., 1996). In another sensory modality, 40 Hz auditory stimulation elicits the greatest amplitude-evoked response (Galambos et al., 1981). We included stimulation at 40 Hz in our study.
Materials and Methods
Subjects. We studied 16 normal volunteers (nine females, seven males; mean age, 29.3; SD, 4.3) with no history of ophthalmological or neurological disease and normal general and neurological examinations. All subjects were right-handed according to the Edinburgh Handedness Inventory (Oldfield, 1971). The protocol was approved by the Ethics Committee of the hospital of the University of Navarra, and all subjects gave their written informed consent for the study, according to the declaration of Helsinki, after its nature was fully explained to them.
Electroencephalographic study. Steady-state VEPs during wakefulness were recorded at 21 scalp locations (10-20 EEG international system), and all referred to a balanced noncephalic reference. Electrode impedance was kept at <5 Ω. The stimuli were white flashes delivered by a strobe lamp with an intensity of 10 lumen/sec/ft2 and a duration of 50 μsec. We asked the subject to fixate on a point placed 70 cm ahead. The frequency was defined as the number of flashes presented binocularly per second and was controlled by varying the interval between flash pulses. The luminous intensity of each flash remained constant. Increasing flash frequency by decreasing the flash interval resulted in a steadily increasing luminance. The interflash intervals were varied to give flash frequencies of 5, 10, 12, 15, 17, 20, 22, 25, 27, 30, 35, 40, 47, and 60 Hz.
Responses were bandpass filtered between 1 and 500 Hz. A total of 500 responses, in epochs of 500 msec, were averaged for each stimulus frequency. Individual 500 msec trials that contained blink or EMG artifacts were rejected from additional analysis. On the SSVER obtained at each of the 21 electrodes, a fast Fourier transform (FFT) was performed for each stimulation frequency (see Fig. 1). Thus, the dominant frequencies of power spectra were determined for all stimulation frequencies and electrodes. We then measured the amplitude (square root of power) of the fundamental frequency for each of the electrodes and frequencies in each subject. Isopotential maps of the visual-evoked potentials were obtained using a Brain Atlas-III (Biologic, Mundelein, IL) that made a four point linear interpolation at 0.5 msec intervals. An FFT brain map was obtained for each stimulus rate and frequency peak (see Fig. 2). The highest amplitude of the SSVER was recorded at O1, O2, and Oz (see Figs. 1, 2). Thus, we averaged the amplitude at these three occipital electrodes to compare it with the rCBF data. How this comparison was performed [statistical parametric mapping (SPM) contrast weighted by the amplitude of the SSVER] is described in the next section.
Figure 1.

Effect of visual stimulation at different frequencies on the amplitude of the SSVER. a, SSVER recordings of one representative subject at the right occipital lead (O2). b, FFT of this individual's SSVERs and grand average of 16 normal subjects (dotted line). c, Average of the mean values of the amplitude of the FFT fundamental frequency of the SSVER recorded at the three occipital leads (Oz, center; O1, left; O2, right) at the different stimulation frequencies. The amplitude of the occipital SSVER, expressed in microvolts, reached a maximum at ∼15 Hz and then fell with a plateau up to 27 Hz, declining at higher frequencies.
Figure 2.

Topographic maps of the FFT fundamental frequency of the SSVER at each of the frequencies studied. Note that given the larger amplitude of the SSVER at the frequencies shown to the right of the top and middle rows, the calibration is different for each row to preserve topographical detail. L, Left; R, right.
PET procedure. In nine subjects of the group (four females, five males; mean age, 30.4; SD, 4.8; selected on the basis of availability and also on the basis of whose EEG data were no different from the entire group of 16 subjects), we measured rCBF with PET-H215O at rest and during visual stimulation at five different frequencies: 5, 10, 15, 25, and 40 Hz. We chose the visual stimulation frequencies for the PET study among the relevant EEG steady-state responses: 5 Hz as a low frequency, 10 Hz as the occipital activity at rest, 15 Hz as the highest-amplitude SSVER and sensitization frequency for photo-paroxysmal responses, 25 Hz as inducing the highest response in frontal areas (F3 and F4), and 40 Hz as the frequency that produced the largest steady-state auditory responses and those that were most frequently recorded in the human occipital cortex during tasks involving visual integration, as described in the Introduction.
The PET scans were performed with an ECAT EXACT HR+ (Siemens-CTI, Knoxville, TN) that collected 63 simultaneous parallel planes over a 15.2 cm axial field of view. The tomographic resolution was 4.5 mm. Transmission scanning was done before radiopharmaceutical injection using three rotating rods (68Ge source). The entire intracranial volume was included in the field of view.
The subjects lay comfortably in a supine position in a room that was dimly and uniformly lit. A small catheter was placed in the left cubital vein for the injection of the radioisotope. Series of flashes were delivered from a stroboscope placed 40 cm away and facing the subject. Each subject underwent six consecutive scans at 20 min intervals, one at rest and one for each frequency of visual stimulation (5, 10, 15, 25, and 40 Hz). The order of the different frequency stimulation and baseline scans was randomized across subjects to avoid an order effect. We controlled for arousal by checking that the subject was awake before every scanning session. For the baseline scan, subjects lay quietly. After 60 sec at rest, or after onset of visual stimulation for the stimulation conditions, subjects received 370 MBq of H215O as an intravenous bolus. Scans were initiated automatically when the radioactive count rate in the brain reached a threshold value of 100 kilocounts/sec, ∼20 sec after intravenous injection, and continued for 60 sec. Visual stimulation was maintained during scanning. Emission data were corrected for attenuation by means of a transmission scan. There were no explicit task requirements.
PET scans were analyzed using SPM2b (an update of SPM99; Wellcome Department of Cognitive Neurology, London, UK) (Friston et al., 1995b, 1996) on a Matlab 5.3 platform (Mathworks, Natick, MA). Head movement was corrected by rigid alignment (Friston et al., 1995a). The scans were then spatially normalized using the template from the Montreal Neurological Institute series and the reference system given in the Talairach and Tournoux atlas (Talairach and Tournoux, 1988). All of the scans were smoothed using a Gaussian filter set at 10 mm full-width at half-maximum in plane to increase the signal-to-noise ratio.
Data were analyzed after construction of a design matrix for the analysis of group data for conditions and covariates. All scans were subjected to an analysis of covariance (ANCOVA). This procedure removes the confounding effect of differences in global activity across scans and normalizes global activity (measured as radioactive counts) to a notional mean rCBF of 50 ml · dl-1 · min-1. For each voxel, the ANCOVA generated six condition-specific mean rCBF values and associated error variances.
With SPM, we compared the mean blood flow elicited by the different stimulation frequencies on a voxel-to-voxel basis, applying the t test to each and every voxel. The condition means were weighted by the appropriate contrast, generating a statistical parametric map of the t values. A p value was computed for each t score. To make inferences about stimulus-frequency-dependent rCBF responses, and thereby test our hypotheses, we specified a series of contrasts pertaining to the condition-specific effects, as follows: (1) First, we compared rCBF visual-evoked responses across all frequencies relative to rest. We used the ensuing (T) statistical parametric map (from which we derived Z scores for tabular reporting) to identify the visual cortex region showing the greatest rCBF response. (2) To assess the correlation between the EEG response and rCBF in the visual cortex activated in the previous contrast, we specified a second contrast. Its weights were obtained by linear interpolation for the five frequencies used in the PET experiment from the FFT fundamental frequency amplitude of the occipital SSVER, using the grand average of the group tested with PET. The resulting five amplitudes were then mean corrected to a mean of 0, and the rest condition was discounted using a contrast weight of 0. Thus, the contrast tested the hypothesis that the EEG steady-state response could predict rCBF activation. The contrasts weighted were: 0, -1.16, 0.14, 2.14, 0.54, and -1.66. It is important to note that this contrast is orthogonal with the previous contrast applied. In other words, the identification of the voxels most responsive to visual stimuli is independent of frequency-specific effects. (3) To test the hypothesis that 40 Hz stimulation may activate visual areas differently from the other frequencies, we compared stimulation at each frequency with rest.
We used a false discovery rate (FDR)-corrected threshold of p < 0.01. FDR is a statistical technique that corrects for multiple hypotheses testing by controlling the expected proportion of the rejected hypotheses that are falsely rejected (Genovese et al., 2002). For contrast 2, we corrected for the volume of interest (a sphere with a radius of 40 mm, centered at x = 0; y = -84; z = 0) and used a threshold of p < 0.001, because our inferences were restricted to the cerebral visual areas activated by contrast 1, and contrast 2 is orthogonal to contrast 1. To simplify the presentation of the data, only clusters with a size [number of voxels in a cluster (k)] of >60 are shown in the figures and listed in Table 1.
Table 1.
Cerebral and cerebellar regions activated with each of the contrasts
|
Contrasts |
Area activated |
Side |
k |
t |
Z |
p |
x, |
y, |
z |
|---|---|---|---|---|---|---|---|---|---|
| (1) Visual repetitive stimulation at all frequencies versus the rest condition | Visual primary and association areas (BA 17, 18, 19) (Fig. 3A) | R,L | 5913 | 8.08 | 5.88 | 0.01* | 12, | −78, | 6 |
| (2) Weighted by EEG SSVER amplitude | Primary visual area (calcarine cortex, BA 17) (Fig. 3B) | L,R | 496 | 5.02 | 4.26 | 0.001** | −6, | −74, | 2 |
| (3) Stimulation at the given frequency versus the rest condition | |||||||||
| 5 Hz | Visual primary and association areas (BA 17, 18) (Fig. 5) | L,R | 5442 | 9.52 | 6.46 | 0.01* | 14, | −78, | 6 |
| Left cerebellar hemisphere, Crus I (Fig. 5) | L | 85 | 5.06 | 4.29 | 0.01* | −32, | −88, | −26 | |
| 10 Hz | Visual primary and association areas (BA 17, 18) | L,R | 3393 | 8.46 | 6.05 | 0.01* | −6, | −94, | −10 |
| 40 Hz | Dorsolateral portion of primary visual and association areas (BA 17, 18) (Fig. 4) | R,L | 918 | 7.74 | 5.73 | 0.001** | 30, | −96, | −20 |
|
|
|
L
|
288
|
4.70
|
4.05
|
0.001**
|
−16,
|
−98,
|
−12
|
Data include cluster size (k), t, and Z scores, significance level (p), and the coordinates of the maxima voxel of each activated cluster in standard stereotaxic space (Talairach and Tournoux, 1988) (x,y,z). For hemispheric side: R, Right; L, left. Only activated clusters with a size (k) of >60 are listed in Table 1. *p, FDR-corrected; **p, corrected for small volume.
Results
Electroencephalographic study
An oscillatory EEG response, phase-locked with the presented flash frequency, was recorded at 5, 10, 12, 15, 17, 20, 22, 25, 27, 30, 35, 40, 47, and 60 Hz. As a result of a rapidly repeated visual stimulus application, an initial transient response evolved into a steady-state waveform with the same frequency as the stimulus, as illustrated in Figures 1 and 2. The oscillatory response reached the greatest amplitude at ∼15 Hz in the occipital area and at 25 Hz in frontal areas and subsequently decreased at higher click rates.
PET studies
Contrast 1
Compared with rest, repetitive visual stimulation with all five frequencies, considered as a group, increased the rCBF in primary and association visual cortex, mostly of the occipital lobe but reaching into the temporal and parietal lobes. Specific values [cluster size (k); t and Z scores; p value] for brain regions with significant changes in rCBF and their coordinates in standard stereotaxic space (Talairach and Tournoux, 1988) are listed in Table 1. Figure 3 shows the anatomical location of the activated voxel clusters (in red), projected on a rendered image of the cerebral hemispheres. Because we only considered clusters with a size (k) of >60, smaller activated clusters in the right inferior parietal lobule, right inferior temporal gyrus, and Crus I of the left cerebellar hemisphere are not shown in Figure 3 or listed in Table 1. In the voxel maximally activated in the visual area [x = 12; y = -78; z = 6], the plot of effect size illustrates the rCBF rise during repetitive visual stimulation at each of the five frequencies compared with the rest condition (Fig. 3A).
Figure 3.
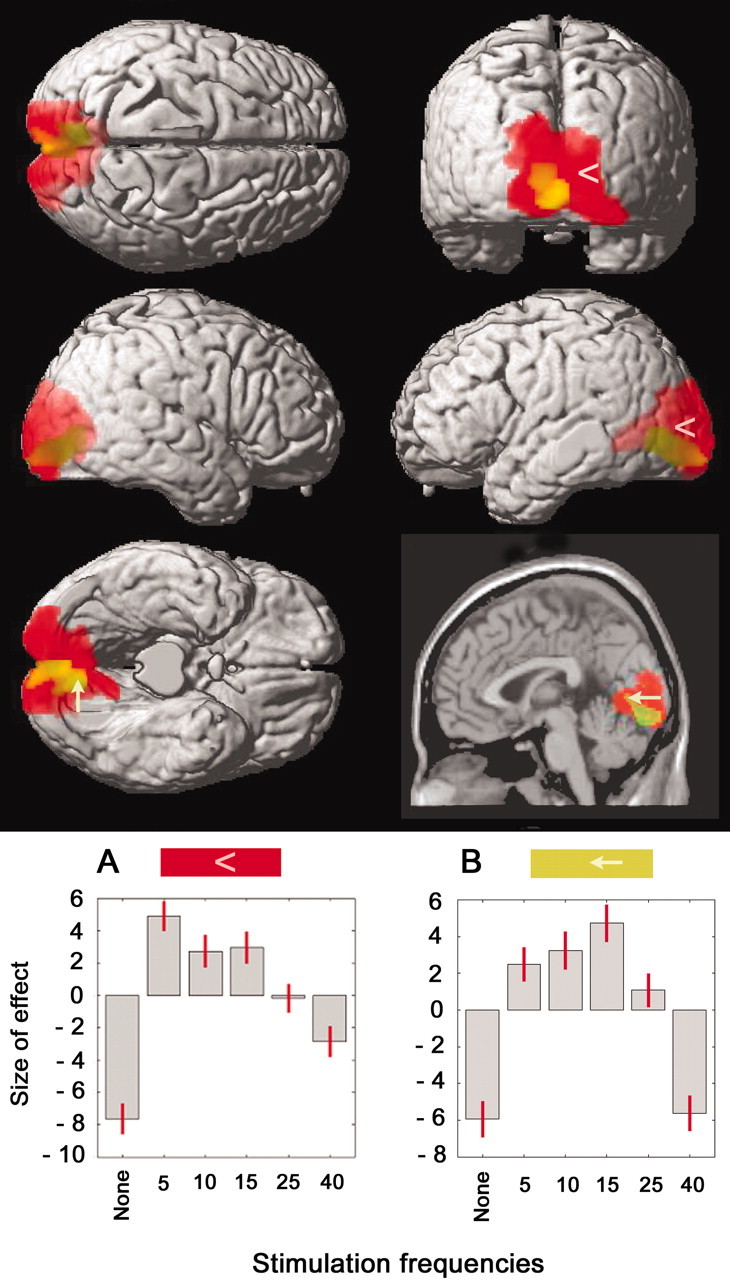
Areas with significant changes in rCBF during visual stimulation, projected on a rendered image, and in the bottom right corner, a T1-weighted sagittal canonical image of the human brain. A, In red, activation by the grouping of all frequencies compared with rest (contrast 1). The corresponding plot of effect size in the voxel of greatest activation (x, 12; y, -78; z, 6; indicated by the arrowhead) is depicted below the rendered image. The sizes of effects at the different stimulation frequencies compared with no stimulation (None) are as follows: 5 Hz, 12.6; 10 Hz, 10.4; 15 Hz, 10.6; 25 Hz, 7.5; and 40 Hz, 4.8. B, In green (because of the intersection with red, it often appears yellow), activation in the contrast weighted by the amplitude of the EEG occipital SSVER (contrast 2). Note that unlike the rendered images that project three-dimensional activation, the canonical image (bottom right) depicts activation exclusively in the plane of section, and therefore only a partial area of activation is shown. The corresponding plot of effect size in the voxel of greatest activation (x, -6; y, -74; z, 2; indicated by the arrow) is depicted below the rendered image. The sizes of effects at the different stimulation frequencies compared with no stimulation are as follows: 5 Hz, 8.4; 10 Hz, 9.2; 15 Hz, 10.7; 25 Hz, 7; and 40 Hz, 0.3. Other data are given in Table 1.
Contrast 2
The contrast weighted by the amplitude of the SSVER, which illustrates the correlation between the EEG response and changes in rCBF, disclosed a cluster located in pericalcarine occipital visual cortex [Brodmann's area (BA) 17, primary visual area (V1)]. Specific values [cluster size (k), t and Z scores; p values] for the region with significant changes in rCBF and its coordinates in standard stereotaxic space (Talairach and Tournoux, 1988) are listed in Table 1. Figure 3 shows in green (which, in most areas, appears in yellow because of the intersection with the red for contrast 1) the cluster activated by this contrast. The plot of effect size in the maximally activated voxel illustrates the activity at rest and in the five visual stimulation conditions (Fig. 3B).
Contrast 3
With a pattern similar to contrast 1 (Fig. 3A), stimulation at 5, 10, 15, and 25 Hz activated both primary and association visual cortex in a wide region with the base at the occipital pole and the vertex at the anterior extent of the calcarine sulcus, at its junction with the parieto-occipital sulcus. A different pattern was elicited by stimulation at 40 Hz compared with rest, which activated only the most posterior portion of the primary visual and association cortex (BA 17, 18), with a larger cluster on the right hemisphere (Fig. 4). The result for 40 Hz stimulation was obtained by applying a threshold of p = 0.001, correcting for a volume similar to the one described in Materials and Methods for contrast 2. The cortex in anterior visual regions was not activated by 40 Hz stimulation even when the significance level of the SMP analysis was lowered to an uncorrected p value of 0.1 (data not shown).
Figure 4.

In lighter gray, regions with increased rCBF during 40 Hz visual stimulation compared with the rest condition. The activated areas are projected on a rendered image of the human brain.
In addition, stimulation at 5 (Fig. 5) and 10 Hz [elicited using a p value of 0.05 (FDR-corrected)] activated a region in the dorsal aspect of Crus I of the left cerebellar hemisphere.
Figure 5.

Regions activated during 5 Hz visual stimulation compared with the rest condition, projected on a rendered image of the human brain. The position of the voxel of greatest activation is indicated in the occipital lobe (x, 14; y, -78; z, 6; arrowheads) and the cerebellum (x, -32; y, -88; z, -26; arrows). The charts at the bottom depict the effect size of the parameter estimates in the voxels of greatest activation at 5 Hz stimulation for stimulation at all five frequencies used in the experiment. Note that the patterns of occipital and cerebellar activation are quite similar, and that the voxels maximally activated in each area are crossed.
Discussion
Electroencephalographic study
The findings of our study agree with previous studies showing a peak at ∼15 Hz in the SSVER recorded by EEG and induced by repetitive stimulation (Takahashi and Tsukahara, 1998; Herrmann, 2001). Unlike Herrmann, we did not sample frequencies above 60 Hz, which in his study elicited small amplitude responses. For the reasons mentioned in the Introduction, we were mainly interested in correlating the EEG and rCBF responses below 25 and at 40 Hz.
PET study
Activation by stimulation at the various frequencies (contrasts 1 and 2)
As expected, the visual primary and association areas were activated by visual stimulation at all of the frequencies explored, taken as a group. In the voxel of greatest activation in this cluster (maxima voxel), the behavior of the rCBF with each of the stimulation frequencies followed the pattern described by Fox and Raichle (1985) and by Mentis et al. (1997) (Fig. 3A). Although they had recorded peak rCBF at 7-8 Hz stimulation rates, we observed the highest rCBF at the maxima voxel with 5 Hz stimulation, probably because we did not stimulate at 7-8 Hz but rather bracketed this region using 5 and 10 Hz. In the maxima voxel of this cluster, the rise in rCBF declined progressively at stimulation frequencies of 25 and 40 Hz (Fig. 3A). Of course, the behavior of this cluster does not necessarily represent the behavior of all of the voxels in the region activated, as contrast 2 shows. Indeed, using PET, Fox and Raichle (1985) have already noted that maximum rCBF responses could occur with ∼15 Hz stimulation, the same frequency eliciting peak EEG responses. To explore this issue, we performed contrast 2, weighted for the power of the EEG SSVER at the different frequencies.
With contrast 2, an area of specific activation appeared in primary visual cortex (Fig. 3, area marked in green-yellow, Table 1). The shape and orientation of the activated area follow the outline of the calcarine sulcus, from its anterior portion, near its junction with the parieto-occipital sulcus, to the occipital pole. It encompasses the cortical representation of both the peripheral retina and the macular region. Thus, there is indeed an area of the visual cortex in which the rCBF follows the same pattern of activation as the EEG SSVER with regard to the repetitive stimulation frequencies studied in this report. That the activation is confined to the primary visual area seems to support previous electrophysiological work in the awake monkey concluding that the surface VEP to passive, binocular flash reflects activation of parvocellular thalamorecipient laminas of area 17 (Schroeder et al., 1989). It could be postulated that because contrast 2 links cortical activation with the peak amplitude of the SSVER at each of a series of stimulation frequencies, the voxels responsible for the production of the largest components of the SSVER are in V1. The rest of the cortex would be activated differentially, depending on the frequency applied. This explanation could be at least partially true, but it should not be concluded that V1 is responsible for the SSVER in humans. Our single-frequency stimulation contrast 3 showed that 40 Hz stimulation did not activate the anterior portion of V1. Therefore, at least with 40 Hz stimulation, a portion of V1 highlighted in contrast 2 was not responsible for the production of the SSVER. Moreover, in the cat, entrainment of cortical neurons to produce an SSVER occurs both in area 17 and in area 18 (Rager and Singer, 1998). In humans, the amplitude of the SSVER increases with attention (Muller and Hillyard, 2000). Studies of selective attention in the macaque seemed to suggest that V1 is not involved in SSVER generation, because increased neuronal firing occurred in extrastriate areas but not in V1 (Luck et al., 1997; McAdams and Maunsell, 1999). However, more recent studies in humans have shown that attention induces functional magnetic resonance imaging blood oxygen level-dependent changes to a similar extent in V1 and neighboring extrastriate cortex (Ress et al., 2000; Di Russo et al., 2003). Moreover, direct cortical recordings of the SSVER in humans, sampling mostly pericalcarine and inferior visual regions, detected synchronous oscillations in pericalcarine cortex but not in the extrastriate occipitotemporal visual cortex, a finding entirely compatible with the results of contrast 2 (Krolak-Salmon et al., 2003). Although the mechanism responsible for the remarkable topography of rCBF activation linked to the SSVER amplitude needs additional elucidation, our study does suggest that in humans, the peak amplitude of the SSVER reflects the activation of primary visual cortex neurons and is not merely the result of an overlapping of the early components of the visual evoked potential.
Activation by stimulation at 40 Hz compared with other frequencies (contrast 3)
The pattern of activation with 40 Hz stimulation, compared with activation by other frequencies, is remarkable. Whereas the other frequencies activated an approximately pyramidal volume, with its vertex at the anterior tip of the calcarine fissure and the base at the occipital pole (Fig. 3, marked in red), 40 Hz stimulation activated only the primary and association cortex representing the macular region of the retina (Fig. 4). This region participates in tasks such as reading, which requires a greater interaction with Wernicke's area and other cortical structures involved in this task (Gaillard et al., 2003). Because stimulation at 40 Hz activated visual cortex less vigorously than the other frequencies explored, this finding could be interpreted as simply resulting from partial activation of the entire visual region, with a greater activation of the macular region. However, the anterior part of the visual cortex, in the area of representation of the peripheral retina, did not appear activated even when the p value of the SPM contrast was lowered to an uncorrected p value of 0.1. Isolated macular cortex activation by 40 Hz probably reflects the specific activation of the retinal cones represented in this cortical region and the lack of activation of the rods of the peripheral retina by stimulation at frequencies of >30 Hz, a phenomenon well documented by electroretinography (Marmor et al., 1989). It also may reflect the more selective activation of receptive visual fields by stimulation at 40 Hz than by stimulation at lower frequencies, as shown in vitro on guinea pig visual cortex slices (Contreras and Llinas, 2001). In contrast to stimuli at 10 Hz, which produced a lateral spread of excitation through the cortex, repetitive stimulation at ∼40 Hz rapidly restrained the area of excitation to a small columnar site connected with the white matter that fiber stimulated (Contreras and Llinas, 2001). However, because we did not sample stimulation frequencies that were ∼40 Hz (for instance, 30 and 60 Hz), it is possible that neighboring frequencies might produce a similar cortical rCBF activation pattern.
In addition, comparison of the various stimulation frequencies shows that within a narrow band of luminance, the extent of cortical activation does not correlate with the luminance of the stimulus but depends on the stimulation rate. In our experiment, 40 Hz stimulation, using the greatest amount of lumens per second per square foot, activated the smallest portion of the striate and peristriate cortex.
Cerebellar activation (contrast 3)
Stimulation at 5 Hz, the frequency that caused the greatest rise in visual cortex rCBF, resulted in activation of a region in the dorsal aspect of Crus I of the left cerebellar hemisphere, according to the anatomical terminology proposed by Schmahmann et al. (1999) (Fig. 5, arrows). When a significance level of 0.05 FDR-corrected was applied, a smaller area in the same location also appeared to be activated at 10 Hz stimulation. Interestingly, the voxels that were maximally activated in the occipital region were located in the right hemisphere, whereas the activated cerebellar cluster was on the left, and the pattern of activation at the different frequencies was parallel in both areas (Fig. 5). These findings seem to support the participation of the cerebellum in visual processing. Less well known than its role in motor control, the cerebellum also plays a role in visual perception. It is activated by visually presented moving dots (Dupont et al., 1994). The left paravermian region and the left cerebellar hemisphere, in the region outlined in our study, were activated by the task of judging the accuracy of line bisection (the Landmark task), a visual sensory task (Fink et al., 2001).
In summary, a selective area of the visual cortex, the primary visual area (BA 17) is specifically activated with a pattern that parallels the pattern of the power of the amplitudes of the SSVER elicited by visual stimulation at 5, 10, 15, 25, and 40 Hz. This finding suggests that the peak amplitude SSVER corresponds to a true activation of neuronal clusters in primary visual cortex and is not simply a phase summation artifact. Additionally, we found that stimulation at 40 Hz activates specifically the macular visual area, and that a region in Crus I of the left cerebellar hemisphere is activated with a pattern parallel to the one observed with occipital lobe activation.
Footnotes
This work was supported by Plan de Investigación de la Universidad de Navarra Research Fund Grant 13298312. J. M. Marti-Climent and I. Peñuelas provided technical support. We thank Prof. Karl Friston for his valuable suggestions on this manuscript.
Correspondence should be addressed to Dr. Maria A. Pastor, Department of Neurology, University of Navarra School of Medicine, Clinica Universitaria, Pamplona 31080, Spain. E-mail: mapastor@unav.es.
Copyright © 2003 Society for Neuroscience 0270-6474/03/2311621-07$15.00/0
References
- Basar E, Rosen B, Basar-Eroglu C, Greitschus F ( 1987) The associations between 40 Hz-EEG and the middle latency response of the auditory evoked potential. Int J Neurosci 33: 103-117. [DOI] [PubMed] [Google Scholar]
- Contreras D, Llinas R ( 2001) Voltage-sensitive dye imaging of neocortical spatiotemporal dynamics to afferent activation frequency. J Neurosci 21: 9403-9413. [DOI] [PMC free article] [PubMed] [Google Scholar]
- da Silva EA, Muller RA, Chugani DC, Shah J, Shah A, Watson C, Chugani HT ( 1999) Brain activation during intermittent photic stimulation: a [15O]-water PET study on photosensitive epilepsy. Epilepsia 40 [Suppl 4]: 17-22. [DOI] [PubMed] [Google Scholar]
- Di Russo F, Martinez A, Hillyard SA ( 2003) Source analysis of event-related cortical activity during visuo-spatial attention. Cereb Cortex 13: 486-499. [DOI] [PubMed] [Google Scholar]
- Dupont P, Orban GA, De Bruyn B, Verbruggen A, Mortelmans L ( 1994) Many areas in the human brain respond to visual motion. J Neurophysiol 72: 1420-1424. [DOI] [PubMed] [Google Scholar]
- Fink GR, Marshall JC, Weiss PH, Zilles KV ( 2001) The neural basis of vertical and horizontal line bisection judgments: an fMRI study of normal volunteers. NeuroImage 14: S59-S67. [DOI] [PubMed] [Google Scholar]
- Fox PT, Raichle ME ( 1985) Stimulus rate determines regional brain blood flow in striate cortex. Ann Neurol 17: 303-305. [DOI] [PubMed] [Google Scholar]
- Friston K, Ashburner J, Frith C, Poline J, Heather J, Frackowiak R ( 1995a) Spatial registration and normalization of images. Hum Brain Mapp 2: 165-189. [Google Scholar]
- Friston KJ, Holmes AP, Worsley KJ, Poline JP, Frith CD, Frackowiak RSJ ( 1995b) Statistical parametric maps in functional imaging: a general linear approach. Hum Brain Mapp 2: 189-210. [Google Scholar]
- Friston KJ, Holmes A, Poline JB, Price CJ, Frith CD ( 1996) Detecting activations in PET and fMRI: levels of inference and power. NeuroImage 4: 223-235. [DOI] [PubMed] [Google Scholar]
- Gaillard WD, Balsamo LM, Ibrahim Z, Sachs BC, Xu B ( 2003) fMRI identifies regional specialization of neural networks for reading in young children. Neurology 60: 94-100. [DOI] [PubMed] [Google Scholar]
- Galambos R, Makeig S, Talmachoff PJ ( 1981) A 40-Hz auditory potential recorded from the human scalp. Proc Natl Acad Sci USA 78: 2643-2647. [DOI] [PMC free article] [PubMed] [Google Scholar]
- Genovese CR, Lazar NA, Nichols T ( 2002) Thresholding of statistical maps in functional neuroimaging using the false discovery rate. NeuroImage 15: 870-878. [DOI] [PubMed] [Google Scholar]
- Gray CM, Konig P, Engel AK, Singer W ( 1989) Oscillatory responses in cat visual cortex exhibit inter-columnar synchronization which reflects global stimulus properties. Nature 338: 334-337. [DOI] [PubMed] [Google Scholar]
- Gutschalk A, Mase R, Roth R, Ille N, Rupp A, Hahnel S, Picton TW, Scherg M ( 1999) Deconvolution of 40 Hz steady-state fields reveals two overlapping source activities of the human auditory cortex. Clin Neurophysiol 110: 856-868. [DOI] [PubMed] [Google Scholar]
- Herrmann CSV ( 2001) Human EEG responses to 1-100 Hz flicker: resonance phenomena in visual cortex and their potential correlation to cognitive phenomena. Exp Brain Res 137: 346-353. [DOI] [PubMed] [Google Scholar]
- Krolak-Salmon P, Henaff MA, Tallon-Baudry C, Yvert B, Guenot M, Vighetto A, Mauguiere F, Bertrand OV ( 2003) Human lateral geniculate nucleus and visual cortex respond to screen flicker. Ann Neurol 53: 73-80. [DOI] [PubMed] [Google Scholar]
- Luck SJ, Chelazzi L, Hillyard SA, Desimone R ( 1997) Neural mechanisms of spatial selective attention in areas V1, V2, and V4 of macaque visual cortex. J Neurophysiol 77: 24-42. [DOI] [PubMed] [Google Scholar]
- Makeig S, Westerfield M, Jung TP, Enghoff S, Townsend J, Courchesne E, Sejnowski TJ ( 2002) Dynamic brain sources of visual evoked responses. Science 295: 690-694. [DOI] [PubMed] [Google Scholar]
- Marmor M, Arden G, Nilsson S, Zrenner E ( 1989) Standard for clinical electroretinography. International Standardization Committee. Arch Ophthalmol 107: 816-819. [DOI] [PubMed] [Google Scholar]
- McAdams CJ, Maunsell JH ( 1999) Effects of attention on the reliability of individual neurons in monkey visual cortex. Neuron 23: 765-773. [DOI] [PubMed] [Google Scholar]
- Mentis MJ, Alexander GE, Grady CL, Horwitz B, Krasuski J, Pietrini P, Strassburger T, Hampel H, Schapiro MB, Rapoport SI ( 1997) Frequency variation of a pattern-flash visual stimulus during PET differentially activates brain from striate through frontal cortex. NeuroImage 5: 116-128. [DOI] [PubMed] [Google Scholar]
- Muller MM, Hillyard SV ( 2000) Concurrent recording of steady-state and transient event-related potentials as indices of visual-spatial selective attention. Clin Neurophysiol 111: 1544-1552. [DOI] [PubMed] [Google Scholar]
- Oldfield RC ( 1971) The assessment and analysis of handedness: the Edinburgh inventory. Neuropsychologia 9: 97-113. [DOI] [PubMed] [Google Scholar]
- Pastor MA, Artieda J, Arbizu J, Marti-Climent JM, Penuelas I, Masdeu JC ( 2002) Activation of human cerebral and cerebellar cortex by auditory stimulation at 40 Hz. J Neurosci 22: 10501-10506. [DOI] [PMC free article] [PubMed] [Google Scholar]
- Rager G, Singer WV ( 1998) The response of cat visual cortex to flicker stimuli of variable frequency. Eur J Neurosci 10: 1856-1877. [DOI] [PubMed] [Google Scholar]
- Regan D ( 1966) An effect of stimulus colour on average steady-state potentials evoked in man. Nature 210: 1056-1057. [DOI] [PubMed] [Google Scholar]
- Ress D, Backus BT, Heeger DJ ( 2000) Activity in primary visual cortex predicts performance in a visual detection task. Nat Neurosci 3: 940-945. [DOI] [PubMed] [Google Scholar]
- Santarelli R, Maurizi M, Conti G, Ottaviani F, Paludetti G, Pettorossi VE ( 1995) Generation of human auditory steady-state responses (SSRs). II. Addition of responses to individual stimuli. Hear Res 83: 9-18. [DOI] [PubMed] [Google Scholar]
- Schmahmann JD, Doyon J, McDonald D, Holmes C, Lavoie K, Hurwitz AS, Kabani N, Toga A, Evans A, Petrides M ( 1999) Three-dimensional MRI atlas of the human cerebellum in proportional stereotaxic space. NeuroImage 10: 233-260. [DOI] [PubMed] [Google Scholar]
- Schroeder CE, Tenke CE, Arezzo JC, Vaughan Jr HG ( 1989) Timing and distribution of flash-evoked activity in the lateral geniculate nucleus of the alert monkey. Brain Res 477: 183-195. [DOI] [PubMed] [Google Scholar]
- Takahashi T, Tsukahara Y ( 1998) Photoparoxysmal response elicited by flickering dot pattern stimulation and its optimal spatial frequency of provocation. Electroencephalogr Clin Neurophysiol 106: 40-43. [DOI] [PubMed] [Google Scholar]
- Talairach J, Tournoux T ( 1988) Co-planar stereotaxic atlas of the human brain. New York: Thieme.
- Tallon-Baudry C, Bertrand O, Delpuech C, Pernier JV ( 1996) Stimulus specificity of phase-locked and non-phase-locked 40 Hz visual responses in human. J Neurosci 16: 4240-4249. [DOI] [PMC free article] [PubMed] [Google Scholar]