Abstract
In the oculomotor system, temporal integration of velocity commands into position signals may depend on synaptic feedback among neurons of a bilateral brainstem cell assembly known as the “neural integrator.” Both ipsilateral excitatory and contralateral inhibitory projections between eye position-related integrator cells are hypothesized as a substrate for positive feedback supporting integration. Presence of feedback interactions should be evident in cross-correlation functions of neuron pairs. Here, unilateral and bilateral paired recordings were obtained during fixation behavior from neurons in goldfish brainstem area I, a key element of the integrator. During fixations, discharge of most unilateral pairs, composed of cells with eye position sensitivities of the same sign, was positively correlated with lag of 0-10 msec (n = 11 of 14 significant). Typically, a very narrow peak (mean half-width <4 msec) near zero lag was observed. Discharge of bilateral pairs, composed of cells with position sensitivities of the opposite sign, was either negatively correlated with lag of 0-10 msec (n = 5 of 13 significant) or not correlated. Troughs in negative correlations always had minima between 3 and 5 msec lag. These results are consistent with the feedback hypothesis of temporal integration, highlighting excitation unilaterally and inhibition bilaterally. Absence of visual input did not weaken correlations, but other sources of correlated input extrinsic to area I were not ruled out. Triplet recordings revealed that unilateral pairwise correlations were primarily independent. Correlation between unilateral pairs systematically decreased with increasing eye position, demonstrating that synchrony is not necessary for persistent activity at high firing rates.
Keywords: eye position, fixation, memory, integrator, synchrony, persistence
Introduction
Maintenance of stable eye position depends on an oculomotor “neural integrator” that transforms velocity-encoded command or sensory signals to position-encoding outputs to extraocular motoneurons. Experiments in primate (Luschei and Fuchs, 1972; Cannon and Robinson, 1987; McFarland and Fuchs, 1992; Kaneko, 1997; Goldman et al., 2002) and cat (Lopez-Barneo et al., 1982; Cheron et al., 1986; Delgado-Garcia et al., 1989) indicate that the velocity-to-position neural integrator (VPNI) for horizontal eye movements is localized, in part, to two bilateral brainstem nuclei, the nucleus prepositus hypoglossi (NPH) and the medial vestibular nucleus (MVN) (for review, see Moschovakis, 1997); the cerebellum is also required for proper function (Robinson, 1974; Zee et al., 1981). Experiments in goldfish (Pastor et al., 1994; Aksay et al., 2000) suggest that the VPNI is localized, in part, to bilateral reticular regions analogous to the NPH termed area I. The mechanism of temporal integration at the VPNI has not been resolved. Most hypotheses suggest network interactions among VPNI cells (Lorente de No, 1933; Escudero et al., 1992), and several models using reverberant (feedback) activity exist (Kamath and Keller, 1976; Cannon et al., 1983; Galiana and Outerbridge, 1984; Seung et al., 2000). Alternative models suggest that integration depends on single-cell properties such as short-term synaptic plasticity (Shen, 1989), bistable potentials (Koulakov et al., 2002; Goldman et al., 2003), or moving calcium wave fronts (Loewenstein and Sompolinsky, 2003).
There is limited evidence that feedback plays a role in the horizontal VPNI. Although there are many anatomical studies characterizing the afferents, efferents, and intrinsic organization of the MVN-NPH (for review, see Fukushima et al., 1992; Moschovakis, 1997), there are few studies concerning the morphology of cells behaviorally identified as being eye position related (“position” neurons; for varieties, see Moschovakis, 1997). In monkey MVN, some position neurons with tonic activity that increased as the eyes moved ipsilaterally projected to the ipsilateral abducens and gave local collaterals in the NPH-MVN (McCrea et al., 1987), potentially initiating a feedback loop. To date, local collaterals have not been observed after perisomatic labeling of position neurons in goldfish (Aksay et al., 2000). In cat (McCrea et al., 1980) and monkey (McCrea et al., 1987) MVN and goldfish area I (Aksay et al., 2000), some position neurons presented collaterals in contralateral regions containing position cells. Electrophysiologically, there is indirect evidence of synaptic input to goldfish position neurons that could arise from other position cells (Aksay et al., 2001): namely, in some intracellular recordings, increase of membrane potential fluctuations correlated with ocular steps from nasal to temporal positions and associated steps in mean membrane potential.
Feedback pathways should produce a statistical trace in the spike timing of position neurons. Therefore, paired recordings in awake goldfish were obtained from area I cells on the same side (unilateral pairs) or opposites sides (bilateral pairs). Cross-correlation functions were analyzed for fixation positions sampled during spontaneous scanning behavior. Absence of correlation would indicate that cells discharged independently of each other, as in single-cell integrator models, seriously undermining the notion that network interactions are important for integration.
Materials and Methods
All experiments were performed in compliance with the Guide for the Care and Use of Laboratory Animals (Institute of Laboratory Animal Resources, 1996). Specific protocols were approved by the local Institutional Animal Care and Use Committee. Goldfish (Carassius auratus, 3-5“ tip to peduncle, 25-50 gm) were purchased from a commercial supplier (Hunting Creek Fisheries, Thurmont, MD) and kept at 20-22°C in large aquaria (>50 gallons) with daily exposure to light. Animal care, procedure for head fixation, surgical preparation, details of the experimental holding tank, and search coil method have been described previously (Aksay et al., 2000). Water temperature during experiments was regulated between 20 and 22°C using a thermoelectric element. Eye movements and microelectrode voltage during area I recordings were simultaneously digitized (Digidata 1200, Clampex 7; Axon Instruments, Burlingame, CA). Methods for extracellular recording have been described previously (Aksay et al., 2000).
Cross-correlations were determined on a fixation-by-fixation basis after excluding spikes within a 400 msec window centered on each saccade. The algorithm for the cross-correlation for an individual fixation was to identify a spike in one train (a), determine the differences in time with respect to the occurrence of the spikes in the other spike train (b), and then repeat the procedure for the next spike in a. The set of differences for each spike in (a) were then binned at 0.9 msec intervals, beginning with a bin centered at zero lag. Correlations for different fixations were then pooled. Shuffle-corrected correlations were calculated in the same manner after randomly permuting interspike intervals of spike train (b) within a fixation. For example, if there were five interspike intervals within a fixation, in order of appearance as 1, 2, 3, 4, 5, then a random shuffling of their order might have resulted in 4, 2, 1, 5, 3. The first and last spikes did not move, and the average rate stayed the same.
Excess pair correlation was calculated by comparing the counts in the central 21 bins to those in eight equally sized regions on the flanks of this central one, four to the left and four to the right. The next region to the right consisted of bins 11-31 above zero, the next had bins 32-52, and so on. The average count values in these regions will be referred to as (c-4, c-3, c-2, c-1, c0, c1, c2, c3, c4). Excess correlation was determined by finding the difference between the average count value in the central region (c0) and the average of the outer regions, (c). The values (ci - c) are shown in the insets of Figures 2 and 3. Dividing excess correlation by the mean count level in the outer regions yielded the excess correlation fraction, (c0/c - 1). The SD (σ) of the background (all ci except c0) was used to determine a significance level: excess correlation was significant if it was more than four SDs from baseline (p = 0.0001).
Figure 2.
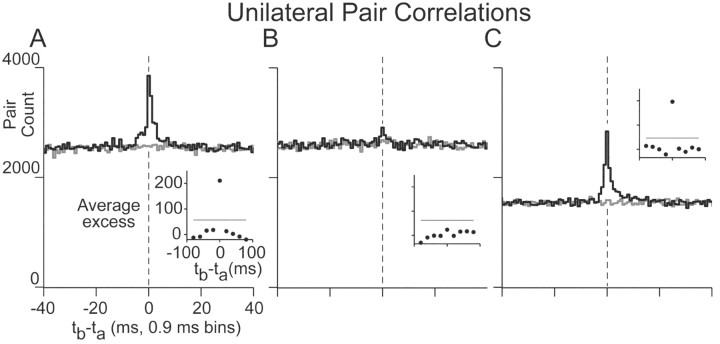
Cross-correlations of position cells on the same side of midline. A-C, For three different pairs, pair counts from correlations (black) and shuffle-correlations (gray). Vertical dashed lines highlight the position of zero lag. Insets show the average excess correlation relative to baseline at different time lags, measured over distinct 21 bin regions; horizontal line shows the 4σ significance level. In A, the correlation was calculated from (71,356, 104,763) action potentials recorded over 120 min, and the excess correlation was 8.4%. For B, action potential totals, excess, and recording time were (104,708, 91,636), 0.9%, and 125 min, and in C were (98,105, 65,026), 12.6%, and 125 min. Labels in A also apply to B and C.
Figure 3.
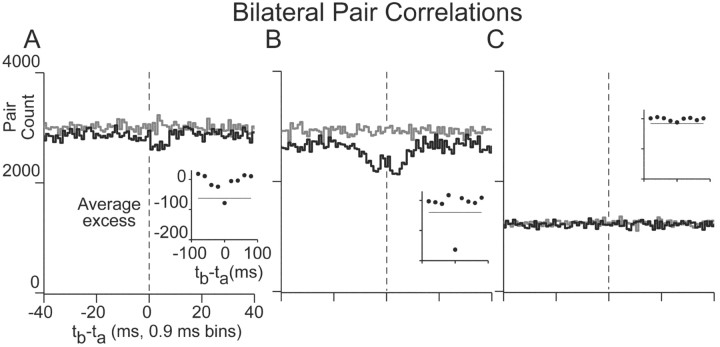
Cross-correlations of position cells on the opposite sides of midline. A-C, For three different pairs, pair counts from correlations (black) and shuffle-correlations (gray). Vertical dashed lines highlight the position of zero lag. Insets as in Figure 2. In A, the correlation was calculated from (132,255, 130,913) action potentials recorded over 95 min, and the excess correlation was -5.5%. For B, action potential totals, excess, and recording time were (148,986, 135,264), -12.4%, and 100 min, and in C were (160,274, 42,380), -2.0%, and 120 min. Labels in A also apply to B and C.
When pair count values were normalized by the number of spikes recorded from one of the cells of the pair, the cell with the highest position threshold was chosen. This was done because dividing by the number of spikes recorded from the lower threshold cell would yield artificially low values, because many of the spikes from the lower threshold cell occurred during fixations in which there were no spikes from the other cell and thus no contribution to the cross-correlation.
For assessing the variation of correlation strength with firing rate and increasing temporal position, fixations were grouped into bins of five spikes per second (sp/sec) according to the mean firing rate of the cell with higher threshold, beginning with those fixations in which the rate was at least 5 sp/sec. If data from a bin yielded a cross-correlation with a background pair count value of <25, those data were grouped with data from the next temporal bin (e.g., if the 5-10 sp/sec bin did not have enough data, it was grouped with the 10-15 sp/sec bin). This procedure typically resulted in larger bin widths at nasal to moderate positions; the largest bin used included data from 5-25 sp/sec. For the analysis accompanying Figure 6, eye position data were normalized to ±20°.
Figure 6.
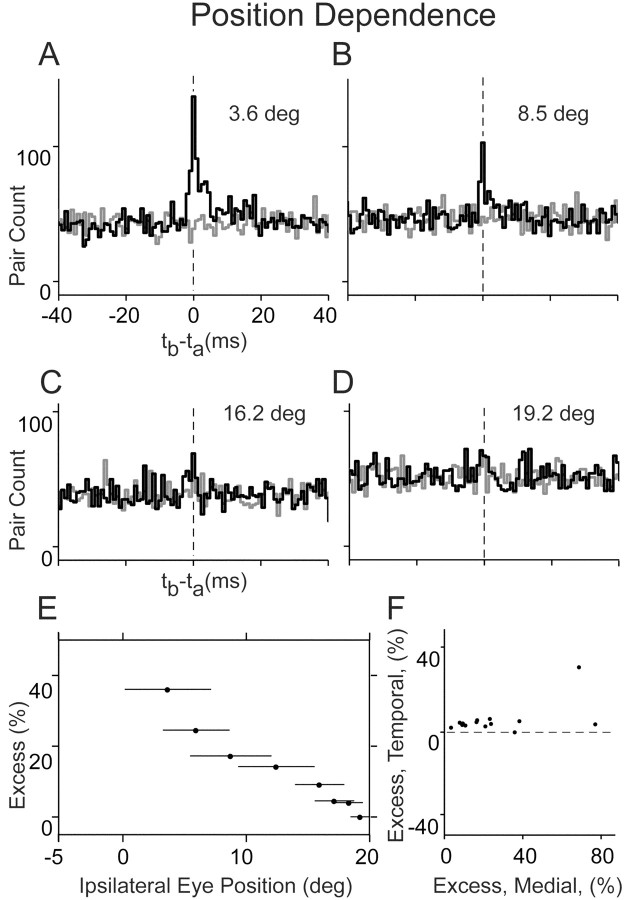
Cross-correlations strength varies with eye position. A-D, Correlations (black) and shuffle-correlations (gray) for data gathered from fixations, in medial to temporal order, at 3.6, 8.5, 16.2, and 19.2° (the rate ranges for the cell with higher threshold were 5-10, 17-18, 27-28, and 40-45 sp/sec, respectively, in A-D). Labels in A and C also apply to B and D. E, Excess pairings as a percentage of baseline for the pair pictured in A-D. Here, data were grouped into bins as described in Materials and Methods. Horizontal bars indicate the range in mean position of fixations in a particular bin. F, Excess pairings from the most temporal (y-axis) and most nasal (x-axis) positions for all ipsilateral pairs.
Results
Pair correlation
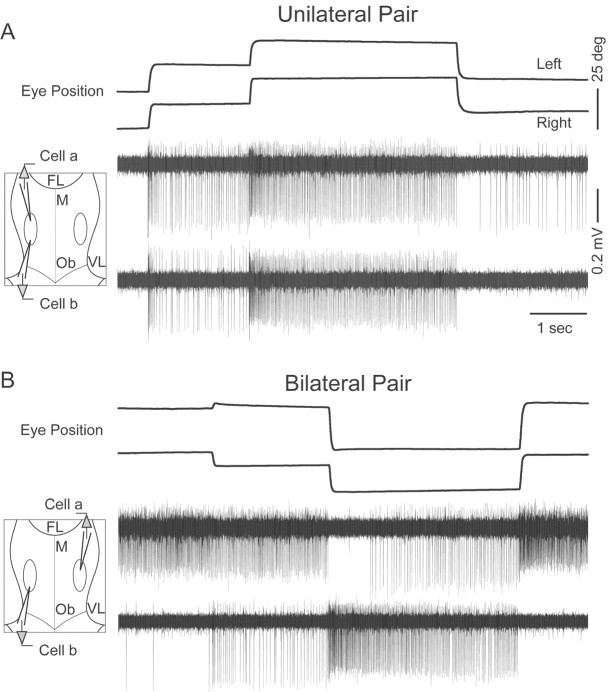
Action potential discharge by position neuron pairs (n = 27 pairs) was monitored while awake head-restrained goldfish performed spontaneous saccades and fixations during periods of light and dark (Fig. 1). Activity from each cell was recorded using separate electrodes. Cells on the same side of midline displayed steps of discharge rate in the same direction (Fig. 1A), whereas cells on opposite sides of midline displayed steps of rate in opposing directions (Fig. 1B). Unilaterally, cells frequently began or stopped firing at differing eye positions (Fig. 1A), giving rise to differing eye-position thresholds when viewed over many fixations (Aksay et al., 2000). The distance between pair recordings was typically >100 μm, limiting the possibility of recording from the same cell on two electrodes. The time over which units were recorded ranged from 4 to 130 min (median of 68), and the number of spikes per cell recorded over that time ranged from 4794 to 179,919 (median of 51,639).
Figure 1.
Paired recordings of position cells. A, B, Eye position and extracellularly recorded potentials from position neurons on the same (A) and opposite (B) sides of midline. Insets at left are schematized views of the fourth ventricle during recording. FL, Facial lobe; M, midline; Ob, obex; VL, vagal lobe. Scale bar for B is the same as for A.
Cross-correlation functions between the spike trains of two cells, arbitrarily labeled a and b, were tabulated by standard methods (Perkel et al., 1967), finding the number of occurrences (pair counts) of a particular spike-time difference (tb - ta) bin. Cross-correlations were determined after excluding spikes within a 400 msec window centered around each saccade. In the following, data from different eye positions and lighting conditions were pooled; later, these data will be analyzed separately. Unless otherwise noted, all correlation functions were unnormalized, with bin widths of 0.9 msec, and all references to a lag value implicitly included the negative of that value as well.
All cross-correlation functions for unilateral pairs (n = 14 of 14) had peaks with maxima between 0 and 3 msec lag (Fig. 2, black). Such peaks were not evident in the correlograms of the shuffled spike trains (gray), produced by randomly permuting the interspike intervals within a fixation. Positive correlation was most prominent between 0 and 10 msec lag. There was notable asymmetry at the base of many peaks (Fig. 2A,C). The strength of these positive correlations was quantified by comparing the counts of the peak region, 0-10 msec lag, to those of the baseline, 10-100 msec lag. This comparison focused on the number of pair counts in the peak region that were in excess of the baseline (Fig. 2, insets, which show average excess pair counts within groups of 21 bins). The excess correlation of the peak ranged from 1.3 to 38.8%, with a median of 7.7%. Eleven of 14 pairs had peaks with count values that were greater than four SDs away from baseline (Fig. 2A,C insets, horizontal lines indicate 4σ level); for these 11, the median excess correlation was 11.3%. For these pairs, the maximum of the peak was at the center bin (-0.45-0.45 msec) for all but two cases, in which the peaks were in the first and third bins. Peak full-width at half-maximum was 3.4 ± 1.7 msec.
Although many pairs were significantly correlated, in reference to the total spike count, the degree of pairing was small. For example, in the case of the pair of Figure 1A, there were 3850 pairings within the central bin, out of 71,356 cell a spikes, only 5.4% of the total. Complete correlation between the spikes of cell a and the spikes of cell b, with zero lag, would yield 71,356 such pairings. No correlation, shown by the shuffled correlogram (gray), would yield 2497 pairings on average, 3.5% of the total. Averaged over the 11 pairs with significant correlation, the fraction of zero-lag pairings to total spike counts was 4.7% compared with 3.2% in the uncorrelated case.
Most cross-correlation functions between bilateral pairs (n = 11 of 13) had valleys within 10 msec of lag that were not evident in the shuffle-corrected correlograms (Fig. 3). Valleys were typically less accentuated than the peaks of unilateral pairs, were offset from zero lag with minima between 3 and 5 msec lag (Fig. 3A,B), and occasionally had two minima (Fig. 3B). The strength of these negative correlations was determined as above: the excess ranged from -12.4 to 2.6%, with 11 of 13 pairs having negative correlation (median of -4.14%). Of these 11, five had valleys with count values that were farther than 4σ away from baseline (Fig. 3A,B insets) (median excess of -7.8%). The two pairs with positive excess did not have count values farther than 4σ away from baseline.
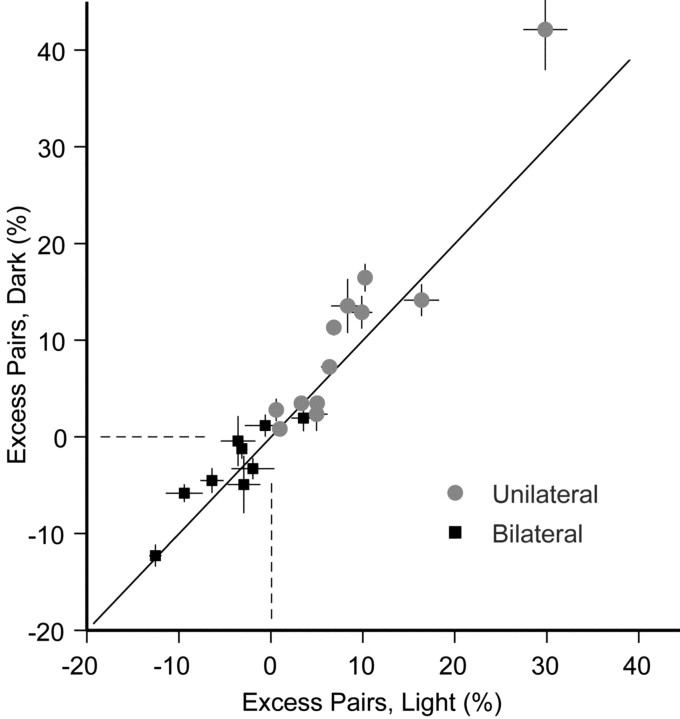
To ascertain whether correlations were attributable in part to common visual input, correlation excess was calculated for 12 ipsilateral and 9 bilateral pairs for which there were data from separate dark and light conditions (Fig. 4). The degree of excess pairing in the dark generally matched the degree of excess pairing in the light, indicating little systematic effect of visual input. In fact, there was a slight systematic increase of excess correlation in the dark (average dark-light value was 1.7%; p = 0.02). Visual comparison of the shapes of correlations in the light and dark also revealed no systematic variations (data not shown).
Figure 4.
Correlation for the population in the light and dark. Excess pair counts, expressed as a percentage relative to baseline, for same-sided cells (unilateral; gray) and opposite-sided cells (bilateral; black). The values in the light are plotted along the abscissa and in the dark along the ordinate. Dashed lines indicate 0 excess.
Input to position cells during saccades could act as a common synchronizing stimulus. If synchronization was initiated by saccadic input, then it may have weakened over the course of a fixation before having been reset at the next saccade. To test this, correlations were calculated for three fixation periods, from 0.5 to 1.0, from 1.0 to 1.5, and from 1.5 to 2.0 sec after saccades. Correlations from period one were averaged over all fixations and likewise for the latter periods. Correlations were found to remain unchanged or sometimes strengthen over the course of a fixation (data not shown). As a second test, correlations were calculated between the spikes of cell a of one fixation and the spikes of cell b of another fixation at the same position but later in time. This procedure yielded no correlations (data not shown).
Triplet correlation
Synchronous firing between many unilateral pairs of cells could have arisen from population synchrony in which many position neurons fire simultaneously and pairwise events only occur as part of a larger population event. To determine whether this was so, simultaneous recordings with three separate electrodes of three position neurons (arbitrarily labeled a, b, and c) were obtained during fixation behavior for two sets of triplets. The correlations among triplets were visualized in a manner similar to the visualization of correlations among pairs (Perkel et al., 1975). Although the time interval between spikes from two cells was a scalar (tb - ta) that could be represented along one axis, time intervals between spikes from three cells were fully defined by two scalars (tb - ta and tc - ta) that needed to be represented by two axes. In the two neuron case, the number of occurrences of a particular interval (pair counts) were indicated along a second dimension, the y-axis; in the three neuron case, the number of occurrences of a particular combination of intervals (triplet count) needed to be indicated along a third dimension, perhaps along the z-axis or by a color scale. Here, triplet counts were displayed using grayscale (Fig. 5) (bin width, 0.9 × 0.9 msec), along with individual pairwise correlations for reference.
Figure 5.
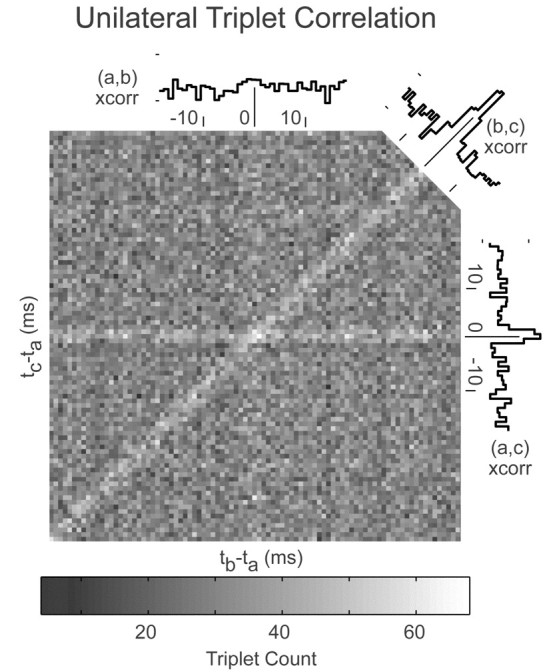
Triplet correlation between three position neurons. A, Triplet count level, indicated by the grayscale at bottom, as a function of lag (tb - ta) between cells labeled b and a (horizontal) and lag (tc- ta) between cells labeled c and a (vertical). Bin widths are 0.9 × 0.9 msec. Pairwise correlations are shown along the outside, in bin widths of 0.9 msec. For (ab) pair correlation, count indicators are 400 and 600; for (bc) and (ac), count indicators are 600 and 800. Data acquired over 5 min of recording; over this span, cell a fired 8727 spikes (highest threshold), cell b fired 11,676 spikes (no threshold), and cell c fired 15,215 spikes (no threshold).
A quick inspection of this correlogram revealed a great deal of pairwise synchrony without triplet synchrony. If triplet synchrony had occurred for every occurrence of pairwise synchrony, there would only have been one region of greatly elevated count, located at the center. This was only the case for pairwise events between cells a and b, denoted (ab), which fell along the vertical line defined by tb = ta. For this line, there was notable elevation only when tc also equals ta. In contrast, pairwise events between cells a and c (ac) frequently occurred in the absence of synchronous discharge from cell b, as indicated by the elevated counts all along the horizontal line defined by tc = ta. This is also true for events (bc), indicated along the diagonal. The second triplet also had strong pairwise lines (data not shown).
To determine whether there was any triplet synchrony that could not be explained by existing pairwise synchrony, the number of triplet counts in the central bin was compared with the number of counts expected if events (ac) occurred independently of events (bc). There were 68 counts in the central bin of the triplet correlogram (Fig. 5), whereas there were 847 counts in the central bin of the pair correlogram between cells a and c (Fig. 5, right). Complete correlation between the central pairwise events (ac) and (bc) would have yielded 847 such triplet counts. If (ac) and (bc) were not correlated, then the number of triplet counts expected in the center bin would be (nac*nbc/nc), where nac is the number of (ac) events, nbc is the number of (bc) events, and nc is the number of spikes recorded from cell c. With 847 (ac) and 950 (bc) pairings in the presence of 15,215 cell c spikes, one expected 52.9 triplet counts in the central bin. For reference, the average triplet count over the entire grid was 35.1, with an SD of 7.3. For the second triplet, the number of triplet counts in the central bin was 91, the number expected from analysis of the two strongest pairing was 62.8, and the background triplet level was 31.3 with an SD of 7.2. In summary, for the two sets, the number of triplet events in the central bin was 28.5 and 44.9% more than that expected by random overlap of pairwise events. Note, however, that even with this excess, the number of triplets was still very low compared with the number of pairwise events, typically <1 in every 10.
Variation of pair correlation with eye position
It has been suggested that synchronous discharge in a cell assembly may enable both short-term recall of memories and long-term modifications that store memories (Engel and Singer, 2001; Pesaran et al., 2002). Persistent tonic firing in the neural integrator is thought to represent recall or activation of a memory of eye position (Seung, 1996), with higher firing rates correlated with temporal positions. To determine whether change in position was also correlated with a change in synchrony, pairwise cross-correlations were obtained for restricted bands of eye position. Using the firing rate of the cell with the higher position threshold, fixations were grouped into bins in which the average rate was 5-10 sp/sec, 10-15 sp/sec, and so on. The correlograms for different rate bins for one pair are shown in Figure 6A-D. At an average eye position of 3.6°, this pair had an excess correlation of 35.9%; however, as eye position became more temporal, this correlation decreased, and, at an average position of 19.2°, the percentage dropped to -0.1%. The trend over the entire range of positions was monotically decreasing, as displayed in Figure 6E. For the population of ipsilateral pairs (n = 14) (Fig. 6F), there was little relationship between the degree of correlation at medial and temporal positions on a pair-by-pair basis, with excess pairing primarily absent and almost never significant at temporal positions (average medial position and excess were -2.1° and 25.8%; average temporal position and excess were 16.7° and 5.8%; and temporal excess was significant only for one pair).
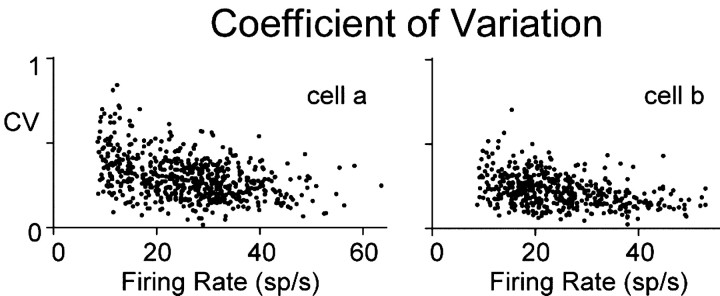
Possibly related to the decrease in synchrony at higher rates, the regularity of action potential discharge increased with temporal position. Discharge irregularity was assessed relative to the mean firing rate during a fixation by determining the coefficient of variation (CV), the ratio of SD to mean interspike interval; Figure 7 shows a typical example of how CV varied with mean rate for two cells of a pair. Spike irregularity decreased with mean firing rate in a similar manner for all cells (n = 28). For the lowest 5% of rates of each cell, CV was 0.49 ± 0.12, and, for the highest 5% of rates of each cell, CV was 0.23 ± 0.06.
Figure 7.
Interspike intervals become more regular at higher rate. Coefficient of variation for two cells of a pair plotted against firing rate of each cell. Labels for the left panel also apply to the right panel.
Discussion
The idea that feedback activity among a cell assembly is necessary for temporal integration in the oculomotor system has been a prominent part of many models of the VPNI. There is not, however, conclusive experimental data supporting this idea. Here, for the first time, cross-correlations of the discharge of pairs of position cells were analyzed for evidence relevant to the feedback hypothesis. Presence of correlation would be consistent with the hypothesis and may indicate the sign of interactions, whereas absence of correlation would cast serious doubt on the role of network activity and support the idea that single-cell intrinsic mechanisms underlie persistent neural firing. Significant correlations within a time window of 10 msec were found.
When viewed over many fixations, the discharges of many cell pairs on the same side of midline were positively correlated with relatively narrow peaks centered near zero lag. The correlation at very short time lag, tabulated in the central bin spanning -0.45-0.45 msec, suggests that at least part of the synchrony is attributable to correlated synaptic input on the two neurons. This input could be either intrinsic to area I, arising from other area I position cells, or extrinsic, arriving from other parts of the oculomotor system. Theoretically, common input could reflect feedback in a highly interconnected network in one nucleus or in a positive feedback pathway between two nuclei. Procedures were used to minimize potential sources of extrinsic correlation. First, analysis was restricted to those periods during which there was no saccadic activity. Second, data were obtained in the dark to eliminate common visual input. A potential source of correlation unexplored is input from neurons with tonic discharge residing in vestibular nuclei. The correlation away from zero lag could arise from either synchronizing input or pathways between unilateral position cells. The positive correlation between cells on the same side of midline, exhibiting the same eye position sensitivity, suggests that any monosynaptic or multisynaptic connections between these cells are likely to be excitatory or net excitatory. If these connections are reciprocated so that connective loops are formed, a substrate for positive feedback exists. Previously, connections between position cells on the same side of midline could not be anatomically identified after dye injection into perisomatic regions (Aksay et al., 2000). The present data suggest that this issue needs to be reinvestigated, perhaps with methods that can more strongly label axons and fine axon collaterals or reveal dendro-dendritic connections.
The correlation of bilateral pairs, when significant, was always negative and with peaks offset from zero. This negative correlation between cells on opposite sides of midline, exhibiting opposing eye position sensitivities, suggests that the anatomically identified crossing projections (Aksay et al., 2000) are inhibitory. If these projections are reciprocated, then the potential for positive feedback through recurrent inhibition exists. A previous report of unilateral area I inactivation in goldfish indicated modest deficits in eye-fixation stability (Pastor et al., 1994). This suggests that crossing inhibitory projections contribute to temporal integration in area I but are not the sole means by which it arises.
A pattern of ipsilateral recurrent excitation and contralateral recurrent inhibition among cells, like that proposed here for goldfish area I position neurons, may exist in mammals. On the basis of efferent projection patterns and position sensitivity, area I position neurons are most like the “principal” cells of the cat NPH (McCrea and Baker, 1985a,b; Aksay et al., 2000). Of the three morphological classes identified in the NPH with intracellular labeling in anesthetized cats, the principal cells were the projection neurons to the motor nuclei, with one group projecting to the ipsilateral abducens and giving local collaterals in the NPH, and another group projecting to the contralateral abducens and the contralateral NPH-MVN. Later work using spike-triggered averaging and antidromic stimulation from the abducens in alert cat to identify projection neurons from the NPH found that ipsilateral position cells were excitatory, and contralateral ones were inhibitory (Escudero et al., 1992). Combined, the two studies suggest excitatory pathways within unilateral NPH and inhibitory ones between bilateral NPH. Similar correlation studies performed in mammals would help confirm this suggested connectivity pattern.
The variation of correlation for ipsilateral pairs with eye position allowed exploration of the role of synchrony in generating persistent firing. At temporal positions, the virtual absence of correlation suggests that synchronous activity is not necessary for either generating or tuning persistent firing. This weakening of synchrony could occur because of several reasons, some of which are briefly mentioned here. First, it is known that the high firing rates of position neurons at temporal positions are achieved by elevating mean membrane potential and not just increasing fluctuation in potential at a value close to threshold (Aksay et al., 2001). This suggests that, after an action potential, the time course of membrane potential variation could be dominated by integration of a steady-state current; such an effect may be evident in previous data from intracellular recordings (Aksay et al., 2001, compare the traces at low firing rate in this reference in Fig. 7a,b with those at relatively higher firing rate in Fig. 2 and Fig. 3b, left panel, where the interspike intervals are dominated by ramps). Second, as interspike intervals shorten, the time of occurrence of an action potential will be influenced by the relative refractory period set by a slow afterhyperpolarization observed on many position neuron intracellular recordings (Aksay et al., 2001, their Fig. 3a). These two factors could contribute to regularizing spiking as firing rate increases (Fig. 7) and mask synchronizing influences. Third, if NMDA and AMPA receptors play a role in persistent firing, then, as eye position becomes more temporal, the ratio of NMDA to AMPA receptor-mediated current increases. Theoretical studies suggest that increasing this ratio decreases the degree of synchrony between cells in a network (Tegner et al., 2002). Fourth, high firing rates have been associated with asynchronous quantal release in slice experiments (Lu and Trussell, 2000), which would reduce synchrony between neurons.
The prevalence of correlated pairwise discharge at nasal positions brings into question the idea that intrinsic cellular properties could sustain persistent firing at low rates. Intrinsic properties such as plateau potentials have been hypothesized as a means by which single cells maintain a memory of brief stimuli (Egorov et al., 2002) and have been incorporated in models of the VPNI (Koulakov et al., 2002; Goldman et al., 2003). Although the onset and offset times of such plateaus on different cells may be temporally correlated via common saccadic input, the temporal dynamics of regenerative currents driving action potentials on different cells would be independent; thus, discharges arising from plateaus during fixations would be uncorrelated across cells. This is not the case here, especially at nasal positions. In fact, a large fraction of the spikes at nasal position are correlated with discharge of other position neurons. This follows from the observation that, for two neurons with firing rates of 10 sp/sec, one expects from chance 20 pairings within ±10 msec for every 100 spikes of one cell. At nasal positions, in which the excess correlation was typically 25%, one expects five more pairings. Given that there was little triplet correlation, it is highly probable that a different set of five action potentials would account for excess pairing with a third cell. Because the population of unilateral area I is thought to be 30-50 position neurons (Pastor et al., 1994; Aksay et al., 2000), it is evident that most of the action potentials at low rate will be correlated with the discharge of other position cells. Models based on intrinsic properties need to be able to account for this high prevalence of correlation. Conceivably, at nasal position, intrinsic events could be used simply to bring membrane potential in the spike initiation zone closer to threshold, and synaptic input could actually trigger discharge and dominate timing.
Footnotes
We acknowledge Mark Goldman for critical commentary on this work.
Correspondence should be addressed to Emre Aksay or David W. Tank, Department of Molecular Biology, Princeton University, Princeton, NJ 08544. E-mail: eaksay@princeton.edu or dwtank@princeton.edu.
Copyright © 2003 Society for Neuroscience 0270-6474/03/2310852-07$15.00/0
References
- Aksay E, Baker R, Seung HS, Tank DW ( 2000) Anatomy and discharge properties of pre-motor neurons in the goldfish medulla that have eye-position signals during fixations. J Neurophysiol 84: 1035-1049. [DOI] [PubMed] [Google Scholar]
- Aksay E, Gamkrelidze G, Seung HS, Baker R, Tank DW ( 2001) In vivo intracellular recording and perturbation of persistent activity in a neural integrator. Nat Neurosci 4: 184-193. [DOI] [PubMed] [Google Scholar]
- Cannon SC, Robinson DA ( 1987) Loss of the neural integrator of the oculomotor system from brain stem lesions in monkey. J Neurophysiol 57: 1383-1409. [DOI] [PubMed] [Google Scholar]
- Cannon SC, Robinson DA, Shamma S ( 1983) A proposed neural network for the integrator of the oculomotor system. Biol Cybern 49: 127-136. [DOI] [PubMed] [Google Scholar]
- Cheron G, Godaux E, Laune JM, Vanderkelen B ( 1986) Lesions in the cat prepositus complex: effects on the vestibulo-ocular reflex and saccades. J Physiol (Lond) 372: 75-94. [DOI] [PMC free article] [PubMed] [Google Scholar]
- Delgado-Garcia JM, Vidal PP, Gomez C, Berthoz A ( 1989) A neurophysiological study of prepositus hypoglossi neurons projecting to oculomotor and preoculomotor nuclei in the alert cat. Neuroscience 29: 291-307. [DOI] [PubMed] [Google Scholar]
- Egorov AV, Hamam BN, Fransen E, Hasselmo ME, Alonso AA ( 2002) Graded persistent activity in entorhinal cortex neurons. Nature 420: 133-134. [DOI] [PubMed] [Google Scholar]
- Engel AK, Singer W ( 2001) Temporal binding and the neural correlates of sensory awareness. Trends Cogn Sci 5: 16-25. [DOI] [PubMed] [Google Scholar]
- Escudero M, de la Cruz RR, Delgado-Garcia JM ( 1992) A physiological study of vestibular and prepositus hypoglossi neurones projecting to the abducens nucleus in the alert cat. J Physiol (Lond) 458: 539-560. [DOI] [PMC free article] [PubMed] [Google Scholar]
- Fukushima K, Kaneko CRS, Fuchs AF ( 1992) The neuronal substrate of integration in the oculomotor system. Prog Neurobiol 39: 609-639. [DOI] [PubMed] [Google Scholar]
- Galiana HL, Outerbridge JS ( 1984) A bilateral model for central neural pathways in vestibuloocular reflex. J Neurophysiol 51: 210-241. [DOI] [PubMed] [Google Scholar]
- Goldman MS, Kaneko CR, Major G, Aksay E, Tank DW, Seung HS ( 2002) Linear regression of eye velocity on eye position and head velocity suggests a common oculomotor neural integrator. J Neurophysiol 88: 659-665. [DOI] [PubMed] [Google Scholar]
- Goldman MS, Levine JH, Major G, Tank DW, Seung HS ( 2003) Dendritic hysteresis adds robustness to persistent neural activity in a model neural integrator. Cereb Cortex 13: 1185-1195. [DOI] [PubMed] [Google Scholar]
- Institute of Laboratory Animal Resources ( 1996) Guide for the care and use of laboratory animals. Washington, DC: National Academy.
- Kamath BY, Keller EL ( 1976) A neurological integrator for the oculomotor control system. Math Biosci 30: 341-352. [Google Scholar]
- Kaneko CRS ( 1997) Eye movement deficits after ibotenic acid lesions of the nucleus prepositus hypoglossi in monkeys. I. Saccades and Fixation. J Neurophysiol 78: 1753-1768. [DOI] [PubMed] [Google Scholar]
- Koulakov AA, Raghavachari S, Kepecs A, Lisman JE ( 2002) Model for a robust neural integrator. Nat Neurosci 5: 775-782. [DOI] [PubMed] [Google Scholar]
- Loewenstein Y, Sompolinsky H ( 2003) Temporal integration by calcium dynamics in a model neuron. Nat Neurosci 6: 961-967. [DOI] [PubMed] [Google Scholar]
- Lopez-Barneo J, Darlot C, Berthoz A, Baker R ( 1982) Neuronal activity in prepositus nucleus correlated with eye movement in the alert cat. J Neurophysiol 47: 329-352. [DOI] [PubMed] [Google Scholar]
- Lorente de No R ( 1933) Vestibulo-ocular reflex arc. Arch Neurol Psychiatry 30: 245-291. [Google Scholar]
- Lu T, Trussell LO ( 2000) Inhibitory transmission mediated by asynchronous transmitter release. Neuron 26: 683-694. [DOI] [PubMed] [Google Scholar]
- Luschei ES, Fuchs AF ( 1972) Activity of brain stem neurons during eye movements of alert monkeys. J Neurophysiol 35: 444-461. [DOI] [PubMed] [Google Scholar]
- McCrea RA, Baker R ( 1985a) Cytology and intrinsic organization of the perihypoglossal nuclei in the cat. J Comp Neurol 237: 360-376. [DOI] [PubMed] [Google Scholar]
- McCrea RA, Baker R ( 1985b) Anatomical connections of the nucleus prepositus of the cat. J Comp Neurol 237: 377-407. [DOI] [PubMed] [Google Scholar]
- McCrea RA, Yoshida K, Berthoz A, Baker R ( 1980) Eye movement related activity and morphology of second order vestibular neurons terminating in the cat abducens nucleus. Exp Brain Res 40: 468-473. [DOI] [PubMed] [Google Scholar]
- McCrea RA, Strassman A, May E, Highstein SM ( 1987) Anatomical and physiological characteristics of vestibular neurons mediating the horizontal vestibulo-ocular reflex of the squirrel monkey. J Comp Neurol 264: 547-570. [DOI] [PubMed] [Google Scholar]
- McFarland JL, Fuchs AF ( 1992) Discharge patterns in nucleus prepositus hypoglossi and adjacent medial vestibular nucleus during horizontal eye movement in behaving macaques. J Neurophysiol 68: 319-332. [DOI] [PubMed] [Google Scholar]
- Moschovakis AK ( 1997) The neural integrators of the mammalian saccadic system. Front Biosci 2: 552-577. [DOI] [PubMed] [Google Scholar]
- Pastor AM, de la Cruz RR, Baker R ( 1994) Eye position and eye velocity integrators reside in separate brainstem nuclei. Proc Natl Acad Sci USA 91: 807-811. [DOI] [PMC free article] [PubMed] [Google Scholar]
- Perkel D, Gerstein G, Moore G ( 1967) Neuronal spike trains and stochastic point processes. II. Simultaneous spike trains. Biophys J 7: 419-440. [DOI] [PMC free article] [PubMed] [Google Scholar]
- Perkel D, Gerstein G, Smith M, Tatton W ( 1975) Nerve-impulse patterns: a quantitative display technique for three neurons. Brain Res 100: 271-296. [DOI] [PubMed] [Google Scholar]
- Pesaran B, Pezaris JS, Sahani M, Mitra PP, Andersen RA ( 2002) Temporal structure in neuronal activity during working memory in macaque parietal cortex. Nat Neurosci 5: 805-811. [DOI] [PubMed] [Google Scholar]
- Robinson DA ( 1974) The effect of cerebellectomy on the cat's vestibulo-ocular integrator. Brain Res 71: 195-207. [DOI] [PubMed] [Google Scholar]
- Seung HS ( 1996) How the brain keeps the eyes still. Proc Natl Acad Sci USA 93: 13339-13344. [DOI] [PMC free article] [PubMed] [Google Scholar]
- Seung HS, Lee DD, Reis BY, Tank DW ( 2000) Stability of the memory of eye position in a recurrent network of conductance-based model neurons. Neuron 26: 259-271. [DOI] [PubMed] [Google Scholar]
- Shen L ( 1989) Neural integration by short term potentiation. Biol Cybern 61: 319-325. [DOI] [PubMed] [Google Scholar]
- Tegner J, Compte A, Wang XJ ( 2002) The dynamical stability of reverberatory neural circuits. Biol Cybern 87: 471-481. [DOI] [PubMed] [Google Scholar]
- Zee DS, Yamazaki A, Butler PH, Gucer G ( 1981) Effects of ablation of flocculus and paraflocculus of eye movements in primate. J Neurophysiol 46: 878-899. [DOI] [PubMed] [Google Scholar]


