

Abstract
Electroconvulsive seizure therapy (ECS) is a clinically proven treatment for depression and is often effective even in patients resistant to chemical antidepressants. However, the molecular mechanisms underlying the therapeutic efficacy of ECS are not fully understood. One theory that has gained attention is that ECS and other antidepressants increase the expression of select neurotrophic factors that could reverse or block the atrophy and cell loss resulting from stress and depression. To further address this topic, we examined the expression of other neurotrophic-growth factors and related signaling pathways in the hippocampus in response to ECS using a custom growth factor microarray chip. We report the regulation of several genes that are involved in growth factor and angiogenic-endothelial signaling, including neuritin, stem cell factor, vascular endothelial growth factor (VEGF), VGF (nonacronymic), cyclooxygenase-2, and tissue inhibitor of matrix metalloproteinase-1. Some of these, as well as other growth factors identified, including VEGF, basic fibroblast growth factor, and brain-derived neurotrophic factor, have roles in mediating neurogenesis and cell proliferation in the adult brain. We also examined gene expression in the choroid plexus and found several growth factors that are enriched in this vascular tissue as well as regulated by ECS. These data suggest that an amplification of growth factor signaling combined with angiogenic mechanisms could have an important role in the molecular action of ECS. This study demonstrates the applicability of custom-focused microarray technology in addressing hypothesis-driven questions regarding the action of antidepressants.
Keywords: antidepressant, gene, growth factor, hippocampus, neurotrophic, seizure
Introduction
Although electroconvulsive seizure therapy (ECS) represents the most effective treatment for depression and refractory mania, the exact mechanisms underlying the actions of ECS as well as chemical antidepressants are not known. However, there is evidence indicating that neurotrophic factors play a role in the treatment as well as pathophysiology of depression (Duman et al., 1999; Manji and Duman, 2001; Nestler et al., 2002). Expression of brain-derived neurotrophic factor (BDNF) and its receptor, tyrosine receptor kinase B (TrkB), are increased after ECS and in response to chemical antidepressants (Nibuya et al., 1995; Angelucci et al., 2002). In addition, infusions of BDNF into either the midbrain or hippocampus produce an antidepressant-like effect in behavioral models of depression (Siuciak et al., 1997; Shirayama et al., 2002). Moreover, the actions of chemical antidepressants in the forced swim test are dependent on BDNF-TrkB signaling (Saarelainen et al., 2003). Basic fibroblast growth factor (FGF-2) is also upregulated in response to ECS as well as chemical antidepressants (Mallei et al., 2002). Expression of receptors for glial-derived neurotrophic factor (GDNF), a potent trophic agent for dopamine neurons, is upregulated after ECS (AC Chen et al., 2001b). ECS also induces mossy fiber sprouting (Vaidya et al., 1999; AC Chen et al., 2001a; Lamont et al., 2001) and increases cell proliferation in the hippocampus (Madsen et al., 2000b; Malberg et al., 2000).
In contrast, neuronal atrophy and cell loss have been observed in animal models of stress and in depressed patients (Duman et al., 1997; Manji and Duman, 2001; Nestler et al., 2002). Chronic stress causes atrophy and reduced neurogenesis of hippocampal neurons (Watanabe et al., 1992; Gould et al., 1997; Czeh et al., 2001) and decreased hippocampal volume (Czeh et al., 2001). Brain imaging of the human brain demonstrates a reduction in the volume of several limbic structures, including the hippocampus, prefrontal cortex, and amygdala (Duman and Charney, 1999; Manji and Duman, 2001), and postmortem studies demonstrate a reduction in the size of neurons and the number of glia in the prefrontal cortex (Ongur et al., 1998; Rajkowska et al., 1999; Cotter et al., 2001). Decreased neurotrophic factor support could play a role in the neuronal atrophy and cell loss observed in depressed patients, and the therapeutic action of antidepressants may occur in part via upregulation of neurotrophic factors (Duman et al., 1999; Manji and Duman, 2001). This hypothesis is supported by a report that BDNF is upregulated in postmortem tissue of patients receiving antidepressant treatment at the time of death (B Chen et al., 2001).
The advent of microarray technology prompted us to develop a customized and targeted approach to study the role of neurotrophic-growth factors in antidepressant action. We produced a glass-based cDNA chip containing known classes of growth factors and related receptors as well as genes regulated by the cAMP-cAMP response element-binding protein (CREB) cascade, which has also been implicated in the action of antidepressants (Nibuya et al., 1996; Thome et al., 2000). Hippocampal gene expression profiles were generated from rats that received either a single acute or repeated ECS. We also examined the choroid plexus (CP) on the basis of preliminary studies demonstrating enrichment of certain growth factors in this tissue. Here, we report the regulation of several genes involved in neurotrophic-growth factor signaling as well as genes involved in angiogenesis and vasodilation. Our approach demonstrates that microarray technology is not limited to the discovery and collection of large data sets of gene expression information but can also be used as a molecular biology tool to address a specific hypothesis in an inclusive manner. In the present study, we use this approach to further test the hypothesis that ECS increases the expression of neurotrophic-growth factor expression in the hippocampus.
Materials and Methods
Animals. Male Sprague Dawley rats (160-180 gm; Charles River Labs, Wilmington, MA) were housed, four per cage, under standard illumination parameters (12 hr light/dark cycle) and were given free access to water and food. Animal use procedures were in strict accordance with the National Institutes of Health Guide for the Care and Use of Laboratory Animals and were approved by the Yale University Animal Care and Use Committee.
Custom growth factor chip. A custom cDNA expression array (645 genes) (see supplementary information for list; available at www.jneurosci.org) containing known classes of growth factor families, relevant receptors, cAMP response element (CRE) sequence-containing genes, published antidepressant regulated genes, and well characterized cytokines was produced. The cDNA products spotted on the chip were generated by PCR amplification of rat whole-brain cDNA using stringent amplification conditions. Gene-specific, high-melt temperature PCR primers to the genes of interest were designed using expressed sequence information obtained from public database searches. A Sybr green-based real-time PCR protocol, using the Quantitect Sbyr green PCR mix (Qiagen, Valencia, CA), that amplified products with a very high degree of specificity was used for the purpose. Melt-curve analysis was performed on a subset of the genes as another means to ascertain specificity of amplification and purity of the PCR products. PCR products were in the size range of 100-300 bp. The PCR products were precipitated in ethanol-NaCl, washed with cold 70% ethanol, dried, and resuspended in nuclease-free water. Products were printed under denaturing conditions in 50% DMSO buffer onto gamma amino propyl silane or UltraGAPS slides (Corning, Corning, NY) using a robotic microarrayer (GeneMachines; OmniGrid, San Carlos, CA).
ECS treatment. Rats were divided into the following four groups for each time point (2 or 6 hr): sham acute, sham chronic, acute, and chronic. Rats were placed in plastic cages containing fresh bedding before induction of seizures. Bilateral ECS was administered via moistened pads on spring-loaded ear clip electrodes using a pulse generator (ECT Unit 57800-001; Ugo Basile, Comerio, Italy) (frequency, 100 pulses/sec; pulse width, 0.5 msec; shock duration, 0.5 sec; current, 55 mA) (Madsen et al., 2000b; AC Chen et al., 2001a). This consistently produced a generalized grand mal seizure with characteristic clonic and tonic convulsions. Acute animals received one shock and tissue was collected 2 or 6 hr after shock, whereas chronic animals received 10 shocks over the period of 10 d (one shock each day) and tissue was collected 2 or 6 hr after the last seizure. Sham-treated animals were handled the same as their respective acute and chronic treated animals and had ear clips placed on their ears, but no shock was delivered. All animals were killed by decapitation. The brains were quickly removed and the entire hippocampus was manually dissected and rapidly frozen on dry ice.
Microarray analysis of gene expression. Total hippocampal RNA from individual animals was isolated using a nonphenolic procedure (RNA Aqueous; Ambion, Austin, TX). Optical density values at 260/280 were consistently above 1.9. RNA quality was also determined by reducing gel electrophoresis. Five micrograms of total RNA from ECS-treated and sham-treated rats (n = 4) was reverse-transcribed into cDNA and indirectly labeled using a sensitive fluorescent labeling procedure (Genisphere, Hatfield, PA). A two-step hybridization and labeling protocol was used where the chip was hybridized to cDNA overnight, washed stringently to remove nonspecifically bound probe, and then poststained with fluorescent dendrimers. After posthybridization washes, slides were scanned using a GenePix scanner (Axon Instruments, Union City, CA). Image analysis was performed using GenePix Pro 4.0 software. Resulting files from Genepix 4.0 (Axon Instruments) analysis were imported into Genespring 5.0 (Silicon Genetics, Redwood City, CA) for additional visualization and data mining. A gene was considered expressed if its signal intensity was a minimum of twice the background in at least one channel of one-half of the replicates. Per-chip normalization was performed by dividing the expressed genes by the median of two housekeeping control genes that were not regulated, β-tubulin and cyclophilin. Gene regulation was determined by taking the log ratio of the median experimental channel signal to the median control channel signal. Upregulated genes were defined as having an average expression ratio of >1.3, and downregulated genes were defined as having an average expression ratio of <0.7. Raw fluorescence values were obtained directly from the spots for certain genes of interest, including vascular endothelial growth factor (VEGF), VGF, and FGF-2. Secondary validation was performed if they were regulated by ≥20% in two of the four samples. Statistical analysis was performed by an unpaired t test using the cross-gene pooled error method in the Genespring software. Genes that had a p value of ≤0.05 were then classified into relevant functional categories. The functional classes were further subjected to ANOVA analysis followed by Scheffe's post hoc analysis. This was done for the four treatment groups, acute (2 hr after ECS), acute (6 hr after ECS), chronic (2 hr after ECS), and chronic (6 hr after ECS).
Choroid plexus gene expression. Rats were administered chronic ECS (10 d) as described above, and the lateral choroid plexus from both hemispheres of sham and ECS was removed by manual dissection and placed in microfuge tubes maintained on dry ice. Animals (n = 6) for the choroid plexus experiments were killed 6 hr after the last ECS. The tissue from each experimental group was pooled so that sufficient RNA could be extracted for microarray analysis. RNA extraction, cDNA synthesis, and labeling was accomplished as described above. Experiments were performed using three sets (n = 6 for each set) of pooled samples. A fixed ratio was used to determine gene enrichment in the brain regions examined. A gene was considered enriched in a particular brain region if the expression ratio exceeded 1.3. In a comparison of hippocampus versus choroid plexus, genes with a ratio of <0.7 were considered to be enriched in the hippocampus, genes with a ratio between 0.7 and 1.3 were considered to be present equally in the hippocampus and choroid plexus, and genes with a ratio of >1.3 were considered enriched in the choroid plexus.
RNA blot assay. Total RNA was manually spotted in duplicate on Nylon filters (Hybond, positively charged; Amersham Biosciences, Arlington Heights, IL) after heating at 80°C for 10 min. Two microliters of 10-15 ng/μl RNA was spotted for each gene of interest, and 5 ng/ul was spotted for housekeeping genes. A fourfold dilution series was included to ensure linearity of signal for each assayed gene. The filters were allowed to dry for 30 min and were cross-linked using a UV cross-linker. Filters were incubated in a prehybridization solution containing 6.25 ml of hybridization buffer (UltraHyb; Ambion), 0.75 ml of formamide, and 14 μl of ProtectRNase RNase inhibitor (catalog #R7397; Sigma, St. Louis, MO) for 1 hr in a rotating oven at 65°C. Radiolabeled riboprobe [same as the probe used for in situ hybridization (ISH), except that 33P is the radiolabel] of one million counts per milliliter was added to the filters in prehybridization buffer and incubated overnight. Filters were washed twice for 10 min at 65°C in 2 × SSC and 0.1% SDS to remove unbound probe, followed by a 10 min wash at 37°C in 2 × SSC. The following RNase treatment step was included to remove nonspecifically bound probe: 20 min incubation at room temperature in RNase buffer (20 ml of 5 m NaCl, 2 ml of 1 m Tris, pH 8.0, 400 μl of 0.5 m EDTA in 200 ml of distilled water) containing 100 μl of 20 mg/ml RNase A. Filters were then washed in 2 × SSC at room temperature for 10 min, followed by a wash at 55°C in 0.5 × SSC and then 0.1% SDS for 10 min. After a final wash in 0.1 × SSC at room temperature for 10 min and a rinse in distilled water, filters were placed on glass plates and covered with saran wrap and exposed to a phosphoscreen. Screens were imaged in a phosphorimager (Cyclone; Packard, Meriden, CT) and quantified using OptiQuant software.
In situ hybridization analysis. ISH was performed using radiolabeled riboprobes according to conventional protocols with minor modifications (Newton et al., 2002). Riboprobes were generated by PCR amplification using gene-specific primers. The reverse primer included a T7 template sequence. Whole rat brain cDNA was used as the template for PCR, which was performed in a real-time PCR instrument (SmartCycler; Cepheid, Sunnyvale, CA) using the Quantitect Sybr Green PCR kit (Qiagen). PCR product was purified by ethanol precipitation and was resuspended in TE buffer. One microgram of the 300 bp PCR product was used to produce radiolabeled riboprobe using a T7-based in vitro transcription kit (Megashortscript; Ambion). All riboprobes were verified by sequencing of the PCR product. ISH images were quantified using NIH Image software, and statistical analysis was performed using Statview.
Immunohistochemistry. Immunohistochemical analysis was performed on fresh, frozen, cryocut sections using a protocol that was optimized in our laboratory (Newton et al., 2002). Briefly, cyrocut sections were mildly fixed in 4% paraformaldehyde and blocked for 30 min in 2.5% BSA, followed by incubation in primary antibody solution. Unbound antibody was rinsed away before incubation with biotinylated secondary antibody. Nonspecific secondary antibody was removed followed by 1 hr in ABC reagent (Vector Laboratories, Burlingame, CA). Antigen detection was done by DAB staining according to the instructions of the manufacturer (Vector Laboratories). Cyclooxygenase-2 (Cox-2) antibody (Cayman Chemicals, Ann Arbor, MI) was used at 1:500 dilution, and tissue inhibitor of matrix metalloproteinase (TIMP-1) antibody (R & D Systems, Minneapolis, MN) was used at 1:2000 dilution. Sections were dehydrated by a series of alcohol rinses and were coverslipped in DPX (Fluka, Buchs, Switzerland) mountant. Sections were photographed using a digital camera (DVC, Austin, TX) under bright-field microscopy using identical exposure times and illumination for sections from sham and ECS animals.
Results
The role of growth factor signaling in the molecular action of ECS was studied using a customized microarray approach. The glass chip that we developed contains 645 genes, including most known growth factor classes, cognate receptors, known downstream targets, and genes containing CRE sites in their promoter region.
Microarray analysis using custom growth factor array
The chip exhibited high sensitivity and reproducibility and detected at least 80% of the spotted targets in each hybridization (Fig. 1). Hippocampal gene regulation was examined as a function of either acute or chronic treatments at two time points, 2 and 6 hr after the last seizure. These two time points were chosen so that immediate as well as slow onset genes could be detected. In addition, we profiled the genes expressed in the choroid plexus in comparison with the cortex or hippocampus and also examined the regulation of choroid plexus genes in response to ECS. We chose a 30% cutoff value on the basis of the results of previous brain region microarray studies, which show that gene regulation levels in brain tissue are lower than the standard twofold cutoff used for cell culture or other more homogeneous tissues (Mirnics et al., 2000). Also, we were able to successfully confirm genes that are regulated by 30%, using independent measures, and frequently observed with in situ hybridization confirmation that the levels of regulation in particular cell layers are much higher than the level of regulation obtained when using total RNA isolated from a dissected brain region.
Figure 1.

Dual color image of the custom growth factor microarray chip. PCR products of 645 genes were printed in duplicate on Corning UltraGAPS slides. The glass chip was simultaneously hybridized to cDNA from sham and ECS-treated animals that were indirectly labeled using Cy3 and Cy5 dendrimers, respectively. Four micrograms of hippocampal total RNA was used to generate cDNA for each experiment. The magnified inset shows the housekeeping genes β-actin, cyclophilin, and β-tubulin (yellow box), an upregulated gene, Cox-2 (red box), and a downregulated gene, 3′ untranslated region of cyclin D1 (green box).
In the hippocampus, 2-7% of the genes were regulated in the various treatment groups, with chronic ECS (6 hr time point) showing the maximum number of regulated genes (37 upregulated, 49 downregulated). The upregulated genes from both acute and chronic ECS at both time points were categorized into four classes on the basis of the following known functional effects: growth factor signaling, angiogenesis and vasodilation, neurotransmitter signaling and transcriptions factors, and kinases (Fig. 2). We chose to include data from acute and chronic ECS from both time points to obtain a wider coverage of regulated genes from our focused array, because our primary intention was to examine the regulation of growth factor signaling after ECS. Most genes that were regulated with acute ECS were also regulated with chronic ECS, except where indicated. Higher levels of regulation but fewer regulated genes were seen with acute versus chronic ECS treatment. Few genes showed regulation in opposite directions when comparing the 2 and 6 hr time points, notably early growth response-2 (Egr-2) and BDNF, which were upregulated at 2 hr for acute and chronic and downregulated at 6 hr.
Figure 2.

Classification of genes upregulated by ECS. Upregulated genes from both acute and chronic ECS-treated rats from two time points (2 and 6 hr) are classified on the basis of known functional roles into the following four categories: (1) growth factor signaling, (2) angiogenesis and vasodilation, (3) neurotransmitter signaling, and (4) transcription factors and kinases. Graphs show the mean ratio (ECS:sham) of fold change in gene upregulation. Dotted horizontal line indicates a ratio of 1 (i.e., no regulation). Error bars represent SEM of four replicates, each from a different animal.
ANOVA analysis followed by the Scheefe's post hoc analysis for the four functional categories in the four treatment groups, acute (2 and 6 hr after ECS) and chronic (2 and 6 hr after ECS) showed the data to be very significant for several groups (growth factor signaling: acute 2 hr, p < 0.009; chronic 2 hr, p < 0.0001; angiogenesis and vasodilation: acute 2 hr, p < 0.017; acute 4 hr, p < 0.04; chronic 2 hr, p < 0.0001; neurotransmitter signaling: acute 2 hr, p < 0.005; acute 6 hr, p < 0.0001; chronic 2 hr, p < 0.0006; chronic 6 hr, p < 0.0001; transcription factors and kinases: acute 2 hr, p < 0.0002).
We found several different growth factors to be regulated by ECS. In addition to the factors previously identified (i.e., BDNF and FGF-2), we also found that nerve growth factor (NGF), neuritin, VEGF, and stem cell factor were upregulated. In addition to these factors, several gene products that are involved in growth factor signaling were also upregulated (Fig. 2A). These included the GDNF family receptor α1, Smad interacting protein 1, platelet-derived growth factor receptor, and tumor necrosis factor receptor.
Secondary confirmation of differentially expressed genes
Secondary validation for several regulated genes was performed in an independent set of ECS-treated animals different from those used for the microarray study. Shown in Figure 3 are representative ISH images for several growth factors or growth factor-induced genes that were identified on the cDNA array. The ISH images are from acute ECS treatments, whereas quantitative graphs are presented for both acute and chronic treatments. Neuritin, an activity and neurotrophic factor-induced gene (Naeve et al., 1997), was upregulated after both acute and chronic ECS (Fig. 3A). The highest level of regulation was in the granule cell layer of the dentate gyrus (DG), although a statistically significant upregulation was seen in the CA1 pyramidal cell layer with chronic ECS treatment. We also optimized a sensitive RNA blot assay, which also confirms the results of the microarray experiments. The RNA blots were conducted using total hippocampal RNA, and there is generally a lower level of regulation than that shown by ISH where cell layer-specific regulation and anatomical distribution data can be obtained.
Figure 3.

Secondary confirmation of microarray data by in situ hybridization and RNA blot assay. Representative photomicrographs of hippocampal sections from ISH and RNA blot assays using radiolabeled riboprobes are shown, and quantified expression from the indicated cell layers is shown by bar graphs on the right. Results are expressed as a percentage of sham and are the mean ± SEM of four separate animals, each analyzed in duplicate brain sections. Lanes 1-4 in the RNA blots indicate individual samples, each from a separate animal, spotted in duplicate. The housekeeping gene cyclophilin was used to normalize the signal from sham and ECS groups. With the exception of NPY, all ISH images are from acute ECS-treated rats. Upregulation of the neuritin gene shown in A (top) is most evident in the DG granule cell layer after either acute or chronic treatments. A significant increase was also observed in the CA1 pyramidal cell layer after chronic ECS. B, Expression of VEGF in the choroid plexus and induction in the CA1 and CA3 pyramidal cell layers and DG granule cell layer. C, VGF was significantly upregulated in the DG with acute ECS and in the DG and CA3 pyramidal cell layers with chronic ECS. D, Regulation of BDNF was confirmed using the RNA blot assay only. E, FGF-2 shows prominent expression in the CA2 of both sham and ECS groups with maximal induction seen in the DG.
VEGF and VGF were regulated by only 26 and 21%, respectively (Fig. 2A,B), on the array, but we chose to further examine these two genes because they were consistently regulated across all replicate samples and because they are genes of interest. ISH analysis revealed a much higher level of regulation in specific subregions of the hippocampus, especially the dentate gyrus. VEGF, previously recognized only as an endothelial mitogenic factor, is now emerging as a pleiotropic factor with potent neurotrophic effects (Jin et al., 2002). VEGF was expressed in several brain regions, including the hippocampus and choroid plexus. It is likely that endothelial cells in the brain are also sources of VEGF mRNA. Regulation of VEGF was most pronounced in the DG after acute ECS, but there was also significant induction in the CA1 and CA3 with both acute and chronic ECS (Fig. 3B). This demonstrates neuronal expression as well as regulation of VEGF, lending additional support to the potential neurotrophic actions of this factor. The VGF gene encodes a neuronal and neuroendocrine polypeptide, which is induced by growth factors and neuronal activity (Snyder et al., 1998). This is widely expressed and was induced significantly in the DG (Fig. 3C), almost equally by both acute and chronic ECS. The increase in the CA3 pyramidal cell layer was seen only with chronic treatment. The high level of BDNF induction (Fig. 3D) with ECS has been reported previously (Nibuya et al., 1995).
Cox-2, an immediate early gene with low levels of expression in sham animals, is very strongly induced by approximately fivefold by both acute and chronic ECS treatment (Fig. 4A). Cox-2 is upregulated in several forebrain regions, including the CA3 pyramidal and the DG granule cell layers of the hippocampus, the outer layer of the cerebral cortex, and the amygdala. There is a close resemblance in the overall signal intensity from the blots and ISH, with spots from sham animals showing quantifiable but low signal in comparison to signal intensity from treated animals. In contrast, the signal for the housekeeping gene, cyclophilin, is equally high in both sham and ECS-treated rats and not regulated (Fig. 4A, bottom panel). Egr-3, a transcription factor, is upregulated primarily in the DG with little or no regulation in other cell layers of the hippocampus (Fig. 4B). The extent of regulation is similar in both acute and chronic treatments. NPY, a neuropeptide reported to be increased by antidepressant treatment (Husum et al., 2000), shows a punctate expression pattern with a 40% increase in the DG in response to acute ECS and a 3.5-fold increase with chronic ECS (Fig. 4C). There is also an increase in the levels of NPY in the outermost layer of the cortex with chronic ECS.
Figure 4.

Secondary confirmation of Cox-2, Egr-3, and NPY. Representative photomicrographs of hippocampal sections from ISH and RNA blot assays using radiolabeled riboprobes are shown. Quantified expression from the indicated cell layers is shown by bar graphs on the right. Results are expressed as a percentage of sham and are the mean ± SEM of four separate animals, each analyzed in duplicate brain sections. Lanes 1-4 in the RNA blots indicate individual samples, each from a separate animal spotted in duplicate. A housekeeping gene, cyclophilin, was used to normalize the signal from sham and ECS groups. A, Cox-2 exhibits low basal expression but is robustly induced in the DG, amygdala, and outer layer of the cerebral cortex (L1). B, Egr3 is induced exclusively in the DG. C, NPY, which shows a punctuate pattern of expression in sections from sham-treated animals, showed maximal regulation only with chronic treatment.
TIMP-1, an inhibitor of matrix metalloproteinases (MMPs), is highly upregulated by approximately threefold in response to either acute or chronic ECS (Fig. 5). MMPs function in the degradation and remodeling of the extracellular matrix (ECM), a necessary event to facilitate new blood vessel sprouting, cell proliferation, and migration. However, it is critical that proteolytic remodeling of the ECM be kept in balance to prevent damage from excessive degradation. This is primarily accomplished by the action of TIMPs. As demonstrated by ISH, the pattern of expression differs after acute (Fig. 5A) or chronic (Fig. 5B) ECS treatment. Basal expression is low and is seen in the outer layer of the cortex, choroid plexus, DG, and CA1 and CA3 pyramidal cell layers of the hippocampus. After acute ECS, strong upregulation (fivefold) is seen in the DG, and a threefold increase is observed in a series of blood elements that run ventral to the hippocampus. There is a 60% increase in the outer layers of the cerebral cortex. Interestingly, after chronic ECS, levels of TIMP-1 in the DG, although significantly increased, are close to basal levels of expression. However, there is an increase in the molecular layer where expression is not seen either in the sham controls or after acute ECS. TIMP-1 expression is further elevated in the blood elements (5.5-fold) and the outer layer of cerebral cortex (fivefold) after chronic ECS (Fig. 5C). To more closely examine the cellular localization of TIMP-1 regulation, ISH sections were dipped in emulsion and developed after 4 weeks. Counter-staining with cresyl violet enabled us to identify TIMP-1 expression in neuronal cells (Fig. 5D).
Figure 5.
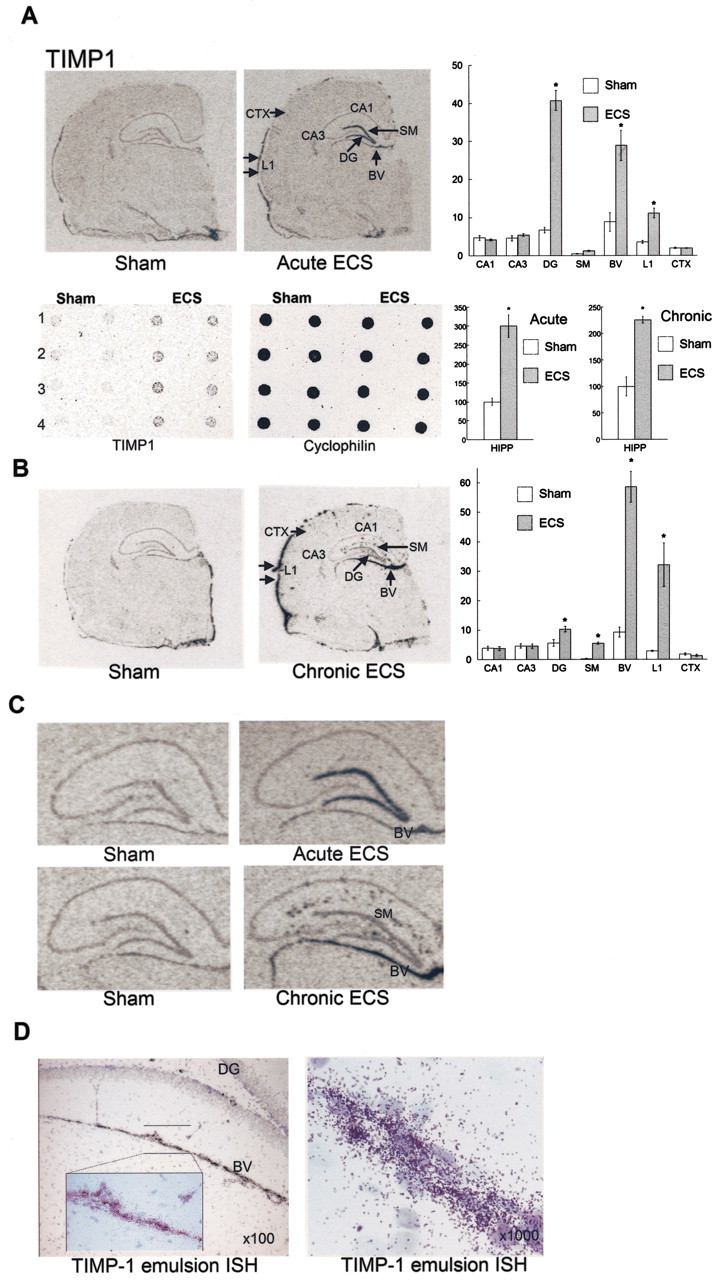
Analysis of TIMP-1 expression and regulation. A, B, Representative photomicrographs of TIMP-1 after acute (ISH and RNA blot) or chronic ECS (ISH). The results are expressed as a percentage of sham and are the means ± SEM of four separate determinations, each representing a different animal. A, Robust induction of TIMP-1 after acute ECS is seen in the DG, outer layer of the cerebral cortex (L1), and a blood vessel (BV) just below the DG. Note that a significant expression of TIMP-1 in the choroid plexus is shown. B, After chronic ECS, there is further induction in the L1 region and the BV. Significant expression is seen in the molecular layer (stratum moleculare) of the DG (SM). C, An enlarged view of the hippocampus is shown. D, Emulsion autoradiography shows high grain density over cresyl violet-stained cells.
Expression of growth factor signaling genes in the choroid plexus
During the secondary confirmation of microarray results by ISH, we noticed high levels of expression of some of the growth factor genes in the choroid plexus. This enrichment of growth factors, combined with the fact that the CP is known to express several growth factor genes and to supply these growth factors to the brain, led us to examine gene expression in the CP relative to the hippocampus and cerebral cortex, as well as gene regulation after chronic ECS (6 hr time point). Of the 171 growth factor genes, 11 were most highly expressed in the hippocampus, and 10 were most highly expressed in the CP. Expression of 13 of the growth factor genes was common to the CP, hippocampus, and cortex (Fig. 6A). A list of genes that had significantly higher expression in the CP is also shown. We performed the RNA blot assay to obtain precise levels of expression of some of these genes in the CP relative to the hippocampus and cerebral cortex (Fig. 6B). In addition, ISH for insulin-like growth factor binding protein (IGF2BP) and midkine further demonstrates the high level of enrichment in the CP. The expression of IGF2 and IGFBP2 in the CP is several-fold higher than in either the hippocampus or cerebral cortex. Midkine was below the limits of detection in the hippocampus and the cerebral cortex. Note that the signal for IGF2 and midkine in the CP is several-fold higher than the housekeeping gene cyclophilin, indicating the specialized role of the CP as a repository for these growth factors. This is not the case for the hippocampus or cortex, where cyclophilin is expressed at much higher levels in comparison with other genes of interest (Fig. 6B).
Figure 6.

Analysis of gene expression and regulation in the choroid plexus. A, A comparison of growth factor signaling genes expressed in three regions, choroid plexus, hippocampus, and cortex, is shown by a venn diagram, and the 10 most enriched genes in the choroid plexus are listed. The regional expression of midkine (Mdk), IGF2, IGFBP2, cyclophilin, TGFb1, and TGFb3 was measured by RNA blot assay. B, The bar graph represents signal intensity of corresponding spots. Inset shows the high level of Mdk and IGF2BP expression by ISH. Gene regulation in the choroid plexus in response to chronic ECS was examined from three sets of pooled samples (n = 6 animals for each set). C, D, Regulated genes were classified into the following two categories: growth factor and angiogenesis signaling (C), and other signaling pathways (D). The results are presented as fold change relative to sham. The dotted horizontal line indicates a ratio of 1 or no regulation. E, Secondary confirmation by RNA blot assay is shown for TIMP-1. Error bars represent SEM from three replicates.
The genes that were regulated in the CP in response to chronic ECS were classified into the following two categories: (1) growth factor and angiogenesis signaling (Fig. 6C), and (2) other signaling genes (Fig. 6D). These two classes were significant using an ANOVA analysis followed by the Scheffe's post hoc test (growth factor and angiogenesis signaling, p < 0.01; other signaling pathways, p < 0.001). It is rather intriguing to note the strong induction of TIMP-1 (Fig. 6E), which is increased almost fivefold in comparison with the other regulated genes. The regulation of several insulin-like growth factor binding proteins is also noteworthy. The regulation of fibronectin, angiopoeitin 2, and angiopoeitin 2-like protein indicates an angiogenic response, because they are genes with well known roles in angiogenesis (Acker et al., 2001). The upregulation of endostatin, an angiogenesis inhibitor, suggests the presence of a control mechanism in regulating the angiogenic response. With the exception of TIMP-1, which was also confirmed by the RNA blot assay (Fig. 6E), the CP genes exhibit moderate levels of regulation.
Immunohistochemistry
Immunohistochemical analysis was performed on fresh frozen cryocut sections to examine some of the regulated genes at the protein level. With the exception of Cox-2, for which immunohistochemistry was performed at the 2 hr time point, all other molecules examined were from 6 hr after ECS. NPY, which exhibited a punctate mRNA expression, showed protein induction primarily in the hilus (Fig. 7A), an observation that was also seen with VEGF (Fig. 7B) and neuritin immunoreactivity (Fig. 7C). Cox-2 immunoreactivity increased robustly with both acute and chronic ECS in the DG, cerebral cortex (data not shown), and amygdala (Fig. 7D). Basal expression of Cox-2 was very low and almost undectable, comparable with mRNA expression levels. TIMP-1 immunoreactivity was enhanced in a blood vessel element, in which robust induction of mRNA was seen with chronic ECS (Fig. 7E, top panel). There was also significant induction in the outer layer of the cerebral cortex (Fig. 7E, bottom panel).
Figure 7.

Immunohistochemical analysis demonstrating ECS regulation of corresponding protein levels for several genes. Immunohistochemistry was performed on sections from chronic ECS or sham animals using fresh frozen cryocut sections. A-C, E, Representative images are shown from chronic ECS (6 hr after ECS) for NPY (A), VEGF (B), neuritin (C), and TIMP-1 (E). D, Cox-2 immunohistochemistry was 2 hr after ECS. D, Maximal increases in Cox-2 protein were observed in the DG and amygdala and shown with higher power magnification in the inset. E, TIMP-1 expression in blood vessel (BV) and outer layer of cerebral cortex corresponds to regions of mRNA regulation. Upregulation of NPY, VEGF, and neuritin was most evident in the hilus and is shown with magnified insets. Scale bars: A-C, 25 μm; D, E, 50 μm.
Discussion
Using a customized microarray approach, we examined the role of growth factors and related signaling genes in the action of ECS. This method demonstrates that microarray technology can be used to perform hypothesis-based investigations from an informed, knowledge-based perspective. Classification of the regulated genes into various categories is not mutually exclusive but enables a mechanistic interpretation of gene array data. Our results demonstrate the regulation of a number of neurotrophic-growth and angiogenic factors by ECS, supporting the hypothesis that regulation of these factors could have an important role in the actions of ECS.
Regulation of neurotrophic-growth factors by ECS
Neuritin, an activity-induced gene, encodes a glycosylphoshatidylinositol-anchored neuronal protein that enhances neurite outgrowth of cultured hippocampal and cortical neurons. The rapid induction parallels BDNF expression in response to ECS. NGF and BDNF are capable of influencing neuritin expression, with BDNF infusions being particularly effective (Naeve et al., 1997). VGF, which is also induced by neuronal activity and neurotrophic factors, plays a significant role in energy balance and the regulation of homeostasis. VGF expression is sensitive to neurotrophic factor levels to the extent that it can be ectopically expressed in response to BDNF infusions into brain regions where it is normally not expressed (Eagleson et al., 2001). It is robustly induced in vitro by NGF through a CREB-dependent mechanism (Hawley et al., 1992), whereas in vivo expression is regulated by neuronal activity, LTP, seizure (Snyder et al., 1998), and synaptogenesis (Lombardo et al., 1995). There is currently no direct neurotrophic effect associated with VGF, although it does seem to be downstream of BDNF in Trk signaling. The regulation of BDNF in response to ECS as well as chemical antidepressants and lithium has been reported previously (Nibuya et al., 1995, 1996) and supports a neurotrophic hypothesis of depression (Duman et al., 1997).
FGF-2 and VEGF, previously thought to be mitogenic trophic factors, are now accepted as possessing neurotrophic and neuroprotective actions (Jin et al., 2002; Bonthius et al., 2003). Their upregulation when neuronal cells are challenged with toxins or excitatory neurotransmitters suggests that they play a functional role in the neuronal response to such insults. The regulation of these trophic factors could also contribute to ECS-induced mossy fiber sprouting (Vaidya et al., 1999; AC Chen et al., 2001a) as well as rescue of neurons exposed to insult or undergoing atrophy.
Although the precise functional contributions of each of these genes is yet to be fully established, there is sufficient body of literature showing that trophic support is a prerequisite for neuronal function and maintenance of neuronal integrity, and a lack thereof could result in compromised neuronal morphology, number, and functional deficits. Results from brain imaging, demonstrating reduced hippocampal volume (Duman et al., 1999), and postmortem studies, demonstrating reduced neuronal size and glial density, validate the hypothesis that neuronal atrophy could play a role in the pathophysiology of depression (Ongur et al., 1998; Rajkowska et al., 1999; Cotter et al., 2001). Enhanced neurotrophic signaling could serve as a mechanism to correct existing deficiencies and a possible mechanism by which ECS exerts antidepressant effects. A case in point is the antidepressant effect of hippocampal BDNF infusion (Shirayama et al., 2002).
Regulation of factors that influence proliferation-neurogenesis by ECS
ECS, as well as chemical antidepressants, increases neurogenesis in the subgranular proliferative zone of hippocampus in adult hippocampus (Madsen et al., 2000b; Malberg et al., 2000). These new cells differentiate and mature into neurons and integrate into the granule cell layer (van Praag et al., 2002). Recent work has shown that growth factors that exhibit trophic and mitogenic functions in non-neuronal cells are capable of inducing adult neurogenesis. FGF-2, which is upregulated by ECS (Kondratyev et al., 2002) and chemical antidepressants (Mallei et al., 2002), is required for proliferation during development (Raballo et al., 2000) and increases cell proliferation in adult gerbils (Matsuoka et al., 2003). The role of VEGF in the proliferation of cortical neurons was demonstrated by the addition of VEGF to embryonic cortical culture cells (Jin et al., 2002; Zhu et al., 2003). In addition, infusion of VEGF into the adult rat brain increases neuronal cell proliferation in the subgranular zone of the dentate gyrus (Jin et al., 2002).
The regulation of Cox-2, which is induced by cytokines, growth factors, and oncogenes, is interesting in this context because it is induced by FGF-2 and in turn induces VEGF (Majima et al., 2000). The role of Cox-2 in proliferation has been demonstrated previously by several studies in human cancer cell lines and tissues (Chinery et al., 1998; Leahy et al., 2002), and inhibitors of Cox-2 are being investigated for their ability to suppress tumor growth (Ding et al., 2000; Merritt et al., 2001). Cox-2 inhibitors impair the ischemia-induced proliferation of dentate gyrus neural progenitor cells (Uchida et al., 2002; Sasaki et al., 2003), and Cox-2 knock-out mice exhibit reduced neural cell proliferation. The Cox-2 promoter region has both CRE and T-cell factor sites and could therefore be regulated by CREB or the wingless-related MMTV integration site (Wnt)-β-catenin signaling pathway, which likely facilitates its rapid induction. Interestingly, Wnt-2, which has established roles in proliferation (Reya et al., 2003; Willert et al., 2003), is also upregulated by ECS and has been confirmed in an independent study (Madsen et al., 2003).
Regulation of factors that influence angiogenesis and vasodilation by ECS
Our knowledge-driven approach to classify genes also revealed the regulation of several genes that have known roles in angiogenesis and vasodilation. Emerging work indicates that VEGF and FGF-2 might possess overlapping functions in promoting neurogenesis and neuroprotection. Interestingly, both FGF-2 and VEGF are among the most potent angiogenic growth factors currently being investigated. An association has been observed between hippocampal neurogenesis and neovasculature (Palmer et al., 2000), and more recent work suggests that angiogenesis precedes neurogenesis (Louissaint et al., 2002), providing additional evidence for a role of FGF-2 and VEGF signaling in ECS-induced neurogenesis. It is not clear whether angigogenesis stimulates neurogenesis by inducing factors involved in cell proliferation or whether angiogenesis and neurogenesis occur simultaneously. The issue is further complicated in the case of FGF-2 and VEGF, because they possess direct neurotrophic effects as well as angiogenic properties that lead to formation of new vasculature.
The regulation of Cox-2 and neuronal nitric oxide synthase, both with known roles in vasodilation as well as inflammation, indicates that, along with angiogenesis, there is an increase in blood flow after ECS. This increase in blood flow might supply essential nutrients and growth factors necessary for the potentiation of other downstream events, including proliferation and neurogenesis. Neuronal Cox-2 has been linked to synaptic plasticity (Chen et al., 2002), memory consolidation (Teather et al., 2002), cell death (Nakayama et al., 1998), and, recently, increased blood flow in brain microcirculation (Zonta et al., 2003). It is unlikely that Cox-2 induction after ECS has any role in cell death because several studies, both human (Ende et al., 2000) and rodent (Madsen et al., 2000a; Kondratyev et al., 2001; Hellsten et al., 2002), have failed to observe any evidence of neuronal death or gliosis. Cox-2 signaling in the brain does hold considerable appeal for additional investigation, because cancer researchers have reported that Cox-2 itself possesses angiogenic properties (Jones et al., 1999).
Some of the molecules induced by ECS, such as Cox-2, TIMP-1, and neuritin, are also induced by kainic acid seizures (Naeve et al., 1997; Rivera et al., 1997), indicating similarities in the signaling cascades that are activated. However, kainate-induced seizures result in neurotoxicity and cell loss (Yoshimura et al., 2001; Mennicken et al., 2002), indicating that there are also major differences. This could result from the severity and length of the seizures produced by kainate relative to ECS, leading to neurotoxic damage that cannot be balanced by induction of neurotrophic-neuroprotective factors. For example, a comparison can be drawn to the role of VEGF in the hypoxia-ischemia model, in which preconditioning hypoxia provides a VEGF-mediated neuroprotective effect against subsequent insult, but the beneficial effect is lost when hypoxia is extended (Wick et al., 2002). The short duration and reduced severity of ECS could thereby produce neurotrophic-neuroprotective effects without the cell loss or damage produced by kainate.
TIMP-1, a multifunctional protein induced by cytokine signaling with a predominant role governing the inhibition of MMP, is highly regulated in the granule cell layer of the hippocampus by acute ECS, but the pattern of expression is shifted to the molecular layer in response to chronic ECS. TIMP-1 is also the most highly regulated gene in the CP after chronic ECS, although there was no effect of acute ECS (data not shown). The balance between the four known TIMPs and the ∼20 MMPs controls remodeling of the extracellular matrix, which occurs in malignant tissue but is also an essential physiological process during normal development (Chang and Werb, 2001; Hall et al., 2003). However, the role of TIMPs in the brain is not fully understood. TMIP-1 is reported to have a potent and specific neuroprotective effect against glutamate excitotoxicity in hippocampal neurons (Tan et al., 2003) and could serve as a neuroprotectant after ECS. The upregulation of TIMP-1 in the cresyl violet-positive cells in the vicinity of vasculature after chronic ECS also suggests a role in angiogenesis. Degradation of the extracellular matrix by MMPs precedes neovascularization, and TIMP-1 induction might serve to neutralize MMP activity.
NPY is a neuropeptide with anticonvulsant properties (Bolwig et al., 1999) and has antidepressant-like effects in the forced swim test (Husum et al., 2000). Only recently has NPY been considered an angiogenic agent exerting its effects through the NPY type-2 receptor (Ekstrand et al., 2003; Lee et al., 2003). Thyrotropin-releasing hormone (TRH) and somatostatin are known to be regulated by seizure and might function as anticonvulsants. In addition, hippocampal TRH induction has been proposed to have antidepressant effects (Sattin et al., 1994).
Regulation of neurotrophic-growth factors in the choroid plexus by ECS
The CP is a major site for the synthesis of CSF and is also a source for several growth factors (Chodobski and Szmydynger-Chodobska, 2001). The CP is also an important interface between peripheral blood and CSF, constituting a junction at the blood-brain barrier and exerting control over the entry of substances into the CSF. Although our investigation has only shown the enrichment of mRNA for several growth factors and angiogenic signaling molecules, others have demonstrated that the CP also produces many of the corresponding proteins. The presence of several growth factors in the CP could indicate an important role in providing trophic support to the brain by releasing polypeptides into the CSF for distal neuronal sites of action (Chodobski and Szmydynger-Chodobska, 2001). It is interesting to note that ischemia-induced cell death in the CA1 pyramidal cell layer of the hippocampus observed 48 hr after insult was preceded by progressive cell death in the CP (Ferrand-Drake and Wieloch, 1999). Leakiness at the blood-brain barrier resulting from cell death in the CP or reduction of CP trophic support could also be responsible for neuronal loss seen as a result of other types of insults. The involvement of neurotransmitter signaling and the action of transcription factors and kinases could also play vital roles in the mechanism of antidepressant action, but additional discussion here is not possible because of space limitations.
Summary and conclusions
A focused microarray approach addressing the regulation of growth factors has elucidated for the first time an angiogenic signaling cascade in response to ECS, as well as providing additional support for a neurotrophic factor hypothesis of antidepressants (Duman et al., 1997, 1999). The therapeutic effects of ECS could be mediated by several signaling cascades, including neurotrophic-growth factors and angiogenic systems. The results also indicate that induction of these factors by ECS provides neurotrophic, neuroprotective, and neurogenic effects without producing the neurotoxicity and cell loss that is observed with other types of seizures. Future studies will be required to assess the clinical relevance of these results by comparing the time course for the regulation of identified genes with the behavioral effects of ECS. Research focused on manipulating these cascades at different levels using specific inhibitors or gene delivery techniques and assessing functional and behavioral outcomes will help elucidate the contributions of individual molecules and their signaling cascades in the actions of antidepressant treatment. This in turn will lead to microarray approaches to identify gene expression patterns that are altered in depression, studies that are currently underway in postmortem tissue from depressed patients. This work will ultimately lead to a better understanding of the pathophysiology and treatment of depression and related disorders.
Footnotes
This work was supported by United States Public Health Service Grants MH45481 and 2 PO1 MH25642, Veterans Administration National Center Grant for Post-Traumatic Stress Disorder, and the Connecticut Mental Health Center.
Correspondence should be addressed to Ronald S. Duman, 34 Park Street, New Haven, CT 06508. E-mail: ronald.duman@yale.edu.
Copyright © 2003 Society for Neuroscience 0270-6474/03/2310841-11$15.00/0
References
- Acker T, Beck H, Plate KH ( 2001) Cell type specific expression of vascular endothelial growth factor and angiopoietin-1 and -2 suggests an important role of astrocytes in cerebellar vascularization. Mech Dev 108: 45-57. [DOI] [PubMed] [Google Scholar]
- Angelucci F, Aloe L, Jimenez-Vasquez P, Mathe AA ( 2002) Electroconvulsive stimuli alter the regional concentrations of nerve growth factor, brain-derived neurotrophic factor, and glial cell line-derived neurotrophic factor in adult rat brain. J ECT 18: 138-143. [DOI] [PubMed] [Google Scholar]
- Bolwig TG, Woldbye DP, Mikkelsen JD ( 1999) Electroconvulsive therapy as an anticonvulsant: a possible role of neuropeptide Y (NPY). J ECT 15: 93-101. [PubMed] [Google Scholar]
- Bonthius DJ, Karacay B, Dai D, Pantazis NJ ( 2003) FGF-2, NGF and IGF-1, but not BDNF, utilize a nitric oxide pathway to signal neurotrophic and neuroprotective effects against alcohol toxicity in cerebellar granule cell cultures. Brain Res Dev Brain Res 140: 15-28. [DOI] [PubMed] [Google Scholar]
- Chang C, Werb Z ( 2001) The many faces of metalloproteases: cell growth, invasion, angiogenesis and metastasis. Trends Cell Biol 11: S37-S43. [DOI] [PMC free article] [PubMed] [Google Scholar]
- Chen AC, Shin KH, Duman RS, Sanacora G ( 2001a) ECS-induced mossy fiber sprouting and BDNF expression are attenuated by ketamine pretreatment. J ECT 17: 27-32. [DOI] [PubMed] [Google Scholar]
- Chen AC, Eisch AJ, Sakai N, Takahashi M, Nestler EJ, Duman RS ( 2001b) Regulation of GFRalpha-1 and GFRalpha-2 mRNAs in rat brain by electroconvulsive seizure. Synapse 39: 42-50. [DOI] [PubMed] [Google Scholar]
- Chen B, Dowlatshahi D, MacQueen GM, Wang JF, Young LT ( 2001) Increased hippocampal BDNF immunoreactivity in subjects treated with antidepressant medication. Biol Psychiatry 50: 260-265. [DOI] [PubMed] [Google Scholar]
- Chen C, Magee JC, Bazan NG ( 2002) Cyclooxygenase-2 regulates prostaglandin E2 signaling in hippocampal long-term synaptic plasticity. J Neurophysiol 87: 2851-2857. [DOI] [PubMed] [Google Scholar]
- Chinery R, Beauchamp RD, Shyr Y, Kirkland SC, Coffey RJ, Morrow JD ( 1998) Antioxidants reduce cyclooxygenase-2 expression, prostaglandin production, and proliferation in colorectal cancer cells. Cancer Res 58: 2323-2327. [PubMed] [Google Scholar]
- Chodobski A, Szmydynger-Chodobska J ( 2001) Choroid plexus: target for polypeptides and site of their synthesis. Microsc Res Tech 52: 65-82. [DOI] [PubMed] [Google Scholar]
- Cotter D, Mackay D, Landau S, Kerwin R, Everall I ( 2001) Reduced glial cell density and neuronal size in the anterior cingulate cortex in major depressive disorder. Arch Gen Psychiatry 58: 545-553. [DOI] [PubMed] [Google Scholar]
- Czeh B, Michaelis T, Watanabe T, Frahm J, de Biurrun G, van Kampen M, Bartolomucci A, Fuchs E ( 2001) Stress-induced changes in cerebral metabolites, hippocampal volume, and cell proliferation are prevented by antidepressant treatment with tianeptine. Proc Natl Acad Sci USA 98: 12796-12801. [DOI] [PMC free article] [PubMed] [Google Scholar]
- Ding XZ, Tong WG, Adrian TE ( 2000) Blockade of cyclooxygenase-2 inhibits proliferation and induces apoptosis in human pancreatic cancer cells. Anticancer Res 20: 2625-2631. [PubMed] [Google Scholar]
- Duman RS, Charney DS ( 1999) Cell atrophy and loss in major depression. Biol Psychiatry 45: 1083-1084. [DOI] [PubMed] [Google Scholar]
- Duman RS, Heninger GR, Nestler EJ ( 1997) A molecular and cellular theory of depression. Arch Gen Psychiatry 54: 597-606. [DOI] [PubMed] [Google Scholar]
- Duman RS, Malberg J, Thome J ( 1999) Neural plasticity to stress and antidepressant treatment. Biol Psychiatry 46: 1181-1191. [DOI] [PubMed] [Google Scholar]
- Eagleson KL, Fairfull LD, Salton SR, Levitt P ( 2001) Regional differences in neurotrophin availability regulate selective expression of VGF in the developing limbic cortex. J Neurosci 21: 9315-9324. [DOI] [PMC free article] [PubMed] [Google Scholar]
- Ekstrand AJ, Cao R, Bjorndahl M, Nystrom S, Jonsson-Rylander AC, Hassani H, Hallberg B, Nordlander M, Cao Y ( 2003) Deletion of neuropeptide Y (NPY) 2 receptor in mice results in blockage of NPY-induced angiogenesis and delayed wound healing. Proc Natl Acad Sci USA 100: 6033-6038. [DOI] [PMC free article] [PubMed] [Google Scholar]
- Ende G, Braus DF, Walter S, Weber-Fahr W, Henn FA ( 2000) The hippocampus in patients treated with electroconvulsive therapy: a proton magnetic resonance spectroscopic imaging study. Arch Gen Psychiatry 57: 937-943. [DOI] [PubMed] [Google Scholar]
- Ferrand-Drake M, Wieloch T ( 1999) The time-course of DNA fragmentation in the choroid plexus and the CA1 region following transient global ischemia in the rat brain. The effect of intra-ischemic hypothermia. Neuroscience 93: 537-549. [DOI] [PubMed] [Google Scholar]
- Gould E, McEwen BS, Tanapat P, Galea LA, Fuchs E ( 1997) Neurogenesis in the dentate gyrus of the adult tree shrew is regulated by psychosocial stress and NMDA receptor activation. J Neurosci 17: 2492-2498. [DOI] [PMC free article] [PubMed] [Google Scholar]
- Hall MC, Young DA, Waters JG, Rowan AD, Chantry A, Edwards DR, Clark IM ( 2003) The comparative role of activator protein 1 and Smad factors in the regulation of Timp-1 and MMP-1 gene expression by transforming growth factor-beta 1. J Biol Chem 278: 10304-10313. [DOI] [PubMed] [Google Scholar]
- Hawley RJ, Scheibe RJ, Wagner JA ( 1992) NGF induces the expression of the VGF gene through a cAMP response element. J Neurosci 12: 2573-2581. [DOI] [PMC free article] [PubMed] [Google Scholar]
- Hellsten J, Wennstrom M, Mohapel P, Ekdahl CT, Bengzon J, Tingstrom A ( 2002) Electroconvulsive seizures increase hippocampal neurogenesis after chronic corticosterone treatment. Eur J Neurosci 16: 283-290. [DOI] [PubMed] [Google Scholar]
- Husum H, Mikkelsen JD, Hogg S, Mathe AA, Mork A ( 2000) Involvement of hippocampal neuropeptide Y in mediating the chronic actions of lithium, electroconvulsive stimulation and citalopram. Neuropharmacology 39: 1463-1473. [DOI] [PubMed] [Google Scholar]
- Jin K, Zhu Y, Sun Y, Mao XO, Xie L, Greenberg DA ( 2002) Vascular endothelial growth factor (VEGF) stimulates neurogenesis in vitro and in vivo Proc Natl Acad Sci USA 99: 11946-11950. [DOI] [PMC free article] [PubMed] [Google Scholar]
- Jones MK, Wang H, Peskar BM, Levin E, Itani RM, Sarfeh IJ, Tarnawski AS ( 1999) Inhibition of angiogenesis by nonsteroidal anti-inflammatory drugs: insight into mechanisms and implications for cancer growth and ulcer healing. Nat Med 5: 1418-1423. [DOI] [PubMed] [Google Scholar]
- Kondratyev A, Sahibzada N, Gale K ( 2001) Electroconvulsive shock exposure prevents neuronal apoptosis after kainic acid-evoked status epilepticus. Brain Res Mol Brain Res 91: 1-13. [DOI] [PubMed] [Google Scholar]
- Kondratyev A, Ved R, Gale K ( 2002) The effects of repeated minimal electroconvulsive shock exposure on levels of mRNA encoding fibroblast growth factor-2 and nerve growth factor in limbic regions. Neuroscience 114: 411-416. [DOI] [PubMed] [Google Scholar]
- Lamont SR, Paulls A, Stewart CA ( 2001) Repeated electroconvulsive stimulation, but not antidepressant drugs, induces mossy fibre sprouting in the rat hippocampus. Brain Res 893: 53-58. [DOI] [PubMed] [Google Scholar]
- Leahy KM, Ornberg RL, Wang Y, Zweifel BS, Koki AT, Masferrer JL ( 2002) Cyclooxygenase-2 inhibition by celecoxib reduces proliferation and induces apoptosis in angiogenic endothelial cells in vivo Cancer Res 62: 625-631. [PubMed] [Google Scholar]
- Lee EW, Grant DS, Movafagh S, Zukowska Z ( 2003) Impaired angiogenesis in neuropeptide Y (NPY)-Y2 receptor knockout mice. Peptides 24: 99-106. [DOI] [PubMed] [Google Scholar]
- Lombardo A, Rabacchi SA, Cremisi F, Pizzorusso T, Cenni MC, Possenti R, Barsacchi G, Maffei L ( 1995) A developmentally regulated nerve growth factor-induced gene, VGF, is expressed in geniculocortical afferents during synaptogenesis. Neuroscience 65: 997-1008. [DOI] [PubMed] [Google Scholar]
- Louissaint Jr A, Rao S, Leventhal C, Goldman SA ( 2002) Coordinated interaction of neurogenesis and angiogenesis in the adult songbird brain. Neuron 34: 945-960. [DOI] [PubMed] [Google Scholar]
- Madsen TM, Greisen MH, Nielsen SM, Bolwig TG, Mikkelsen JD ( 2000a) Electroconvulsive stimuli enhance both neuropeptide Y receptor Y1 and Y2 messenger RNA expression and levels of binding in the rat hippocampus. Neuroscience 98: 33-39. [DOI] [PubMed] [Google Scholar]
- Madsen TM, Treschow A, Bengzon J, Bolwig TG, Lindvall O, Tingstrom A ( 2000b) Increased neurogenesis in a model of electroconvulsive therapy. Biol Psychiatry 47: 1043-1049. [DOI] [PubMed] [Google Scholar]
- Madsen TM, Newton SS, Eaton ME, Russell DS, Duman RS ( 2003) Chronic electroconvulsive seizure up-regulates beta-catenin expression in rat hippocampus: role in adult neurogenesis. Biol Psychiatry 54: 1006-1014. [DOI] [PubMed] [Google Scholar]
- Majima M, Hayashi I, Muramatsu M, Katada J, Yamashina S, Katori M ( 2000) Cyclo-oxygenase-2 enhances basic fibroblast growth factor-induced angiogenesis through induction of vascular endothelial growth factor in rat sponge implants. Br J Pharmacol 130: 641-649. [DOI] [PMC free article] [PubMed] [Google Scholar]
- Malberg JE, Eisch AJ, Nestler EJ, Duman RS ( 2000) Chronic antidepressant treatment increases neurogenesis in adult rat hippocampus. J Neurosci 20: 9104-9110. [DOI] [PMC free article] [PubMed] [Google Scholar]
- Mallei A, Shi B, Mocchetti I ( 2002) Antidepressant treatments induce the expression of basic fibroblast growth factor in cortical and hippocampal neurons. Mol Pharmacol 61: 1017-1024. [DOI] [PubMed] [Google Scholar]
- Manji HK, Duman RS ( 2001) Impairments of neuroplasticity and cellular resilience in severe mood disorders: implications for the development of novel therapeutics. Psychopharmacol Bull 35: 5-49. [PubMed] [Google Scholar]
- Matsuoka N, Nozaki K, Takagi Y, Nishimura M, Hayashi J, Miyatake S, Hashimoto N ( 2003) Adenovirus-mediated gene transfer of fibroblast growth factor-2 increases BrdU-positive cells after forebrain ischemia in gerbils. Stroke 34: 1519-1525. [DOI] [PubMed] [Google Scholar]
- Mennicken F, Chabot JG, Quirion R ( 2002) Systemic administration of kainic acid in adult rat stimulates expression of the chemokine receptor CCR5 in the forebrain. Glia 37: 124-138. [DOI] [PubMed] [Google Scholar]
- Merritt G, Aliprandis ET, Prada F, Rigas B, Kashfi K ( 2001) The retinoid fenretinide inhibits proliferation and downregulates cyclooxygenase-2 gene expression in human colon adenocarcinoma cell lines. Cancer Lett 164: 15-23. [DOI] [PubMed] [Google Scholar]
- Mirnics K, Middleton FA, Marquez A, Lewis DA, Levitt P ( 2000) Molecular characterization of schizophrenia viewed by microarray analysis of gene expression in prefrontal cortex. Neuron 28: 53-67. [DOI] [PubMed] [Google Scholar]
- Naeve GS, Ramakrishnan M, Kramer R, Hevroni D, Citri Y, Theill LE ( 1997) Neuritin: a gene induced by neural activity and neurotrophins that promotes neuritogenesis. Proc Natl Acad Sci USA 94: 2648-2653. [DOI] [PMC free article] [PubMed] [Google Scholar]
- Nakayama M, Uchimura K, Zhu RL, Nagayama T, Rose ME, Stetler RA, Isakson PC, Chen J, Graham SH ( 1998) Cyclooxygenase-2 inhibition prevents delayed death of CA1 hippocampal neurons following global ischemia. Proc Natl Acad Sci USA 95: 10954-10959. [DOI] [PMC free article] [PubMed] [Google Scholar]
- Nestler EJ, Barrot M, DiLeone RJ, Eisch AJ, Gold SJ, Monteggia LM ( 2002) Neurobiology of depression. Neuron 34: 13-25. [DOI] [PubMed] [Google Scholar]
- Newton SS, Dow A, Terwilliger R, Duman R ( 2002) A simplified method for combined immunohistochemistry and in situ hybridization in fresh-frozen, cryocut mouse brain sections. Brain Res Brain Res Protoc 9: 214-219. [DOI] [PubMed] [Google Scholar]
- Nibuya M, Morinobu S, Duman RS ( 1995) Regulation of BDNF and trkB mRNA in rat brain by chronic electroconvulsive seizure and antidepressant drug treatments. J Neurosci 15: 7539-7547. [DOI] [PMC free article] [PubMed] [Google Scholar]
- Nibuya M, Nestler EJ, Duman RS ( 1996) Chronic antidepressant administration increases the expression of cAMP response element binding protein (CREB) in rat hippocampus. J Neurosci 16: 2365-2372. [DOI] [PMC free article] [PubMed] [Google Scholar]
- Ongur D, Drevets WC, Price JL ( 1998) Glial reduction in the subgenual prefrontal cortex in mood disorders. Proc Natl Acad Sci USA 95: 13290-13295. [DOI] [PMC free article] [PubMed] [Google Scholar]
- Palmer TD, Willhoite AR, Gage FH ( 2000) Vascular niche for adult hippocampal neurogenesis. J Comp Neurol 425: 479-494. [DOI] [PubMed] [Google Scholar]
- Raballo R, Rhee J, Lyn-Cook R, Leckman JF, Schwartz ML, Vaccarino FM ( 2000) Basic fibroblast growth factor (Fgf2) is necessary for cell proliferation and neurogenesis in the developing cerebral cortex. J Neurosci 20: 5012-5023. [DOI] [PMC free article] [PubMed] [Google Scholar]
- Rajkowska G, Miguel-Hidalgo JJ, Wei J, Dilley G, Pittman SD, Meltzer HY, Overholser JC, Roth BL, Stockmeier CA ( 1999) Morphometric evidence for neuronal and glial prefrontal cell pathology in major depression. Biol Psychiatry 45: 1085-1098. [DOI] [PubMed] [Google Scholar]
- Reya T, Duncan AW, Ailles L, Domen J, Scherer DC, Willert K, Hintz L, Nusse R, Weissman IL ( 2003) A role for Wnt signalling in self-renewal of haematopoietic stem cells. Nature 423: 409-414. [DOI] [PubMed] [Google Scholar]
- Rivera S, Tremblay E, Timsit S, Canals O, Ben-Ari Y, Khrestchatisky M ( 1997) Tissue inhibitor of metalloproteinases-1 (TIMP-1) is differentially induced in neurons and astrocytes after seizures: evidence for developmental, immediate early gene, and lesion response. J Neurosci 17: 4223-4235. [DOI] [PMC free article] [PubMed] [Google Scholar]
- Saarelainen T, Hendolin P, Lucas G, Koponen E, Sairanen M, MacDonald E, Agerman K, Haapasalo A, Nawa H, Aloyz R, Ernfors P, Castren E ( 2003) Activation of the TrkB neurotrophin receptor is induced by antidepressant drugs and is required for antidepressant-induced behavioral effects. J Neurosci 23: 349-357. [DOI] [PMC free article] [PubMed] [Google Scholar]
- Sasaki T, Kitagawa K, Sugiura S, Omura-Matsuoka E, Tanaka S, Yagita Y, Okano H, Matsumoto M, Hori M ( 2003) Implication of cyclooxygenase-2 on enhanced proliferation of neural progenitor cells in the adult mouse hippocampus after ischemia. J Neurosci Res 72: 461-471. [DOI] [PubMed] [Google Scholar]
- Sattin A, Pekary AE, Lloyd RL ( 1994) TRH gene products are implicated in the antidepressant mechanisms of seizures. Ann NY Acad Sci 739: 135-153. [DOI] [PubMed] [Google Scholar]
- Shirayama Y, Chen AC, Nakagawa S, Russell DS, Duman RS ( 2002) Brain-derived neurotrophic factor produces antidepressant effects in behavioral models of depression. J Neurosci 22: 3251-3261. [DOI] [PMC free article] [PubMed] [Google Scholar]
- Siuciak JA, Lewis DR, Wiegand SJ, Lindsay RM ( 1997) Antidepressant-like effect of brain-derived neurotrophic factor (BDNF). Pharmacol Biochem Behav 56: 131-137. [DOI] [PubMed] [Google Scholar]
- Snyder SE, Cheng HW, Murray KD, Isackson PJ, McNeill TH, Salton SR ( 1998) The messenger RNA encoding VGF, a neuronal peptide precursor, is rapidly regulated in the rat central nervous system by neuronal activity, seizure and lesion. Neuroscience 82: 7-19. [DOI] [PubMed] [Google Scholar]
- Tan HK, Heywood D, Ralph GS, Bienemann A, Baker AH, Uney JB ( 2003) Tissue inhibitor of metalloproteinase 1 inhibits excitotoxic cell death in neurons. Mol Cell Neurosci 22: 98-106. [DOI] [PubMed] [Google Scholar]
- Teather LA, Packard MG, Bazan NG ( 2002) Post-training cyclooxygenase-2 (COX-2) inhibition impairs memory consolidation. Learn Mem 9: 41-47. [DOI] [PMC free article] [PubMed] [Google Scholar]
- Thome J, Sakai N, Shin K, Steffen C, Zhang YJ, Impey S, Storm D, Duman RS ( 2000) cAMP response element-mediated gene transcription is upregulated by chronic antidepressant treatment. J Neurosci 20: 4030-4036. [DOI] [PMC free article] [PubMed] [Google Scholar]
- Uchida K, Kumihashi K, Kurosawa S, Kobayashi T, Itoi K, Machida T ( 2002) Stimulatory effects of prostaglandin E2 on neurogenesis in the dentate gyrus of the adult rat. Zoolog Sci 19: 1211-1216. [DOI] [PubMed] [Google Scholar]
- Vaidya VA, Siuciak JA, Du F, Duman RS ( 1999) Hippocampal mossy fiber sprouting induced by chronic electroconvulsive seizures. Neuroscience 89: 157-166. [DOI] [PubMed] [Google Scholar]
- van Praag H, Schinder AF, Christie BR, Toni N, Palmer TD, Gage FH ( 2002) Functional neurogenesis in the adult hippocampus. Nature 415: 1030-1034. [DOI] [PMC free article] [PubMed] [Google Scholar]
- Watanabe Y, Gould E, McEwen BS ( 1992) Stress induces atrophy of apical dendrites of hippocampal CA3 pyramidal neurons. Brain Res 588: 341-345. [DOI] [PubMed] [Google Scholar]
- Wick A, Wick W, Waltenberger J, Weller M, Dichgans J, Schulz JB ( 2002) Neuroprotection by hypoxic preconditioning requires sequential activation of vascular endothelial growth factor receptor and Akt. J Neurosci 22: 6401-6407. [DOI] [PMC free article] [PubMed] [Google Scholar]
- Willert K, Brown JD, Danenberg E, Duncan AW, Weissman IL, Reya T, Yates III JR, Nusse R ( 2003) Wnt proteins are lipid-modified and can act as stem cell growth factors. Nature 423: 448-452. [DOI] [PubMed] [Google Scholar]
- Yoshimura S, Takagi Y, Harada J, Teramoto T, Thomas SS, Waeber C, Bakowska JC, Breakefield XO, Moskowitz MA ( 2001) FGF-2 regulation of neurogenesis in adult hippocampus after brain injury. Proc Natl Acad Sci USA 98: 5874-5879. [DOI] [PMC free article] [PubMed] [Google Scholar]
- Zhu Y, Jin K, Mao XO, Greenberg DA ( 2003) Vascular endothelial growth factor promotes proliferation of cortical neuron precursors by regulating E2F expression. FASEB J 17: 186-193. [DOI] [PubMed] [Google Scholar]
- Zonta M, Angulo MC, Gobbo S, Rosengarten B, Hossmann KA, Pozzan T, Carmignoto G ( 2003) Neuron-to-astrocyte signaling is central to the dynamic control of brain microcirculation. Nat Neurosci 6: 43-50. [DOI] [PubMed] [Google Scholar]