

Abstract
Center-surround antagonism is a hallmark feature of the receptive fields of sensory neurons. In retinas of lower vertebrates, surround antagonism derives in part from inhibition of cone photoreceptors by horizontal cells. Using whole-cell patch recording methods, we found that light-evoked responses of cones in macaque monkey were antagonized when surrounding cones were illuminated. The spatial and spectral properties of this antagonism indicate that it results from inhibition by horizontal cells. It has been suggested that horizontal cell inhibition is mediated by the neurotransmitter GABA. The inhibition observed here, however, was inconsistent with a GABA-gated chloride conductance mechanism. Instead, surround illumination evoked an increase in calcium conductance and calcium-activated chloride conductance in cones. We expect that these conductances modulate neurotransmitter release at the cone synapse and increase visual sensitivity to spatial contrast.
Keywords: retina, primate, surround antagonism, cone, photoreceptor, horizontal cell
Introduction
A key feature of visual information processing is spatial contrast enhancement. Objects of a fixed luminance look brighter on a dark background than on a bright background (Mach, 1865). A physiological correlate to this effect was first observed in light responses of ganglion cells in cat and monkey retina; responses to illumination in one region of retina were antagonized by illumination in surrounding regions (Kuffler, 1953; Hubel and Wiesel, 1960). In lower vertebrates, center-surround antagonism of retinal neurons begins with surround antagonism in cones. Turtle cones are hyperpolarized by direct illumination and depolarized by illumination of distant cones (Baylor et al., 1971). Surround antagonism was also implicated in squirrel cones (Leeper and Charlton, 1985), but has not been demonstrated in other mammalian retinas, including primate.
Turtle cones depolarize when hyperpolarizing current is injected into horizontal cells, and cone surrounds have receptive fields properties similar to those of horizontal cells (Baylor et al., 1971; Fuortes et al., 1973), indicating that antagonistic surrounds in cones are mediated by inhibitory feedback from horizontal cells. The mechanism by which horizontal cells communicate to cones is controversial. One hypothesis proposes that horizontal cells are GABAergic. Hyperpolarization by light reduces GABA release, causing GABA-gated chloride channels in cones to close. Evidence for this includes voltage-regulated release of GABA from toad horizontal cells (Schwartz, 1982) and the presence of GABA-gated chloride channels in isolated cones of turtle and pig (Kaneko and Tachibana, 1986; Picaud et al., 1998).
Although evidence for GABA-gated channels in isolated cones is solid, evidence for its involvement in surround antagonism is contradictory. Some studies report that surround illumination evokes a change in cone conductance consistent with the closure of chloride channels (Skrzypek and Werblin, 1983; Wu, 1991), whereas others report surround-evoked increases in chloride conductances (Lasansky, 1981; Thoreson and Burkhardt, 1991; Verweij et al., 1996). Furthermore, cone surrounds were partially blocked by GABA receptor agonists and antagonists in carp and salamander (Murakami et al., 1982a; Wu, 1991), but were unaffected in turtle and goldfish (Thoreson and Burkhardt, 1990; Piccolino, 1995; Verweij et al., 1996).
An alternative hypothesis to the GABA-gated mechanism supposes that surround illumination activates calcium channels in cones, which in turn activates calcium-activated chloride channels (Kamermans and Spekreijse, 1999). Evidence for such a mechanism was found in turtle and goldfish retina in situ (Gerschenfeld et al., 1980; Thoreson and Burkhardt, 1991; Verweij et al., 1996). Calcium-activated chloride conductances have been described in isolated cones of lizard and monkey (Maricq and Korenbrot, 1988; Yagi and MacLeish, 1994). It is not clear how horizontal cells would activate the calcium conductance in cones. It has been suggested that when horizontal cells hyperpolarize, an extracellular voltage drop develops in the cone synaptic cleft (Byzov and Shura-Bura, 1986), which activates voltage-gated calcium channels.
In this study we record from single primate cones in situ and investigate the spatial, spectral, ionic, and pharmacological properties of surround antagonism. Our results support the involvement of horizontal cells in the formation of antagonistic surrounds, but are inconsistent with a GABA-gated chloride mechanism.
Materials and Methods
Retinal preparation. Eyes were obtained from macaque monkeys (Macaca fascicularis and Macaca mulatta) used by other investigators. No differences were found in the results obtained from the two species. All procedures involving monkeys were in accord with guidelines established by the National Institutes of Health and were approved by the University of California San Francisco Committee on Animal Research, which has approved assurance from the Office of Protection from Research Risks at the National Institutes of Health.
Enucleation was performed under general anesthesia. The eye was hemisected just anterior to the ora serrata. The vitreous was removed, and the eyecup was dark-adapted for at least 1 hr in a light-tight jar containing 36°C bicarbonate-buffered Ames solution equilibrated with 95% O2 and 5% CO2 (Sigma, St. Louis, MO). All subsequent procedures were performed under infrared illumination with the aid of infrared image converters.
Before recording, a 4 × 4 mm2 piece of retina was isolated and placed photoreceptor side up in the recording chamber. Cones were visualized with infrared Nomarski optics through an upright microscope, a 40× water immersion objective, and an infrared-sensitive camera. The retina was incubated for 3-5 min in a mixture of enzymes to clear the cone plasma membranes of inter-photoreceptor matrix, cellular debris, and residual vitreous. The enzymes were added to Ames solution at the following concentrations (in units per milliliter) : collagenase (80), hyaluronidase (300), deoxyribonuclease (500), and chondroitin ABC lyase (0.2). They were obtained from: collagenase CLSPA (Worthington Biochemical Corp., Lakewood, NJ), hyaluronidase HSEP (Worthington Biochemical Corp.), deoxyribonuclease I DPFF (Worthington Biochemical Corp.), and chondroitin ABC lyase 190334 (ICN Biochemicals Inc., Aurora, OH).
After enzyme treatment the retina was superfused with bicarbonate-buffered Ames medium. Bath temperature was maintained at 36°C (Cell Micro Controls, Norfolk, VA).
Electrical recording and optical stimulation. Whole-cell membrane currents were recorded from the inner segments of red and green cones at retinal eccentricities of 1-1.5 cm. No differences were found in the surround properties of the two spectral cone types. The components comprising the patch electrode solutions used are listed in Table 1. Patch solution 1 contained a normal “physiological” concentration of chloride, whereas solutions 2-4 contained elevated chloride concentrations designed to enhance surround responses. The calcium chelator 1,2-bis-(2-aminophenoxy)ethane-N,N,N′,N′-tetra-acetic acid (BAPTA) (Sigma) was added to patch solutions 3 and 4 to test the effects of buffering changes in the intracellular free calcium concentration. Solution 4 contained an estimated free calcium concentration of ∼300 nm.
Table 1.
Patch electrode solutions 1-4
|
|
1 |
2 |
3 |
4 |
|---|---|---|---|---|
| K-gluconate | 130 | 107 | 99 | 94.5 |
| KCl | 10 | 33 | 32 | 25.5 |
| MgCl2 | 4 | 4 | 4.5 | 4.5 |
| HEPES | 10 | 10 | 10 | 10 |
| ATP-Na2 | 3 | 3 | 3 | 3 |
| GTP-Na3 | 1 | 1 | 1 | 1 |
| BAPTA-K4 | 0 | 0 | 5 | 5 |
| CaCl2
|
0
|
0
|
0
|
3.2
|
Values in table indicate millimolar concentration. Solutions were titrated to pH 7.25 with KOH.
Membrane potentials were corrected for the liquid junction potential of the electrode. The series resistance of the electrode in whole-cell recording was ∼10 MΩ, and the input impedances of cones were ∼100-250 MΩ. Because most recordings were made at membrane potentials near the resting potential of the cone, the resultant errors in membrane potential caused by series resistance were typically less than a couple of millivolts. These errors remain uncorrected except for experiments on the voltage dependence of surround- and voltage-activated conductances in which voltage errors of up to 3 mV (see Fig. 6) and 8 mV (see Fig. 7) were calculated for the most depolarized responses. The reversal potentials and slope conductances calculated from these experiments were corrected for series resistance errors, as indicated in the Results.
Figure 6.

Dependence of surround response on chloride, calcium, and membrane potential. Change in membrane current in response to annulus in three cones. Traces are averages of one or two responses. The holding potential is indicated by the numbers (in millivolts) to the left of each trace. Bandwidth DC-50 Hz. The cone in A was recorded with patch solution 1 (ECl -52 mV), the cone in B with patch solution 2 (ECl -30 mV), and the cone in C with patch solution 3 (ECl -30 mV, 5 mm BAPTA). Annulus monitor is shown above current traces. The bars near the annulus monitors indicate the time windows used for measuring response amplitude. The horizontal calibration bar is 300 msec. The vertical bar is 9 pA in A, 6 pA in B, and 18 pA in C. The annulus (500 nm, 1.1 × 10⁶ photons μm-2 sec-1) had an inner radius of 40 μm and an outer radius of 250-350 μm. An adapting spot of light (radius 35 μm, 500 nm, 5.6 × 10⁶ photons μm-2 sec-1) was present continuously.
Figure 7.
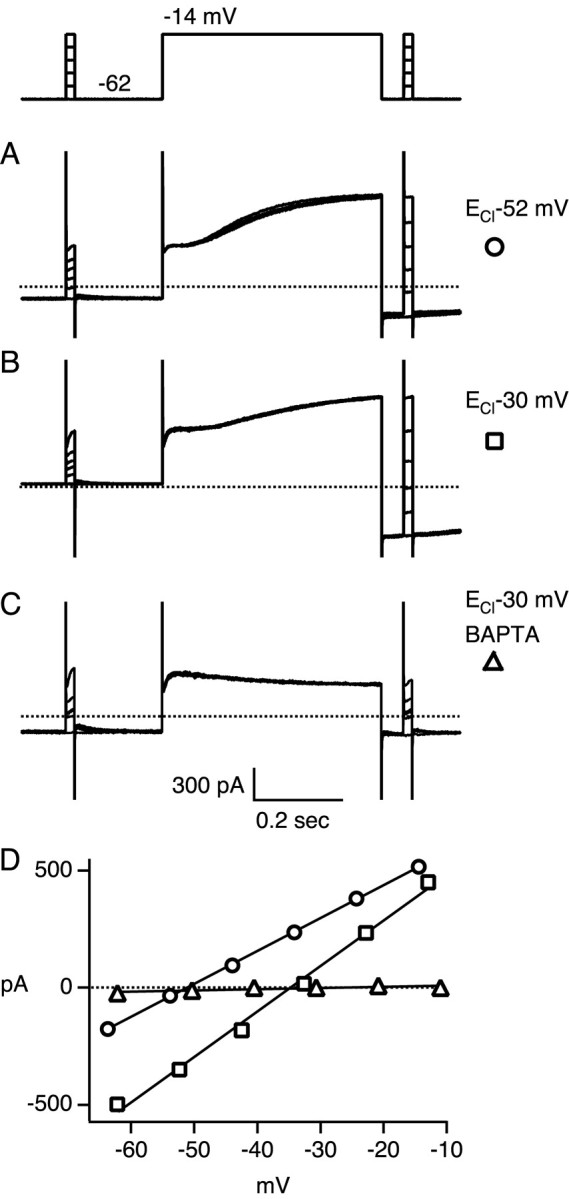
Voltage dependence of the calcium-activated chloride current. A-C, Depolarization from -62 to -14 mV for 500 msec evoked an inward tail current after repolarization of the membrane potential. The voltage dependence of the tail current was measured with 20 msec pulses to potentials between approximately -62 and -14 mV in steps of ∼10 mV, before and after the 500 msec depolarizing step. The voltage protocol is given by the top trace, and membrane currents measured in three cones are plotted below. Dotted lines denote zero membrane current. Traces are averages of one or two responses. Bandwidth DC-2 kHz. Patch solution 1 (ECl -52 mV) was used in A, patch solution 2 (ECl -30 mV) in B, and patch solution 3 (ECl -30 mV, 5 mm BAPTA) in C. D, The instantaneous current-voltage relationship of the tail current was calculated by averaging the amplitude of the membrane current averaged between 2 and 5 msec after onset of the 20 msec voltage pulse. The symbols plot the amplitudes measured during the tail current minus the amplitudes measured before the 500 msec depolarization for the cells illustrated in A (○), B (□), and C (Δ). The straight lines are least square fits to the data points. The slope conductances and reversal potentials calculated after correction for series resistance errors were (in nanosiemens and millivolts): 22, -53 (○); 29, -38 (□); 0.3, -9 (Δ).
In a limited number of experiments, whole-cell recordings were made with the perforated patch technique (Horn and Marty, 1988; Schneeweis and Schnapf, 1995). The electrode contained patch solution 1 plus 120 μM amphotericin B (Sigma). With perforated patch recordings, large photovoltage responses of up to 25 mV could be measured for ≥1 hr. By contrast, conventional whole-cell recordings caused rundown of phototransduction in a matter of minutes. An important disadvantage of perforated patch recording, however, was that the series resistance of the electrode was too high (20-40 MΩ) for reliable voltage-clamp control when holding currents were large. Consequently, perforated patch recordings were used sparingly and limited to either current-clamp mode (at I = 0), or voltage-clamp mode at membrane potentials near the resting potential in which holding currents and hence voltage errors were small. Unless explicitly specified as a perforated patch recording, recordings were obtained by conventional whole-cell methods.
Membrane currents were recorded with an Axopatch 1D amplifier (Axon Instruments, Union City, CA) and low-pass filtered by the Axopatch 4-pole Bessel analog filter with a cutoff frequency of 2 kHz. Photocurrents were filtered additionally by an 8-pole Bessel analog filter (Frequency Devices, Haverhill, MA) with a cutoff frequency of 250 Hz. All phase shifts resulting from filtering were corrected. Data acquisition and analysis and stimulus presentation were performed with a Macintosh G4 computer, an ITC-16 interface (Instrutech Corp., Port Washington, NY), and the software program Igor Pro 4.0 (Wavemetrics Inc., Lake Oswego, OR). Signals were digitized at 2 or 5 kHz.
Cones were stimulated with unpolarized light. Wavelength was regulated with interference filters of 10 nm nominal half-width, and intensity was attenuated with calibrated reflective neutral density filters. Light calibrations of the unattenuated energy flux at each wavelength were made before each experiment with a radiometer (model 350; UDT Instruments, Baltimore, MD).
Fit of receptive field data to exponential model. The spatial extent of the surround receptive field was determined from responses to spots and annuli of various sizes. Response amplitudes were fit with a model in which the sensitivity S (per unit area) of the surround receptive field declined with distance x from the center of the receptive field as
 . Assuming that responses sum linearly across the receptive field, then the expected surround response to a spot of light of radius a would be:
 |
1 |
where r(a) is the amplitude of the surround response elicited by a spot of radius a, and r∞, the asymptotic response amplitude as a → ∞, is equal to 2πS0λ2.
To isolate the component of the response to a spot of light that was caused by stimulation of the inhibitory surround, the component attributed to the receptive field center had to be subtracted. It was assumed that for a given light intensity, this center response was identical for all spot sizes used. The smallest spot (diameter 45 μm) was large enough to cover the cone and the ring of nearest neighboring cones. To subtract off the center component, a constant was added to the measured response amplitudes. This constant was an additional free parameter in fitting the data to Equation 1. The equation was fit to the data by minimizing the squared differences between the points and the curve.
Surround responses to an annulus of outer radius a1 and inner radius a2 would be:
 |
2 |
where r(a1) and r(a2) are taken from Equation 1. Responses to annuli of fixed inside radius and variable outside radii were plotted as a function of outer radius and fit by least squares criteria to Equation 2. To compare spot and annuli data directly (see Fig. 4C), annulus response amplitudes were shifted by the constant r(a2) derived from the fit of Equation 2 to the data. Collected results from both spot and annulus protocols were plotted together along with Equation 1 (see Fig. 4 D), after normalizing the data by r∞ and λ for each cell.
Figure 4.

Pharmacological blockade of surround response. Change in membrane current in response to annulus flash. The annulus response was blocked by bath application of the glutamate receptor antagonist CNQX (A), by synaptic blocker cobalt chloride (B), and by gap junction blocker carbenoxolone (E), but not by GABA (C), or GABA-receptor antagonist picrotoxin (D). Responses during drug application were measured from 3 to 12 min after drug onset. Circles plot the responses obtained after return to the control solution. Responses in A and B, measured 15 and 5 min, respectively, after return to control, showed partial or complete recovery. No recovery was seen in E for responses measured 8 min after return to control. Current traces are averages of 3-12 responses. Holding potential, -35 to -47 mV. Bandwidth DC-50 Hz. For cells in A and B, patch solution 1 was used with perforated patch recording. Patch solution 4 and whole-cell recordings were used for the cells in C-E. Annulus flash monitor is shown above current traces. Annulus responses were measured in the presence of a bright-adapting spot of radius 20-35 μm. Annuli had inner radii of 20-40 μm and outer radii of 205-350 μm. Drug concentrations were as follows: 20 μm CNQX (A), 100 μm CoCl2 (B), 500 μm GABA plus 25 μm GABA uptake inhibitor SKF89976A (C), 200 μm picrotoxin (D), and 100 μm carbenoxolone (E).
Drug application. Drugs were either dissolved in Ames solution and superfused over the retina or dissolved in HEPES-buffered Lockes solution and pressure-ejected from a pipette. The Lockes solution contained (in mm): NaCl (140), KCl (3.6), MgCl2 (2.4), CaCl2 (1.2), dextrose (10), and HEPES buffer (3.0), pH 7.4. The puffer pipette was positioned 10-20 μm above the tissue and its contents expelled using positive pressure generated by a PicoSpritzer II (General Valve, Fairfield, NJ). The following drugs were used: GABA (Sigma), GABA transporter inhibitor SKF89976A (Tocris, Ballwin, MO), picrotoxin (Sigma), carbenoxolone (Sigma), CoCl2 (Sigma), and 6-cyano-7-nitroquinoxaline-2,3-dione (CNQX) (Tocris).
Results
Demonstration of surround antagonism in primate cones
Light responses to center and surround stimulation were of opposite polarity (Fig. 1). The spot of light, centered on the cone, evoked an outward current, as expected from the activation of phototransduction in the cone outer segment. A concentric annulus of light evoked an inward current. This “antagonistic” response to surround illumination was observed in a total of 68 macaque cones. Although cones are known to be electrically coupled to neighboring rods and cones (Raviola and Gilula, 1973; Schneeweis and Schnapf, 1999; DeVries et al., 2002), the surround response shown here cannot be attributed to coupling. The passive spread of signals from electrically coupled neighbors would result in additional outward current. The inward current evoked by an annulus is consistent with feedback signaling from horizontal cells.
Figure 1.

Antagonistic surround response of a cone in primate retina. Change in membrane current of a cone in response to a spot and annulus plotted as a function of time. Stimulus monitor shown below current trace. The current trace is the average of six responses. Perforated patch recording with patch solution 1. Holding potential, -47 mV. Bandwidth DC-250 Hz. Spot stimulus, 20 μm radius; 500 nm; 5.2 × 10⁶ photons μm-2 sec-1. Annulus, 20 μm inside radius; 205 μm outside radius; 500 nm; 1.3 × 10⁶ photons μm-2 sec-1.
Receptive fields of cone surround
The spatial extent of receptive fields of cone surrounds was determined using two methods. In the first method cones were presented with spots of light of increasing radius. The response to the smallest spot was an outward current, attributable to phototransduction in the cone outer segment, with additional input from electrically coupled neighboring cones (Fig. 2A). Responses to larger spots displayed a delayed component of inward current attributable to an inhibitory surround mechanism. The amplitude of the outward component was maximal for spots of 23 μm radius and did not increase with greater spot sizes. The amplitude of the inward component, however, continued to increase with radii up to 350 μm.
Figure 2.

Amplitude of cone surround response as a function of stimulus radius. A, Membrane current of a cone in response to spots of increasing radius. Spot radius is indicated by the numbers next to each trace (in micrometers). Traces are averages of three responses and are displaced vertically for clarity. Stimulus monitor is shown below current traces. Stimulus wavelength, 530 nm; stimulus intensity, 1.56 × 10⁶ photons μm-2 sec-1. Holding potential, -40 mV. Bandwidth DC-250 Hz. Patch solution 4. B, Membrane current of a different cone in response to annuli of increasing outer radii. Annulus inner radius is 40 μm. The outer radius is given by the numbers next to each trace (in micrometers). Traces are averages of two responses and are displaced vertically for clarity. Holding potential, -46 mV. Bandwidth DC-250 Hz. Stimulus monitor is shown below current traces. An adapting spot of radius 35 μm was turned on 1 sec before annulus onset. Stimulus wavelength and intensity were 500 nm, 5.6 × 10⁶ photons μm-2 sec-1 (spot), and 500 nm, 1.1 × 10⁶ photons photons μm-2 sec-1 (annulus). Patch solution 3. C, Response amplitudes from A (•), and B (○) plotted as a function of stimulus outer radius. Response amplitudes were averaged over the time window 480-500 msec after spot onset in A and 80-100 msec after annulus onset in B. The continuous curves are Equation 1 with r∞ = 12.6 pA and λ = 59 μm for the filled symbols, and r∞ = 26.8 pA and λ = 134 μm for the open symbols. The data are shifted vertically by -0.8 pA (•) and -1.0 pA (○) as indicated in Materials and Methods. D, Response amplitude plotted as a function of stimulus radius on normalized axes. The filled symbols were obtained from three cones in response to spot stimuli, the open symbols from three cones in response to annuli. The continuous curve is Equation 1. The constants r∞ and λ were determined for each cell by least squares fit. The best fitting values for r∞ (in picoamperes) and λ (in micrometers) were, respectively: 26.8, 134 (○); 22.1, 129 (Δ); 5.0, 69 (□); 12.6, 59 (•); 21.3, 103 (▴); 30.4, 95 (▪).
In a second method, a “pure” surround response was evoked by flashing an annulus in the presence of a small saturating adapting spot, centered on the recorded cone (Fig. 2B). For the cone shown, the annulus response increased in amplitude with increasing outer radii of up to at least 350 μm.
The symbols in Figure 2C plot surround response amplitude as a function of stimulus outer radius from the data shown in A (•) and B (○). The data were fit to a model in which receptive field sensitivity per unit area declined exponentially with distance from the field center with a length constant λ (see Materials and Methods). The values of λ obtained from a least squares fit of the model to the data were 59 (•) and 134 μm (○). Receptive fields were measured in six cones and plotted in Figure 2D on normalized axes. In all six experiments the data were well fit by the exponential model with an average length constant λ of 98 ± 31 μm (mean ± SD) and a range of 59-134 μm.
Packer and Dacey (2002) characterized the receptive field sizes of horizontal cells in macaque retina by calculating the distance from the center of the field at which the sensitivity per unit area fell to 10% of its peak value. They defined receptive field diameter as twice this distance. Using their definition of diameter, the cones illustrated in Figure 2D would have receptive field diameters of -2λ natural logarithm (0.1), which corresponds to an average value of 451 μm, with a range of 272-617 μm. At retinal eccentricities similar to the ones explored here, diameters of horizontal cell receptive fields ranged from ∼60 to 700 μm, with an average diameter of 309 μm (Packer and Dacey, 2002). Cone surrounds are expected to be somewhat larger than those of horizontal cells because each cone makes synaptic contacts with approximately four horizontal cells with partially overlapping dendritic fields (Wässle et al., 1989). Because of this overlap, the cone receptive field diameter should increase by an amount corresponding to the radius of the dendritic spread of a horizontal cell, ∼75 μm at the retinal locations described here (Wässle et al., 1989). Thus, the receptive field diameter of a cone surround predicted from horizontal cell receptive fields (309 + 75 = 384 μm) is reasonably close to our measured average value of 451 μm.
Spectral sensitivity of surround antagonism
Horizontal cells in macaque retina receive input from a mixture of cones of various spectral types (Wässle et al., 1989; Ahnelt and Kolb, 1994; Dacey et al., 1996). An antagonistic surround in cones that is generated by horizontal cell feedback should reflect this mixed cone input. The spectral sensitivity of surround antagonism was measured with annuli of 500 and 660 nm wavelength in the presence of a bright adapting spot as described above. To eliminate the effect of rod input on spectral sensitivity (Schneeweis and Schnapf, 1995) a dim background light of 500 or 530 nm was presented continuously.
Annulus intensity was adjusted to evoke linear range responses that were approximately equal in amplitude (Fig. 3). The relative spectral sensitivity of the surround was calculated from the ratio of the response amplitude divided by light intensity at the two wavelengths. For the cone in Figure 3, the log of the relative sensitivity (log[S500/S660]) was 1.5. The range of values for five cones from the same monkey was 1.5-1.7. These values correspond to spectral sensitivities in between those of red and green cones derived from photocurrent recordings of macaque cone outer segments (Baylor et al., 1987): 0.9 (red) and 2.2 (green cones). Thus, a mixture of cone inputs mediates surround responses in macaque cones.
Figure 3.

Antagonistic surround has mixed cone input. Change in membrane current in response to annuli of 500 nm (solid curve) and 660 nm (dotted curve). Curves are averages of five responses. Holding potential, -37 mV. Bandwidth DC-20 Hz. Patch solution 4. Annulus inner and outer radius were 60 and 350 μm, respectively. Stimulus intensity was 2.9 × 10⁴ photons μm-2 sec-1 (500 nm) and 1.2 × 10⁶ photons μm-2 sec-1 (660 nm). Intensities were in the linear portion of the response range of the cone. A dim uniform background (500 nm, 860 photons μm-2 sec-1) was presented continuously to minimize effects of rod input. An adapting spot (530 nm, 6.0 × 10⁶ photons μm-2 sec-1, radius 35 μm) was also presented continuously.
Pharmacology of surround antagonism
Reciprocal communication between cones and horizontal cells can be disrupted at either the glutamatergic synapse used in signaling from cones to horizontal cells or the feedback synapse from horizontal cells to cones. Light responses of horizontal cells in salamander retina are abolished by the glutamatergic AMPA-kainate receptor antagonist CNQX (Yang and Wu, 1989), and the surround response in goldfish cones is blocked by the related receptor antagonist DNQX (Verweij et al., 1996). Immunohistochemical staining suggests that the cone to horizontal cell synapse in primates also uses the AMPA-kainate-type glutamate receptor (Haverkamp et al., 2001a,b). Figure 4A shows that responses in monkey cones to light annuli were reversibly blocked by bath application of 20 μm CNQX (n = 2).
Cobalt at submillimolar concentrations (250-500 μm) blocks feedback transmission from horizontal cells to cones in turtle and frog retina without attenuating synaptic transmission from cones to horizontal cells (Thoreson and Burkhardt, 1990; Vigh and Witkovsky, 1999). Figure 4B demonstrates that 100 μm cobalt chloride blocked surround antagonism in monkey cones (n = 3). This concentration of cobalt does not block the feedforward signals from cones to horizontal cells in macaque retina (Packer et al., 2002). These results support the idea that cone surrounds in primate retina are caused by feedback inhibition from horizontal cells.
To evaluate the possible role of GABA as the signaling molecule from horizontal cells to cones (Kaneko and Tachibana, 1986; Wu, 1986, 1991; Picaud et al., 1998), annulus responses were evoked in the presence and absence of bath-applied GABA (0.5-1 mm) coapplied with the GABA uptake inhibitor SKF89976A (Fig. 4C). Although GABA at this concentration would be expected to saturate GABA receptors (Lukasiewicz and Shields, 1998, Matthews et al., 1994), it had no effect on annulus responses measured in four of five cones. In the fifth cone, GABA produced a partial and reversible block of the surround response, but only after a delay of 12 min from the onset of bath application (data not shown). Because the bath-applied effects of both cobalt and CNQX were rapid, the delay in the response to GABA suggests that this response may have been indirect by way of other retinal neurons (Knapp and Dowling, 1987; Kamermans and Werblin, 1992; Feigenspan et al., 2000; Stella and Thoreson, 2000).
GABA-gated currents in cones of turtle, mouse, and pig are partially or completely blocked by the GABAA/C-receptor antagonist picrotoxin (Kaneko and Tachibana, 1986; Picaud et al., 1998; Pattnaik et al., 2000). In addition, the depolarizing responses of biphasic horizontal cells in carp, which are thought to result from feedback to cones, were also blocked by picrotoxin (Murakami et al., 1982b). In macaque cones however, 200 μm picrotoxin had no effect on surround responses (Fig. 4D) (n = 2). In addition, neither GABA nor picrotoxin had a noticeable effect on the holding current or other properties of the cone light response. Thus, the surround response in macaque cones appears not to be mediated by picrotoxin-sensitive GABAA or GABAC receptors.
In isolated cones of both turtle and pig (Kaneko and Tachibana, 1986; Picaud et al., 1998) and in cones recorded in situ in isolated mouse retina (Pattnaik et al., 2000), puffing GABA onto cones evokes a conductance increase which reverses at the chloride equilibrium potential ECl. To test for GABA sensitivity of monkey cones in situ, cones were voltage-clamped to membrane potentials between -70 and -10 mV, ECl was set to -30 mV, and 1 mm GABA was pressure-ejected from a puffer pipette. Responses from representative cones recorded at -62 mV are illustrated in Figure 5. At this membrane potential, an inward current response is expected for a GABA-activated chloride conductance. In the 12 cones tested, 7 gave no detectable responses to puffs of GABA at any membrane potential (Fig. 5A), whereas 5 cones gave small responses similar in magnitude to the current artifacts observed with puffs of control Lockes solution (Fig. 5B-D). Of the five cones that responded to GABA, one responded with an outward current at -62 mV (Fig. 5B), whereas the remaining four responded with the expected inward current response (Fig. 5C). In only two of these cones however, did the GABA response reverse near ECl. The responses were barely detectable above the noise however, and could not be tested rigorously. These responses were unlike the robust GABA-evoked chloride currents previously described in cones of other species (Kaneko and Tachibana, 1986; Picaud et al., 1998; Pattnaik et al., 2000). Thus, we were unable to convincingly demonstrate GABA-gated chloride channels in macaque cones in situ.
Figure 5.

Test of GABA sensitivity. Change in membrane current in response to pressure ejection of 1 mm GABA (A-C) and control Lockes solution (D). Timing of the ejection is indicated by the bars above the current traces. Each trace is from a different cone and is the average of one or two responses. GABA sensitivity was tested in 12 cones. GABA evoked no detectable responses in seven cones (A), outward currents in one cone (B), and inward currents in four cones (C) at a holding potential of -62 mV. Chloride equilibrium potential, -30 mV. Bandwidth DC-30 Hz. Patch solution 3 was used in A and B, and solution 2 in C and D.
If surround responses in monkey cones are not mediated by GABA, then how do horizontal cells communicate to cones? One possibility is that communication is ephaptic, that is mediated by extracellular current, not neurotransmitters (Byzov and Shura-Bura, 1986). Kamermans et al. (2001) suggested that the ephaptic circuit included current flow through hemichannels located on horizontal cell dendrites. They observed that the gap junction and hemichannel blocker carbenoxolone (Osborne and Williams, 1996; Ripps et al., 2002) blocked surround antagonism in goldfish cones. Figure 4E shows that bath application of carbenoxolone (100 μm) also blocked surround antagonism in monkey cones. In all five cones tested, carbenoxolone block was complete and did not reverse on return to control Ames solution over the measured recovery period of 8-10 min.
Was the blockade of surround responses we observed caused by the direct action of carbenoxolone on feedback signaling or was it caused by suppression of phototransduction in cone outer segments? To test this, changes in membrane potential were measured with perforated patch electrodes in response to small spots of light centered on the recorded cone. In the five cones tested, carbenoxolone decreased the quantal sensitivity of cone phototransduction approximately six-fold without significantly altering responses to saturating light (data not shown). For the light intensity used in Figure 4E, this inhibitory effect on phototransduction would be expected to reduce the surround response by only 35%. The complete abolition of the surround response observed with carbenoxolone cannot therefore be attributed to suppression of phototransduction.
In many species, the receptive fields of horizontal cells are enlarged by gap junctional coupling between neighboring horizontal cells (Kaneko, 1971). Because carbenoxolone is a known blocker of gap junctions, can the blockade of the surround response in cones by carbenoxolone be explained by the uncoupling of horizontal cells? Uncoupling would shrink the receptive field of a horizontal cell to the dimensions of its dendritic arbor (∼150 μm in the far periphery; Wässle et al., 1989), but not reduce responses to very large spots. Assuming an exponential receptive field profile, a simple calculation indicates that uncoupling would have an insignificant effect on responses to our surround stimuli. The blockade of the surround response with carbenoxolone cannot therefore be attributed to the uncoupling of horizontal cells.
Chloride dependence of the surround response
In lower vertebrates, illumination of the surround of a cone evokes an increase in chloride conductance in the cone (Lasansky, 1981). Figure 6 demonstrates the same effect in primate cones. With ECl set to -52 mV, the cone responded to an annulus with a transient outward current, at potentials both positive and negative to ECl (Fig. 6A). This transient component is probably caused by activation of phototransduction in the recorded cone that was not sufficiently suppressed by the central adapting spot and was commonly seen when using a patch solution with ECl = -52 mV. After the initial component, a slow outward current developed at membrane potentials positive to ECl, consistent with the passive flow of chloride. No reliable reversal of this current was observed, however, at potentials negative to ECl. Similar results were seen in a second cone recorded with ECl -52 mV.
In a cone recorded with ECl set to -30 mV, the slow component of the surround response reversed near -30 mV (Fig. 6B). The amplitude of the slow component was estimated as the difference in the currents averaged over the two 20 msec time windows indicated by the bars in the figure. After corrections for series resistance errors, the reversal potential was estimated by linear interpolation of the response amplitudes near zero picoamperes. For the 10 cells recorded with ECl set to -30 mV, the reversal potential was -38 ± 2 mV (mean ± SD). The reversal potential was fairly close to ECl, suggesting that the slow component of the surround response consisted primarily of an increase in conductance to chloride, with a smaller contribution from other ions.
Calcium and voltage dependence of the surround response
In cones of lower vertebrates, surround illumination elicits a two-phase conductance increase comprised of a rapid component with a positive reversal potential and a slow component with a more negative reversal potential (O'Bryan, 1973). These two components have been identified as a fast voltage-activated calcium conductance and a slow calcium-activated chloride conductance (Verweij et al., 1996). A calcium-activated chloride conductance has been observed in isolated cones in the primate retina (Yagi and MacLeish, 1994). To determine if this conductance plays a role in the surround response of primate cones, the calcium chelator BAPTA was included in the patch solution to block the rise in intracellular free calcium concentration and hence the activation of the calcium-activated chloride conductance.
The effect of BAPTA on one cone with ECl set to -30 mV is shown in Figure 6C. Surround illumination evoked an inward current at all membrane potentials positive to -50 mV. Unlike the cone in B, the slow component of the response did not reverse in polarity close to the chloride equilibrium potential. Thus, chelation of intracellular calcium blocked the delayed increase in chloride conductance. Similar results were obtained in a total of 24 cones. Surround responses in BAPTA were not observed at holding potentials more negative than -60 mV. The responses were maximal at a holding potential of -40 ± 5 mV (mean ± SD). The voltage activation range of the response was quite similar to the voltage dependence of the calcium current in isolated macaque cones (Yagi and MacLeish, 1994). The inward currents recorded with BAPTA were often larger than the inward currents measured in the absence of BAPTA, suggesting that the underlying calcium conductance may be inactivated by intracellular calcium (Budde et al., 2002).
Conductance properties of the calcium-activated chloride current
To strongly activate the calcium-activated chloride conductance and further characterize its voltage dependence, calcium channels were activated by stepping the holding potential from -62 to -14 mV. The resultant currents measured in one cone with ECl set to -52 mV are shown in Figure 7A. During the step depolarization a slowly developing outward current was seen. After repolarization an inward tail current lingered for >500 msec. Assuming that this tail current was dominated by the slow shutoff of the chloride conductance, then difference currents measured before activation and during the tail could be used to estimate the instantaneous voltage dependence of the conductance. The membrane voltage was briefly pulsed to various potentials both before the long depolarizing step, and again 50 msec after repolarization. The difference in the amplitude of the currents measured at these two time points was plotted as a function of membrane potential in Figure 7D (○). The current-voltage relationship of the tail current was nearly linear and reversed close to the value of ECl set to -52 mV. After corrections for series resistance errors, reversal potential and slope conductance were estimated by fitting a straight line to the amplitude of the difference currents. In the three cells recorded with ECl of -52 mV, the reversal potential was -54 ± 1 mV, and the slope conductance was 21 ± 10 nS (mean ± SD).
Cones recorded with ECl of -30 mV also displayed a pronounced slowly activating outward current during depolarization and a pronounced inward tail current after repolarization (Fig. 7B). The current-voltage relationship of the tail response was linear and reversed near ECl (Fig. 7D, □). After correction for series resistance, the response reversed at -38 mV, with an estimated slope conductance of 29 nS. In the 12 cells recorded with ECl of -30 mV, the reversal potential was -39 ± 3 mV, and the slope conductance was 25 ± 12 nS.
If activation of the tail conductance requires elevation of intracellular calcium, then blockade of the rise of intracellular calcium should eliminate the tail current. The cone illustrated in Figure 7C was recorded with ECl of -30 mV and with 5 mm BAPTA in the patch electrode to chelate calcium. As expected, there was no slow outward current during depolarization and no tail current after repolarization. The current-voltage relationship after repolarization in Figure 7D (Δ) had a slope close to zero. In a total of eight cones recorded under these conditions, the slope conductance was 0 ± 1 nS.
These results demonstrate that macaque cones in situ contain a calcium-activated chloride conductance with linear current-voltage properties. This conductance is likely to underlie the chloride conductance shown to be evoked by surround illumination (Fig. 6) in the same preparation.
Discussion
We have unambiguously identified surround antagonism in cones in the primate retina. This antagonism appears to be generated by signals originating in horizontal cells. The significance of spatial antagonism is that it reduces redundant information in cone signals arising from the spatial correlations in visual scenes (Srinivasan et al., 1982). Selective amplification of uncorrelated signals in cones enables optimal use of the dynamic range of the cone synapse, thereby minimizing the effects of noise generated by the rest of the visual system. The presence of horizontal cell feedback on cones has direct consequences for color vision. As a result of feedback, the synaptic output of a cone is driven by light absorption from a combination of cones of differing spectral classes, not a single spectral class. This mixing of cone signals at the initial step in the visual process places constraints on the neural mechanisms used to extract wavelength information from the relative excitation of the three classes of cones.
The magnitude of surround antagonism
Surround antagonism was observed in only ∼20% of the cones we recorded. The reason for this is not certain, but we assume that the fraction of cones with antagonistic surrounds is much greater in vivo. In lower vertebrates, surround responses are also seen in only a fraction of even the best cone recordings, and the responses frequently deteriorate over time (Burkhardt, 1993; Piccolino, 1995). This suggests that the mechanism generating surround antagonism is labile.
Our ability to visualize cone surrounds was improved by depolarizing the membrane potential and by elevating the intracellular chloride concentration relative to their assumed physiological values. The membrane potential of macaque cones ranges from approximately -50 mV in the dark to -70 mV in response to a bright light. Surround responses were largest however at potentials near -40 mV, presumably because the voltage dependence of the calcium current is steepest in this region (Fig. 7) (Yagi and MacLeish, 1994). In turtle cones, the intracellular chloride concentration is estimated to be between 12 and 24 mm (Kaneko and Tachibana, 1986). Surround responses in macaque cones, however, were best seen when the chloride concentration of the patch solution was ∼40 mm (ECl -30 mV). Elevation of intracellular chloride might augment feedback signals in two ways. First, high intracellular chloride is known to amplify synaptic transmission from photoreceptors by increasing calcium channel open probability (Thoreson et al., 1997, 2000). This effect of chloride on open probability might also increase surround-evoked activation of the calcium conductance. Second, when the membrane potential is held at -40 mV, the surround-evoked fluxes of calcium and chloride ions (calcium in and chloride out) are electrically additive at an ECl of -30 mV, whereas they are subtractive (both calcium and chloride in) at physiological concentrations of chloride (ECl -52 mV) (Kraaij et al., 2000).
How significant a role do cone surrounds play in the development of spatial antagonism in the retina as a whole? Although the electrical response in cones to surround illumination is small at physiological membrane potentials and chloride concentration, a small surround-evoked influx of calcium into a restricted presynaptic space like the cone pedicle would nonetheless have a substantial effect on synaptic transmission. Indeed, in rabbit retina, surround responses of ganglion cells can be mimicked by injection of hyperpolarizing current into nearby horizontal cells (Mangel, 1991). This response appears to originate from horizontal cell feedback to cones because the effect in ON-ganglion cells was blocked by application of 2-amino-4-phosphonobutyate (APB), an antagonist to the glutamate receptor found on ON-bipolar cells. Direct inhibitory synaptic inputs onto amacrine cells and ganglion cells should also play a critical role in the generation of surround antagonism in the inner retina (Taylor, 1999; Bloomfield and Xin, 2000; Flores-Herr et al., 2001). Nonetheless, in primate retina most of the surround antagonism observed in ganglion cells was blocked by carbenoxolone, leading to the suggestion that ganglion cell surrounds primarily reflect horizontal cell feedback to cones (Packer et al., 2002). Potential confounding effects of carbenoxolone acting directly on neurons of the inner retina cannot be ruled out, however.
Mechanisms of feedback antagonism
We found that surround illumination increased chloride conductance in macaque cones. This observation suggests that feedback to cones in monkey is similar to that in salamander, turtle, and goldfish (Lasansky, 1981; Thoreson and Burkhardt, 1991; Verweij et al., 1996). The surround response in monkey is not mediated by GABA-gated chloride channels because such a mechanism would predict a decrease in chloride conductance with surround illumination.
Another inconsistency with a GABA-gated chloride mechanism in monkey cones is the absence of an unambiguous increase in chloride conductance in response to pressure ejection of GABA. One possible explanation for this negative finding is that the cone synaptic pedicle is not readily accessible to GABA when it is applied to the surface of an intact isolated retina. Two lines of evidence would suggest that this is not the explanation. First, Pattnaik et al. (2000) demonstrated robust responses to GABA when puffed onto the surface of intact mouse retina. Second, David Schneeweis (personal communication) applied GABA directly onto the synaptic terminals of cones in macaque retinal slices while recording whole-cell currents in cones. His results were similar to the ones we report here despite easy access of GABA to its putative site of action.
An alternative GABA-gated mechanism that modulates a calcium rather than a chloride conductance was reported in bipolar cell terminals of goldfish retina (Heidelberger and Matthews, 1991). This mechanism has many features in common with the surround-evoked calcium conductance described here. In bipolar cells, activation of a GABAB-like receptor caused a depolarizing shift in the range of voltages over which voltage-gated calcium channels were activated. Like the surround responses in macaque cones, this mechanism is picrotoxin-insensitive. If a similar GABA-gated mechanism were involved in signaling from horizontal cells to cones, then surround illumination would be expected to shift the calcium channel activation range in the hyperpolarizing direction and increase calcium conductance of the cone synapse. Consistent with this idea, surround illumination was found to cause a hyperpolarizing shift in the activation range of the calcium current in goldfish cones (Verweij et al., 1996). Like the surround responses in macaque cones, the GABA-evoked calcium currents observed in bipolar cell terminals were labile and variable (Matthews et al., 1994). It remains difficult, however, to explain why high concentrations of GABA did not effectively block cone surrounds if indeed GABA were the feedback neurotransmitter.
An ephaptic mechanism of communication between horizontal cells and cones requires no neurotransmitter. Although our present results are compatible with this mechanism, it is difficult to test this hypothesis directly. Kamermans et al. (2001) proposed that ephaptic signaling from horizontal cells to cones depends on current flow through hemichannels on horizontal cell dendrites. Consistent with this, carbenoxolone blocks the surround responses both in goldfish cones (Kamermans et al., 2001) and monkey cones. However, we found that carbenoxolone also desensitized phototransduction in cones. Although the desensitization was not sufficient to abolish the surround response, it leaves open the possibility that an as yet unidentified effect of carbenoxolone, for example modulation of calcium channel activation, might be responsible for the observed effects on cone surrounds.
Further experiments are clearly needed to elucidate the synaptic mechanisms of horizontal cell to cone transmission. It will also be of interest to determine if horizontal cell feedback produces surround antagonism in blue cones and rods in macaque retina.
Footnotes
This work was supported by National Institutes of Health Grants R01-EY07642, F32-EY0700, and T32-EY07120, a grant from That Man May See, Inc., and additional support from Research to Prevent Blindness. We thank Saskia DeVries for her invaluable participation in the early stages of this project and Drs. David Copenhagen and Juan Korenbrot for insightful comments on this manuscript.
Correspondence should be addressed to Dr. Julie Schnapf, Departments of Ophthalmology and Physiology, 10 Kirkham Street, University of California, San Francisco, California 94143-0730. E-mail: schn@phy.ucsf.edu.
Copyright © 2003 Society for Neuroscience 0270-6474/03/2310249-09$15.00/0
References
- Ahnelt P, Kolb HJ ( 1994) Horizontal cells and cone photoreceptors in primate retina: a Golgi-light microscopic study of spectral connectivity. Comp Neurol 15: 387-405. [DOI] [PubMed] [Google Scholar]
- Baylor DA, Fuortes MGF, O'Bryan PM ( 1971) Receptive fields of cones in the retina of the turtle. J Physiol (Lond) 214: 265-294. [DOI] [PMC free article] [PubMed] [Google Scholar]
- Baylor DA, Nunn BJ, Schnapf JL ( 1987) Spectral sensitivity of cones of the monkey Macaca fascicularis J Physiol (Lond) 390: 145-160. [DOI] [PMC free article] [PubMed] [Google Scholar]
- Bloomfield SA, Xin D ( 2000) Surround inhibition of mammalian AII amacrine cells is generated in the proximal retina. J Physiol (Lond) 523: 771-783. [DOI] [PMC free article] [PubMed] [Google Scholar]
- Budde T, Meuth S, Pape H-C ( 2002) Calcium-dependent inactivation of neuronal calcium channels. Nat Rev Neurosci 3: 873-883. [DOI] [PubMed] [Google Scholar]
- Burkhardt DA ( 1993) Synaptic feedback, depolarization, and color opponency in cone photoreceptors. Vis Neurosci 10: 981-989. [DOI] [PubMed] [Google Scholar]
- Byzov AL, Shura-Bura TM ( 1986) Electrical feedback mechanism in the processing of signals in the outer plexiform layer of the retina. Vision Res 26: 33-44. [DOI] [PubMed] [Google Scholar]
- Dacey DM, Lee BB, Stafford DK, Pokorny J, Smith VC ( 1996) Horizontal cells of the primate retina: cone specificity without spectral opponency. Science 271: 656-659. [DOI] [PubMed] [Google Scholar]
- DeVries SH, Qi X, Smith R, Makous W, Sterling P ( 2002) Electrical coupling between mammalian cones. Curr Biol 12: 1900-1907. [DOI] [PubMed] [Google Scholar]
- Feigenspan A, Gustincich S, Raviola E ( 2000) Pharmacology of GABAA receptors of retinal dopaminergic neurons. J Neurophysiol 84: 1697-1707. [DOI] [PubMed] [Google Scholar]
- Flores-Herr N, Protti DA, Wässle H ( 2001) Synaptic currents generating the inhibitory surround of ganglion cells in the mammalian retina. J Neurosci 21: 4852-4863. [DOI] [PMC free article] [PubMed] [Google Scholar]
- Fuortes MGF, Schwartz EA, Simon EJ ( 1973) Colour-dependence of cone responses in the turtle retina J Physiol (Lond) 234: 199-216. [DOI] [PMC free article] [PubMed] [Google Scholar]
- Gerschenfeld HM, Piccolino M, Neyton J ( 1980) Feed-back modulation of cone synapses by L-horizontal cells of turtle retina. J Exp Biol 89: 177-192. [DOI] [PubMed] [Google Scholar]
- Haverkamp S, Grünert U, Wässle H ( 2001a) The synaptic architecture of AMPA receptors at the cone pedicle of the primate retina. J Neurosci 21: 2488-2500. [DOI] [PMC free article] [PubMed] [Google Scholar]
- Haverkamp S, Grünert U, Wässle H ( 2001b) Localization of kainate receptors at the cone pedicles of the primate retina. J Comp Neurol 436: 471-486. [DOI] [PubMed] [Google Scholar]
- Heidelberger R, Matthews G ( 1991) Inhibition of calcium influx and calcium current by gamma-aminobutyric acid in single synaptic terminals. Proc Natl Acad Sci USA 88: 7135-7139. [DOI] [PMC free article] [PubMed] [Google Scholar]
- Horn R, Marty A ( 1988) Muscarinic activation of ionic currents measured by a new whole-cell recording method. J Gen Physiol 92: 145-159. [DOI] [PMC free article] [PubMed] [Google Scholar]
- Hubel DH, Wiesel TN ( 1960) Receptive fields of optic nerve fibers in the spider monkey. J Physiol (Lond) 154: 572-580. [DOI] [PMC free article] [PubMed] [Google Scholar]
- Kamermans M, Spekreijse H ( 1999) The feedback pathway from horizontal cells to cones. A mini review with a look ahead. Vision Res 39: 2449-2468. [DOI] [PubMed] [Google Scholar]
- Kamermans M, Werblin F ( 1992) GABA-mediated positive autofeedback loop controls horizontal cell kinetics in tiger salamander retina. J Neurosci 12: 2451-2463. [DOI] [PMC free article] [PubMed] [Google Scholar]
- Kamermans M, Fahrenfort I, Schultz K, Janssen-Bienhold U, Sjoerdsma T, Weiler R ( 2001) Hemichannel-mediated inhibition in the outer retina. Science 292: 1178-1180. [DOI] [PubMed] [Google Scholar]
- Kaneko A ( 1971) Electrical connexions between horizontal cells in the dogfish retina. J Physiol (Lond) 213: 95-105. [DOI] [PMC free article] [PubMed] [Google Scholar]
- Kaneko A, Tachibana M ( 1986) Effects of γ-aminobutyric acid on isolated cone photoreceptors of the turtle retina. J Physiol (Lond) 373: 443-461. [DOI] [PMC free article] [PubMed] [Google Scholar]
- Knapp AG, Dowling JE ( 1987) Dopamine enhances excitatory amino acid-gated conductances in cultured retinal horizontal cells. Nature 325: 437-439. [DOI] [PubMed] [Google Scholar]
- Kraaij DA, Spekreijse H, Kamermans M ( 2000) The nature of surround-induced depolarizing responses in goldfish cones. J Gen Physiol 115: 3-16. [DOI] [PMC free article] [PubMed] [Google Scholar]
- Kuffler SW ( 1953) Discharge patterns and functional organization of mammalian retina. J Neurophysiol 16: 37-68. [DOI] [PubMed] [Google Scholar]
- Lasansky A ( 1981) Synaptic action mediating cone responses to annular illumination in the retina of the larval tiger salamander. J Physiol (Lond) 310: 205-214. [DOI] [PMC free article] [PubMed] [Google Scholar]
- Leeper HF, Charlton JS ( 1985) Response properties of horizontal cells and photoreceptor cells in the retina of the tree squirrel, Sciurus carolinensis. J Neurophysiol 54: 1157-1166. [DOI] [PubMed] [Google Scholar]
- Lukasiewicz PD, Shields CR ( 1998) A diversity of GABA receptors in the retina. Semin Cell Dev Biol 9: 293-299. [DOI] [PubMed] [Google Scholar]
- Mach E ( 1865) On the effect of the spatial distribution of the light stimulus on the retina. Translated in: Mach Bands: quantitative studies on neural networks in the retina, 1965 (Ratliff F, ed), pp 253-271. San Francisco: Holden-Day.
- Mangel S ( 1991) Analysis of the horizontal cell contribution to the receptive field surround of ganglion cells in the rabbit retina. J Physiol (Lond) 442: 221-234. [DOI] [PMC free article] [PubMed] [Google Scholar]
- Maricq AV, Korenbrot JI ( 1988) Calcium-dependent chloride currents generate action potentials in solitary cone photoreceptors. Neuron 1: 503-515. [DOI] [PubMed] [Google Scholar]
- Matthews G, Ayoub GS, Heidelberger R ( 1994) Presynaptic inhibition by GABA is mediated via two distinct GABA receptors with novel pharmacology. J Neurosci 14: 1079-1090. [DOI] [PMC free article] [PubMed] [Google Scholar]
- Murakami M, Shimoda Y, Nakatani K, Miyachi E-I, Watanabe S-I ( 1982a) GABA-mediated negative feedback from horizontal cells to cones in carp retina. Jpn J Physiol 32: 911-926. [DOI] [PubMed] [Google Scholar]
- Murakami M, Shimoda Y, Nakatani K, Miyachi E-I, Watanabe S-I ( 1982b) GABA-mediated negative feedback and color opponency in carp retina. Jpn J Physiol 32: 927-935. [DOI] [PubMed] [Google Scholar]
- O'Bryan PM ( 1973) Properties of the depolarizing synaptic potential evoked by peripheral illumination in cones of the turtle retina. J Physiol (Lond) 235: 207-223. [DOI] [PMC free article] [PubMed] [Google Scholar]
- Osborne PB, Williams JT ( 1996) Forskolin enhancement of opioid currents in rat locus coeruleus neurons. J Neurophysiol 76: 1559-1565. [DOI] [PubMed] [Google Scholar]
- Packer OS, Dacey DM ( 2002) Receptive field structure of H1 horizontal cells in macaque monkey retina. J Vision 2: 272-292. [DOI] [PubMed] [Google Scholar]
- Packer OS, McMahon MJ, Dacey DM ( 2002) Carbenoxolone blocks horizontal cell feedback and eliminates the ganglion cell surround in macaque monkey retina. Invest Ophthalmol Vis Sci 43:E-abstract 2922. [Google Scholar]
- Pattnaik B, Jellali A, Sahel J, Dreyfus H, Picaud S ( 2000) GABAC receptors are localized with microtubule-associated protein 1B in mammalian cone photoreceptors. J Neurosci 20: 6789-6796. [DOI] [PMC free article] [PubMed] [Google Scholar]
- Picaud S, Pattnaik B, Hicks D, Forster V, Fontaine V, Sahel J, Dreyfus H ( 1998) GABAA and GABAC receptors in adult porcine cones: evidence from a photoreceptor-glia co-culture model. J Physiol (Lond) 513: 33-42. [DOI] [PMC free article] [PubMed] [Google Scholar]
- Piccolino M ( 1995) The feedback synapse from horizontal cells to cone photoreceptors in the vertebrate retina. Prog Retin Res 15: 141-196. [Google Scholar]
- Raviola E, Gilula NB ( 1973) Gap junctions between photoreceptor cells in the vertebrate retina. Proc Natl Acad Sci USA 70: 1677-1681. [DOI] [PMC free article] [PubMed] [Google Scholar]
- Ripps H, Qian H, Zakevicius J ( 2002) Pharmacological enhancement of hemi-gap-junctional currents in Xenopus oocytes. J Neurosci Methods 121: 81-92. [DOI] [PubMed] [Google Scholar]
- Schneeweis DM, Schnapf JL ( 1995) Photovoltage of rods and cones in the macaque retina. Science 268: 1053-1056. [DOI] [PubMed] [Google Scholar]
- Schneeweis DM, Schnapf JL ( 1999) The photovoltage of macaque cone photoreceptors: adaptation, noise and kinetics. J Neurosci 19: 1203-1216. [DOI] [PMC free article] [PubMed] [Google Scholar]
- Schwartz EA ( 1982) Calcium-independent release of GABA from isolated horizontal cells of the toad retina. J Physiol (Lond) 323: 221-227. [DOI] [PMC free article] [PubMed] [Google Scholar]
- Skrzypek J, Werblin F ( 1983) Lateral interactions in absence of feedback to cones. J Neurophysiol 49: 1007-1016. [DOI] [PubMed] [Google Scholar]
- Srinivasan MV, Laughlin SB, Dubs A ( 1982) Predictive coding: a fresh view of inhibition in the retina. Proc R Soc Lond B Biol Sci 216: 427-459. [DOI] [PubMed] [Google Scholar]
- Stella SL, Thoreson WB ( 2000) Differential modulation of rod and cone calcium currents in tiger salamander retina by D2 dopamine receptors and cAMP. Eur J Neurosci 10: 3537-3548. [DOI] [PubMed] [Google Scholar]
- Taylor WR ( 1999) TTX attenuates surround inhibition in rabbit retinal ganglion cells. Vis Neurosci 16: 285-290. [DOI] [PubMed] [Google Scholar]
- Thoreson WB, Burkhardt DA ( 1990) Effects of synaptic blocking agents on the depolarizing responses of turtle cones evoked by surround illumination. Vis Neurosci 5: 571-583. [DOI] [PubMed] [Google Scholar]
- Thoreson WB, Burkhardt DA ( 1991) Ionic influences on the prolonged depolarization of turtle cones in situ. J Neurophysiol 65: 96-110. [DOI] [PubMed] [Google Scholar]
- Thoreson WB, Nitzan R, Miller RF ( 1997) Reducing extracellular Cl- suppresses dihydropyridine-sensitive Ca2+ currents and synaptic transmission in amphibian photoreceptors. J Neurophysiol 77: 2175-2190. [DOI] [PubMed] [Google Scholar]
- Thoreson WB, Nitzan R, Miller RF ( 2000) Chloride efflux inhibits single calcium channel open probability in vertebrate photoreceptors: chloride imaging and cell-attached patch-clamp recordings. Vis Neurosci 17: 197-206. [DOI] [PubMed] [Google Scholar]
- Verweij J, Kamermans M, Spekreijse H ( 1996) Horizontal cells feed back to cones by shifting the cone calcium-current activation range. Vision Res 36: 3943-3953. [DOI] [PubMed] [Google Scholar]
- Vigh J, Witkovsky P ( 1999) Sub-millimolar cobalt selectively inhibits the receptive field surround of retinal neurons. Vis Neurosci 16: 159-168. [DOI] [PubMed] [Google Scholar]
- Wässle H, Boycott BB, Rohrenbeck J ( 1989) Horizontal cells in the monkey retina: cone connections and dendritic network. Eur J Neurosci 1: 421-435. [DOI] [PubMed] [Google Scholar]
- Wu SM ( 1986) Effects of gamma-aminobutyric acid on cones and bipolar cells of the tiger salamander retina. Brain Res 365: 70-77. [DOI] [PubMed] [Google Scholar]
- Wu SM ( 1991) Input-output relations of the feedback synapse between horizontal cells and cones in the tiger salamander retina. J Neurophysiol 65: 1197-1206. [DOI] [PubMed] [Google Scholar]
- Yagi T, MacLeish PR ( 1994) Ionic conductances of monkey solitary cone inner segments. J Neurophysiol 71: 656-665. [DOI] [PubMed] [Google Scholar]
- Yang X-L, Wu SM ( 1989) Effects of CNQX, APB, PDA, and kynurenate on horizontal cells of the tiger salamander retina. Vis Neurosci 3: 207-212. [DOI] [PubMed] [Google Scholar]