

Abstract
Proliferation and survival of different cell types is thought to be modulated by cell interactions during development that achieve numerical and functional balance. We tested the precision of coregulation of numbers of neurons, glial cells, and endothelial cells in the dorsal lateral geniculate nucleus (LGN) in 58 isogenic strains of mice. We acquired matched counts of retinal ganglion cells (RGCs) in these strains and tested the precision of numerical matching between retina and LGN. Cells were counted using unbiased counting protocols and tissue from the Mouse Brain Library (www.mbl.org). Classification criteria were assessed using immunohistochemical criteria. The LGN contains an average of 17,000 neurons, 12,000 glial cells, and 10,000 endothelial cells. Variation around these means is typically twofold, and cell ratios vary widely. Strain differences in LGN volume correlate moderately well with glial cell number (r = 0.69) and less well with RGC number (r = 0.35) and with LGN neuron number (r = 0.32). Populations of LGN neurons and glial cells correlate only modestly (r = 0.44; p < 0.01). The single most surprising and unequivocal finding was the lack of any detectable correlation between populations of LGN neurons and RGCs, a correlation of merely 0.01 across 56 strains. In contrast, RGC number correlates significantly with LGN glial cell number, a surprising twist on the numerical matching hypothesis (r = 0.33; p < 0.01). We conclude that numbers of these two functionally coupled neuron populations are modulated over a wide range by independent genetic and developmental mechanisms.
Keywords: mouse brain, BXD recombinant inbred, lateral geniculate nucleus, retinal ganglion cells, glial cell, endothelial cell
Introduction
A dominant hypothesis in developmental neurobiology, often referred to as the neurotrophic hypothesis, states that neuronal survival is contingent on the supply of trophic factors provided primarily by the target tissues and postsynaptic neurons (Davies, 1996; Bennett et al., 2002). The numerical matching hypothesis is a more explicit version of the neurotrophic hypothesis that argues that ratios of interconnected cell populations are coregulated to achieve numerical balance. A compelling case has been made of the coupling between connected populations of neurons (Purves, 1988). For example, in the mouse olfactory system, tufted cell neuron number is almost precisely proportional to granular cell number (Skeen et al., 1986). Numerical matching has also been demonstrated in the granule cell-Purkinje cell circuit as well as in the olivocerebellar circuit of mice. Herrup and Sunter (1987) report a close correlation between the number of granule and Purkinje cells in staggerer wild-type chimeras. A similar correlation is seen in lurcher mutants between Purkinje cells and neurons in the inferior olive (Herrup et al., 1996). Nearly linear relationships have been detected in several other studies of motor neurons in chick embryos (Tanaka and Landmesser, 1986; Lanser and Fallon, 1987).
There are also interesting exceptions that weaken the generality of the numerical matching hypothesis. For example, Herrup et al. (1996) found almost no relationship between Purkinje cells and olivary neurons in inbred strains and staggerer mutant mice. Several studies have also failed to detect correlations between numbers of functionally related populations after experimental manipulation (Miller, 1987; Miller et al., 1999; Mooney and Miller, 1999). Surprisingly, in the mouse retina there is no obvious relationship between populations of photoreceptors and retinal ganglion cells (RGCs), and mice with complete retinal photoreceptor loss have normal, even high, numbers of these projection neurons (Williams et al., 1998).
Two recent studies of the primary visual system of rhesus monkeys raise an even more serious challenge to the generality of numerical matching. Spear et al. (1996) reported that populations of retinal ganglion cell and principal neurons in the lateral geniculate nucleus (LGN) are completely uncorrelated. Ratios of these two populations varied from 0.78:1 to 1.64. Because the LGN receives a predominant input from the neocortex, perhaps the size of cortical input to the LGN from area 17 is more relevant. This idea was tested by Suner and Rakic (1996) but they also failed to demonstrate any numerical coupling between LGN and striate cortex neurons. However, both of these studies in rhesus used modest numbers of cases [Spear et al. (1996), n = 5; Suner and Rakic (1996), n = 7]. Failure to detect positive correlations might simply reflect low statistical power coupled with genetic heterogeneity. We can now revisit this same issue by exploiting a large sample of isogenic mice.
We have previously counted RGC axons in the optic nerves of ∼1000 mice belonging to over 50 strains. The numbers of these neurons vary almost twofold among isogenic strains (Williams et al., 1996, 1998). This variation provides the impetus and biological signal to accurately measure covariation and correlation between the retinal input and cells in the LGN. We have tested quantitative relationships using an unusually large set of mice in which technical error has been controlled by resampling isogenic individuals. There are significant correlations among neurons, glial cells, and vascular cells within the LGN. Surprisingly, even with a large sample size, we do not detect any correlation between RGCs and LGN neurons. The possibility that this lack of correlation is caused by complex and highly variable patterns of retinal projections to thalamus, pretectum, or superior colliculus is improbable given the modest variation in retinal projections and the fiber size spectrum (Rice et al., 1995; present study).
Materials and Methods
Brains were taken from 268 mice belonging to 58 different strains (Table 1). Most animals were shipped directly from the Jackson Laboratory (Bar Harbor, ME). The age of mice ranged from 35 to 694 d (mean, 102.4 ± 5.5). No systematic attempt was made to ensure that the average age or sex ratios among strains were matched. However, 142 males and 126 females were analyzed. Most animals that we obtained from the Jackson Laboratory were fed a 6% fat NIH31 diet. All BXD recombinant inbred strains were fed a high fish oil diet (Wayne Lab Tech), with the exception of three strains (BXD13, BXD20, and BXD31) that were fed a 9% fat diet. At the University of Tennessee, all strains were fed a 5% fat Agway Prolab 3000 rat and mouse chow. Colonies were maintained at 20-24°C on a 14/10 hr light/dark cycle. The number of cases per strain ranged from 4 to 11, with the exceptions of BXH3, BXH19, PANCEVO/Ei, and SPRET/Ei (two, three, two, and two cases, respectively).
Table 1.
Summary of cell numbers within the LGN and retina
|
Strain |
Number |
Brain weighta (mg) |
LGN volumeb (mm3) |
Total cell number (× 1000) |
Neuron numberc (× 1000) |
Glial cell numberc (× 1000) |
Endothelial cell numberc (× 1000) |
Retinal ganglion numberd (× 1000) |
RGC/LGN neuron ratioe |
|---|---|---|---|---|---|---|---|---|---|
| C57BL/6J | 8 | 478 ± 5.8 | 0.30 ± 0.02 | 46.7 ± 2.1 | 19.9 ± 1.5 | 15.1 ± 0.9 | 11.7 ± 0.7 | 54.6 ± 0.9 | 2.74 |
| B6D2F1 | 4 | 471 ± 11.5 | 0.33 ± 0.02 | 45.0 ± 6.4 | 20.2 ± 3.2 | 15.0 ± 2.9 | 9.7 ± 1.2 | NA ± NA | NA |
| D2B6F1 | 4 | 474 ± 7.7 | 0.31 ± 0.03 | 41.1 ± 2.6 | 17.3 ± 1.2 | 14.3 ± 1.7 | 9.5 ± 1.4 | NA ± NA | NA |
| DBA/2J | 8 | 393 ± 8.7 | 0.26 ± 0.01 | 37.0 ± 1.7 | 16.2 ± 1.1 | 13.2 ± 0.9 | 7.5 ± 0.6 | 63.4 ± 1.2 | 3.91 |
| BXD1 | 5 | 441 ± 11.7 | 0.29 ± 0.03 | 36.9 ± 2.4 | 14.9 ± 0.8 | 10.8 ± 0.8 | 11.3 ± 1.1 | 59.5 ± 1.1 | 3.99 |
| BXD2 | 5 | 424 ± 7.0 | 0.23 ± 0.01 | 34.6 ± 1.9 | 13.7 ± 1.0 | 11.2 ± 0.5 | 9.6 ± 1.1 | 65.9 ± 1.5 | 4.81 |
| BXD5 | 6 | 540 ± 9.9 | 0.36 ± 0.02 | 45.6 ± 2.5 | 18.1 ± 1.0 | 15.9 ± 1.5 | 11.6 ± 1.1 | 73.4 ± 1.2 | 4.06 |
| BXD8 | 4 | 428 ± 11.7 | 0.21 ± 0.02 | 32.9 ± 2.0 | 15.1 ± 0.8 | 10.2 ± 1.2 | 7.6 ± 0.6 | 57.1 ± 2.5 | 3.78 |
| BXD9 | 5 | 431 ± 3.4 | 0.27 ± 0.03 | 39.4 ± 2.6 | 15.5 ± 1.2 | 12.4 ± 0.6 | 11.5 ± 1.2 | 64.0 ± 2.7 | 4.13 |
| BXD11 | 4 | 434 ± 5.1 | 0.33 ± 0.03 | 46.1 ± 3.7 | 18.5 ± 0.5 | 12.5 ± 0.9 | 15.0 ± 2.7 | 60.9 ± 2.6 | 3.29 |
| BXD12 | 6 | 438 ± 12.6 | 0.22 ± 0.01 | 36.3 ± 1.9 | 15.5 ± 1.6 | 12.4 ± 0.7 | 8.4 ± 0.6 | 53.3 ± 0.9 | 3.44 |
| BXD13 | 6 | 415 ± 5.3 | 0.25 ± 0.02 | 39.7 ± 4.9 | 17.7 ± 2.4 | 12.9 ± 1.1 | 9.2 ± 1.9 | 54.3 ± 1.4 | 3.07 |
| BXD14 | 5 | 444 ± 10.6 | 0.25 ± 0.01 | 37.3 ± 1.3 | 14.7 ± 0.6 | 13.1 ± 1.1 | 9.6 ± 0.9 | 63.6 ± 1.6 | 4.33 |
| BXD15 | 5 | 453 ± 4.9 | 0.28 ± 0.01 | 41.4 ± 1.4 | 18.2 ± 1.0 | 11.5 ± 0.8 | 11.7 ± 1.7 | 62.5 ± 1.2 | 3.43 |
| BXD16 | 4 | 431 ± 10.9 | 0.26 ± 0.02 | 48.2 ± 2.1 | 20.0 ± 0.6 | 16.3 ± 1.2 | 11.9 ± 0.5 | 64.3 ± 2.2 | 3.22 |
| BXD18 | 4 | 419 ± 10.3 | 0.24 ± 0.03 | 38.7 ± 4.3 | 15.8 ± 1.0 | 13.3 ± 0.7 | 9.6 ± 3.1 | 53.7 ± 1.0 | 3.40 |
| BXD19 | 4 | 432 ± 12.0 | 0.29 ± 0.01 | 35.7 ± 3.8 | 14.5 ± 1.1 | 12.6 ± 0.7 | 8.7 ± 2.5 | 63.8 ± 1.9 | 4.40 |
| BXD20 | 5 | 392 ± 3.6 | 0.24 ± 0.01 | 41.0 ± 2.9 | 14.8 ± 2.0 | 13.8 ± 0.8 | 12.3 ± 1.2 | 61.6 ± 1.9 | 4.16 |
| BXD22 | 5 | 446 ± 5.3 | 0.34 ± 0.01 | 50.4 ± 2.3 | 18.4 ± 1.0 | 17.1 ± 0.7 | 14.8 ± 1.5 | 63.1 ± 1.6 | 3.43 |
| BXD23 | 4 | 414 ± 9.0 | 0.36 ± 0.04 | 40.7 ± 1.7 | 17.6 ± 0.8 | 15.2 ± 1.1 | 7.9 ± 1.7 | 52.6 ± 1.7 | 2.99 |
| BXD24f | 4 | 407 ± 8.3 | 0.24 ± 0.01 | 38.6 ± 0.9 | 15.3 ± 0.7 | 11.0 ± 0.8 | 12.3 ± 1.7 | 61.4 ± 0.6 | 4.01 |
| BXD25 | 4 | 401 ± 16.5 | 0.25 ± 0.02 | 35.0 ± 3.3 | 16.1 ± 1.1 | 10.9 ± 1.4 | 8.1 ± 1.5 | 52.6 ± 2.1 | 3.27 |
| BXD27 | 5 | 352 ± 2.0 | 0.24 ± 0.01 | 31.5 ± 1.5 | 14.8 ± 0.8 | 9.6 ± 0.8 | 7.1 ± 0.5 | 50.9 ± 1.0 | 3.44 |
| BXD28 | 4 | 394 ± 6.5 | 0.22 ± 0.01 | 35.5 ± 1.5 | 15.7 ± 1.1 | 11.7 ± 0.7 | 8.1 ± 0.7 | 55.2 ± 2.5 | 3.52 |
| BXD29 | 7 | 376 ± 10.0 | 0.26 ± 0.02 | 40.7 ± 3.8 | 17.4 ± 1.1 | 13.6 ± 2.3 | 9.6 ± 1.2 | 61.2 ± 1.6 | 3.52 |
| BXD30 | 6 | 369 ± 11.1 | 0.23 ± 0.01 | 37.3 ± 1.7 | 15.7 ± 1.1 | 12.4 ± 1.0 | 9.2 ± 1.1 | 67.4 ± 2.3 | 4.29 |
| BXD31 | 4 | 414 ± 8.8 | 0.26 ± 0.01 | 43.8 ± 1.4 | 18.3 ± 1.3 | 14.0 ± 1.0 | 11.5 ± 0.6 | 64.2 ± 1.5 | 3.51 |
| BXD32 | 11 | 443 ± 5.6 | 0.27 ± 0.01 | 34.2 ± 1.1 | 13.2 ± 0.5 | 12.3 ± 0.3 | 8.7 ± 0.5 | 74.5 ± 2.2 | 5.64 |
| BXD33 | 4 | 424 ± 11.8 | 0.24 ± 0.01 | 38.4 ± 2.5 | 18.4 ± 1.6 | 11.2 ± 0.7 | 8.7 ± 1.0 | 57.4 ± 2.6 | 3.12 |
| BXD34 | 5 | 414 ± 9.4 | 0.26 ± 0.03 | 40.6 ± 1.6 | 19.4 ± 1.2 | 12.3 ± 0.9 | 8.9 ± 0.6 | 58.6 ± 2.5 | 3.02 |
| BXD35 | 5 | 402 ± 5.7 | 0.27 ± 0.01 | 39.3 ± 2.5 | 16.5 ± 1.0 | 13.2 ± 1.0 | 9.7 ± 1.4 | 60.7 ± 0.9 | 3.68 |
| BXD36 | 5 | 403 ± 11.1 | 0.26 ± 0.01 | 40.0 ± 2.4 | 17.4 ± 0.9 | 13.0 ± 1.0 | 9.6 ± 1.0 | 63.3 ± 3.3 | 3.64 |
| BXD38 | 4 | 418 ± 9.0 | 0.26 ± 0.01 | 36.0 ± 1.0 | 15.1 ± 0.5 | 11.4 ± 0.4 | 9.5 ± 1.3 | 59.7 ± 2.1 | 3.95 |
| BXD39 | 5 | 393 ± 14.0 | 0.29 ± 0.02 | 36.3 ± 2.2 | 15.1 ± 1.3 | 13.1 ± 1.3 | 8.1 ± 1.1 | 67.5 ± 1.6 | 4.47 |
| BXD40 | 4 | 431 ± 7.3 | 0.34 ± 0.01 | 43.0 ± 1.7 | 16.1 ± 0.4 | 13.0 ± 0.5 | 13.9 ± 1.3 | 67.4 ± 2.2 | 4.19 |
| BXD42 | 5 | 449 ± 7.5 | 0.30 ± 0.02 | 39.8 ± 2.8 | 16.7 ± 1.2 | 12.5 ± 0.9 | 10.6 ± 2.1 | 63.0 ± 5.2 | 3.77 |
| BXH3f | 2 | 444 ± 17.2 | 0.26 ± 0.01 | 35.2 ± 3.0 | 16.0 ± 0.6 | 11.2 ± 1.4 | 8.0 ± 1.0 | 61.7 ± 1.8 | 3.86 |
| BXH4f | 4 | 477 ± 9.1 | 0.24 ± 0.02 | 40.0 ± 3.6 | 19.4 ± 2.7 | 11.6 ± 1.2 | 9.0 ± 0.6 | 65.6 ± 2.5 | 3.38 |
| BXH6 | 4 | 423 ± 8.3 | 0.28 ± 0.03 | 35.7 ± 1.1 | 17.2 ± 1.1 | 10.9 ± 0.7 | 7.6 ± 0.8 | 51.3 ± 1.1 | 2.98 |
| BXH7f | 4 | 445 ± 7.1 | 0.21 ± 0.01 | 37.8 ± 1.5 | 19.7 ± 0.9 | 10.0 ± 0.4 | 8.1 ± 0.9 | 54.8 ± 2.2 | 2.78 |
| BXH9f | 4 | 441 ± 7.7 | 0.21 ± 0.01 | 33.9 ± 2.3 | 16.9 ± 1.7 | 9.3 ± 0.8 | 7.7 ± 0.2 | 56.3 ± 1.5 | 3.33 |
| BXH10 | 4 | 445 ± 14.1 | 0.25 ± 0.01 | 38.2 ± 1.1 | 18.0 ± 0.5 | 11.7 ± 0.6 | 8.4 ± 0.5 | 56.0 ± 2.3 | 3.11 |
| BXH11 | 4 | 434 ± 23.9 | 0.25 ± 0.02 | 39.8 ± 2.4 | 19.5 ± 1.2 | 10.9 ± 1.1 | 9.4 ± 0.5 | 53.9 ± 1.4 | 2.76 |
| BXH12 | 4 | 427 ± 7.3 | 0.23 ± 0.01 | 37.5 ± 2.8 | 19.4 ± 2.2 | 10.9 ± 0.5 | 7.2 ± 1.2 | 68.1 ± 0.8 | 3.51 |
| BXH14f | 4 | 410 ± 6.6 | 0.24 ± 0.01 | 40.8 ± 2.3 | 20.4 ± 2.3 | 10.5 ± 1.1 | 9.9 ± 1.2 | 64.2 ± 2.2 | 3.15 |
| BXH19 | 3 | 423 ± 5.6 | 0.22 ± 0.03 | 32.9 ± 4.0 | 15.9 ± 3.0 | 8.9 ± 1.1 | 8.1 ± 0.8 | 51.2 ± 3.7 | 3.22 |
| A/J | 6 | 395 ± 4.0 | 0.23 ± 0.01 | 36.7 ± 3.6 | 15.8 ± 2.1 | 12.0 ± 1.3 | 9.0 ± 0.8 | 50.6 ± 1.3 | 3.20 |
| AKR/J | 4 | 446 ± 16.0 | 0.29 ± 0.01 | 51.1 ± 3.4 | 22.5 ± 1.1 | 16.4 ± 1.1 | 12.1 ± 1.4 | 62.8 ± 0.9 | 2.79 |
| BALB/cByJ | 6 | 429 ± 5.3 | 0.25 ± 0.02 | 36.0 ± 1.9 | 17.1 ± 1.1 | 11.2 ± 0.7 | 7.6 ± 0.8 | 55.9 ± 1.2 | 3.27 |
| C3H/HeJf | 4 | 425 ± 11.1 | 0.21 ± 0.01 | 33.5 ± 4.0 | 14.6 ± 2.0 | 10.4 ± 1.0 | 8.5 ± 1.2 | 67.0 ± 1.7 | 4.59 |
| C57BL/6J | 8 | 478 ± 5.8 | 0.30 ± 0.02 | 46.7 ± 2.1 | 19.9 ± 1.5 | 15.1 ± 0.9 | 11.7 ± 0.7 | 54.6 ± 0.9 | 2.74 |
| CD-1f | 4 | 506 ± 15.7 | 0.27 ± 0.03 | 37.6 ± 4.7 | 16.7 ± 2.2 | 12.8 ± 1.6 | 8.1 ± 1.2 | 68.3 ± 2.2 | 4.09 |
| CE/J | 4 | 463 ± 17.7 | 0.21 ± 0.02 | 26.7 ± 0.8 | 13.2 ± 0.4 | 8.2 ± 0.4 | 5.2 ± 0.7 | 63.6 ± 2.5 | 4.82 |
| DBA/2J | 8 | 393 ± 8.7 | 0.26 ± 0.01 | 37.0 ± 1.7 | 16.2 ± 1.1 | 13.2 ± 0.9 | 7.5 ± 0.6 | 63.4 ± 1.2 | 3.91 |
| LP/J | 4 | 369 ± 20.6 | 0.23 ± 0.02 | 34.9 ± 3.2 | 14.2 ± 1.4 | 11.7 ± 1.5 | 9.1 ± 0.9 | 52.2 ± 2.0 | 3.68 |
| PL/Jf | 4 | 410 ± 3.8 | 0.22 ± 0.01 | 42.4 ± 4.8 | 18.6 ± 1.8 | 13.3 ± 1.4 | 10.5 ± 1.8 | 56.0 ± 1.3 | 3.01 |
| CASA/Rk | 4 | 391 ± 8.2 | 0.23 ± 0.02 | 40.0 ± 4.6 | 20.1 ± 2.3 | 11.2 ± 1.4 | 8.6 ± 1.3 | 47.2 ± 1.4 | 2.35 |
| CAST/Eig | 4 | 394 ± 7.3 | 0.21 ± 0.01 | 29.8 ± 1.3 | 12.6 ± 1.0 | 9.8 ± 0.9 | 7.5 ± 1.0 | 45.0 ± 1.0 | 3.57 |
| PANCEVO/Ei | 2 | 431 ± 0.9 | 0.34 ± 0.01 | 48.4 ± 1.5 | 21.4 ± 2.6 | 14.7 ± 1.2 | 12.2 ± 2.8 | 64.3 ± 1.4 | 3.00 |
| SPRET/Ei | 2 | 363 ± 3.7 | 0.26 ± 0.03 | 35.6 ± 7.3 | 13.5 ± 1.4 | 11.4 ± 2.5 | 10.7 ± 3.3 | 59.0 ± 1.9 | 4.37 |
| Average
|
4.6
|
425 ± 4.4
|
0.26 ± 0.01
|
38.7 ± 0.6
|
16.9 ± 0.3
|
12.3 ± 0.2
|
9.5 ± 0.3
|
59.9 ± 0.8
|
3.61
|
Brain weights are averages based only on the subset of cases for which we also have acquired LGN cell count data.
LGN volume is corrected for shrinkage (average of left and right) and provides a reasonable in vivo estimate.
Cell number estimates are the averages of left and right LGNs, expressed as a unilateral count (one side).
RGC number estimates from Williams et al. (1996, 1998) with extensive new data reported here (BXD 33-42 and B6D2F1). These are also unilateral estimates (one nerve, one eye).
RGC/LGN neuron ratio is the ratio of strain averages of RGCs to LGN neuron number.
Retinal degeneration strains.
A sample of unusually old animals with a median age of 526 d. In contrast, the median age of the CASA/Rk sample is only 52 d.
Subjects
Wild species. We studied three wild species of mice: (1) Mus spretus (SPRET/Ei) is a highly divergent species from Spain and Morocco that has a chromosomal organization somewhat different than that of Mus musculus domesticus; (2) Mus spicilegus (PANCEVO/Ei) belongs to a unique colonial species of Mus from the Ukraine; and (3) Mus musculus castaneus (CAST/Ei and CASA/Rk) are small Southeast Asian subspecies.
Standard inbred strains. Standard inbred laboratory strains of mice are derived from domesticated hybrids generated from crosses between M. m. domesticus and a mix of M. m. musculus, Mus musculus molossinus, and M. m. castaneus subspecies (Bonhomme, 1992; Wade et al., 2002). We studied nine standard laboratory strains: A/J, AKR/J, BALB/cByJ, C3H/HeJ, C57BL/6J, CE/J, DBA/2J, LP/J, and PL/J. These animals are homozygous at essentially all loci. The particular strains that we studied were selected without regard to CNS or ocular characteristics.
Recombinant inbred strains. For this study, we included 32 of the BXD recombinant inbred strains. The parental strains for all of the recombinant BXD strains are C57BL/6J and DBA/2J. The related reciprocal F1 hybrids, B6D2F1 and D2B6F1, were included (see below). The genome of each BXD strain is an isogenic mosaic of C57BL/6J and DBA/2J chromosomal segments (Bailey, 1981; Taylor, 1989; Williams et al., 2001). We also quantified 10 BXH recombinant inbred strains. The parental strains for the BXH recombinants are C57BL/6J and C3H/HeJ.
Genetically heterogeneous mice and isogenic F1 hybrids. We included one genetically heterogeneous strain, CD-1. CD-1 was derived from noninbred Swiss albinos originally designated HaM/ICR (Hauschka and Mirand, 1973). We also studied two isogenic F1 hybrids of DBA/2J and C57BL/6J (B6D2F1:C57BL/6J female by DBA/2J male and D2B6F1:DBA/2J female by C57BL/6J male). These hybrids were generated in our colony from animals obtained from the Jackson Laboratory.
Visual system mutants. Several strains that we studied carry mutations that affect the visual system. Nine strains [C3H/HeJ, CD-1, PL/J, BXD24, and five of the BXH strains (BXH 3, 4, 7, 9, and 14)] carry the retinal degeneration allele rd1 at Pde6b, the phosphodiesterase 6B rod receptor β polypeptide gene (Chr 5 at 106 Mb). These strains lose rod photoreceptors by 3 weeks of age (Ogilvie et al., 1997). BXD24 is an inbred strain derived from nonmutant parental stock (C57BL/6J and DBA/2J), but this strain also has complete photoreceptor degenerations documented first in 1994 (R. W. Williams, D. S. Rice, and D. Goldowitz, personal communication) and verified histologically in recent samples. All of these strains with retinal degeneration have normal optic nerves, and several even have high ganglion cell populations (Williams et al., 1996, 1998). Four of the strains (A/J, AKR/J, BALB/cByJ, and CD-1) are albinos and have a reduced proportion of RGCs with uncrossed projections (Rice et al., 1995).
Fixation and processing of tissue
Sectioned brains were all part of the Mouse Brain Library (www.mbl.org). Mice were anesthetized with an injection of Avertin (1.25% 2,2,2-tribromoethanol and 0.8% tert-pentyl alcohol in water; 0.5-1 ml, i.p.) and perfused transcardially with 0.9% saline, followed by fixative (1.25% glutaraldehyde and 1.0% paraformaldehyde in 0.1 m phosphate buffer) using a peristaltic pump. The head was removed and placed in fixative overnight at 4°C. The brain was then removed from the skull and placed in fixative until celloidin embedding. After embedding in celloidin (Rosen and Williams, 2001), the brains were sectioned either horizontally or coronally. One in 10 series of sections were mounted on single slides (4 series per brain). All sections were stained with cresyl violet and averaged 30 μm thick.
Estimation of LGN volume
The area of the dorsal LGN was measured with a video overlay system at intervals of 150 μm throughout the entire nucleus. The total volume was calculated by multiplying the area of LGN by section thickness. In coronal sections, the LGN was counted in a total of six to eight sections per brain, whereas in horizontal sections the LGN was counted in three to five sections per brain.
Estimation of cell numbers
Direct estimates of neurons, glial cells (primarily astrocytes), and endothelial cells were obtained from 268 mice. Estimates of LGN cell numbers were obtained from both sides as independent samples. An average of left and right sides was computed and used for all subsequent calculations. Estimates are based on samples taken from 7 to 10 systematic randomly selected sites within each LGN. For a subset of 40 cases with initial coefficients of error of cell density >15%, we performed completely independent recounts to obtain more accurate and reliable estimates.
Stereological methods
Cells in the LGN were counted using a computer-assisted, three-dimensional counting protocol introduced by Williams and Rakic (1988a). This method is essentially a computationally efficient variant of the optic disector (Williams et al., 2003). The z-axis focal plane was monitored using a Heidenhain MT25 length gauge that tracked vertical stage movement with 0.1 μm resolution. Live video from this microscope was fed to a computer with a contrast-enhanced video-overlay system. A 32 × 33 × 30 μm counting box (xyz) was superimposed on the live video. Nuclei of cells were counted using standard counting rules (Williams and Rakic, 1988b). However, in this study, we did not use a z-axis buffer. The full thickness of the section was counted, alternating the exclusion surface of the counting box from top to bottom of the section. This adaptation avoids the problem of differential z-axis shrinkage recently highlighted by von Bartheld and colleagues (Hatton and von Bartheld, 1999; von Bartheld, 1999, 2001).
Recognition of neurons
Counts were performed at a final video magnification of 2500× using a 100× oil immersion objective and video-enhanced differential interference contrast optics (Inoué, 1986; Williams and Rakic, 1988b). The distinction between neurons and the non-neuronal population is based on well established criteria (Ling et al., 1973; Satorre et al., 1986; Williams and Rakic, 1988a). During the counting procedure, we categorized neurons as either large projection neurons or smaller interneurons. However, this distinction is difficult to make, and to improve the standard error of neuron counts, we ultimately combined the two populations. Neuron numbers given in Results are sums of projection neurons and interneurons. We have posted several high-resolution through-focus series movies at www.mbl.org/mbl_main/mbl_movies.html in which the different cell populations have been marked using our standard criteria (Fig. 1).
Figure 1.

Through-focus series of a standard counting box (33 × 32 μm). The four planes of section are separated by ∼2 μm. N, Projection neurons; G, glial cells; E, endothelial cells; I, interneurons (see www.mbl.org/mbl_main/mbl_movies.html).
Accuracy of counting
The outline of each cell nucleus was traced on the monitor using a digitizing tablet as an input and marking device. Because cells were marked and measured on the monitor, errors of omission and commission were usually easily detected and corrected. To quantitatively assess reliability, a total of 35 cases were counted by two observers. Methods and criteria for differentiating among cell type differ among individuals (Gabbot et al., 1986). Cell type identity can often be verified (or refuted) using immunocytochemical methods. To test our criteria for counting Nissl-stained sections, we performed a parallel immunocytochemical analysis of labeled and unlabeled populations of cells in two key strains of mice (C57BL/6J and DBA/2J) in a total of six cases. Sections were stained with anti-GFAP antibody to label the astrocytes and with neuronal nuclear antigen (NeuN) to label neurons (Fig. 2). Brains were sectioned at 15 μm using a cryostat, and the number of immunopositive cells was estimated using three-dimensional counting procedures as described above.
Figure 2.
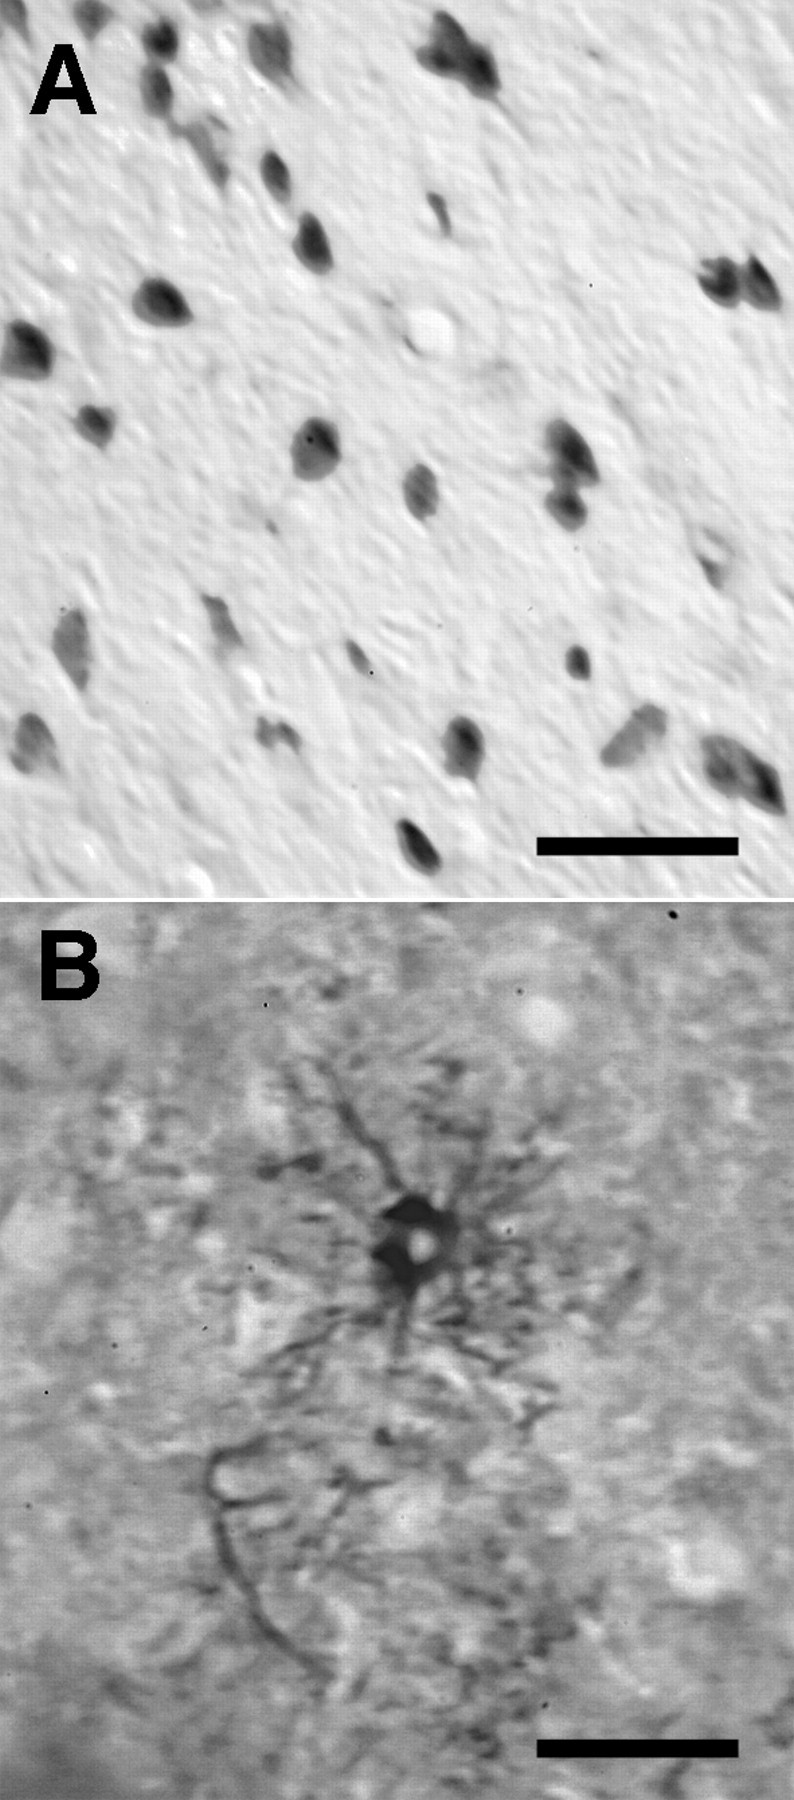
Immunocytochemical staining of major LGN cell classes to validate counting criteria. A, Neurons stained using anti-NeuN. B, Astrocyte in the central LGN heavily stained for GFAP. GFAP staining is generally weak in the LGN (see Materials and Methods). Scale bars: A, 50 μm; B, 20 μm.
GFAP staining. Sections were incubated with GFAP polyclonal antibody (Shandon Inc., Pittsburgh, PA) and normal goat serum from a Vectastain ABC kit (Vector Laboratories, Burlingame, CA) overnight at room temperature (RT). Sections were incubated in a secondary anti-rabbit IgG biotinylated antibody for 30 min at RT and then in an avidin biotinylated horseradish peroxidase complex for 30 min at RT. Incubated sections were then stained with the chromogen diaminobenzidine tetrahydrochloride. There is almost no GFAP immunoreactivity in the normal LGN, although staining in the hippocampus and some neighboring thalamic nuclei is intense (Fig. 2). Astrocytes within the LGN of rodents are known to express low levels of GFAP antigen unless expression is induced by injury or disease (Agarwala and Kalil, 1998; Muessel et al., 2000).
NeuN staining. Sections were incubated in mouse anti-NeuN monoclonal antibody (Chemicon, Ternecula, CA) overnight at RT. Sections were incubated in a secondary biotinylated anti-mouse IgG antibody for 2 hr at RT and processed as above for GFAP.
Sampling procedure. The number of cases in each strain ranged from 2 to 11. We corrected the SD for bias caused by small sample size as described in Williams et al. (1996). The SD and its derivatives such as mean SE, coefficient of error, and the coefficient of variation have been corrected using the equation and tables of Gurland and Tripathi (1971). Procedural details and original data on retinal ganglion cell numbers, hippocampus granular cell numbers, and olfactory bulb weights were described by Williams et al. (1996), Lu et al. (2001), and Williams et al. (2001), respectively.
RGC counts. The major aim of this study was to compare cell populations in the LGN with those in the retina. We have relied heavily on an existing data set of the RGC populations in mice in which RGC number was estimated from counts of optic nerve axons (Williams et al., 1996, 1998) (data are available online at www.nervenet.org/QTL/StrainMeans.html). Counting axons in a single cross-section of the optic nerve provides an unbiased census of the entire population of retinal ganglion cells (Chalupa et al., 1984; Williams et al., 1986; Rice et al., 1995). In the present study, we have also extended the size of our database on ganglion cell population size and have counted 44 additional cases including strains BXD33 through BXD42 and one B6D2F1. The electron microscopic sampling and counting protocols are described by Williams et al. (1996, 1998). An average of five cases were counted for strains BXD33, 34, 35, 36, 38, 39, 40, and 42. We have matched RGC and LGN counts for 63 individual cases, but most analyses are based on comparisons of isogenic strain means.
Analysis of optic nerve axon size. Electron micrographs of cross-sections through the optic nerve were acquired using protocols describe in detail by Williams et al. (1996). Original negatives were digitized with a 16 megapixel CCD camera (H20; Phase One, Inc). The axon perimeter (myelin excluded) was traced and analyzed using ObjectImage, a variant of NIH Image that supports basic morphometry. Perimeter and area estimates were exported to Data Desk (DataDescription, Inc.) for analysis.
Data availability. Main data tables are available at ftp://atlas.utmem.edu/public/LGN. Files are either in text, Microsoft Excel, or DataDesk 6.0 format. Other files, including images and raw counts, are available by TCP/IP using FileMaker Pro 5 or higher at atlas.utmem.edu using the password “read.” All images and the resulting statistical analyses of fiber size are available at http://www.mbl.org/mbl_main/micrographs.php.
Statistical analysis
Data were analyzed with ANOVA, multiple regression, and Pearson product-moment correlations. A comparison of correlations was performed with the Fisher Z test.
Results
Data on populations of cells in the LGN and corresponding data on RGCs were analyzed at two levels: individual values and strain averages. The complete data set consists of 536 LGN counts from 268 individual mice that were then used to compute average cell populations for 58 isogenic lines of mice. We have data on the RGC population for 56 of these lines. Finally, we have matched RGC and LGN data for 63 individual mice. Results for individual and strain analyses are concordant.
Reliability and validity of cell counts
We assessed the consistency and validity of our cell-counting criteria by comparing counts from celloidin-embedded Nissl-stained tissue with those from NeuN-stained tissue. Six animals belonging to two key strains (C57BL/6J and DBA/2J) were stained with NeuN, an antibody that selectively labels neurons. Counts of the NeuN-positive cells were corrected for differences in tissue shrinkage. The differences in neuron density between these two methods are insignificant (C57BL/6J: t = 1.7, p > 0.10, n = 3; DBA/2J: t = 1.6, p > 0.10, n = 3).
Right and left sides of the LGN do not differ systematically or significantly in neuron number. The difference between the right and left sides is probably best considered a gauge of technical error. The mean coefficient of variation of right versus left counts is ∼8% [a Gurland and Tripathi (1971) correction of 1.25 was applied]. The correlation of cases that were counted by two observers is ∼0.72 (n = 35 two-sided counts). We typically studied five cases per strain, thereby reducing the sampling error significantly, and key values (neuron number, glial cell number, RGC number) have coefficients of error (SE/mean) of <8%.
Distribution of cell populations
The grand mean cell population in the LGN for all mice is 38,800 ± 400 SE (n = 268). This count includes all neurons (projection and interneurons), glial cells, and endothelial cells. It is, therefore, a robust estimate that is insensitive to counting criteria. Individual values ranged almost threefold, from a low of 23,000 to a high of 61,000! Overall, ∼40-45% of all cells in the LGN are neurons (9,000-27, 000; 16,800 ± 200 SE), whereas ∼30-35% are glial cells (7,000-26,000; 12,400 ± 200 SE). Endothelial cells associated with the vascular supply to this nucleus make up the remaining 25% of the population (3,000-21,000; 9,500 ± 200 SE). Across our sample, all cell populations have a distribution that is close to normal but with a slight rightward skew.
When grouped by strain, the mean number of cells in the LGN is 39,000 ± 600 SE. As expected, the strain means have a lower range of variation than the individual values, extending from a low of 27,000 to a high of 51,000 (Table 1). The distribution of these averages is also approximately normal in the BXD recombinant inbred set but may be multimodal in the case of nine common inbred strains (Fig. 3). In comparison, the distribution of RGCs across a wide variety of both BXD and common inbred strains is distinctly bimodal (Williams et al., 1996) (replotted in Fig. 3).
Figure 3.

Probability densities of neuron populations in the LGN and RGC layer. A, Probability density for nine standard laboratory strains (A/J, AKR/J, BALB/cByJ, C3H/HeJ, C57BL/6J, CE/J, DBA/2J, LP/J, and PL/J). The y-axis represents the probability density. The RGC distribution (finer line) has two distinct modes, whereas that of LGN neurons is only weakly bimodal. B, The probability density of neurons for 32 BXD recombinant inbred strains is unimodal, whereas that of RGCs is again distinctly bimodal or multimodal. Methods of constructing probability density plots (they are essentially histograms that account for differences in the standard mean errors of each strain) are described by Williams et al. (1996).
The effect of sex, age, plane of section, brain weight, and body weight on cell populations in the LGN
The size of cell populations in the LGN may be modulated by important variables such as sex, age, body weight, and, of course, brain weight. We used multiple linear regression to assess the contributions that these variables make to the variability in neuron and glial cell numbers. The total population of cells (neurons, glia, and endothelial cells) was regressed against sex, age, brain weight, body weight, and plane of section. We had complete data on all these traits for 261 of 268 subjects. Collectively, this set of five predictors accounts for ∼11% of the variation in total cell number and total neuron number. Body weight, sex, and plane of section are not important or significant predictors, and these variables can be dropped without loss of predictive power (10 vs 11%). In contrast, age and brain weight are important predictors. Age has a significant negative regression coefficient that amounts to a loss of 9-16 neurons per day (p < 0.002). However, glial cells seem to be unaffected by age with a coefficient that is very close to zero; that is to say, no glial cell loss or gain.
Brain weight significantly predicted all measures (p < 0.001; Table 2). For each milligram increase in brain weight, the total cell number increases by ∼50 cells:20 neurons, 15 glia, and 15 endothelial cells. These three estimates have errors of plus or minus five cells. We computed residual cell numbers (differences between predicted and observed numbers of cells) from this multiple regression and used these numbers in several subsequent comparisons. By using these residuals, we are able to factor out the effects of the five independent variables on cell population parameters and are left with differences that are unrelated to age and brain weight.
Table 2.
Multiple regression analysis for each of the LGN cell measures against five independent variables
|
Multiple regression |
Neuron |
Glia |
Endothelial |
All cells |
|---|---|---|---|---|
| R2 | 0.13 | 0.04 | 0.08 | 0.12 |
| F(5,257) | 7.40*** | 2.32* | 4.51*** | 7.55*** |
| Effects (F(1,257)) | ||||
| Plane of section | <1 | <1 | <1 | <1 |
| Age | 11.60*** | <1 | 3.14 | 7.09** |
| Sex | 3.21 | <1 | <1 | <1 |
| Brain weight | 15.48*** | 7.62** | 14.69*** | 23.08*** |
| Body weight
|
1.50
|
<1
|
3.46
|
2.06
|
*p < 0.05; **p < 0.01; ***p <0.001.
Strain effects
There is wide variation in cell populations among strains (Table 1) that is attributable primarily to underlying genetic differences as well as residual technical error and nongenetic variation. We performed a series of ANOVAs with strain as the independent measure while controlling for extraneous variables as described above. We found a highly significant effect of strain (p < 0.0001) for all cell types, ranging from F(58,204) = 2.07 for neurons to F(58,204) = 2.78 for glial cells. These results support the hypothesis that variation in LGN cell number has a strong genetic component that is independent of general differences in brain weight or age. The strains with unusually high neuron populations compared with expectation based on brain weight include AKR/J (5200 cells above expectation) and C57BL/6J (3900 above). BXD2 and BXD32 have much lower cell populations than expected (-3500). BXD32 is particularly noteworthy because this strain has an extremely high RGC population, much higher than either AKR/J or C57BL/6J.
Correlations among specific cell populations
Correlation among individual mice. We regressed LGN volume and RGC number against the sex, plane of section, age, body weight, and brain weight as above and correlated the residuals against those for LGN cell number (Table 3). As expected, we observed strong, significant correlations between residual LGN volumes and the total number of cells in the LGN (r = 0.49; p < 0.001). Surprisingly, both glial cell numbers and endothelial cell numbers are both significantly more highly correlated with LGN volume than with neuron number: r = 0.49 for glial cells, r = 0.39 for endothelial cells, and r = 0.24 for neurons (Fisher Z = 2.69 for endothelial vs neuron; Fisher Z = 4.7 for glia vs neuron; p < 0.01) (Table 3).
Table 3.
Correlation matrix (top right) and significance (bottom left) of cell populations (residuals), LGN volume, and RGC numbers among all subjects measured (n = 263, except where noted)
|
|
Neuron |
Glia |
Endothelial |
All |
Volume |
RGC |
|---|---|---|---|---|---|---|
| Neuron | 0.39 | 0.20 | 0.75 | 0.24 | −0.21 | |
| Glia | <0.001 | 0.36 | 0.77 | 0.49 | 0.24 | |
| Endothelial | 0.001 | <0.001 | 0.68 | 0.39 | 0.02 | |
| All cells | <0.001 | <0.001 | <0.001 | 0.49 | 0.02 | |
| LGN volume | <0.001 | <0.001 | <0.001 | <0.001 | 0.21 | |
| RGC (n = 63)
|
NS
|
NS
|
NS
|
NS
|
NS
|
|
We found no correlations at the level of individual mice between RGC number and all LGN cell numbers (r = -0.21; n = 63). However, there is a slight positive correlation between RGC number and glial cell number in the LGN for individuals that almost achieves significance with 63 cases (r = 0.24; p < 0.1). Within the LGN itself, there is a significant correlation between neuron number and glial cell number (r = 0.39; p < 0.001; n = 263) and even endothelial cell number (r = 0.20; p < 0.001; n = 263).
Correlation among strain means. We recomputed correlations using strain means as dependent measures. The most important finding is that despite a reasonably large sample size with good statistical power, and despite a twofold range in both cell populations, we still do not detect any correlation between numbers of neurons in the LGN and numbers of RGCs (Fig. 4). The correlation coefficient is merely 0.01 (Table 4). Surprisingly, there are significant correlations between RGCs and the other key LGN traits. Correlations are high with glial cells (r = 0.33; p < 0.01), endothelial cells (r = 0.31; p < 0.02), and total LGN volume (r = 0.34; p < 0.01) (Fig. 5). In contrast to RGCs (below), there are distinct genetic and developmental interactions between neurons in the LGN and both non-neuronal cell populations. The absence of any significant correlation between interconnected retinal and thalamic cell populations demonstrates a remarkable genetic and developmental independence in numbers of directly connected neurons.
Figure 4.

Absence of a correlation between LGN neuron number and RGC number. The correlation between these populations for the complete data set is merely 0.01 and is not statistically significant. Square symbols, BXD recombinant inbred strains; solid circles, BXH recombinant inbred strains; open circles, wild strains; triangles, standard inbred strains. Curved arrows illustrate which trend line is associated with each group of mice, and the thick dark line represents all strains. Each point is labeled with an abbreviated strain name (see Table 1 for full strain symbols).
Table 4.
Correlation matrix of key cell populations and other significant traits among strain means
|
|
Brain |
Vol |
Neuron |
Glia |
Endo |
RGC |
Nnc1 |
OB |
GR |
|---|---|---|---|---|---|---|---|---|---|
| Brain weight | 0.158 | 0.094 | 0.066 | 0.024 | 0.160 | 0.060 | 0.000 | 0.154 | |
| LGN volume | 0.397 | 0.104 | 0.479 | 0.321 | 0.121 | 0.000 | 0.001 | 0.020 | |
| LGN neuron | 0.307 | 0.322 | 0.191 | 0.097 | 0.000 | 0.016 | 0.017 | 0.021 | |
| LGN glia | 0.257 | 0.692 | 0.437 | 0.354 | 0.108 | 0.041 | 0.019 | 0.000 | |
| LGN endothelial | 0.154 | 0.567 | 0.311 | 0.595 | 0.093 | 0.058 | 0.019 | 0.022 | |
| RGC | 0.400 | 0.348 | 0.010 | 0.329 | 0.305 | 0.504 | 0.003 | 0.001 | |
| Nnc1 locus | 0.245 | 0.005 | −0.127 | 0.203 | 0.241 | 0.710 | 0.008 | 0.001 | |
| Olfactory bulb | 0.001 | −0.026 | 0.129 | 0.137 | −0.130 | −0.056 | −0.087 | 0.097 | |
| Hippocampus GR
|
0.392
|
0.142
|
−0.146
|
0.020
|
0.148
|
−0.036
|
0.031
|
−0.312
|
|
These correlations are derived from the strain averages for all traits (n = 58 for all traits, with the following exceptions: RGC, n = 56; Nnc1, n = 24; Bulb, n = 36; GR, n = 34). Correlations between variables (r) are given below the diagonal; coefficients of determination (R2) are given above the diagonal. Probabilities are < 0.05 for correlations > 0.25 (n = 58) and 0.38 (n = 24). Probabilities are < 0.01 for correlations > 0.32 (n = 58) and 0.49 (n = 24). Data sources: RGCs (Williams et al., 1996, 1998; new data reported here); Nnc1, neuron number control 1 locus on chromosome 11 in BXD (Williams et al., 1998); OB, olfactory bulb weights (Williams et al., 2001); GR, hippocampal granular cell numbers (Lu et al., 2001). Vol, Volume; Endo, endothelial.
Figure 5.

Significant correlation between LGN volume and RGC number. The correlation is highly significant (r = 0.35); other conventions are as in Figure 4.
There is a significant correlation between LGN neuron number and the number of LGN glial cells (r = 0.44; n = 58; p < 0.01). There is also a significant but more modest correlation between the number of LGN neurons and endothelial cells (r = 0.31; p < 0.02). The correlation between endothelial cells and glial cells has the highest correlation (r = 0.60) that we have detected among cell populations in the LGN. Endothelial cells induce astrocyte differentiation because, anatomically and functionally, astrocytes develop simultaneously with brain vasculature and ensheathe capillaries through the brain (Hualyu et al., 2000).
Fiber size spectrum in the mouse optic nerve. A tight correlation between RGCs and neurons in the LGN could, in principle, be obscured by large strain variation in projections of different classes of RGCs to different targets in thalamus and midbrain. In a previous study, we have shown that the decussation ratio is remarkably tightly conserved across pigmented strains of mice (Rice et al., 1995) (all BXD strains are pigmented). However, this does not address possible differences in projections within a hemisphere to LGN and superior colliculus. The size of RGC axons is a good surrogate measure of cell body size and even of ganglion cell subtype (Johnson et al., 1998; Williams and Chalupa, 1983). We, therefore, exploited our large collection of optic nerve electron micrographs (www.mbl.org/mbl_main/micrographs.php) to test for unsuspected differences in relative numbers of small, intermediate, and large ganglion cell axons. The analysis led to a simple conclusion: there are no detectable or consistent differences in the fiber size spectrum of the two key parental strains (C57BL/6J and DBA/2J) that were used to make all of the BXD recombinant inbred strains (Fig. 6). However, the fiber size spectrum of two wild populations of mice (CAST/Ei and PANCEVO/Ei) is shifted toward large sizes relative to standard laboratory strains. Interestingly, these two wild strains have extreme differences in numbers of both ganglion cells and LGN neurons (Fig. 4).
Figure 6.
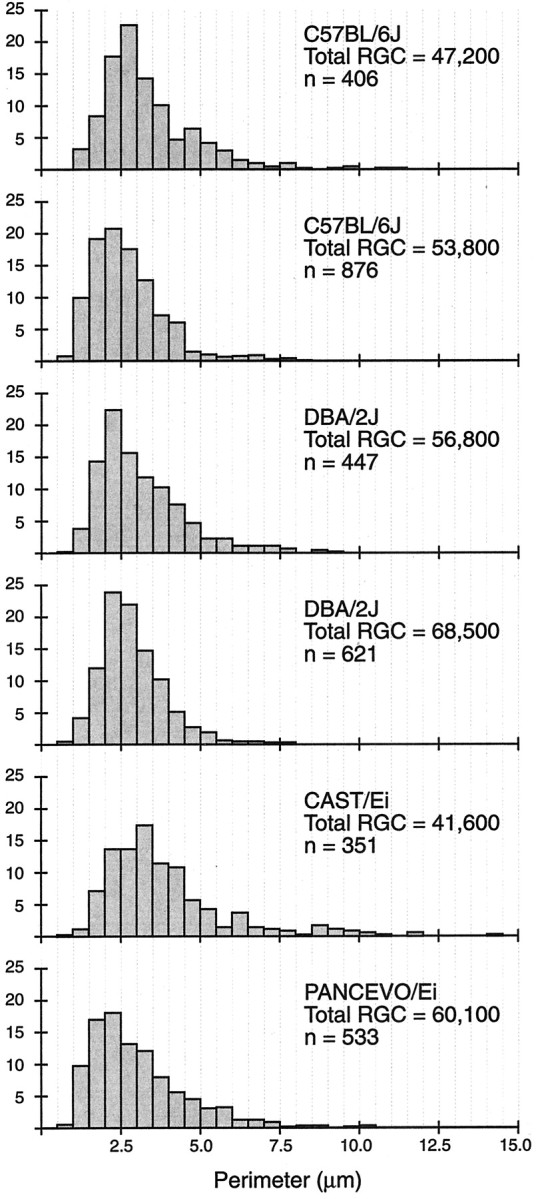
Optic nerve fiber size spectrum in four strains of mice. The x-axis represents axonal perimeters in micrometers, and the y-axis represents the percentage of fibers in each 0.5 μm perimeter range.
Discussion
Synopsis
We have demonstrated approximately twofold differences in neuron number and glial cell number in the mouse LGN, a range that matches that of several other neuronal populations: RGCs, hippocampal granule cells, and striatal neurons (Williams et al., 1996; Lu et al., 2001; Rosen and Williams, 2001). Our survey of LGN populations can now be compared with previous quantitative studies of RGC populations in many of the same strains (Williams et al., 1996, 1998). We provide compelling evidence that these two functionally related neuronal populations, RGCs and LGN neurons, are controlled independently from both statistical and biological perspectives. The correlation between neuron populations is very close to zero, even with a large sample size, bilateral counts, and replicate counts from isogenic lines. This finding supports previous studies of the rhesus macaque primary visual system that also failed to detect correlations between tightly interconnected neuron populations (Spear et al., 1996; Suner and Rakic, 1996). In surprising contrast, the numbers of RGCs do correlate positively and significantly with LGN glial cells.
Technical issues
The data we collected for neuron number in the LGN match results found in other studies. The total number of neurons reported by Heumann and Rabinowicz (1980) in mouse LGN (Swiss strain OF1, IFFA Credo France) is ∼17,000. Surprisingly, the number of projection neurons in rat LGN is purportedly not greater than that in mice (n = 16,000) (Satorre et al., 1986). This may not be so surprising when one considers that macaques and humans also have almost precisely the same range of LGN neurons (Williams and Rakic, 1988a, Ahmad and Spear, 1993), a finding that Stevens (2001) attributes to global nonlinear mechanisms that scale thalamus and cortex. In addition, comparison of counts derived from Nissl-stained sections with those from specific immunohistochemical stains (NeuN) demonstrates a remarkable similarity, lending additional confidence to the reliability and validity of these numbers.
Numerical matching hypothesis and genetic and epigenetic sources of correlation
The numerical matching hypothesis states that ratios of interconnected cell populations are adjusted during development to achieve numerical balance (Purves, 1988). The idea traces back to the catalytic developmental studies by Hamburger (1993) and subsequent molecular analysis of nerve growth factor (Oppenheim, 2001; Conner et al., 1998). Numerical matching is achieved by the exchange of neurotrophins that modulate cell proliferation or, more commonly, cell death (Burek and Oppenheim, 1996; Pollock et al., 2003). The retinal projection to the LGN has been a preeminent system used to explore these types of interactions because both RGCs and LGN neurons experience substantial cell death during normal development (Williams and Herrup, 1988). Across a broader range of systems, there is compelling evidence for this hypothesis (Tanaka and Landmesser, 1986; Herrup and Sunter, 1987; Lanser and Fallon, 1987) and much more limited evidence against it (Spear et al., 1996; Suner and Rakic, 1996; Mooney and Miller, 1999).
Strong support for the numerical matching hypothesis has involved experimental manipulations of interconnected populations during development (Tanaka and Landmesser, 1986; Herrup and Sunter, 1987). For example, Herrup and Sunter (1987) examined matching between granule cells and their Purkinje cell targets in chimeras made from mutant and wild-type mice. Similarly, Tanaka and Landmesser (1986) used chick-quail chimeras to examine myotube and motor neuron numbers. Many experiments have perturbed the relationships between RGCs and their central targets. In a majority of cases, the result has been a strong affirmation of coupling between source and target cell populations (Caleo et al., 2003). However, these experiments do not test whether balance is crucial in normal development. Even in the well studied motor system, it is not yet known whether ratios of cells begin with a high variation and then converge toward a species-specific norm. Thus, although the experimental evidence is almost incontrovertible, it is still unknown whether numerical balance is actually prominent at the level of normal individuals within a species (Williams and Herrup, 1988; Williams and Moody, 2003). Results can be read either way. In studies of wild-type mice, Herrup et al. (1996) found no numerical matching between inferior olivary neurons and Purkinje cells, whereas Wetts and Herrup (1983) and Vogel et al. (1989) found numerical matching between numbers of Purkinje and cerebellar granular cells.
In the present study, we have exploited isogenic lines of mice already known to harbor a remarkable twofold variation in RGC number. This range exceeds that which can be achieved even by radical experiments, such as unilateral enucleation and the blockade of all activity in RGCs (Heumann and Rabinowicz, 1980; Rakic and Riley, 1983; Chalupa et al., 1984; Scheetz et al., 1995). By using normal, but highly divergent, lines of mice as a form of natural manipulation, we can achieve range of variation without disruption of developmental mechanisms. Under these conditions, a strong correlation between interconnected cell populations would provide strong support for the numerical matching hypothesis.
The complexity of retinal projections
RGCs in mice and other mammals project to numerous central targets, including the suprachiasmatic nucleus, accessory optic nuclei, pretectal nuclei, superior colliculus, ventral LGN, and dorsal LGN (Rodieck, 1979). In C57BL/6J mice, ∼70% of ganglion cells project to the LGN as well as the superior colliculus (Drager and Olsen, 1980; Hofbauer and Drager, 1985). This leaves open the possibility that a positive correlation between geniculate neurons and a specific subpopulation of RGCs is masked or degraded by strain variability and heterogeneity of retinal projections. However, we are swayed against this argument for several reasons. First, we are able to detect a significant positive correlation between numbers of RGCs and glial cells in the LGN. The RGC-to-glial cell correlation is 0.33 (Table 4) and reaches a p value of <0.01. This observation is difficult to reconcile with large strain differences in the projections to different nuclei that obscure an RGC-to-neuron correlation. Instead, this finding indicates that RGCs are able to weakly modulate the proliferation or survival of glial cells in their target. Apparently, the earlier generated LGN neurons cannot be influenced effectively by RGC axons (cf. Williams and Rakic, 1988a). Second, we see no differences in the size spectrum of axons in the optic nerves of C57BL/6J and DBA/2J strains (Fig. 6) that might be expected if there were large differences in the distribution of retinal projections. We previously backfilled RGCs with horseradish peroxidase in a large number of mouse strains (Rice et al., 1995), and, with the obvious exception of the decussation abnormalities in albinos, we have not noted any prominent differences in cell size distribution. Third, our finding in mice supports the conclusion of Spear et al. (1996) in rhesus macaques. They also failed to detect any correlation between these tightly connected neuron populations. One might argue that relaxed selection on visual system performance in mice might decouple trophic interactions, but this argument would not apply to diurnal primates.
Shared genetic modulation of traits, gene pleiotropy, can produce strong positive or negative correlations even in the absence of functional neuroanatomic connections. For example, cerebellar weight and granule cell number in the hippocampus are positively correlated (r = 0.33; p < 0.05; df = 30) (Lu et al., 2001; Airey et al., 2001). Such a correlation between two distant and unrelated parts of the brain is likely to be generated by shared expression of genes in granule cell-rich regions (Yang et al., 1999). This illustrates that positive correlations can be detected easily in some instances, even in the absence of a plausible mechanistic explanations. This is precisely why experimental manipulations are critical in many instances. However, in our study and in the preceding studies by Spear et al. (1996) and Suner and Rakic (1996), we have not been able to detect any correlation between tightly interconnected cell populations in the primary visual system. The problem of low power inherent in a study of primates can be readily surmounted using large numbers of isogenic mice.
When we started this study, we anticipated that the increase in sample size and the ability to reduce sampling error by counting many genetically identical individuals would allow us to uncover a significant positive correlation between RGCs and LGN neurons. We have been surprised. In normal mice, the range of variation between the connected populations varies almost twofold, and the cell populations are interconnected from early stages of development, a week before birth (embryonic day 13) and a week before the first major wave of cell death in retina (Linden and Pinto, 1985). This is an ideal developmental context in which to detect concrete evidence that numerical matching contributes to balance of populations in normal unperturbed systems. We have a relatively strong negative result. We can state, with some confidence, that the retina and LGN of mouse, and probably even primates, develop independently of each other at the level of cell populations. Radical perturbations, such as partial or complete deafferentation, push the system out of its natural limits and reveal what one might call an “emergency” numerical matching system. Of course, there may be much finer grained adjustments that occur at the synaptic level and would be dependent on cell-cell interactions, perhaps in an experience-dependent manner. This fine-grained reinterpretation of the numerical matching hypothesis would argue that balance is at the synaptic level.
Neuron/glial cell ratio control
We found a significant correlation between neuron number and glial cell number within the LGN that could reflect tight coupling between neurons and glia in the developing brain (r = 0.44) (Fig. 7). An increase in the number of one cell type (neurons) stimulates the development of other cells types (glial and endothelial cells) within the LGN. Alternatively, it may reflect a tight coupling at earlier stages of development when fates of LGN neuronal and glial progenitor cells are determined. There is evidence in the literature to support the former hypothesis. RGC axons stimulate the proliferation of astrocytes in developing rodent optic nerve via sonic hedgehog signaling (Wallace and Raff, 1999). A similar study shows that glial cells increase proportionally with increased numbers of axons within the optic nerve of transgenic mice (Burne et al., 1996).
Figure 7.

Significant correlation (r = 0.44) between LGN neuron number and LGN glial cell number for strains; other conventions are as in Figure 5.
Are the positive correlations between LGN neurons and glia attributable to cell-cell interactions or to shared genetic patterns of gene expression that do not depend on a functional connection? A systematic analysis of several distinct thalamic nuclei would be revealing. If correlations are generated by close physical relationships [a local trophic hypothesis (Araque et al., 2001)], then neuron:glial correlations within the LGN should be significantly higher that those between LGN neurons and glial cells in other thalamic nuclei such as the ventral posterolateral nucleus or mediodorsalis nucleus. This type of study is a natural extension of our work. Blinkov and Ponomarev (1965) reported that the distribution of glial cells is comparatively uniform throughout the brains of humans and other species, but this issue should be revisited with better techniques and larger sample sizes. Analyses of the demographics of cell populations in the brain will require extraordinary effort (see www.mbl.org) and are likely to be delayed until counts can be automated.
We detect a significant correlation between glial cell numbers and LGN volume (r = 0.69). In contrast, neuron numbers and LGN volume are much more weakly correlated (r = 0.32). This is a revealing and somewhat surprising finding. We cannot discount the possibility that glial cells and even endothelial cell may be better gauges of total bioenergetic and computational efforts of a region than neuron number. Perhaps the best gauge will be the total number of synapses in a region, and it would be worth exploiting the remarkable strain differences in mice to examine the ultrastructural correlates of differences in volume.
Footnotes
This work was supported by the National Eye Institute (Grants R01 EY12991 and P30 EY013080), the National Institute of Neurological Disorders and Stroke (Grant R01 NS35485), and as part of the Informatics Center for Mouse Neurogenetics, a Human Brain Project/Neuroinformatics program funded jointly by the National Institute of Mental Health, the National Institute on Drug Abuse, and the National Science Foundation (Grant P20-MH 62009). We thank Diane Hall, Evan G. Williams, and Toppy Malasri for assistance with the stereological analysis of the LGN and the analysis of optic nerve fiber size.
Correspondence should be addressed to Dr. Robert W. Williams, Department of Anatomy and Neurobiology, University of Tennessee Health Science Center, 855 Monroe Avenue, Memphis, TN 38163. E-mail: rwilliam@nb.utmem.edu.
Copyright © 2003 Society for Neuroscience 0270-6474/03/2311178-11$15.00/0
References
- Agarwala S, Kalil RE ( 1998) Axotomy-induced neuronal death and reactive astrogliosis in the lateral geniculate nucleus following a lesion of the visual cortex in the rat. J Comp Neurol 392: 252-263. [DOI] [PubMed] [Google Scholar]
- Ahmad A, Spear PD ( 1993) Effects of aging on the size, density, and number of rhesus monkey lateral geniculate neurons. J Comp Neurol 334: 631-643. [DOI] [PubMed] [Google Scholar]
- Airey DC, Lu L, Williams RW ( 2001) Genetic control of the mouse cerebellum: identification of quantitative trait loci modulating size and architecture. J Neurosci 21: 5099-5109. [DOI] [PMC free article] [PubMed] [Google Scholar]
- Araque A, Carmignoto G, Haydon PG ( 2001) Dynamic signaling between astrocytes and neurons. Annu Rev Physiol 63: 795-813. [DOI] [PubMed] [Google Scholar]
- Bailey DW ( 1981) Strategic uses of recombinant inbred and congenic strains in behavior genetics research. In: Genetic research strategies for psychobiology and psychiatry. (Gershon ES, Matthysse S, Breakefield XO, Ciaranello ED, eds), pp 189-198. New York: Plenum.
- Bennett MR, Gibson WG, Lemon G ( 2002) Neuronal cell death, nerve growth factor and neurotrophic models: 50 years on. Auton Neurosci 95: 1-23. [DOI] [PubMed] [Google Scholar]
- Blinkov SM, Ponomarev VS ( 1965) Quantitative determinations of neurons and glial cells in the nuclei of the facial and vestibular nerves in man, monkey and dog. J Comp Neurol 125: 295-302. [DOI] [PubMed] [Google Scholar]
- Bonhomme F ( 1992) Genetic diversity and evolution in the genus Mus In: Techniques for the genetic analysis of brain and behavior (Goldowitz D, Wahlsten D, Wimer RE, eds), pp 41-56. Amsterdam: Elsevier.
- Burek MJ, Oppenheim RW ( 1996) Programmed cell death in the developing nervous system. Brain Pathol 6: 427-446. [DOI] [PubMed] [Google Scholar]
- Burne JF, Staple JK, Raff MC ( 1996) Glial cells are increased proportionally in transgenic optic nerves with increased numbers of axons. J Neurosci 16: 2064-2073. [DOI] [PMC free article] [PubMed] [Google Scholar]
- Caleo M, Medini P, von Bartheld D, Maffei L ( 2003) Provision of brain-derived neurotrophic factor via anterograde transport from the eye preserves the physiological responses of axotomized geniculate neurons. J Neurosci 23: 287-296. [DOI] [PMC free article] [PubMed] [Google Scholar]
- Chalupa LM, Williams RW, Henderson Z ( 1984) Binocular interaction in the fetal cat regulates the size of the retinal ganglion cell population. Neuroscience 12: 1039-1046. [DOI] [PubMed] [Google Scholar]
- Conner JM, Lauterborn JC, Gall CM ( 1998) Anterograde transport of neurotrophin proteins in the CNS—a reassessment of the neurotrophic hypothesis. Rev Neurosci 9: 91-103. [DOI] [PubMed] [Google Scholar]
- Davies AM ( 1996) The neurotrophic hypothesis: where does it stand? Philos Trans R Soc Lond B Biol Sci 351: 389-394. [DOI] [PubMed] [Google Scholar]
- Drager UC, Olsen JF ( 1980) Origins of crossed and uncrossed retinal projections in pigmented and albino mice. J Comp Neurol 191: 383-412. [DOI] [PubMed] [Google Scholar]
- Gabbott PL, Somogyl J, Stewart MG, Hamori J ( 1986) A quantitative investigation of the neuronal composition of the rat dorsal lateral geniculate nucleus using GABA-immunocytochemistry. Neuroscience 19: 101-111. [DOI] [PubMed] [Google Scholar]
- Gurland J, Tripathi RC ( 1971) A simple approximation for unbiased estimation of the standard deviation. Am Stat 25: 30-32. [Google Scholar]
- Hamburger V ( 1993) The history of the discovery of the nerve growth factor. J Neurobiol 24: 893-897. [DOI] [PubMed] [Google Scholar]
- Hatton WJ, von Bartheld CS ( 1999) Analysis of cell death in the trochlear nucleus of chick embryos: calibration of the optical dissector counting technique reveals systematic bias. J Comp Neurol 409: 169-186. [PubMed] [Google Scholar]
- Hauschka TS, Mirand EA ( 1973) The breeder: Ha(ICR) Swiss mouse, a multipurpose stock selected for fecundity. In: Perspectives in cancer research and treatment (Murphy GP ed), pp 319-331. New York: Liss.
- Herrup K, Sunter K ( 1987) Numerical matching during cerebellar development: quantitative analysis of granule cell death in staggerer mouse chimeras. J Neurosci 7: 829-836. [DOI] [PMC free article] [PubMed] [Google Scholar]
- Herrup K, Shojaeian-Zanjani H, Panzini L, Sunter K, Mariani J ( 1996) The numerical matching of source and target populations in the CNS: the inferior olive to Purkinje cell population. Brain Res Dev Brain Res 96: 28-35. [DOI] [PubMed] [Google Scholar]
- Heumann D, Rabinowicz T ( 1980) Postnatal development of the dorsal lateral geniculate nucleus in normal and enucleated albino mouse. Exp Brain Res 38: 75-85. [DOI] [PubMed] [Google Scholar]
- Hofbauer A, Drager UC ( 1985) Depth segregation of retinal ganglion cells projecting to mouse superior colliculus. J Comp Neurol 234: 465-474. [DOI] [PubMed] [Google Scholar]
- Hualyu MI, Haeberle H, Barres BA ( 2000) Induction of astrocyte differentiation by endothelial cells. J Neurosci 21: 1538-1547. [DOI] [PMC free article] [PubMed] [Google Scholar]
- Inoué S ( 1986) Video microscopy. New York: Plenum.
- Johnson PT, Geller SF, Reese BE ( 1998) Distribution, size and number of axons in the optic pathway of ground squirrels. Exp Brain Res 118: 93-104. [DOI] [PubMed] [Google Scholar]
- Lanser ME, Fallon JF ( 1987) Development of the brachial lateral motor column in the wingless mutant chick embryo: motoneuron survival under varying degrees of peripheral load. J Comp Neurol 261: 423-434. [DOI] [PubMed] [Google Scholar]
- Linden R, Pinto LH ( 1985) Developmental genetics of the retina: evidence that the pearl mutation in the mouse affects the time course of natural cell death in the ganglion cell layer. Exp Brain Res 60: 79-86. [DOI] [PubMed] [Google Scholar]
- Ling EA, Paterson JA, Privat A, Mori S, Leblond CP ( 1973) Investigation of glial cells in semithin sections. I. Identification of glial cells in the brains of young rats. J Comp Neurol 149: 43-71. [DOI] [PubMed] [Google Scholar]
- Lu L, Airey DC, Williams RW ( 2001) Complex trait analysis of the hippocampus: mapping and biometric analysis of two novel gene loci with specific effects on hippocampal structure in mice. J Neurosci 21: 3503-3514. [DOI] [PMC free article] [PubMed] [Google Scholar]
- Miller MW ( 1987) Effect of prenatal exposure to ethanol on the distribution and time of origin of corticospinal neurons in the rat. J Comp Neurol 257: 372-382. [DOI] [PubMed] [Google Scholar]
- Miller MW, Astley SJ, Clarren SK ( 1999) Number of axons in the corpus callosum of the mature Macaca nemestrina: increases caused by prenatal exposure to ethanol. J Comp Neurol 412: 123-131. [PubMed] [Google Scholar]
- Mooney SM, Miller MW ( 1999) Effects of prenatal exposure to ethanol on systems matching: the number of neurons in the ventrobasal thalamic nucleus of the mature rat. Brain Res Dev Brain Res 117: 121-125. [DOI] [PubMed] [Google Scholar]
- Muessel MJ, Berjman NE, Klein RM ( 2000) Early and specific expression of monocyte chemoattractant protein-1 in the thalamus induced by cortical injury. Brain Res 870: 211-221. [DOI] [PubMed] [Google Scholar]
- Ogilvie JM, Tenkova T, Lett JM, Speck J, Landgraf M, Silverman SM ( 1997) Age-related distribution of cones and ON-bipolar cells in the rd mouse retina. Eye Res 16: 244-251. [DOI] [PubMed] [Google Scholar]
- Oppenheim RW ( 2001) Viktor Hamburger (1900-2001). Journey of a neuroembryologist to the end of the millennium and beyond. Neuron 31: 179-190. [DOI] [PubMed] [Google Scholar]
- Pollock GS, Robichon R, Boyd KA, Kerkel KA, Kramer M, Lyles J, Ambalavanar R, Khan A, Kaplan DR, Williams RW, Frost DO ( 2003) TRKB receptor signaling regulates dynamics of developmental retinal ganglion cell death but not final number. J Neurosci 10137-10145. [DOI] [PMC free article] [PubMed]
- Purves D ( 1988) Body and brain. A trophic theory of neural connections. Cambridge, MA: Harvard UP. [DOI] [PubMed]
- Rakic P, Riley KP ( 1983) Regulation of axon number in primate optic nerve by prenatal binocular competition. Nature 305: 135-137. [DOI] [PubMed] [Google Scholar]
- Rice DS, Williams RW, Goldowitz D ( 1995) Genetic control of retinal projections in inbred strains of albino mice. J Comp Neurol 354: 459-469. [DOI] [PubMed] [Google Scholar]
- Rodieck RW ( 1979) Visual pathways. Annu Rev Neurosci 2: 193-225. [DOI] [PubMed] [Google Scholar]
- Rosen GD, Williams RW ( 2001) Complex trait analysis of the mouse striatum: independent QTLs modulate volume and neuron number. BMC Neurosci 2: 5. [DOI] [PMC free article] [PubMed] [Google Scholar]
- Satorre J, Cano J, Reinoso-Suárez F ( 1986) Quantitative cellular changes during postnatal development of the rat dorsal lateral geniculate nucleus. Anat Embryol 174: 321-327. [DOI] [PubMed] [Google Scholar]
- Scheetz AJ, Williams RW, Dubin MW ( 1995) Severity of ganglion cell death during early postnatal development is modulated by both neuronal activity and binocular competition. Vis Neurosci 12: 605-610. [DOI] [PubMed] [Google Scholar]
- Skeen LC, Due BR, Douglas FE ( 1986) Neonatal sensory deprivation reduces tufted cell number in mouse olfactory bulbs. Neurosci Lett 63: 5-10. [DOI] [PubMed] [Google Scholar]
- Spear PD, Kim CB, Ahmed A, Tom BW ( 1996) Relationship between numbers of retinal ganglion cells and lateral geniculate neurons in the rhesus monkey. Vis Neurosci 13: 199-203. [DOI] [PubMed] [Google Scholar]
- Stevens CF ( 2001) An evolutionary scaling law for the primate visual system and its basis in cortical function. Nature 411: 193-195. [DOI] [PubMed] [Google Scholar]
- Suner I, Rakic P ( 1996) Numerical relationship between neurons in the lateral geniculate nucleus and primary visual cortex in macaque monkeys. Vis Neurosci 13: 585-590. [DOI] [PubMed] [Google Scholar]
- Tanaka H, Landmesser LT ( 1986) Cell death of lumbosacral motoneurons in chick, quail and chick-quail chimera embryos: a test of the quantitative matching hypothesis of neuronal cell death. J Neurosci 6: 2889-2899. [DOI] [PMC free article] [PubMed] [Google Scholar]
- Taylor B ( 1989) Recombinant inbred strains. In: Genetic variants and strains of the laboratory mouse (Lyon MF, Searle AG, eds), pp 773-789. New York: Oxford UP.
- Vogel MW, Sunter K, Herrup K ( 1989) Numerical matching between granule and purkinje cells in Lurcher chimeric mice: a hypothesis for the trophic rescue of granule cells from target-related cell death. J Neurosci 9: 3454-3462. [DOI] [PMC free article] [PubMed] [Google Scholar]
- von Bartheld CS ( 1999) Systematic bias in an `unbiased' neuronal counting technique. Anat Rec 257: 119-120. [DOI] [PubMed] [Google Scholar]
- von Bartheld CS ( 2001) Comparison of 2-D and 3-D counting: the need for calibration and common sense. Trends Neurosci 24: 504-506. [DOI] [PubMed] [Google Scholar]
- Wade CM, Kulbokas III EJ, Kirby AW, Zody MC, Mullikin JC, Lander ES, Lindblad-Toh K, Daly MJ ( 2002) The mosaic structure of variation in the laboratory mouse genome. Nature 420: 574-578. [DOI] [PubMed] [Google Scholar]
- Wallace VA, Raff MC ( 1999) A role for sonic hedgehog in axon-to-astrocyte signaling in the rodent optic nerve. Development 126: 2901-2909. [DOI] [PubMed] [Google Scholar]
- Wetts R, Herrup K ( 1983) Direct correlation between Purkinje and granule cell number in the cerebella of lurcher chimeras and wild-type mice. Brain Res Dev Brain Res 10: 41-47. [DOI] [PubMed] [Google Scholar]
- Williams RW, Chalupa LM ( 1983) An analysis of axon caliber within the optic nerve of the cat: evidence of size groupings and regional organization. J Neurosci 3: 1554-1564. [DOI] [PMC free article] [PubMed] [Google Scholar]
- Williams RW, Herrup K ( 1988) The control of neuron number. Annu Rev Neurosci 11: 423-453. [DOI] [PubMed] [Google Scholar]
- Williams RW, Moody SA ( 2003) Developmental and genetic control of cell number in the retina. In: The visual neurosciences (Chalupa LM, Werner JS, eds) pp 65-78. Cambridge, MA: MIT.
- Williams RW, Rakic P ( 1988a) Elimination of neurons from the rhesus monkey's lateral geniculate nucleus during development. J Comp Neurol 272: 424-436. [DOI] [PubMed] [Google Scholar]
- Williams RW, Rakic P ( 1988b) Three-dimensional counting: an accurate and direct method to estimate numbers of cells in sectioned material. J Comp Neurol 278: 344-352. [DOI] [PubMed] [Google Scholar]
- Williams RW, Bastiani MJ, Lia B, Chalupa LM ( 1986) Growth cones, dying axons, and developmental fluctuations in the fiber population of the cat's optic nerve. J Comp Neurol 246: 32-69. [DOI] [PubMed] [Google Scholar]
- Williams RW, Strom RC, Rice DS, Goldowitz D ( 1996) Genetic and environmental control of variation in retinal ganglion cell number in mice. J Neurosci 16: 7193-7205. [DOI] [PMC free article] [PubMed] [Google Scholar]
- Williams RW, Strom RC, Goldowitz D ( 1998) Natural variation in neuron number in mice is linked to a major quantitative trait locus on Chr 11. J Neurosci 18: 138-146. [DOI] [PMC free article] [PubMed] [Google Scholar]
- Williams RW, Airey DC, Kulkarni A, Zhou G, Lu L ( 2001) Genetic dissection of the olfactory bulbs of mice: QTLs on four chromosomes modulate bulb size. Behav Genet 31: 61-77. [DOI] [PubMed] [Google Scholar]
- Williams RW, von Bartheld CS, Rosen GD ( 2003) Counting cells in sectioned material-3D counting, the optical disector, and Abercrombie's two-section comparison method. Curr Protocols Neurosci Unit 1.11. [DOI] [PubMed]
- Yang XW, Wynder C, Doughty ML, Heintz N ( 1999) BAC-mediated gene-dosage analysis reveals a role for Zipro1 (Ru49/Zfp38) in progenitor cell proliferation in cerebellum and skin. Nat Genet 22: 327-335. [DOI] [PubMed] [Google Scholar]