

Abstract
The anatomical structure of the basal ganglia displays topographical organization and massive funneling of neuronal projections toward the globus pallidus as well as an axonal collateral system within this nucleus. This structure suggests the formation of correlations between the spiking activities of pallidal cells. Nevertheless, previous studies of remote neurons in the pallidum have reported uncorrelated spiking activity. These correlation results may be challenged, because remote pallidal neurons may be located in different pallidal territories. To further test the independence of pallidal activity, we studied the spiking activity of neighboring pairs recorded by the same electrodes. A narrow peak dominated the correlations of all pairs of neurons recorded on the same electrode. This type of peak is classically interpreted as a sign of strong common input. However, recent mathematical analysis shows that such peaks may derive from a technical inability to detect overlapping spikes by spike-sorting techniques. A long-term shallow trough in the correlation of neighboring neurons may also result from the same effect, which we have termed the “shadowing effect.” A comparison of the expected shadowing effect with the actual correlations suggests that no real correlations exist between 93.9% of neighboring pallidal pairs. The remaining 6.1% of the pairs display symmetric long-term positive correlations centered on time 0. Thus, functional interactions between neighboring pallidal neurons do not display any significant differences from the interactions between physically remote neurons in this brain area. Moreover, the combination of anatomical data and current physiological results suggests an active decorrelating process performed in the basal ganglia.
Keywords: basal ganglia, cross-correlogram, asynchrony, spike sorting, firing pattern, pallidum, primate
Introduction
The importance of the globus pallidus in both normal function and neurological diseases such as Parkinson's disease has sparked interest in the physiology of this compact structure (Wichmann and DeLong, 1996). The pallidum is one of the nuclei of the basal ganglia and is divided into two parts: the external (GPe) and internal (GPi) segments. Both segments receive their input primarily from the striatum and the subthalamic nucleus and act as major internal (GPe) or output (GPi) stages of the basal ganglia network (Gerfen and Wilson, 1996; Bolam et al., 2000). The pallidum is a relatively small structure, with several orders of magnitude fewer neurons than its input (Percheron et al., 1994) and output (Haber and McFarland, 2001) structures.
The nature of information processing within the basal ganglia is still a matter of debate (Percheron and Filion, 1991; Middleton and Strick, 2000). One view claims that the pallidal neurons receive converging input and therefore share incoming information (Percheron et al., 1994). Another holds that the basal ganglia neurons are divided into segregated parallel pathways (Alexander et al., 1986; Middleton and Strick, 2000). However, although these views present very different relationships between remote neurons in the pallidum, they both agree that there is a drastic decrease in the number of neurons along the corticostriatopallidal pathway. Both hypotheses argue that this convergence causes neighboring neurons to share the same input. This common input should in turn lead to positive state-driven correlations in these neighboring neurons (Perkel et al., 1967).
The main type of neurons in the pallidum is inhibitory, and these neurons have, in addition to their projection to other brain areas, axonal collaterals within the pallidum (Yelnik et al., 1984, 1997; Kita and Kitai, 1994; Bevan et al., 1998; Sato et al., 2000; Parent et al., 2001). Such inhibitory collaterals are expected to generate negative correlations in the spiking activity of neighboring neurons. One of the predominant models of the basal ganglia is the action selection model (Mink, 1996; Berns and Sejnowski, 1998; Wickens and Oorschot, 2000). The action selection model also predicts negative correlations between neurons that arise from competitive inhibition and a selection of a single state.
Our previous studies of simultaneously recorded cells indicated that, in the normal monkey, the activity of pallidal neurons is uncorrelated (Nini et al., 1995; Heimer et al., 2002). These results were presented as supporting the hypothesis of the parallel (vs funneling) organization of the basal ganglia circuitry (Bergman et al., 1998). However, they were limited to remote (500–3000 μm) neurons recorded by different electrodes. The somatotopic organization of basal ganglia neurons (DeLong et al., 1985) suggests that the activity of physically and functionally close units may still be correlated, although the activity of remote units remains uncorrelated. This type of difference in interactions between neighboring and remote neurons has been reported in the cortex (Nowak et al., 1999). To enhance our understanding of synchrony within the pallidum, we studied the cross-correlograms of neighboring neurons recorded by the same electrode for prolonged periods in the primate. The mathematical basis for the analysis of the data has been reported previously (Bar-Gad et al., 2001a,b).
Materials and Methods
Physiological experiments. Two vervet monkeys (monkeys Cu and S; Cer-copithecus aethiops aethiops; both female; weight, 3–3.5 kg) and two cynomolgus monkeys (monkeys Cl and Y; Macaca fascicularis; male and female; weight, 2.5–5 kg) were trained to perform a visuomotor task. After training, a Cilux recording chamber was attached to the skull to allow recording of the activity of pallidal neurons. Details of the task, surgery, and data-recording methods are similar to those given previously (Nini et al., 1995; Heimer et al., 2002). The care of the monkeys and surgical procedures were in accordance with the National Institutes of Health Guide for the Care and Use of Laboratory Animals (1996) and with the Hebrew University guidelines for the use and care of laboratory animals in research, and were supervised by the Institutional Animal Care and Use Committee.
Recording and spike sorting. The electrode output was sorted and classified in real time by a template-matching algorithm (MSD 3.21; Alpha-Omega Engineering, Nazareth, Israel). In addition, the electrode output was also bandpass filtered (monkey Cu, 300–6000 Hz; monkeys S, Cl, and Y, 1–6000 Hz; four pole Butterworth filter; MCP-plus 2.8) and continuously sampled at 24 kHz (AlphaMap 5.0). The continuous sampling of the electrode output was also subjected to an off-line spike-sorting procedure (AlphaSort 3.8) based on principal-component analysis of the spike patterns (Abeles and Goldstein, 1977) (Fig. 1). We applied two sets of principal components (PCs), a default based on cortical recordings (Abeles and Goldstein, 1977) and a set of PCs that were created by a library of 131 waveforms of well isolated pallidal spikes recorded by the same setup. Off-line sorting was performed using both cortical and pallidal PCs, and the best result was taken for each pair. The sorting was verified by the existence of a refractory period in the interspike interval histogram and by the stability of the firing rate of the cells. In the stability analysis, the instantaneous firing rate of the neurons as a function of time was displayed for the entire period of recording, and the largest segment of stable data was selected for additional analysis. All additional analyses of spike timing were conducted using 1 msec bins.
Figure 1.

Spike sorting of spikes from two neurons recorded on a single electrode. An example of off-line analysis of two cells recorded on the same electrode (990513s2e2) is shown. In the single spike examples (bottom), the actual spike shapes are depicted by the colors of the clusters, and principal-component reconstructions are plotted in black. The unidentified signal, composed of a green spike immediately followed (and distorted) by a purple spike, is shown in blue. In addition, the spike shapes of all of the spikes within the polygons are plotted (right).
Data analysis. Cross-correlograms were calculated for all neuron pairs in cases in which both cells satisfied firing rate stability and displayed a clear refractory period. Only pairs that satisfied the inclusion criteria for at least 600 sec were included in the analysis. Autocorrelation and cross-correlation functions were normalized to firing rate (Nini et al., 1995; Heimer et al., 2002), and no smoothing was applied.
A reconstruction of the theoretical cross-correlogram from the recorded autocorrelation functions was performed to differentiate the part in the cross-correlation function resulting from the shadowing effect from the real functional correlations. Cross-correlation reconstruction from the two autocorrelation functions was performed by using the calculated shadowing factor (see below). The autocorrelation functions themselves change in two basic ways because of the shadowing effect: the overall magnitude (mean rate) decreases, because some spikes are not identified, and the specific shape of the autocorrelation function is distorted. Mathematical analysis of the effect indicated that the change in magnitude is significant, whereas the distortion of the specific shape is very small except for extreme cases (Bar-Gad et al., 2001b). Therefore, the autocorrelation functions were compensated (using the same shadowing factor) only for their magnitude. The firing probabilities were calculated from the spike sequences after compensating for the shadowing effect. Full details regarding the reconstruction method have been described previously (Bar-Gad et al., 2001b). The SD of the reconstructed correlation was calculated using the tails (±4000–5000 msec offset) of the correlation, and the confidence limits were situated at p < 0.01.
Results
Autocorrelations and cross-correlations of pallidal neurons
Autocorrelograms and cross-correlograms were calculated for 33 neuronal pairs recorded from the same electrode (resulting from 27 cases of two cells and two cases of three cells). The pairs fulfilled the inclusion criteria (rate stability and refractory period) for 610–5390 sec (mean ± SD, 1785 ± 1137 sec), and the 60 neurons fired 6531–361,280 spikes (mean ± SD, 79,106 ± 65,223 spikes) during that period. Despite the existence of at least two types of neurons in the pallidum (Percheron et al., 1984; Kita and Kitai, 1994; Sato et al., 2000), all of the recordings were presumed to derive from the high-frequency discharge projection neurons on the basis of their irregular firing pattern, nonbursting discharge, and short-duration action potential (DeLong et al., 1985). In most cases (23 of 33), it was not possible to associate with full confidence one or both members of the pair with the internal or external segments of the pallidum. All of the remaining cases (10 of 33) were identified as belonging to the GPe according to structures identified on the trajectory and firing patterns of the electrode, which included prolonged pauses. However, no difference was detected between the correlations of the two groups, and they were pooled in the analyses below. In addition, no differences were found between the correlations of pairs recorded from the vervet monkeys and the pairs recorded from the cynomolgus monkeys, so they too were pooled in the analyses. Finally, the correlations during intertrial intervals were calculated for some of the pairs to rule out any effect attributable to event-related rate variation. No differences were detected between the correlation calculated throughout the entire session and the correlations calculated separately for the trial and intertrial periods.
The shape of the autocorrelation functions of these pallidal cells on short time scales is very stereotypic: a refractory period (4–8 msec), followed by a peak and afterward by a short trough of the same duration (Fig. 2a, insets). The peak and the short trough appear because of the combination of the refractory period and the high firing rate of the neurons in the pallidum and do not reflect bursty properties (Bar-Gad et al., 2001a). The same autocorrelation function shape is seen for neurons recorded alone on an electrode. The cross-correlograms of neighboring cells have a very stereotypic structure as well (Fig. 2). However, these cross-correlograms are very different from the flat cross-correlograms typical of pallidal pairs recorded by different electrodes (Nini et al., 1995; Heimer et al., 2002). The correlation of neighboring neurons has multiple stereotypic phases: a decreased correlation around time 0 followed by an increase to higher than mean correlations on the time scale of the refractory period of the cells. This is followed by a decreased correlation that is lower than the mean and ends at a time equal to twice the refractory period (Fig. 2a). This typical short-term correlation appears in all pallidal pairs recorded from the same electrode.
Figure 2.
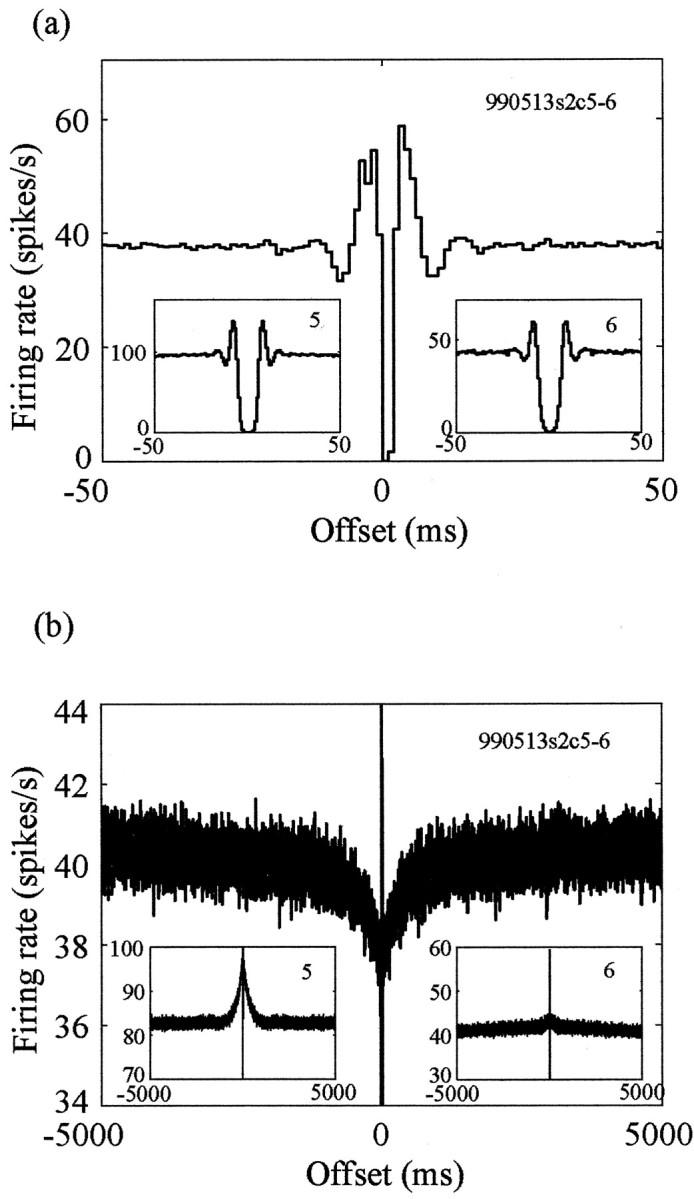
Observed correlation of two pallidal neurons recorded on the same electrode. a, Short-term (±50 msec) cross-correlogram of the two neurons shown in Figure 1 (990513s2c5-6). The insets contain the autocorrelation functions of the two neurons on the same time scale. b, Long-term (±5000 msec) cross-correlogram and autocorrelation functions of the same neurons. The y-axis (conditional firing rate) scale is enlarged, because the long-term phenomenon is relatively small in magnitude.
Examination of the autocorrelation functions of the cells on longer time scales, in the range of hundreds to thousands of milliseconds, reveals a typical peak (Fig. 2b, insets). This peak, which is also visible for neurons recorded alone on an electrode, is caused by the pausing activity of pallidal neurons. However, unlike the cross-correlograms of neurons from different electrodes, which are generally flat in long time offsets (Nini et al., 1995; Heimer et al., 2002), the cross-correlograms of neurons from the same electrode display a stereotypic shallow trough (Fig. 2b). The trough has the same time scale as does the peak in the autocorrelation functions and varies greatly in size depending on the size of the long-term peaks in the autocorrelation functions.
The shadowing effect explains the nonflat correlograms of neighboring pallidal neurons
The cross-correlogram may reflect the autocorrelation functions of the cells making up the pair. This reflection typically appears when there is a functional connection between the neurons (Perkel et al., 1967; Eggermont, 1990). However, the same reflection may arise without any functional connectivity in pairs recorded from the same electrode because of the shadowing effect (Bar-Gad et al., 2001b). This effect is caused by the misidentification of spikes when multiple cells fire at the same time or within a short time difference of each other. The misidentification of the overlapped spikes usually leads to the removal of one or both of the spikes in all sorting methods (Lewicki, 1998) (Fig. 1, blue spike). The removal of the common spikes leads to the narrow trough in the center of the cross-correlogram. The peak after the central trough is caused by the decreased probability for misidentification of spikes. The decreased misidentification of spikes is caused by the fact that the reference cell goes into a refractory period in which it does not fire and therefore does not get mixed with spikes of the trigger cell. The shape of the cross-correlogram inversely reflects the probability of spike misidentification, which is directly related to the probability of firing at different time offsets as expressed by the autocorrelation functions. The complete mathematical formulation has been given previously (Bar-Gad et al., 2001b).
The shape of the original cross-correlogram cannot be directly calculated because of the inherent lack of needed information. Rather, the nature of the original correlations must be estimated using the recorded spike sequences and an estimation of the shadowing effect. The magnitude of the complex shadowing effect can be approximated by the shadowing factor S. The shadowing factor is the total fraction of missing spikes from the cross-correlogram immediately around time 0 (Fig. 3a). This factor is an estimation of the total effect of a spike occurrence on the identification of spikes from other cells within a small time frame. For example, if a spike causes misidentification of 100% of the spikes occurring within the same millisecond and 50% of the spikes occurring with a 1 msec offset before and after it, the shadowing factor would be 2. The shadowing factor will also equal 2 for a 100% misidentification at zero offset and at 1 msec offset after the trigger spike. The shadowing effect is typically asymmetric, because the spikes recorded from one neuron are significantly larger than the ones recorded from the second neuron (for example, see Fig. 1). Nevertheless, the shadowing factor can serve as a first-order approximation, whereas more exact computation requires the specific values of the shadowing effect at various offsets and not only their sum. The magnitude of the shadowing factor is determined by properties of the recording and spike-sorting techniques and by the shapes and sizes of the spikes recorded on the specific electrode. Therefore, the typical shadowing size will differ between recording and sorting schemes (e.g., off-line sorting will have lower shadowing than on-line sorting). However, even within the same recording and sorting scheme, the shadowing factor will vary greatly depending on the specific cells, their spike shape, and the size and noise encountered in the session. Using our off-line sorting methodology for the pallidal recordings, the values of the shadowing factor follow an almost normal distribution around the value of S = 2.49 (Fig. 3b).
Figure 3.

Compensation for the shadowing effect reveals no correlation between pallidal neurons. a, Estimation of the shadowing factor out of the cross-correlogram (pair 990520s1c9-10) by calculating the areas with decreased correlation around time 0. The shaded area is the shadowing factor (i.e., the area used for the estimation of the shadowing effect). b, Histogram of the shadowing factors calculated for all of the pallidal pairs. c, e, Reconstructed cross-correlograms derived from the compensated autocorrelation functions and the estimated shadowing factor (pair 990520s1c9-10) showing the short-term (±50 msec) shape (c) and long-term (±5000 msec) shape (e). d, f, The recorded cross-correlogram (dots) is shown between the confidence (p < 0.01) limits (solid lines) derived from the reconstructed cross-correlogram for the same pair. The short-term (±50 msec) and long-term (±5000 msec) shape of the correlogram and the confidence limits are shown in d and f, respectively. The vertical dotted lines in c and d are the boundaries of the shadowed areas.
The assumption that the original cross-correlogram is flat (i.e., uncorrelated activity) may be verified by performing a shadowing process (i.e., removing temporally close spikes) on synthetic spike trains with an equivalent flat correlation function and comparing the resulting reconstructed function with the recorded cross-correlogram. The reconstructed cross-correlogram may be estimated from the shadowing factor and the autocorrelation functions of the two cells (Bar-Gad et al., 2001b), as follows: c*n,m(t) = [1 - S × an(t)] × [1 - S × am(t)] × [pn/(1 - pn × S)], where c*n,m(t) is the reconstructed cross-correlation at time t, S is the shadowing factor, an(t) and am(t) are the compensated autocorrelation functions at time t, and pn is the mean firing probability of the reference cell. The reconstructed cross-correlogram (an example is shown on two time scales in Fig. 3c,e) is used to create confidence limits for the recorded cross-correlograms. Most of the cross-correlograms (31 of 33) do not show correlated activity exceeding the confidence limits (p < 0.01) during offsets of >5 msec (Fig. 3d,f). Only 6.1% of the pairs (2 of 33) show a symmetric, positively correlated activity on the long time scale.
Discussion
The question of whether the activity of neighboring pallidal neurons is more synchronized than the activity of remote pallidal neurons is of major importance for our understanding of the information processing performed by the basal ganglia. Classical electrophysiological methods enable the extracellular recording of spikes from neighboring neurons by spike sorting of the simultaneous activity of multiple neurons recorded by the same metal electrode (Abeles, 1974; Eggermont, 1990; Lewicki, 1998). The present study presents a comprehensive analysis of 33 pairs of pallidal neurons recorded for prolonged periods by single electrodes and shows that the effects of the methodological limits of spike sorting govern the cross-correlograms of these neurons. Estimation of the artifacts created by the sorting mechanism reveals that the firing patterns of neighboring neurons display the same characteristics as remote neurons within the pallidum, namely uncorrelated firing.
The high firing rate of the pallidal neurons is not common in the brain. This high rate enables identification of some phenomena that are hard to detect in slow firing neurons but also makes it prone to several effects that can distort the perceived firing pattern and correlations of the cells. For example, previous theoretical studies have indicated that the sensitivity of cross-correlation functions to excitation is larger by an order of magnitude than it is for inhibition (Aertsen and Gerstein, 1985). However, this only holds true for brain areas with low firing rates, such as the cortex, whereas the sensitivity of cross-correlograms is symmetrical for excitation and inhibition in areas with high firing rates such as the pallidum. Intracellular studies in the striatum (Jaeger et al., 1994; Czubayko and Plenz, 2002; Tunstall et al., 2002) have revealed weak inhibitory interactions via the GABAergic collaterals of the medium spiny neurons. Equivalent interactions are expected to be significantly reflected in the cross-correlation of the high-frequency-discharge pallidal neurons. However, both the autocorrelation and cross-correlation functions may suffer from severe distortions when calculated for fast-firing neurons. The autocorrelation functions, even for cells with a fixed probability of firing after the refractory period (as indicated by the flat hazard function), may display narrow peaks or even oscillations derived from the interaction between the high firing rate and the refractory period (Bar-Gad et al., 2001a). The cross-correlogram is also significantly affected in cases of interference between multiple (more than two) neurons, which becomes severe in brain areas with high firing rates, because the chance of coincidence between spikes from different cells rises considerably (Bar-Gad et al., 2001b).
The distance between neurons recorded from the same electrode is typically <100 μm in the cortex (Abeles, 1974). No similar analysis exists for the pallidum, and the distance is assumed to be on the same order of magnitude. The typical size of the dendritic and local axonic trees of pallidal projection neurons is ∼1000 μm (Yelnik et al., 1984, 1997; Kita and Kitai, 1994; Bevan et al., 1998; Sato et al., 2000; Parent et al., 2001). It is therefore probable that the two pallidal cells recorded by the same electrode have overlapping axonal/dendritic trees. Such overlapping inhibitory trees are expected to force a competition leading to negative correlation (i.e., a trough in the cross-correlogram). In addition, such neighboring neurons are presumed to share many of the inputs from the striatum and other nuclei within the basal ganglia (Percheron et al., 1984). This in turn is expected to lead to positive correlation between the neurons (i.e., a peak in the cross-correlogram).
Our results do not support the funneling hypothesis or the segregated loops hypothesis, because both theories assume that neighboring cells share the same input (except for the extreme case of each neuron forming a separate loop). Similarly, the lack of functional correlation does not fit well with the abundant models characterizing the basal ganglia function as an action selection network (Mink, 1996; Berns and Sejnowski, 1998; Wickens and Oorschot, 2000). Any model that requires strong interactions between neurons and especially neighboring neurons will also predict strong correlations (either negative or positive) between these neurons. The absence of such functional correlations is especially intriguing because of the huge convergence of input into the basal ganglia and the correlations that exist in its input layers (i.e., the cerebral cortex). One possible explanation for the lack of pallidal correlation is that an extreme parallel computation takes place (i.e., neighboring neurons deal with very different input). Alternatively and more plausibly, this lack of correlation suggests that the functionality of the basal ganglia may be associated with decorrelating functions, as are found in other areas of the nervous system (Maltenfort et al., 1998). These decorrelating functions may play a crucial role in neural computation, such as efficient information compression (Bar-Gad and Bergman, 2001).
Footnotes
This study was partly supported by a center-of-excellence grant administered by the Israel Science Foundation, the United States–Israel Binational Science Foundation, the German–Israel Binational Foundation, and the joint German-Israeli research program administered by the Ministry of Science and the Bundesministerium für Bildung und Forschung. We thank Edward A. Stern for his comments on previous versions of this manuscript; Genela Morris, David Arkadir, Josh A. Goldberg, and Sharon Maraton for sharing their data; and Amir Orlev for his help in the off-line spike sorting.
Correspondence should be addressed to Dr. Izhar Bar-Gad, Department of Physiology, The Hebrew University–Hadassah Medical School, P.O. Box 12272, Jerusalem 91120, Israel. E-mail: izharb@alice.nc.huji.ac.il
Copyright © 2003 Society for Neuroscience 0270-6474/03/234012-05$15.00/0
References
- Abeles M ( 1974) A journey into the brain. In: Signal analysis and pattern recognition in biomedical engineering (Inbar GF, ed), pp 41–59. New York: Wiley.
- Abeles M, Goldstein MHJ ( 1977) Multispike train analysis. IEEE Trans Biomed Eng 65: 762–773. [Google Scholar]
- Aertsen AM, Gerstein GL ( 1985) Evaluation of neuronal connectivity: sensitivity of cross-correlation. Brain Res 340: 341–354. [DOI] [PubMed] [Google Scholar]
- Alexander GE, DeLong MR, Strick PL ( 1986) Parallel organization of functionally segregated circuits linking basal ganglia and cortex. Annu Rev Neurosci 9: 357–381. [DOI] [PubMed] [Google Scholar]
- Bar-Gad I, Bergman H ( 2001) Stepping out of the box: information processing in the neural networks of the basal ganglia. Curr Opin Neurobiol 11: 689–695. [DOI] [PubMed] [Google Scholar]
- Bar-Gad I, Ritov Y, Bergman H ( 2001a) The neuronal refractory period causes a short-term peak in the autocorrelation function. J Neurosci Methods 104: 155–163. [DOI] [PubMed] [Google Scholar]
- Bar-Gad I, Ritov Y, Vaadia E, Bergman H ( 2001b) Failure in identification of overlapping spikes from multiple neuron activity causes artificial correlations. J Neurosci Methods 107: 1–13. [DOI] [PubMed] [Google Scholar]
- Bergman H, Feingold A, Nini A, Raz A, Slovin H, Abeles M, Vaadia E ( 1998) Physiological aspects of information processing in the basal ganglia of normal and parkinsonian primates. Trends Neurosci 21: 32–38. [DOI] [PubMed] [Google Scholar]
- Berns GS, Sejnowski TJ ( 1998) A computational model of how the basal ganglia produce sequences. J Cognit Neurosci 10: 108–121. [DOI] [PubMed] [Google Scholar]
- Bevan MD, Booth PA, Eaton SA, Bolam JP ( 1998) Selective innervation of neostriatal interneurons by a subclass of neuron in the globus pallidus of the rat. J Neurosci 18: 9438–9452. [DOI] [PMC free article] [PubMed] [Google Scholar]
- Bolam JP, Hanley JJ, Booth P-AC, Bevan MD ( 2000) Synaptic organisation of the basal ganglia. J Anat 196: 527–542. [DOI] [PMC free article] [PubMed] [Google Scholar]
- Czubayko U, Plenz D ( 2002) Fast synaptic transmission between striatal spiny projection neurons. Proc Natl Acad Sci USA 99: 15764–15769. [DOI] [PMC free article] [PubMed] [Google Scholar]
- DeLong MR, Crutcher MD, Georgopoulos AP ( 1985) Primate globus pallidus and subthalamic nucleus: functional organization. J Neurophysiol 53: 530–543. [DOI] [PubMed] [Google Scholar]
- Eggermont JJ ( 1990) The correlative brain: theory and experiment in neuronal interaction. Berlin: Springer.
- Gerfen CR, Wilson CJ ( 1996) The basal ganglia. In: Handbook of chemical neuroanatomy, Vol 12, Integrated systems of the CNS, Pt III (Swanson LW, Bjorklund A, Hokfelt T, eds), pp 371–468. Amsterdam: Elsevier Science. [Google Scholar]
- Haber S, McFarland NR ( 2001) The place of the thalamus in frontal cortical-basal ganglia circuits. The Neuroscientist 7: 315–324. [DOI] [PubMed] [Google Scholar]
- Heimer G, Bar-Gad I, Goldberg JA, Bergman H ( 2002) Dopamine replacement therapy reverses abnormal synchronization of pallidal neurons in the 1-methyl-4-phenyl-1,2,3,6-tetrahydropyridine primate model of parkinsonism. J Neurosci 22: 7850–7855. [DOI] [PMC free article] [PubMed] [Google Scholar]
- Jaeger D, Kita H, Wilson CJ ( 1994) Surround inhibition among projection neurons is weak or nonexistent in the rat neostriatum. J Neurophysiol 72: 2555–2558. [DOI] [PubMed] [Google Scholar]
- Kita H, Kitai ST ( 1994) The morphology of globus pallidus projection neurons in the rat: an intracellular staining study. Brain Res 636: 308–319. [DOI] [PubMed] [Google Scholar]
- Lewicki MS ( 1998) A review of methods for spike sorting: the detection and classification of neural action potentials. Network 9: R53–R78. [PubMed] [Google Scholar]
- Maltenfort MG, Heckman CJ, Rymer WZ ( 1998) Decorrelating actions of Renshaw interneurons on the firing of spinal motoneurons within a motor nucleus: a simulation study. J Neurophysiol 80: 309–323. [DOI] [PubMed] [Google Scholar]
- Middleton FA, Strick PL ( 2000) Basal ganglia and cerebellar loops: motor and cognitive circuits. Brain Res Brain Res Rev 31: 236–250. [DOI] [PubMed] [Google Scholar]
- Mink JW ( 1996) The basal ganglia: focused selection and inhibition of competing motor programs. Prog Neurobiol 50: 381–425. [DOI] [PubMed] [Google Scholar]
- Nini A, Feingold A, Slovin H, Bergman H ( 1995) Neurons in the globus pallidus do not show correlated activity in the normal monkey, but phase-locked oscillations appear in the MPTP model of parkinsonism. J Neurophysiol 74: 1800–1805. [DOI] [PubMed] [Google Scholar]
- Nowak LG, Munk MH, James AC, Girard P, Bullier J ( 1999) Cross-correlation study of the temporal interactions between areas V1 and V2 of the macaque monkey. J Neurophysiol 81: 1057–1074. [DOI] [PubMed] [Google Scholar]
- Parent M, Levesque M, Parent A ( 2001) Two types of projection neurons in the internal pallidum of primates: single-axon tracing and three-dimensional reconstruction. J Comp Neurol 439: 162–175. [DOI] [PubMed] [Google Scholar]
- Percheron G, Filion M ( 1991) Parallel processing in the basal ganglia: up to a point. Trends Neurosci 14: 55–56. [DOI] [PubMed] [Google Scholar]
- Percheron G, Yelnik J, Francois C ( 1984) A Golgi analysis of the primate globus pallidus. III. Spatial organization of the striato-pallidal complex. J Comp Neurol 227: 214–227. [DOI] [PubMed] [Google Scholar]
- Percheron G, Francois C, Yelnik J, Fenelon G, Talbi B ( 1994) The basal ganglia related system of primates: definition, description and informational analysis. In: The basal ganglia IV (Percheron G, McKenzie JS, Feger J, eds), pp 3–20. New York: Plenum.
- Perkel DH, Gerstein GL, Moore GP ( 1967) Neuronal spike trains and stochastic point processes. II. Simultaneous spike trains. Biophys J 7: 419–440. [DOI] [PMC free article] [PubMed] [Google Scholar]
- Sato F, Lavallee P, Levesque M, Parent A ( 2000) Single-axon tracing study of neurons of the external segment of the globus pallidus in primate. J Comp Neurol 417: 17–31. [PubMed] [Google Scholar]
- Tunstall MJ, Oorschot DE, Kean A, Wickens JR ( 2002) Inhibitory interactions between spiny projection neurons in the rat striatum. J Neurophysiol 88: 1263–1269. [DOI] [PubMed] [Google Scholar]
- Wichmann T, DeLong MR ( 1996) Functional and pathophysiological models of the basal ganglia. Curr Opin Neurobiol 6: 751–758. [DOI] [PubMed] [Google Scholar]
- Wickens J, Oorschot DE ( 2000) Neural dynamics and surround inhibition in the neostriatum: a possible connection. In: Brain dynamics and the striatal complex (Miller R, Wickens J, eds), pp 141–149. Amsterdam: Harwood Academic.
- Yelnik J, Percheron G, Francois C ( 1984) A Golgi analysis of the primate globus pallidus. II. Quantitative morphology and spatial orientation of dendritic arborizations. J Comp Neurol 227: 200–213. [DOI] [PubMed] [Google Scholar]
- Yelnik J, Francois C, Tand D ( 1997) Etude tridimensionnelle des collaterales initiales des neurones du pallidum interne chez le macaque. Paper presented at Third Congress of European Neuroscience Society, Bordeaux, France, May.