

Abstract
Glycine and GABA, the dominant inhibitory neurotransmitters in the CNS, assume a depolarizing role in early development, leading to increased cytoplasmic Ca2+ levels and action potentials. The effect is thought to be of some significance for maturation. The depolarization is caused by Cl− efflux, and chloride transporters contribute to the phenomenon by raising the intracellular Cl− concentration ([Cl−]i) above equilibrium, thereby generating an outward-directed electrochemical gradient for Cl−. In mature neurons, the [Cl−]i is reduced below equilibrium, thus rendering glycine activity hyperpolarizing. Here, we investigated the temporal expression of the K-Cl cotransporter KCC2 and the Na-K-Cl cotransporter NKCC1 in the lateral superior olive (LSO) of rats and mice. The two cation cotransporters normally extrude and accumulate Cl−, respectively. As evidenced by several methods, KCC2 mRNA was present in LSO neurons during both the depolarizing and hyperpolarizing periods. Western blots confirmed a constant level of KCC2 in the brainstem, and immunohistochemistry showed that the protein is diffusely distributed within neonatal LSO neurons, becoming integrated into the plasma membrane only with increasing age. The glycine reversal potential in KCC2 knock-out mice differed significantly from that determined in wild-type controls at postnatal day 12 (P12) but not at P3, demonstrating that KCC2 is not active in neonates, despite its early presence. NKCC1 mRNA was not detected during the depolarizing phase in the LSO, implying that this transporter does not contribute to the high [Cl−]i. Our results reveal major differences in the development of [Cl−]i regulation mechanisms seen in brainstem versus forebrain regions.
Keywords: glycine depolarization, ECl, cation cotransporters, KCC, NKCC, superior olivary complex, lateral superior olive, chloride regulation
Introduction
Glycine receptors and GABAA receptors are Cl− channels mediating synaptic inhibition in the vertebrate CNS. Activation of these receptors increases a Cl− conductance, which in the majority of mature neurons results in Cl− influx and thus in hyperpolarization (Eccles, 1966; Krnjevic, 1974). The basis of the Cl− influx is a relatively low intracellular free Cl− concentration ([Cl−]i), leading to an inward-directed electrochemical gradient for Cl− at the resting membrane potential (Vrest). A striking feature of glycinergic and GABAergic neurotransmission is that excitatory responses are elicited in immature neuronal systems, (e.g., auditory brainstem nuclei) (Kandler and Friauf, 1995; Ehrlich et al., 1999; Kakazu et al., 1999), hippocampus (Cherubini et al., 1990), hypothalamus (Chen et al., 1996), neocortex (Luhmann and Prince, 1991; Yuste and Katz, 1991; Owens et al., 1996), retina (Huang and Redburn, 1996), as well as spinal and cranial motoneurons (Wu et al., 1992; Reichling et al., 1994; Singer et al., 1998). The excitatory responses are achieved by depolarizations that reach the spike threshold and often result in an elevation of the cytoplasmic Ca2+ concentration. This cascade is thought to ultimately provide a trophic signal (for review, see Ben-Ari, 2002) for increasing the motility of migrating cells (Barker et al., 1998), regulating the rate of neuritogenesis (Maric et al., 2001), facilitating synapse formation (Ben-Ari et al., 1997; Cherubini et al., 1998; Kirsch and Betz, 1998), and promoting morphological differentiation (Ben-Ari et al., 1994; Marty et al., 1996; Kullmann et al., 2002).
The depolarizing effects of glycine and GABA are attributable to a Cl− reversal potential (ECl) that is more positive than Vrest and caused by a high [Cl−]i, maintained above electrochemical equilibrium through inward-directed Cl− pumps. In contrast, Cl−-extruding pumps predominate in mature neurons and generate a low [Cl−]i. In the hippocampus and spinal cord, the Cl− extrusion mechanism involves the K+-driven cotransporter KCC2, the activity of which renders GABAergic responses hyperpolarizing (Rivera et al., 1999; Hübner et al., 2001). KCC2 is the neuron-specific isoform (Payne et al., 1996; Williams et al., 1999) within a family comprising four electroneutral K-Cl cotransporters (KCC1–KCC4) (for review, see Alvarez-Leefmans, 2001; Delpire and Mount, 2002). The Na+-driven cotransporter NKCC1 (for review, see Haas and Forbush, 2000; Russell, 2000) was proposed as a major candidate for the inward-directed Cl− pump (Plotkin et al., 1997; Sun and Murali, 1999; Sung et al., 2000; Vardi et al., 2000; Jang et al., 2001). However, its expression pattern does not closely correlate with depolarizing effects in all neuronal systems (Clayton et al., 1998; Yan et al., 2001). Thus, the nature of the inward-directed Cl− transporter is still a matter of debate.
Here, we studied the temporal expression of KCC2 and NKCC1 in the lateral superior olive (LSO), a prominent nucleus in the mammalian auditory brainstem. LSO neurons are binaural and contribute to sound localization by processing interaural intensity differences (for review, see Helfert et al., 1991). The LSO is a favorable system to study the ontogeny of inhibitory synapses because it receives a tonotopically ordered glycinergic input from projection neurons in the medial nucleus of the trapezoid body (MNTB). These projection neurons are much more accessible for experimental manipulations than local interneurons from which inhibitory inputs usually arise in the CNS. In the rat LSO, the switch from depolarizing to hyperpolarizing glycine-induced responses occurs at approximately postnatal day 8 (P8) (i.e., 4 d before hearing onset) (Kandler and Friauf, 1995; Ehrlich et al., 1999). Our results from molecular biological, electrophysiological, and immunohistochemical experiments show that KCC2 is expressed during both the depolarizing and hyperpolarizing phase in the LSO, yet it becomes integrated into the plasma membrane and active only at older ages. NKCC1 is not expressed at P3, leading us to conclude that it is not the inward-directed Cl− transporter in the neonatal LSO.
Materials and Methods
All protocols adhered to the National Institutes of Health Guide for the Care and Use of Laboratory Animals, were in compliance with the current German Animal Protection Law, and were approved by the local animal care and use committee.
Tissue RNA isolation and reverse transcription-PCR. Total RNA was isolated from various organs and tissues of Sprague Dawley rats by the guanidine thiocyanate method (Chomczynski and Sacchi, 1987). The quality and quantity of RNA samples were assessed by gel electrophoresis and optical density measurements. Reverse transcription (RT) of total RNA (20 μg) was performed by using standard protocols with random hexanucleotide priming and SuperScript II (Invitrogen, Karlsruhe, Germany) as enzyme. The quality of the reverse transcription reactions was assessed with PCR using γ-actin-derived primers. Gene-specific PCR was performed for 35 cycles in a total volume of 50 μl, using primers and conditions listed in Table 1. Primers for NKCC1 were designed to, for example, amplify both splice variants (Randall et al., 1997; Vibat et al., 2001). Denaturing was at 94°C for 30 sec, annealing temperature was either 56 or 60°C for 30 sec, and elongation was at 72°C for 1–2 min. Ten microliters of each reaction were loaded onto a 2% agarose gel containing ethidium bromide (0.5 μg/ml). After electrophoresis, pictures were captured with a CCD camera (LTF Labortechnik, Wasserburg, Germany).
Table 1.
Primer sequences and amplification conditions
|
Name |
Oligonucleotide sequence |
Accession number |
Product size (bp) |
Annealing temperature (C°) |
|---|---|---|---|---|
| γ-actin-109f a | 5′-CCG TGT TTC CTT CCA TCG TC-3′ | X52815 | 933 | 60 |
| γ-actin-610r a | 5′-CTG TGG TGG TGA AGC TGT AG-3′ | X52815 | 933 | 60 |
| NKCC1-3362f ab | 5′-GTC CTA GGA GAC ATC AAC AC-3′ | AF051561 | 442 | 56 |
| NKCC1-3803r ab | 5′-GAT CCA GTC ACT CTG ACT AG-3′ | AF051561 | 442 | 56 |
| NKCC1-927f c | 5′-CTG CCG AAA GTA AAG GAG TTG TAA AGT T-3′ | AF051561 | 558 | 60 |
| NKCC1-1484r c | 5′-GCT TCT TGC TGT CCA GTG AGA TAA ATG T-3′ | AF051561 | 558 | 60 |
| NKCC1-955fr c | 5′-TGG CTG GAT CAA GGG TGT TTT AGT AC-3′ | AF051561 | 464 | 60 |
| NKCC1-1418m c | 5′-CCA GAA GGA CGA TCT GAG CCT TTG C-3′ | AF051561 | 464 | 60 |
| KCC2-5048f ab | 5′-TCT GGT TGG CAA GAG CAA AG-3′ | U55816 | 383 | 60 |
| KCC2-5450 ab | 5′-ATC AAT ACC GAG GCA GGA TG-3′ | U55816 | 383 | 60 |
| KCC2-189f c | 5′-GCA GCC CCT TCA TCA ACA GCA C-3′ | U55816 | 560 | 60 |
| KCC2-748r c | 5′-CAT CGC TGG GAA GAG GTA AGC-3′ | U55816 | 560 | 60 |
| KCC2-251m c | 5′-GCC CTG TTT GAG GAG GAG ATG GAC AC-3′ | U55816 | 323 | 60 |
| KCC2-573m c
|
5′-ATT GCG CTC ATG GAA ATG GCT GTG AG-3′
|
U55816
|
323
|
60
|
Oligonucleotides used for tissue PCR.
Oligonucleotides used for the generation of in situ probes.
Oligonucleotides used for single-cell PCR.
RNA in situ hybridization. Gene-specific PCR products (Table 1) were ligated to a T7 promoter using the Lig'nScribe PCR promoter addition kit (Ambion, Austin, TX), and sense and antisense constructs were obtained by PCR, following the instructions of the manufacturer. Digoxigenin (DIG)-labeled sense and antisense RNAs were generated using the DIG RNA-labeling kit (Roche Products, Hertforshire, UK) and T7 polymerase according to the protocol provided. DIG-labeled RNAs were analyzed by gel electrophoresis, and ∼50 ng were used for a slide (final concentration, 1 ng/μl). The protocol for DIG in situ hybridization was modified from Wisden et al. (1991). Frozen tissue was sliced in a cryostat, thaw-mounted on slides, and fixed in ice-cold 4% paraformaldehyde for 5–15 min. After rinsing in PBS, slides were transferred for several minutes to 70% ethanol and stored at 4°C in 100% ethanol until used. Before hybridization, tissue sections were permeabilized in 0.1N HCl for 10 min. After rinsing in PBS, sections were transferred into 0.25% acetic anhydride in 0.1 m triethanolamine, pH 8.0, or 0.9% NaCl for 10 min, and thereafter into 70% ethanol for 1 min, 95% ethanol for 2 min, 100% ethanol for 1 min, 100% chloroform for 5 min, and then back to 100% ethanol and subsequently into 95% ethanol before being dried. Prehybridization occurred at 50°C in a buffer containing 50% formamide, 4× SSC, 10% dextran sulfate, 5× Denhardt's solution, 200 mg/ml acid-alkali-cleaved salmon sperm DNA, and 2 mm sodium phosphate. After 2 hr, prehybridization buffer was removed and replaced by the same buffer containing the respective probe. Hybridization was performed overnight at 65°C. Sections were washed for 30 min each time at 60°C, once in 4× SSC and 50% formamide, and twice in 1× SSC. After RNase, a treatment (20 μg/ml) for 15 min at 37°C, bound DIG-labeled probes were detected by using an anti-DIG Fab fragment linked to alkaline phosphatase. The nitroblue–tetrazolium–chloride/5-bromo-4-chlor-indolyl-phosphate (NBT/BCIP) system was used as a substrate for alkaline phosphatase. Images were captured with a 12 bit CCD camera (1280 × 1024 pixels; Hamamatsu, Shizouka, Japan) mounted on a Zeiss (Thornwood, NY) Axioscope2.
Preparation of acute brainstem slices. Sprague Dawley rats and C57BL/6J wild-type and KCC2 knock-out mice at P3 and P12 were used for electrophysiology (the day of birth was defined as P0). Animals were deeply anesthetized and decapitated, and their brains were rapidly removed and dissected in a chilled (∼4°C) solution containing the following
(in mm): 25 NaHCO3, 2.5 KCl, 1.25 NaH2PO4, 1 MgCl2, 2 CaCl2, 260 d-glucose, 2 sodium pyruvate, 3 myo-inositol, and 1 kynurenic acid, pH 7.4 (when gassed with 95% O2–5% CO2). Coronal slices of 300 μm thickness were cut through the superior olivary complex (SOC) with a vibratome (VT1000S; Leica, Nussloch, Germany), preincubated for 1 hr at 37°C, and stored at room temperature until required for recording in an extracellular solution containing the following (in mm): 125 NaCl, 25 NaHCO3, 2.5 KCl, 1.25 NaH2PO4, 1 MgCl2, 2 CaCl2, 10 d-glucose, 2 sodium pyruvate, 3 myo-inositol, and 0.4 ascorbic acid, pH 7.4 (when gassed with 95% O2–5% CO2).
Electrophysiology. Recording electrodes had a resistance of 2–5 MΩ when filled with autoclaved pipette solution containing the following (in mm): 140 KCl, 5 EGTA, 3 MgCl2, and 5 HEPES, pH 7.3, with KOH. The patch pipettes were front filled with gramicidin-free pipette solution for 2–3 min and then backfilled with the same solution (6 μl) that additionally contained 5–10 μg/ml gramicidin, such that the pipette solution never contained >0.1% DMSO. Electrophysiological responses were recorded using the gramicidin perforated-patch recording technique with an Axopatch 1D amplifier (Axon Instruments, Foster City, CA) and pClamp 8.0.2 software (Axon Instruments). Slices were transferred to a recording chamber and continually perfused with extracellular solution at room temperature at a rate of 1.5–2 ml/min. LSO neurons were visualized with differential interference contrast (DIC)-infrared optics using a40×, 0.80 numerical aperture water immersion objective on an upright microscope (Eclipse E600-FN; Nikon, Düsseldorf, Germany). For gramicidin perforated-patch recordings, a gigaohm seal (≥1 GΩ) was established, and the progress of perforation was monitored until the series resistance had stabilized to ∼15 MΩ (after 10–30 min). Data were digitized via a Digidata 1322A interface (Axon Instruments), and series resistance compensation was set to 70–80% with a lag of 100 μsec. The voltage-clamp protocol consisted of stepping the membrane from a holding potential of −70 mV to command potentials ranging from −120 to 0 mV. Each step lasted 3 sec, and glycine (1 mm) was applied with a delay of 500 msec after the step onset at low pressure (3–4 psi) through a wider tip (∼1 μm) patch pipette that was mounted on a picospritzer (General Valve, Fairfield, NJ). The application intervals lasted 10 sec, which was shown previously to be long enough to prevent lasting changes of [Cl−]i and, consequently, artifacts in EGly, caused by Cl − loading or depletion at positive or negative holding potentials, respectively (Ehrlich et al., 1999). The liquid junction potential between the patch pipette and the bath solutions was low (∼3 mV) and therefore neglected. The peak amplitude of glycine-activated currents was calculated by taking the difference between the holding current and maximally evoked current resulting from glycine response. Peak current responses for each voltage were plotted, and the data were analyzed for best-fitting regression functions by the statistic software Winstat for Excel (version 1999.3; Fitch Software, Zierenberg, Germany). The reversal potential of glycine-activated currents (EGly) was determined from the x-intercept value of the regression line. The intracellular free Cl− concentration ([Cl−]i) was calculated with the Nernst equation (ECl = RT/F ln [Cl−]i/[Cl−]o) by applying the measured EGly (which is equivalent to ECl in LSO neurons) (Ehrlich et al., 1999), the relevant values of RT/F, and [Cl−]o as set in the experiment. Averaged data are given as mean ± SD. Statistical analysis was performed using Student's t test, and the level of significance was set at p < 0.05.
Single-cell RT-PCR. After perforated patch-clamp recording (see above), whole-cell configuration was established in some cells (n = 20), and the cellular content of the individual neuron was aspirated into the patch pipette. The complete content of each pipette (∼7 μl) was expelled into an RNase-free PCR tube containing first-strand buffer (Invitrogen), 10 mm dithiotreitol, 0.25 mm deoxynucleotide triphosphates (dNTPs), 2.5 mm random hexamer primers (Invitrogen), and 0.1 μg of yeast tRNA (Roche Products) in a total volume of 17 μl. One microliter of SUPERase-In (20 U/μl; Ambion) and 1 μl of RT Enhancer (Peqlab, Erlangen, Germany) were added, and the mixture was incubated at room temperature for 10 min and subsequently at 70°C for 5 min. After adding 1 μl of SuperScript II reverse transcriptase (200 U/μl; Invitrogen), the reverse transcription was performed for 1 hr at 42°C. Half of the reaction volume was then analyzed for the presence of KCC2 or NKCC1, respectively. First-round PCR was performed for 40 cycles with external primers (Table 1) and TaqDNA polymerase (Invitrogen) in the presence of 400 nm PCR primers and 0.5 mm dNTPs in a total volume of 50 μl. For second-round PCR, 1 μl of the first-round PCR was used as a template, and 20 cycles were performed with nested primers. The program for both PCRs was as follows: denaturing at 94°C for 30 sec, annealing at 60°C for 30 sec, and extension at 72°C for 1 min. Ten microliters of each nested PCR was then analyzed in a 1% agarose gel containing ethidium bromide (0.5 μg/ml).
Immunohistochemistry. Sprague Dawley rats were deeply anesthetized with chloral hydrate (600 mg/kg body weight, i.p.) and perfused transcardially with 0.01 m PBS, pH 7.4, followed by 4% paraformaldehyde in 0.1 m phosphate buffer. Brains were removed and incubated overnight in 30% sucrose–PBS at 7°C for cryoprotection. Coronal sections of 30 μm thickness were cut through the pontine brainstem, thoroughly rinsed in PBS, pretreated with 1% SDS and 8% β-mercaptoethanol in PBS (Lu et al., 1999), and blocked for 90 min in 1% bovine serum albumin and 1% goat serum in PBS. Rabbit anti-KCC2 serum, a generous gift from Dr. Eric Delpire (Nashville, TN) (Lu et al., 1999) was diluted 1:200. Incubation with agitation was performed in the refrigerator for 24 hr. After several rinses in PBS, sections were treated with secondary antibodies for 1.5 hr at room temperature (goat anti-rabbit IgG conjugated to Alexa 568, 1:1000; Molecular Probes, Leiden, The Netherlands), rinsed again, mounted on slides, and coverslipped. Specimen were viewed on an Axioscope2 microscope equipped with Plan-Neofluar lenses (Zeiss), and images were taken via a CCD camera (Hamamatsu). They were processed for publication using Adobe Photoshop (Adobe Systems, San Jose, CA) and printed on an Epson Stylus Photo 1290 printer.
Western blots. Membrane fractions of rat brainstems and telencephali were prepared as described previously (Williams et al., 1999). Briefly, tissues were dissected and homogenized in 2–4 ml of homogenization buffer (250 mm sucrose, 10 mm Tris, 10 mm HEPES, and 10 mm EDTA, pH adjusted to 7.2, containing protease inhibitors (Roche Products). After homogenization in a dispersing system (Miccra D-8; Art, Müllheim, Germany) for 5 × 5 sec at 23,500 rpm on ice, the homogenate was centrifuged first at 10,000 rpm for 10 min at 4°C (Beckman J2–21, JA 20 rotor; Beckman Instruments, Fullerton, CA), and the resulting supernatant was centrifuged again in the same rotor at 20,000 rpm for 1 hr at 4°C. The resulting pellet, enriched for membrane proteins, was resuspended in 100–500 μl of homogenization buffer with protease inhibitors and stored at −20°C. Protein concentration was determined using a Micro-BCA protein kit (Pierce, Rockford, IL). Ten micrograms of protein were resolved by a SDS-PAGE using a 6% Laemmli system. Gels were electrophoretically transferred to polyvinylidene difluoride (PVDF) membranes (Roth, Karlsruhe, Germany) for 2 hr at 1 mA/cm2 membrane surface using a semidry blotter (Peqlab). PVDF-bound proteins were visualized by staining with Poinceau S and then blocked in TTBS–milk (20 mm Tris, pH 7.5, 150 mm NaCl, 0.1% Tween 20, and 5% nonfat dry milk) for 1 hr and then incubated in the same buffer with the same anti-KCC2 antiserum used for immunohistochemistry (Lu et al., 1999) overnight at 4°C. After four washes in TTBS, the secondary antibody (horseradish peroxidase-conjugated goat anti-rabbit IgG (Amersham Biosciences, Heidelberg, Germany) was applied for 1 hr. After four washes in TTBS, bound antibody was detected using an enhanced chemiluminescence assay (Amersham Biosciences).
Results
KCC2 mRNA is abundant in the brainstem, whereas NKCC1 is barely expressed
We first explored developmental changes of KCC2 and NKCC1 at the level of gene expression. To do so, RT-PCR was used to identify gene transcripts of the two cotransporters in rats during the depolarizing (P0 and P6) and the hyperpolarizing periods (P16). We concentrated on four different areas of the CNS (brainstem, cerebellum, spinal cord, and telencephalon), and, for the sake of comparison, we also analyzed six non-neural tissues (heart, intestines, kidney, liver, lung, and stomach). KCC2 transcripts were identified in all CNS tissues (Fig. 1 A). In contrast, basically no mRNA signal was seen in the non-neural tissues, confirming that KCC2 is neuron specific (Payne et al., 1996; Williams et al., 1999). With nonsaturating amplification (24 RT-PCR cycles), it became clear that KCC2 expression in the telencephalon was weaker in neonatal animals (P1–P3) than in P12–P16 animals (Fig. 1 D).
Figure 1.
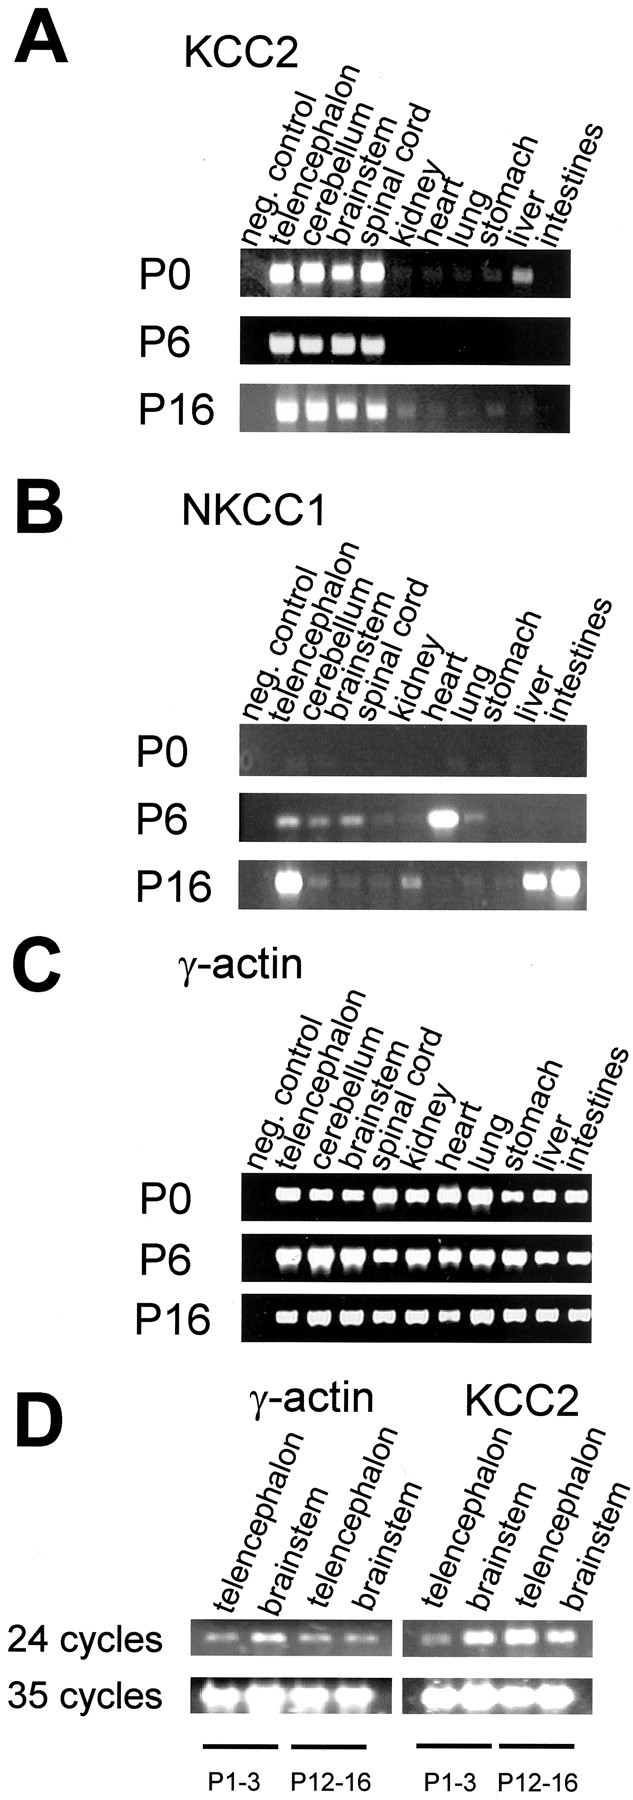
Development of KCC2 and NKCC1 expression in rat tissues. RT-PCR was performed on 10 tissues and at three postnatal ages. A, KCC2 expression was restricted to all neural tissues (telencephalon, cerebellum, brainstem, and spinal cord), confirming the neuron specificity of KCC2 (Lauf and Adragna, 2000).The only exception is provided by the liver, which shows a signal at P0 but becomes devoid at older ages. B, In none of the tissues analyzed was an NKCC1 signal seen at P0. At P6 and P16, a signal was obvious in most tissues, although generally at a low level. Note the higher expression levels in the heart (P6), telencephalon, liver, and intestines (P16). In the brainstem, NKCC1 mRNA was barely detectable. C, Analysis of γ-actin mRNA (positive control) shows uniform bands in all samples, implying equal amounts of cDNA after the RT-PCR reactions. When cDNA was replaced by H2O (negative control), no amplification product became visible (A–C). D, A high number of 35 PCR amplification cycles resulted in saturating concentrations of the PCR products and, therefore, showed a strong signal even at P1–P3 when the expression level of KCC2 is low (compare with Fig. 2). When the number of cycles was reduced to 24, the telencephalic signal obtained at P1 was considerably weaker than that obtained at P16, demonstrating upregulation in this brain region with age. In contrast, with the same 24 cycles, similarly strong signals are found in the brainstem during development.
NKCC1 expression in the CNS was less prominent than KCC2 expression, and, in the brainstem, transcripts were barely seen (Fig. 1 B). At the day of birth (P0), no signal was detected in any of the tissues analyzed. γ-Actin mRNA, which served as a positive control, was consistently identified, and uniform bands appeared in all samples (Fig. 1 C,D), demonstrating that equal amounts of cDNA were obtained by the RT-PCR procedure. The observed mRNA patterns indicated that KCC2 gene expression in the brainstem is not upregulated with age but constitutively takes place during the first three postnatal weeks. Conversely, NKCC1 is barely, if at all, expressed in the brainstem during this period.
KCC2 expression in the superior olivary complex occurs during both the depolarizing and hyperpolarizing periods of glycine
We next focused our analysis on KCC2 gene expression in the SOC. KCC2 mRNA in this auditory brainstem area, as identified by in situ hybridization, was seen in neonatal animals (Fig. 2 A–C) when SOC neurons are depolarized by glycine as well as in juveniles (Fig. 2 D–F) when hyperpolarizing effects of glycine have emerged. The labeling pattern differed slightly among the four major SOC nuclei, the LSO, medial superior olive (MSO), MNTB, and the superior paraolivary nucleus (SPN), in that MNTB neurons appeared to express KCC2 at a lower level than neurons in the other nuclei (Fig. 2 A,D). LSO neurons at P3 were labeled in a very similar manner to those at P12 (Fig. 2 B,E). The same result was obtained in the MSO and SPN (Fig. 2 A,D), implying that there are no major changes in KCC2 mRNA synthesis that may be related to the age-related switch from depolarizing to hyperpolarizing glycine activity in the SOC.
Figure 2.
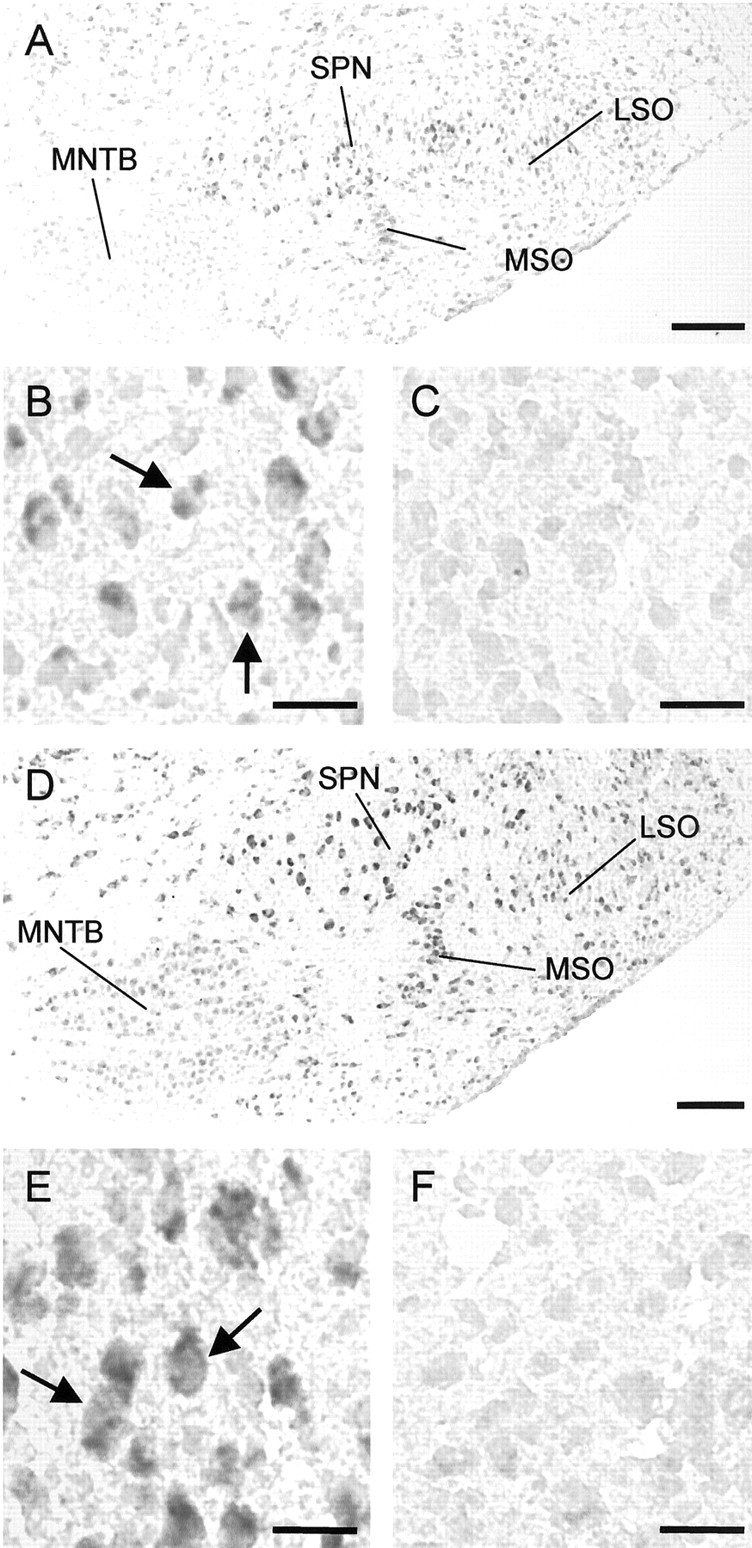
Expression of KCC2 mRNA in the developing rat superior olivary complex. Coronal sections were hybridized with digoxigenin-labeled KCC2-specific riboprobes using standard in situ hybridization protocols. A–C, At P3, labeling is already present in the LSO (B, arrows), the MSO, and the SPN. Neurons in the MNTB are barely labeled. B (antisense probe) and C (sense probe) show part of the LSO at high magnification. At P12 (D–F), the labeling pattern is virtually unchanged, except that MNTB neurons appear to be more heavily labeled now. E (antisense probe) and F (sense probe) show part of the LSO at high magnification. In the LSO, the density of labeled neurons (E, arrows) has not increased compared with P3 (19 at P12 vs 17 at P3 in B and E, respectively), indicating that there is no upregulation of KCC2 during the period when the switch to hyperpolarization occurs. Dorsal is to the top, and lateral to the right. Scale bars: A, D, 200 μm; B, C, E, F, 25 μm.
KCC2 expression in the hippocampus is upregulated with age
To provide additional security for our result of an unchanged KCC2 expression in the SOC between P3 and P12, we also analyzed the development in the rat hippocampus, for which an age-related increase of gene expression was described previously (Rivera et al., 1999). In situ hybridization experiments demonstrated the virtual absence of KCC2 mRNA in all hippocampal areas at P0, even when the duration of the NBT/BCIP chromogene reaction was increased to >30 hr (Fig. 3 A–C), yet a strong signal at P16 (Fig. 3 D–F). These data are in unison with those obtained previously (Rivera et al., 1999) and demonstrate a striking difference in KCC2 development between the SOC and the hippocampus concerning a correlation of the mRNA level with changes in glycinergic/GABAergic signaling.
Figure 3.
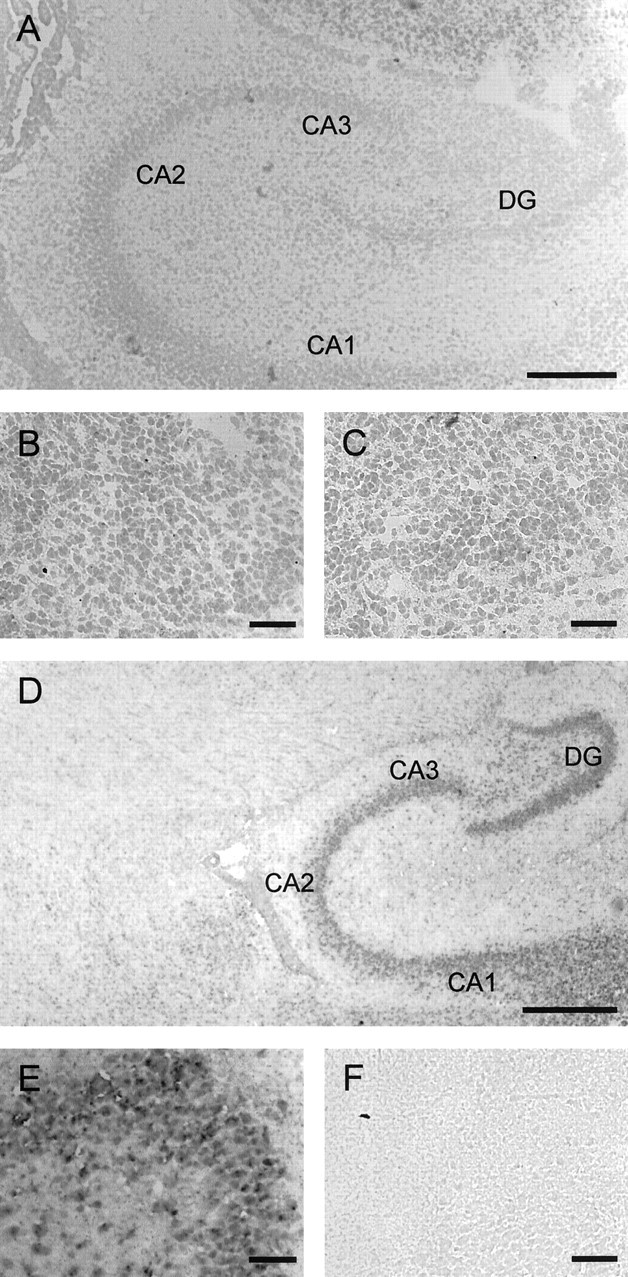
Upregulation of KCC2 gene expression in the hippocampus revealed by in situ hybridization. A–C, At P0, all hippocampal areas [i.e., CA1–CA3 and dentate gyrus (DG)] are almost devoid of labeling; however, note some labeling in the cortex dorsal to the CA3 region. D–F, At P16, labeling is clearly present in the hippocampal areas. B and E depict dentate gyrus areas from A and D at high magnification; C and F show control sections (dentate gyrus areas) labeled with sense probe. Sagittal sections, Dorsal is to the top, and caudal is to the right. Scale bars: A, 250 μm; D, 500 μm; B, C, E, F, 50 μm.
NKCC1 expression is absent in the SOC of neonatal rats and increases slightly with age
We also examined the expression pattern of the inward-transporting chloride cotransporter NKCC1 by in situ hybridization.
No signal was evident at P3 in the SOC nuclei (Fig. 4 A–C), and an absence of NKCC1 gene expression was also observed in other brainstem areas, such as the reticular formation (Fig. 4 A). However, NKCC1 mRNA was prominent in the choroid plexus (data not shown), which thus served as a positive control. By P12, when hyperpolarizing responses are elicited during glycine application, SOC nuclei displayed a few labeled cells (Fig. 4 D–F), indicating a slight upregulation of NKCC1 with age. However, the labeling intensity as well as the density of labeled cells were much lower than in the case of KCC2, as subjectively judged by eye. These data led us to conclude that NKCC1 does not provide the molecular basis of depolarizing glycine activity in the LSO and other SOC nuclei.
Figure 4.
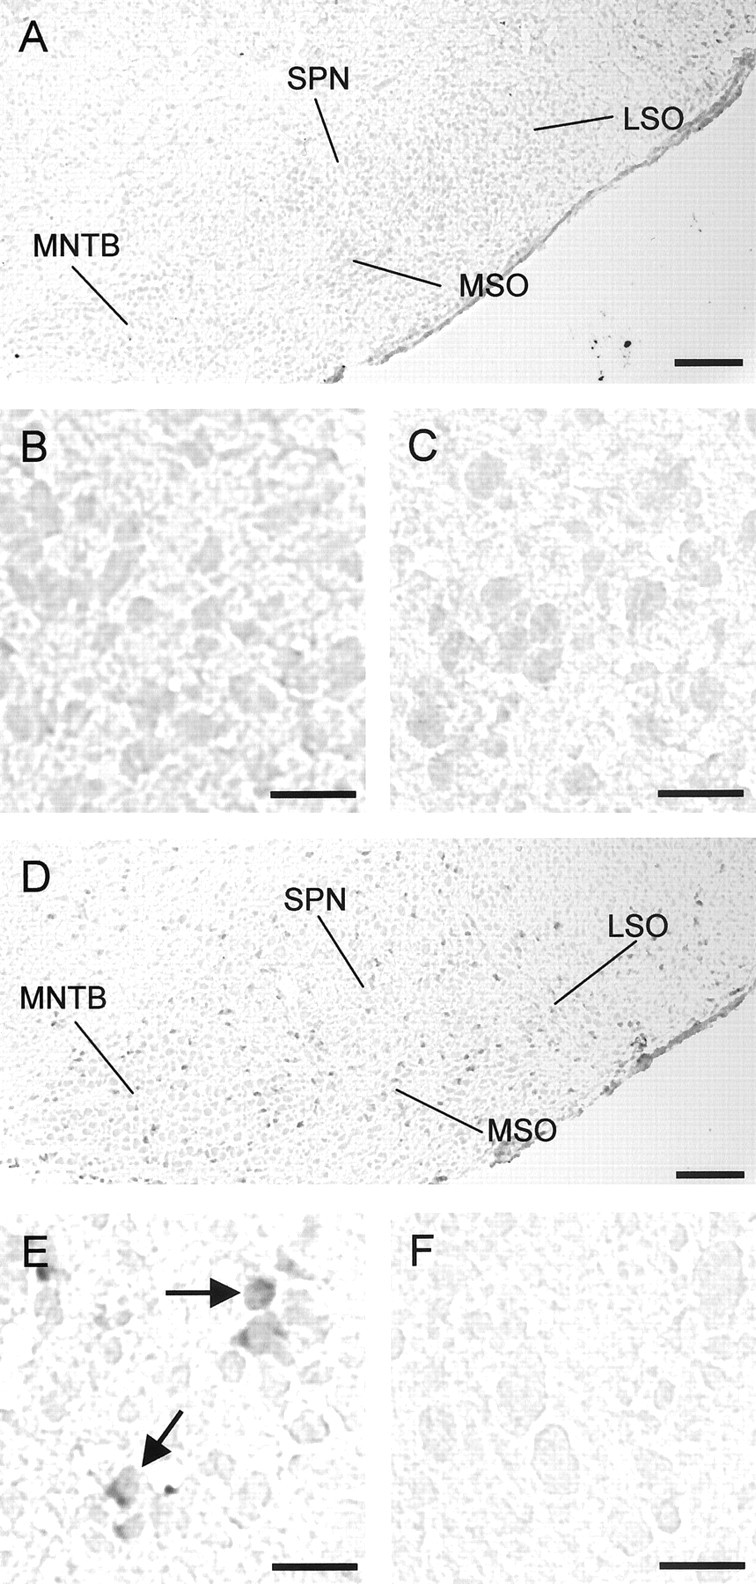
Expression of NKCC1 mRNA in the developing rat superior olivary complex revealed by in situ hybridization. A, At P3, none of the SOC nuclei contains labeled cells. B, All LSO cells are clearly unlabeled at that age. C, Control section (LSO) labeled with sense probe. D, At P12, sporadic labeling is seen in all SOC nuclei, including the LSO (E, arrows), indicating that NKCC1 expression is at best upregulated with age. F, Control section (LSO) labeled with sense probe. Coronal sections, Dorsal is to the top, and lateral is to the right. Scale bars: A, D, 200μm; B, C, E, F, 25 μm.
Single-cell RT-PCR experiments confirm the presence of KCC2 mRNA throughout postnatal development and the absence of NKCC1 mRNA in neonatal LSO neurons
Although the switch from depolarizing to hyperpolarizing glycine activity occurs at P8 within the total population of rat LSO neurons analyzed, individual neurons display this switch as early as P2 and as late as P10 (Kandler and Friauf, 1995; Ehrlich et al., 1999). To determine whether there may be a correlation between hyperpolarizing glycine activity and the gene expression of KCC2 in individual LSO neurons, we performed single-cell RT-PCR experiments (Geiger et al., 1995) and compared the mRNA expression profile of KCC2 with the glycine reversal potential (EGly). Aside from KCC2, we also probed for NKCC1 (10 neurons each at P3 and P12). To do so, bipolar LSO neurons in the core region of the nucleus, most likely representing principal neurons (Rietzel and Friauf, 1998), were selected under visual control using DIC-infrared microscopy (Fig. 5 A). Voltage changes in response to glycine application were first recorded in the perforated-patch mode (Fig. 5 B) using gramicidin as the ionophore to leave the native [Cl−]i intact (gramicidin pores are impermeable to anions) (Ebihara et al., 1995; Kyrozis and Reichling, 1995).
Figure 5.
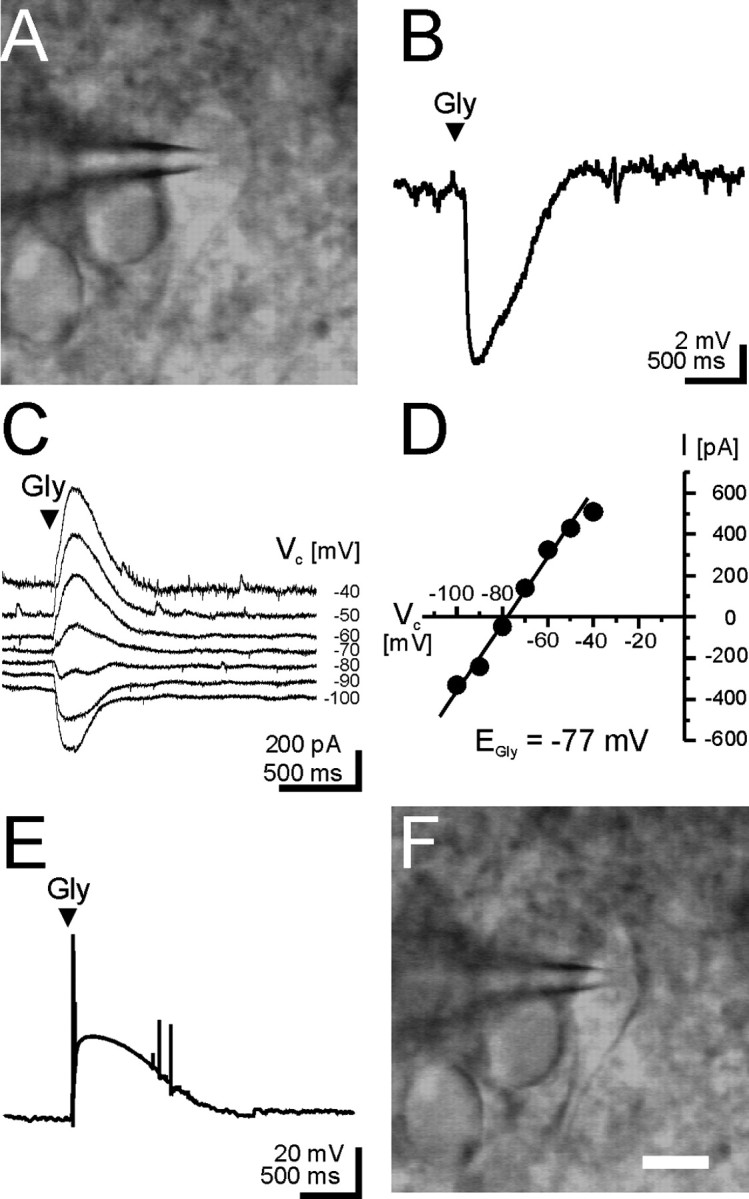
Example of a single-cell RT-PCR experiment performed on LSO neurons. Patch-clamp recordings in the perforated mode with gramicidin as the ionophore were obtained from a P12 neuron with spindle-shaped soma (A). Hyperpolarizing voltage changes of approximately −8 mV were elicited during glycine application (Gly; arrowhead) when recording in the current-clamp configuration (B). C, D, EGly was determined during voltage-clamp recordings at seven different holding potentials (−100 to −40 mV; see Materials and Methods) and found to be −77 mV (resting membrane potential was −57 mV). After the rupture of patch membrane, thereby going into whole-cell mode, glycine application rapidly elicited depolarizing voltage changes of ∼40 mV (E), indicating fast dialysis of the interior of the neuron. The depolarization caused the cell to fire few action potentials, demonstrating the excitatory effect of glycine. The cell content was harvested into the recording pipette under visual control (F), followed by a nested RT-PCR.
EGly was determined under voltage-clamp conditions from the intersection of the current–voltage graph with the x-axis (Fig. 5 C,D). The membrane under the patch was then ruptured; this resulted in a quick dialysis of the cell as evidenced by the emergence of large depolarizing glycine responses and concurrent action potentials (Fig. 5 E) because of symmetric chloride concentrations in the pipette and the bath solution (see Materials and Methods). Finally, the cell content was carefully harvested while watching the gradual collapse of the soma (Fig. 5 F), and a nested RT-PCR was performed. In the amplifications with the cotransporter-specific primers, the obtained amplimers had the expected sizes of 323 and 464 bp for KCC2 and NKCC1, respectively.
We found that every single LSO neuron analyzed (20 of 20) expressed KCC2, regardless of age or whether EGly was more negative or positive than the membrane resting potential (Vrest) (Fig. 6). In contrast, NKCC1 mRNA was detected only in the P12 group (10 of 10) that comprised nine neurons, the EGly of which was more negative than Vrest (Fig. 6). Because no NKCC1 transcripts were seen at P3, when 9 of 10 neurons showed depolarizing responses to glycine, the NKCC1 gene expression is not in accordance with the hypothesis that NKCC1 is the inward-directed Cl− transporter during the depolarizing phase in the LSO. Together, the single-cell RT-PCR data show that KCC2 and NKCC1 transcripts can exist in the same LSO neuron, but coexpression is not obligatory. Most importantly, however, they confirm that KCC2 expression does not correlate with hyperpolarizing glycine activity, and, likewise, NKCC1 expression does not correlate with depolarizing glycine activity in the LSO. The data imply that KCC2 activity may be regulated at the posttranslational level in the LSO, and they also raise the question concerning the nature of the inward-transporting chloride transporter during early ontogeny.
Figure 6.

Relationship between EGly and the presence of KCC2 and NKCC1 transcripts in individual LSO neurons at P3 and P12. This figure illustrates the difference between Vrest (base of arrow) and EGly (tip of arrow) determined in 20 neurons. EGly was more positive than Vrest (EGly > Vrest) in 9 of 10 neurons at P3 (upward arrows), whereas EGly < Vrest in 9 of 10 neurons at P12 (downward arrows). Values for intracellular chloride concentration ([Cl−]i) were calculated with the Nernst equation and are shown on the right. The gray band illustrates the range for Vrest (−50 to −68 mV). Vrest averaged −59 ± 6 mV at P3 (mean ± SD) and did not differ from Vrest at P12 (−58 ± 4 mV; p = 0.77). In contrast, EGly at P3 (mean, −32 ± 13 mV; range, −12 to −52 mV) became significantly more negative until P12 (mean, −76 ± 14 mV; range, −47 to −92 mV; p < 10−3). Whereas [Cl−]i averaged 44 ± 22 mM at P3, it amounted to 8 ± 5 mV by P12 [i.e., it was significantly lower, p < 10−3, having declined by ∼80% within 10 d, to the same degree as described in the hypothalamus (Gao and van den Pol, 2001)]. The results from the single-cell RT-PCR experiments are depicted in the bottom part of the figure. Every neuron analyzed was positive for KCC2 mRNA, regardless of age. In contrast, no NKCC1 transcript was detected in the P3 group, whereas it was present in every neuron at P12.
The KCC2 protein is present in the neonatal brainstem yet is redistributed within SOC neurons during development
At the level of mRNA analysis, our results on KCC2 expression in the SOC varied from those found in the hippocampus (Figs. 2, 3). To assess whether the differences were also evident at the protein level, we performed a Western blot analysis using a KCC2-specific polyclonal antibody (Lu et al., 1999) and investigated telencephalic and brainstem tissues at P1 and P16. Almost no signal was seen in the telencephalon at P1, whereas a prominent band was visible at P16 (Fig. 7 A). In contrast, no obvious change occurred in the brainstem, in which the protein was prominent at both ages. The data show that a significant amount of KCC2 protein is generated in the neonatal rat brainstem. Because the results obtained at the protein level are reflecting those obtained for the mRNA, they also show that the mRNA is indeed translated into protein.
Figure 7.
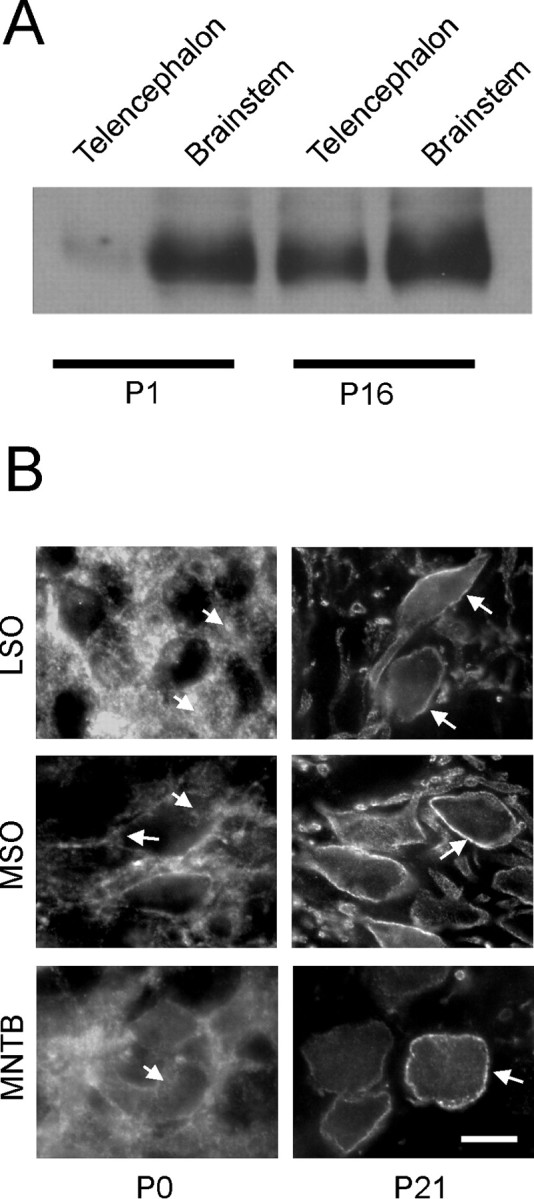
Analysis of KCC2 expression at the protein level. A, Western blot showing developmental upregulation of the KCC2 protein in the telencephalon but not in the brainstem. B, Immunohistochemical staining of rat LSO, MSO, and MNTB neurons, showing diffuse intracellular labeling pattern at P0 (arrows). In contrast, a concentration of the signal in the plasma membrane surrounding the somata and proximal dendrites is obvious at P21 (arrows). Note that MSO neurons display some signal in the plasma membrane already at P0. Scale bar, 10μm in all photomicrographs.
One explanation for the discrepancy between the presence of KCC2 protein and the absence of hyperpolarizing glycine responses in the neonatal SOC is that KCC2 may not be incorporated into the plasma membrane at these early stages of development. We examined this possibility and performed immunohistochemistry in the SOC to clarify whether the subcellular localization of KCC2 changes with age. The same antiserum as for the Western blots was applied. At the day of birth, SOC neurons were immunoreactive and the signal intensity was already high (Fig. 7 B), but the labeling was diffuse and barely related to the plasma membrane (an exception was found in the MSO, in which a signal in the plasma membrane was obvious already at P0). The labeling appeared to be primarily intracellular, possibly associated with organelles such as the endoplasmic reticulum, Golgi apparatus, and/or transport vesicles (for a similar situation in the rat hippocampus at P0, see Gulyás et al., 2001). By P12, however, the majority of labeling had shifted to the plasma membrane, as expected for a functional cotransporter, and this pattern was consistently found thereafter, crisply and densely outlining the soma and proximal dendrites but leaving the cytoplasm weakly labeled (Fig. 7 B). A quantitative investigation revealed that, at P0, 16 of 18 analyzed MSO neurons displayed intracellular labeling, whereas two displayed some plasma membrane-associated locations of KCC2. In the LSO, 94 of 104 analyzed neurons displayed intracellular labeling, with the remainder showing some plasma membrane-associated signal. By P21, the immunocytochemical signal in all 13 MSO neurons and all 82 LSO neurons analyzed was clearly associated with the plasma membrane. On the basis of these results, we suggest that KCC2 is indeed translocated during development such that the distribution changes from an intracellular pattern (in which there is no transmembrane transport function) to a plasma membrane-integrated location, thereby bringing the protein into the position of an active cotransporter.
LSO neurons of neonatal KCC2 −/− mice display normal EGly yet relatively positive values at P12
In a final set of experiments, we addressed the questions of whether indeed KCC2 does not play a role in [Cl−]i regulation in LSO neurons during the neonatal period of depolarizing glycine action, whereas it does so in the hyperpolarizing period seen in juveniles and adults. To obtain results under conditions of a selectively inactivated KCC2 cotransporter, we chose knock-out mice in which the KCC2 gene is disrupted and >95% reduction of protein expression is achieved (as determined by Western blots) (Woo et al., 2002). Homozygous offspring of these knock-out mice exhibit frequent and generalized seizures during the first postnatal week and die between P10 and P16, whereas heterozygous animals are indistinguishable from wild-type mice during that period (Woo et al., 2002).
In LSO neurons of wild-type mice, the switch from depolarizing to hyperpolarizing glycine activity takes place at P8, as it does in rats (V. Balakrishnan, unpublished observations). Consequently, P3 and P12 represent ages at which EGly > Vrest and EGly < Vrest, respectively, and therefore, we did our analyses at these ages. Current-clamp recordings from LSO neurons obtained in brainstem slices of KCC2 −/− mice at P3 (n = 4) consistently showed depolarizing responses, the amplitudes of which were in the range of those seen in KCC2 +/+ mice (n = 5) (Fig. 8 A). The current–voltage relationship of glycine-induced responses in −/− mice was indistinguishable from that in +/+ mice (Fig. 8 B). In line with this, the average EGly in P3 −/− mice was −32 ± 14 mV (n = 4) and did not differ significantly (p = 0.63) from the value found in P3 +/+ mice (−38 ± 20 mV; n = 5). These results provide additional evidence that KCC2 is not an active Cl− transmembrane transporter in neonatal LSO neurons, consistent with the above immunohistochemical finding that the protein is found intracellularly rather than in the plasma membrane at this age.
Figure 8.
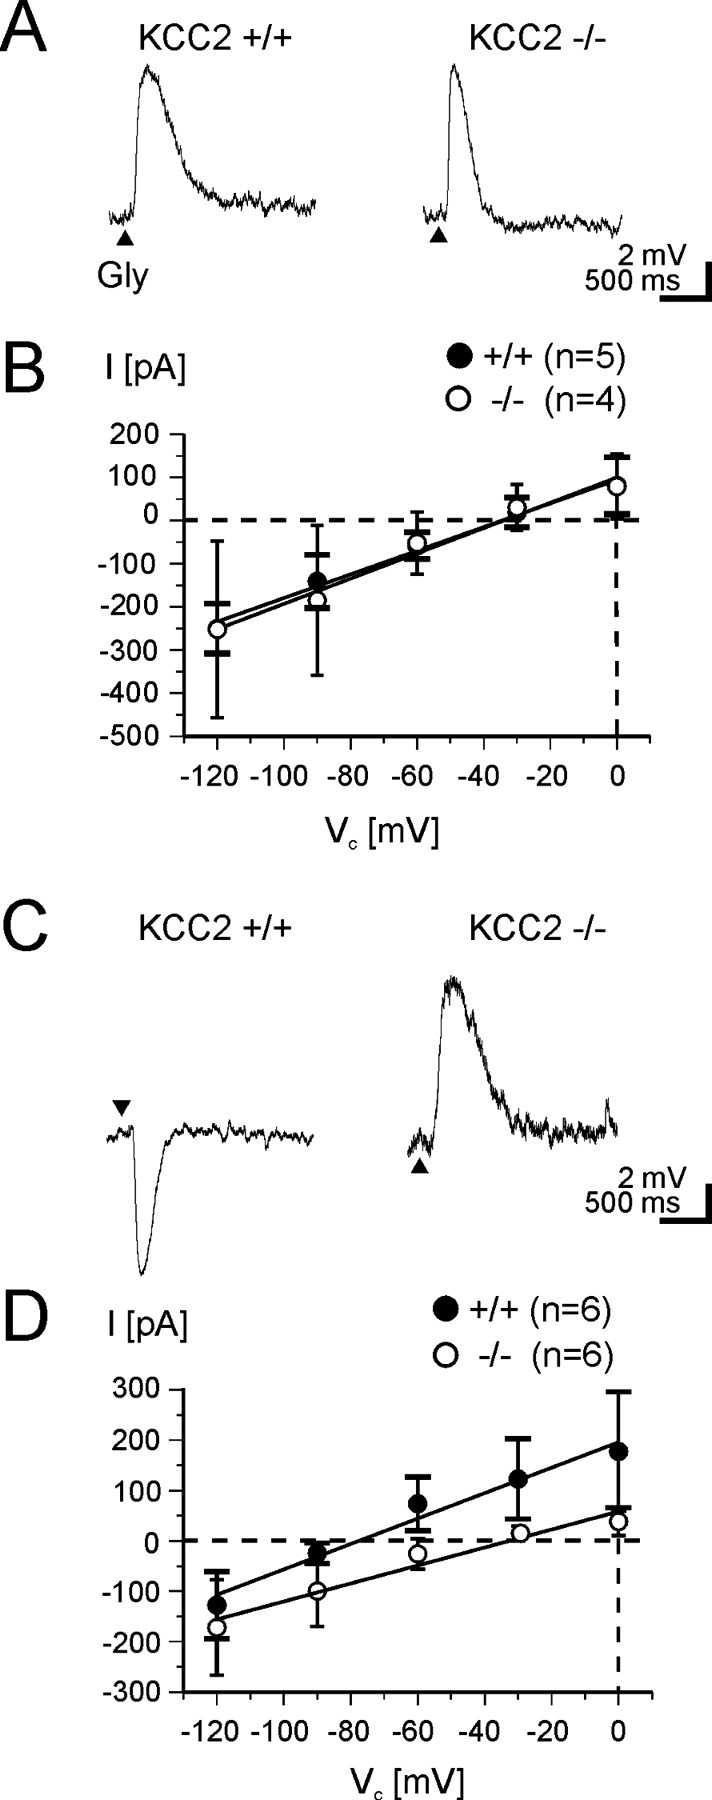
A–D,EGly in LSO neurons of KCC2 −/− mice (open circles) at P3 (A, B) and P12 (C, D) compared with wild-type mice (filled circles). Arrowheads in A and C indicate glycine application. Typical examples of glycine-induced voltage changes obtained in current-clamp recordings at P3 (A) and P12 (C). Depolarizing responses are present in both +/+ and −/− mice at P3 and also in −/− mice at P12. Vrest does not differ considerably among the neurons (P3 +/+, −58 mV; P3 −/−, −60 mV; P12 +/+, −58 mV; P12 −/−, −62 mV). B, D, Current–voltage relationships demonstrate an abnormally positive EGly of −33 ± 7 mV in −/− mice at P12. Error bars illustrate SD (long horizontal endings apply for +/+, short endings for −/− mice).
In contrast to the unaffected EGly (and [Cl−]i) seen at P3 in LSO neurons of KCC2 −/− mice, [Cl−]i regulation was massively disturbed in P12 LSO neurons of these null mutants. This was evidenced by depolarizing glycine-induced responses (n = 6), whereas LSO neurons in +/+ mice (n = 6) showed hyperpolarizing responses (Fig. 8 C). The current–voltage relationships were linear in both groups, but they were clearly shifted toward more positive membrane potentials and exhibited a slightly shallower slope in the −/− group (Fig. 8 D). EGly in the P12 homozygous knock-outs was significantly different (p < 10−5) from the value obtained for +/+ mice (−33 ± 7 vs −75 ± 8 mV). Interestingly, EGly in KCC2 −/− mice at P12 did not differ from EGly in +/+ mice at P3 (p = 0.91), indicating that the genetic knock-out leaves the LSO neurons in an immature state concerning Cl− regulation. We found no difference in the resting membrane potential of the neurons among the groups, implying that KCC2 activity does not contribute to Vrest (P3 +/+, −58 ± 4 mV, n = 5; P3 −/−, −59 ± 5 mV, n = 4; P12 +/+, −61 ± 7 mV, n = 6; P12 −/−, −63 ± 5 mV, n = 6). The data obtained from the −/− mice strongly corroborate the idea that an active KCC2 transporter achieves EGly values that are more negative than Vrest by extruding Cl− from mature neurons, thus generating a low [Cl−]i and relatively negative values for ECl (i.e., EGly), which ultimately result in hyperpolarizing glycine activity.
Discussion
Three major findings were obtained in this study. First, glycinergic responses in developing LSO neurons become hyperpolarizing through the action of the outward-directed K-Cl cotransporter KCC2. Second, KCC2 expression is not upregulated during the first two postnatal weeks in the auditory brainstem; this finding contrasts with that obtained in forebrain areas. In the LSO and other SOC nuclei, the activity of the constitutively expressed cotransporter appears to be regulated primarily by means of posttranslational modifications that manifest themselves in a delayed integration of the protein into the plasma membrane. Third, the inward-transporting Na-K-Cl cotransporter NKCC1 is not expressed neonatally in the LSO and, therefore, does not form the basis of the early depolarizing glycine action. Consequently, the nature of the transporter that causes positive EGly values with respect to Vrest by loading the neurons with Cl−, thus rendering glycine-induced responses depolarizing, remains unknown at present in the LSO.
KCC2 expression per se does not imply negative EGly in LSO neurons
The results from five series of experiments, namely tissue RT-PCR, in situ hybridization, single-cell RT-PCR, Western blotting, and immunohistochemistry, provided firm evidence that there is no simple causality between the presence of KCC2 mRNA or protein and hyperpolarizing glycine activity in the rat and mouse LSO. KCC2 mRNA and protein are found in the SOC throughout the first 3 weeks of postnatal life, showing no sign that upregulation of gene expression and protein synthesis occurs. This finding is in contrast to that obtained in the rat hippocampus, in which the amount of both KCC2 mRNA and protein increases gradually with age between P0 and P9, thereby rendering GABAergic activity hyperpolarizing (Rivera et al., 1999; Ganguly et al., 2001; Gulyás et al., 2001). An age-dependent increase of KCC2 expression was also reported for the rat neocortex (after P7, Clayton et al., 1998; between P3 and P25, DeFazio et al., 2000) and the rat retina (between P1 and P14, Vu et al., 2000). Lu et al. (1999) investigated the entire rat brain by Northern and Western blot analysis and found a minimal level of KCC2 expression at birth and a significant increase until P28; unfortunately, the brainstem was not investigated specifically. Thus, to date, this study provides the only developmental analysis of KCC2 regulation in a caudal CNS region. It is possible that the developmental regulation of KCC2 activity differs in caudal aspects of the CNS from that seen in rostral brain areas. Spinal cord neurons and cranial motoneurons, which also display a developmental switch from depolarization to hyperpolarization (Wu et al., 1992; Reichling et al., 1994; Serafini et al., 1995; Singer and Berger, 2000), need to be investigated to tackle this possibility.
Posttranslational modifications that activate an initially inactive form of the KCC2 protein were described in cultured hippocampal neurons (Kelsch et al., 2001). The activation involves a phosphorylation step via the action of insulin-like growth factor 1 and a protein tyrosine kinase, thus propelling the switch of GABAergic responses to hyperpolarizing inhibition. We concluded that the onset of transporter activity does not correlate with the amount of mRNA or the mere presence of KCC2 protein. Implying age-related changes in the location of the KCC2 protein in postnatal LSO neurons, our data corroborate this conclusion and show that such changes can also occur in vivo.
The age-related integration of the KCC2 protein into the plasma membrane of LSO neurons per se does not necessarily imply the onset of function because posttranslational modifications may well occur after the integration step. In any case, however, the integration step is a necessity for functionality. In the rat hippocampus, a diffuse KCC2 immunolabeling and an association with membranes of transport vesicles was described at P0–P2 by electron microscopy, whereas most of the reaction product was observed in the plasma membrane at P4 (Gulyás et al., 2001). Because the change from depolarizing to hyperpolarizing GABAergic activity occurs at the end of the first postnatal week, this shows that functionality is not merely determined by the incorporation of the protein into the plasma membrane.
Thermodynamic considerations of KCC2 transport
The findings obtained from our electrophysiological characterization of KCC2 −/− mice demonstrate that KCC2 is a very effective outward-directed Cl− transporter in P12 LSO neurons. Because KCC2 activity is electroneutral, its driving force (ΔμKCC2) is independent of the membrane potential and solely determined by the chemical gradients for Cl− and K+ across the plasma membrane. Consequently,
 |
1 |
At equilibrium, when there is no net transport, ΔμKCC2 = 0, and therefore the intracellular Cl− concentration calculates to the following:
 |
2 |
The equations can be applied to determine [Cl−]i under the conditions that [K+]i is held constant by the Na+-K+-ATPase, KCC2 is the only active Cl−-transporting system, and no Cl− diffusion process (e.g., via ligand-gated channels and/or ClC chloride channels) acts as a disturbing factor. Our experiments in the gramicidin perforated patch-clamp mode were performed with the following ion concentrations: 2.5 mm [K+]o; 133.5 mm [Cl−]o; and 140 mm [K+]i, as determined by the K+ concentration in the patch pipette (gramicidin pores are permeable to monovalent cations, thus [K+]i = [K+]pipette). With these values, [Cl−]i calculates to 2.4 mm. The experimentally determined value of [Cl−]i in P12 LSO neurons was 8 ± 5 mm (Fig. 6) and, therefore, close to the theoretical value. This provides additional support that KCC2 is the Cl−-extruding carrier in mature LSO neurons. The difference between the theoretically and experimentally obtained values of [Cl−]i can be explained by ongoing background diffusion of Cl− through chloride channels and/or by some continuous activity of inward-directed Cl− pumps, opposing the action of KCC2.
NKCC1 does not appear to be involved in creating a positive EGly in immature LSO neurons
Based on our RT-PCR and in situ hybridization results that demonstrate an absence of NKCC1 in the SOC of neonatal rats, we conclude that NKCC1 plays no role in [Cl−]i regulation in immature LSO neurons. Our conclusion contradicts that drawn by Kakazu et al. (1999) in the LSO, who replaced external Na+ to affect Na+-dependent transport and found a shift of EGly toward more negative values in four P3 neurons. The authors therefore reasoned that an Na+-dependent transporter (NKCC or NCC) regulates EGly. However, because neither one of the NKCC isoforms nor NCC appears to be present in the neonatal LSO (Becker et al., 2003; present study), it is possible that the Na+ replacement affected some other mechanism and only indirectly influenced intracellular Cl− regulation. Together, the nature of the inward-directed Cl− transporter in the SOC is still enigmatic.
If not NKCC1, what other transporter may be involved in creating EGly > Vrest in immature LSO neurons? One candidate is the Cl−/HCO3− exchanger AE3, which was described in several neuronal systems (Kobayashi et al., 1994) and is the only secondary active Cl− transporter that is abundantly expressed in the SOC (Becker et al., 2003). Physiological experiments are necessary to additionally clarify this issue.
Can KCC2 act as an inward-directed Cl- transporter in neonatal LSO neurons?
As mentioned above, the direction of K+-Cl− cotransport is determined by the transmembrane gradient for these two ions. It was suggested that KCC2 can operate in reverse and accumulate intracellular Cl− under conditions of an elevated [K+]o (Payne, 1997; Jarolimek et al., 1999; Kakazu et al., 2000). Nevertheless, it is inconceivable that KCC2 acts as an inward-directed Cl− transporter in immature LSO neurons and establishes the high [Cl−]i sufficient for excitatory glycine activity. First, to achieve an average [Cl−]i of 44 mm, which we observed in P3 LSO neurons (Fig. 6), KCC2 would have to encounter a [K+]o in the vicinity of the plasma membrane of at least 46 mm (calculated from Eq. 2 with [K+]i = 140 mm and [Cl−]o = 133.5 mm). In the case of the P3 neuron with the most positive EGly of −12 mV (relating to [Cl−]i = 84 mm), [K+]o would be 88 mm. Although high [K+]o values of up to 60–100 mm have been described under conditions of ischemia (Hansen, 1985) and epileptiform activity (Avoli et al., 1996; Kaila et al., 1997), they do not occur continuously (i.e., over days). They can thus be excluded as a driving force that reverses KCC2 activity to inward-directed such that [Cl−]i is accumulated to ∼50 mm. Second, KCC2 −/− mice at P3 do not display ECl values that differ from those of age-matched wild-type animals (present study) (Fig. 8). If KCC2 were an effective inward-directed Cl− pump at this age, we would have seen a more negative EGly in the −/− mice compared with the controls. Recordings from spinal cord motoneurons revealed that the depolarization amplitude after GABA or glycine application was significantly larger in KCC2 −/− than in wild-type fetuses (Hübner et al., 2001), demonstrating that KCC2 is a Cl− extrusion pump even during the early depolarizing period. Together, it is unlikely that KCC2 is responsible for the high [Cl−]i and excitatory glycine effect in perinatal LSO neurons. On the basis of the above thermodynamic considerations, the same conclusion can be drawn for the three other KCC isoforms KCC1–KCC3 cloned so far (for review, see Delpire and Mount, 2002). In fact, of these three, only the KCC1 gene is weakly expressed in neonatal LSO neurons (Becker et al., 2003).
Functional implications of depolarizing glycine action in the SOC
The depolarizing effect of glycine (and GABA) may promote the morphological maturation of LSO neurons (Friauf and Lohmann, 1999) and play a role in synaptogenesis (Kotak and Sanes, 1996). Both neurotransmitters have neurotrophic effects in immature neurons (Behar et al., 1996; Flint et al., 1998; Kirsch and Betz, 1998). They may exert this effect very early in development, already at a time when the classical excitatory transmitter glutamate is still not very efficient. In fact, during early development of the hypothalamus and spinal cord, GABA is three times more effective than glutamate in eliciting action potentials (Gao and van den Pol, 2001). Dendrites of LSO neurons become more numerable during the depolarizing period, they are pruned thereafter, and the process requires glycinergic neurotransmission (for review, see Sanes and Friauf, 2000). By manipulating the duration of the depolarizing phase of glycine (e.g., through loss-of-function analysis in KCC2 −/− mice), we are now able to analyze the effect of the depolarizing period on the maturation of the synaptic circuitry in the SOC and elsewhere.
In conclusion, this study provides compelling evidence that KCC2 is a central component of Cl− regulation in mature LSO neurons. In contrast, NKCC1 does not appear to play a role in this process during early life when glycine-induced responses are excitatory and structural maturation occurs in the auditory brainstem.
Footnotes
This work was supported by Deutsche Forschungsgemeinschaft Grants Sonderforschungsbereich (SFB) 269 and SFB 530. We thank Dr. Hannah Monyer for help in the initial set up of the single-cell RT-PCR protocol and providing oligonucleotide sequences of NKCC1 and KCC2 for these experiments. We also thank Dr. Eric Delpire for providing KCC2 knock-out mice and his gift of KCC2 antibodies.
Correspondence should be addressed to Dr. Eckhard Friauf, Tierphysiologie, Biologie, Universität Kaiserslautern, Postfach 3049, D-67653 Kaiserslautern, Germany. E-mail: friauf@rhrk.uni-kl.de.
Copyright © 2003 Society for Neuroscience 0270-6474/03/234134-12$15.00/0
References
- Alvarez-Leefmans FJ ( 2001) Intracellular chloride regulation. In: Cell physiology sourcebook: a molecular approach (Sperelakis N, ed), pp 301–318. San Diego: Academic.
- Avoli M, Luvel J, Kurcewicz I, Pumain R, Barbarosie M ( 1996) Extracellular free potassium and calcium during synchronous activity induced by 4-aminopyridine in the juvenile rat hippocampus. J Physiol (Lond) 493: 707–717. [DOI] [PMC free article] [PubMed] [Google Scholar]
- Barker JL, Behar T, Li YX, Liu QY, Ma W, Maric D, Maric I, Schaffner AE, Serafini R, Smith SV, Somogyi R, Vautrin JY, Wen XL, Xian H ( 1998) GABAergic cells and signals in CNS development. Perspect Dev Neurobiol 5: 305–322. [PubMed] [Google Scholar]
- Becker M, Nothwang HG, Friauf E ( 2003) Differential expression pattern of chloride transporters NCC, NKCC2, KCC1, KCC3, KCC4, and AE3 in the developing rat auditory brainstem. Cell Tiss Res, in press. [DOI] [PubMed]
- Behar TN, Li YX, Tran HT, Ma W, Dunlap V, Scott C, Barker JL ( 1996) GABA stimulates chemotaxis and chemokinesis of embryonic cortical neurons via calcium-dependent mechanisms. J Neurosci 16: 1808–1818. [DOI] [PMC free article] [PubMed] [Google Scholar]
- Ben-Ari Y ( 2002) Excitatory actions of GABA during development: the nature of the nurture. Nat Rev Neurosci 3: 728–739. [DOI] [PubMed] [Google Scholar]
- Ben-Ari Y, Tseeb V, Raggozzino D, Khazipov R, Gaiarsa JL ( 1994) Gamma-aminobutyric acid (GABA): a fast excitatory transmitter which may regulate the development of hippocampal neurones in early postnatal life. Prog Brain Res 102: 261–273. [DOI] [PubMed] [Google Scholar]
- Ben-Ari Y, Khazipov R, Leinekugel X, Caillard O, Gaiarsa JL ( 1997) GABAA, NMDA and AMPA receptors: a developmentally regulated “ménage à trois.” Trends Neurosci 20: 532–529. [DOI] [PubMed] [Google Scholar]
- Chen G, Trombley PQ, van den Pol AN ( 1996) Excitatory actions of GABA in developing rat hypothalamic neurones. J Physiol (Lond) 494: 451–464. [DOI] [PMC free article] [PubMed] [Google Scholar]
- Cherubini E, Rovira C, Gaiarsa JL, Corradetti R, Ben-Ari Y ( 1990) GABA mediated excitation in immature rat CA3 hippocampal neurons. Int J Dev Neurosci 8: 481–490. [DOI] [PubMed] [Google Scholar]
- Cherubini E, Martina M, Sciancalepore M, Strata F ( 1998) GABA excites immature CA3 pyramidal cells through bicuculline-sensitive and -insensitive chloride-dependent receptors. Perspect Dev Neurobiol 5: 289–304. [PubMed] [Google Scholar]
- Chomczynski P, Sacchi N ( 1987) Single-step method of RNA isolation by acid guanidinium thiocyanate-phenol-chloroform extraction. Anal Biochem 162: 156–159. [DOI] [PubMed] [Google Scholar]
- Clayton GH, Owens GC, Wolf JS, Smith RL ( 1998) Ontogeny of cation-Cl− cotransporter expression in rat neocortex. Brain Res Dev Brain Res 109: 281–292. [DOI] [PubMed] [Google Scholar]
- DeFazio RA, Keros S, Quick MW, Hablitz JJ ( 2000) Potassium-coupled chloride cotransport controls intracellular chloride in rat neocortical pyramidal neurons. J Neurosci 20: 8069–8076. [DOI] [PMC free article] [PubMed] [Google Scholar]
- Delpire E, Mount DB ( 2002) Human and murine phenotypes associated with defects in cation-chloride cotransport. Annu Rev Physiol 64: 803–843. [DOI] [PubMed] [Google Scholar]
- Ebihara S, Shirato K, Harata N, Akaike N ( 1995) Gramicidin-perforated patch recording: GABA response in mammalian neurones with intact intracellular chloride. J Physiol (Lond) 484: 77–86. [DOI] [PMC free article] [PubMed] [Google Scholar]
- Eccles JC ( 1966) The ionic mechanisms of excitatory and inhibitory synaptic action. Ann NY Acad Sci 137: 473–494. [DOI] [PubMed] [Google Scholar]
- Ehrlich I, Löhrke S, Friauf E ( 1999) Shift from depolarizing to hyperpolarizing glycine action in rat auditory neurons is due to age-dependent Cl− regulation. J Physiol (Lond) 520: 121–137. [DOI] [PMC free article] [PubMed] [Google Scholar]
- Flint AC, Liu X, Kriegstein AR ( 1998) Nonsynaptic glycine receptor activation during early neocortical development. Neuron 20: 43–53. [DOI] [PubMed] [Google Scholar]
- Friauf E, Lohmann C ( 1999) Development of auditory brainstem circuitry: activity-dependent and activity-independent processes. Cell Tissue Res 297: 187–195. [DOI] [PubMed] [Google Scholar]
- Ganguly K, Schinder AF, Wong ST, Poo M ( 2001) GABA itself promotes the developmental switch of neuronal GABAergic responses from excitation to inhibition. Cell 105: 521–532. [DOI] [PubMed] [Google Scholar]
- Gao XB, van den Pol AN ( 2001) GABA, not glutamate, a primary transmitter driving action potentials in developing hypothalamic neurons. J Neurophysiol 85: 425–434. [DOI] [PubMed] [Google Scholar]
- Geiger JR, Melcher T, Koh DS, Sakmann B, Seeburg PH, Jonas P, Monyer H ( 1995) Relative abundance of subunit mRNAs determines gating and Ca2+ permeability of AMPA receptors in principal neurons and interneurons in rat CNS. Neuron 15: 193–204. [DOI] [PubMed] [Google Scholar]
- Gulyás AI, Sík A, Payne JA, Kaila K, Freund TF ( 2001) The KCl cotransporter, KCC2, is highly expressed in the vicinity of excitatory synapses in the rat hippocampus. Eur J Neurosci 13: 2205–2217. [DOI] [PubMed] [Google Scholar]
- Haas M, Forbush B ( 2000) The Na-K-Cl cotransporter of secretory epithelia. Annu Rev Physiol 62: 515–534. [DOI] [PubMed] [Google Scholar]
- Hansen AJ ( 1985) Effect of anoxia on ion distribution in the brain. Physiol Rev 65: 101–148. [DOI] [PubMed] [Google Scholar]
- Helfert RH, Snead CR, Altschuler RA ( 1991) The ascending auditory pathways. In: Neurobiology of hearing: the central auditory system (Altschuler RA, Bobbin RP, Clopton BM, Hoffman DW, eds), pp 1–25. New York: Raven.
- Huang B, Redburn DA ( 1996) GABA-induced increases in [Ca2+]i in retinal neurons of postnatal rabbits. Vis Neurosci 13: 441–447. [DOI] [PubMed] [Google Scholar]
- Hübner CA, Stein V, Hermans-Borgmeyer I, Meyer T, Ballanyi K, Jentsch TJ ( 2001) Disruption of KCC2 reveals an essential role of K-Cl cotransport already in early synaptic inhibition. Neuron 30: 515–524. [DOI] [PubMed] [Google Scholar]
- Jang IS, Jeong HJ, Akaike N ( 2001) Contribution of the Na-K-Cl cotransporter on GABAA receptor-mediated presynaptic depolarization in excitatory nerve terminals. J Neurosci 21: 5962–5972. [DOI] [PMC free article] [PubMed] [Google Scholar]
- Jarolimek W, Lewen A, Misgeld U ( 1999) A furosemide-sensitive K+-Cl− cotransporter counteracts intracellular Cl− accumulation and depletion in cultured rat midbrain neurons. J Neurosci 19: 4695–4704. [DOI] [PMC free article] [PubMed] [Google Scholar]
- Kaila K, Lamsa K, Smirnov S, Taira T, Voipio J ( 1997) Long-lasting GABA-mediated depolarization evoked by high-frequency stimulation in pyramidal neurons of rat hippocampal slice is attributable to a network-driven, bicarbonate-dependent K+ transient. J Neurosci 17: 7662–7672. [DOI] [PMC free article] [PubMed] [Google Scholar]
- Kakazu Y, Akaike N, Komiyama S, Nabekura J ( 1999) Regulation of intracellular chloride by cotransporters in developing lateral superior olive neurons. J Neurosci 19: 2843–2851. [DOI] [PMC free article] [PubMed] [Google Scholar]
- Kakazu Y, Uchida S, Nakagawa H, Akaike N, Nabekura J ( 2000) Reversibility and cation selectivity of the K+-Cl− cotransport in rat central neurons. J Neurophysiol 84: 281–288. [DOI] [PubMed] [Google Scholar]
- Kandler K, Friauf E ( 1995) Development of glycinergic and glutamatergic synaptic transmission in the auditory brainstem of perinatal rats. J Neurosci 15: 6890–6904. [DOI] [PMC free article] [PubMed] [Google Scholar]
- Kelsch W, Hormuzdi S, Straube E, Lewen A, Monyer H, Misgeld U ( 2001) Insulin-like growth factor 1 and a cytosolic tyrosine kinase activate chloride outward transport during maturation of hippocampal neurons. J Neurosci 21: 8339–8347. [DOI] [PMC free article] [PubMed] [Google Scholar]
- Kirsch J, Betz H ( 1998) Glycine-receptor activation is required for receptor clustering in spinal neurons. Nature 392: 717–720. [DOI] [PubMed] [Google Scholar]
- Kobayashi S, Morgans CW, Casey JR, Kopito RR ( 1994) AE3 anion exchanger isoforms in the vertebrate retina: developmental regulation and differential expression in neurons and glia. J Neurosci 14: 6266–6279. [DOI] [PMC free article] [PubMed] [Google Scholar]
- Kotak VC, Sanes DH ( 1996) Developmental influence of glycinergic transmission: regulation of NMDA receptor-mediated EPSPs. J Neurosci 16: 1836–1843. [DOI] [PMC free article] [PubMed] [Google Scholar]
- Krnjevic K ( 1974) Chemical nature of synaptic transmission in vertebrates. Physiol Rev 54: 418–540. [Google Scholar]
- Kullmann PHM, Ene FA, Kandler K ( 2002) Glycinergic and GABAergic calcium responses in the developing lateral superior olive. Eur J Neurosci 15: 1093–1104. [DOI] [PMC free article] [PubMed] [Google Scholar]
- Kyrozis A, Reichling DB ( 1995) Perforated-patch recording with gramicidin avoids artifactual changes in intracellular chloride concentration. J Neurosci Methods 57: 27–35. [DOI] [PubMed] [Google Scholar]
- Lauf PK, Adragna NC ( 2000) K-Cl cotransport: properties and molecular mechanism. Cell Physiol Biochem 10: 341–354. [DOI] [PubMed] [Google Scholar]
- Lu J, Karadsheh M, Delpire E ( 1999) Developmental regulation of the neuronal-specific isoform of K-Cl cotransporter KCC2 in postnatal rat brains. J Neurobiol 39: 558–568. [PubMed] [Google Scholar]
- Luhmann HJ, Prince DA ( 1991) Postnatal maturation of the GABAergic system in rat neocortex. J Neurophysiol 65: 247–263. [DOI] [PubMed] [Google Scholar]
- Maric D, Liu QY, Maric I, Chaudry S, Chang YH, Smith SV, Sieghart W, Fritschy JM, Barker JL ( 2001) GABA expression dominates neuronal lineage progression in the embryonic rat neocortex and facilitates neurite outgrowth via GABAA autoreceptor/Cl− channels. J Neurosci 21: 2343–2360. [DOI] [PMC free article] [PubMed] [Google Scholar]
- Marty S, Berninger B, Carroll P, Thoenen H ( 1996) GABAergic stimulation regulates the phenotype of hippocampal interneurons through the regulation of brain-derived neurotrophic factor. Neuron 16: 565–570. [DOI] [PubMed] [Google Scholar]
- Owens DF, Boyce LH, Davis MBE, Kriegstein AR ( 1996) Excitatory GABA responses in embryonic and neonatal cortical slices demonstrated by gramicidin perforated-patch recordings and calcium imaging. J Neurosci 16: 6414–6423. [DOI] [PMC free article] [PubMed] [Google Scholar]
- Payne JA ( 1997) Functional characterization of the neuronal-specific K-Cl cotransporter: implications for [K+]o regulation. Am J Physiol 273: C1515–C1525. [DOI] [PubMed] [Google Scholar]
- Payne JA, Stevenson TJ, Donaldson LF ( 1996) Molecular characterization of a putative K-Cl cotransporter in rat brain. A neuronal-specific isoform. J Biol Chem 271: 16245–16252. [DOI] [PubMed] [Google Scholar]
- Plotkin MD, Snyder EY, Hebert SC, Delpire E ( 1997) Expression of the Na-K-2Cl cotransporter is developmentally regulated in postnatal rat brains: a possible mechanism underlying GABA's excitatory role in immature brain. J Neurobiol 33: 781–795. [DOI] [PubMed] [Google Scholar]
- Randall J, Thorne T, Delpire E ( 1997) Partial cloning and characterization of Slc12a2: the gene encoding the secretory Na+ -K+ -2Cl− cotransporter. Am J Physiol 273: C1267–C1277. [DOI] [PubMed] [Google Scholar]
- Reichling DB, Kyrozis A, Wang J, MacDermott AB ( 1994) Mechanisms of GABA and glycine depolarization-induced calcium transients in rat dorsal horn neurons. J Physiol (Lond) 476: 411–421. [DOI] [PMC free article] [PubMed] [Google Scholar]
- Rietzel H-J, Friauf E ( 1998) Neuron types in the rat lateral superior olive and developmental changes in the complexity of their dendritic arbors. J Comp Neurol 390: 20–40. [PubMed] [Google Scholar]
- Rivera C, Voipio J, Payne JA, Ruusuvuori E, Lahtinen H, Lamsa K, Pirvola U, Saarma M, Kaila K ( 1999) The K+/Cl− co-transporter KCC2 renders GABA hyperpolarizing during neuronal maturation. Nature 397: 251–255. [DOI] [PubMed] [Google Scholar]
- Russell JM ( 2000) Sodium-potassium-chloride cotransport. Physiol Rev 80: 211–276. [DOI] [PubMed] [Google Scholar]
- Sanes DH, Friauf E ( 2000) Development and influence of inhibition in the lateral superior olivary nucleus. Hear Res 147: 46–58. [DOI] [PubMed] [Google Scholar]
- Serafini R, Valeyev AY, Barker JL, Poulter MO ( 1995) Depolarizing GABA-activated Cl− channels in embryonic rat spinal and olfactory bulb cells. J Physiol (Lond) 488: 371–386. [DOI] [PMC free article] [PubMed] [Google Scholar]
- Singer JH, Berger AJ ( 2000) Development of inhibitory synaptic transmission to motoneurons. Brain Res Bull 53: 553–560. [DOI] [PubMed] [Google Scholar]
- Singer JH, Talley EM, Bayliss DA, Berger AJ ( 1998) Development of glycinergic synaptic transmission to rat brain stem motoneurons. J Neurophysiol 80: 2608–2620. [DOI] [PubMed] [Google Scholar]
- Sun D, Murali SG ( 1999) Na + -K+-2Cl− cotransporter in immature cortical neurons: a role in intracellular Cl− regulation. J Neurophysiol 81: 1939–1948. [DOI] [PubMed] [Google Scholar]
- Sung KW, Kirby M, McDonald MP, Lovinger DM, Delpire E ( 2000) Abnormal GABAA receptor-mediated currents in dorsal root ganglion neurons isolated from Na-K-2Cl cotransporter null mice. J Neurosci 20: 7531–7538. [DOI] [PMC free article] [PubMed] [Google Scholar]
- Vardi N, Zhang LL, Payne JA, Sterling P ( 2000) Evidence that different cation chloride cotransporters in retinal neurons allow opposite responses to GABA. J Neurosci 20: 7657–7663. [DOI] [PMC free article] [PubMed] [Google Scholar]
- Vibat CRT, Holland MJ, Kang JJ, Putney LK, O'Donnell ME ( 2001) Quantitation of Na+-K+-2Cl− cotransport splice variants in human tissues using kinetic polymerase chain reaction. Anal Biochem 298: 218–230. [DOI] [PubMed] [Google Scholar]
- Vu TQ, Payne JA, Copenhagen DR ( 2000) Localization and developmental expression patterns of the neuronal K-Cl cotransporter (KCC2) in the rat retina. J Neurosci 20: 1414–1423. [DOI] [PMC free article] [PubMed] [Google Scholar]
- Williams JR, Sharp JW, Kumari VG, Wilson M, Payne JA ( 1999) The neuron-specific K-Cl cotransporter, KCC2. Antibody development and initial characterization of the protein. J Biol Chem 274: 12656–12664. [DOI] [PubMed] [Google Scholar]
- Wisden W, Morris BJ, Hunt SP ( 1991) In situ hybridization with synthetic DNA probes. In: Molecular neurobiology—a practical approach (Chad J, Wheal H, eds), pp 205–225. Oxford: IRL.
- Woo NS, Lu JM, England R, McClellan R, Dufour S, Mount DB, Deutch AY, Lovinger DM, Delpire E ( 2002) Hyperexcitability and epilepsy associated with disruption of the mouse neuronal-specific K-Cl cotransporter gene. Hippocampus 12: 258–268. [DOI] [PubMed] [Google Scholar]
- Wu WI, Ziskind-Conhaim L, Sweet MA ( 1992) Early development of glycine- and GABA-mediated synapses in rat spinal cord. J Neurosci 12: 3935–3945. [DOI] [PMC free article] [PubMed] [Google Scholar]
- Yan YP, Dempsey RJ, Sun DD ( 2001) Expression of Na+-K+-Cl− cotransporter in rat brain during development and its localization in mature astrocytes. Brain Res 911: 43–55. [DOI] [PubMed] [Google Scholar]
- Yuste R, Katz LC ( 1991) Control of postsynaptic Ca 2+ influx in developing neocortex by excitatory and inhibitory neurotransmitters. Neuron 6: 333–344. [DOI] [PubMed] [Google Scholar]