

Abstract
Nitric oxide (NO) has been implicated in some of the central pathways engaged in the regulation of the sleep–wake cycle. The existence of nitric oxide synthase (NOS) in the cholinergic basal forebrain (BF) cells projecting to the cortex suggests a role for NO in the activation induced by the BF during arousal. We tested, in the anesthetized cat, the hypothesis that inhibition of NOS would decrease the ability of BF cholinergic fibers to induce cortical activation. In control conditions, BF stimulation evoked an awake-like EEG pattern (i.e., a decrease in the low-frequency–high-amplitude oscillatory activity and an increase in the high-frequency–low-amplitude activity). After blocking NOS activity, the capacity of BF stimulation to induce cortical activation was strongly impaired. Furthermore, voltammetric measurements of NO levels revealed an increase in cortical NO after BF stimulation, also blocked by systemic NOS inhibition. These results indicate that the blockade of NOS activity significantly reduces the ability of BF stimulation to induce changes in the EEG pattern and suggest a role for NO in the BF–cholinergic system implicated in arousal mechanisms.
Keywords: basal forebrain, sleep–wake cycle, V1, ACh, nitro-arginine, 7-nitroindazole
Introduction
How does the brain wake up? This question was first addressed by Moruzzi and Magoun (1942), who showed that stimulation of the midbrain reticular formation produced behavioral arousal and EEG desynchronization. They deduced that the difference between waking and sleep was caused by intrinsic activity of these neurons. Evidence now suggests that multiple brainstem and forebrain cell groups participate in the control of arousal, and that no single system appears to be necessary for maintenance of an activated EEG. Two major cell groups use the neurotransmitter acetylcholine (ACh), one localized in the peribrachial region of the brainstem (projecting to the midbrain, regulating thalamic excitability) and the second in the basal forebrain (BF) (projecting to the entire neocortex, giving rise to phasic activation during waking states) (for review, see Steriade et al., 1997). Interestingly, these ACh-containing fibers also contain nitric oxide (NO) synthase (NOS), the enzyme responsible for the production of nitric oxide (Bickford et al., 1993, 1994).
BF neurons participate in the regulation of cortical activity; throughout the sleep–wake cycle, the function of the BF–cortical pathway is complex, and sleep-promoting mechanisms appear to coexist with mechanisms of arousal or activation (Szymusiak and McGinty, 1989, 1994; Szymusiak, 1995; Szymusiak et al., 2000). The portions of the BF involved in the regulation of the sleep–arousal cycle contain groups of cholinergic neurons projecting monosynaptically to the entire neocortex and limbic telencephalon, exerting excitatory effects on target cells. Cholinergic cells are localized in the diagonal band of Broca, the substantia innominata, and the nucleus basalis (NB) of Meynert. The cholinergic cells in the NB, also known as Ch4 neurons (Mesulam et al., 1983), project to most regions of the neocortex (Adams et al., 1986; Boylan et al., 1986) and are implicated in cortical arousal mechanisms and in the control of selective attention (Muir et al., 1994; Perry et al., 1999). In vivo electrical stimulation of the BF enhances cortical ACh release (Casamenti et al., 1986; Kurosawa et al., 1989; Tremblay et al., 1990), eliciting electroencephalographic activation by depolarizing cortical neurons (Metherate et al., 1992; Metherate and Ashe, 1993). The activation of this pathway promotes tonic firing in cortical neurons and generates EEG patterns characteristic of activated behavioral states, switching sleep-like activity (high-amplitude, slow-frequency oscillations) to an awake-like pattern (low-amplitude, fast oscillations). Indeed, when this pathway is blocked by lesions, the lack of ACh is associated with a decrease in cortical activation (LoConte et al., 1982; Stewart et al., 1984). The evidence now suggests, therefore, that the BF-activating system works by bringing together the function of ACh and NO, a cooperation that also occurs in the brainstem, ascending pathways implicated in arousal regulation, in which NOS is specifically colocalized with the cholinergic brainstem–thalamic system (Pape and Mager, 1992; Bickford et al., 1993; Cudeiro and Rivadulla, 1999). NO is now considered an important modulator of neuronal function (Garthwaite and Boulton, 1995) and has been implicated in the responsiveness of visual cortical neurons (Cudeiro et al., 1997). Recent evidence also indicates that NO may be involved in cortical activation, disrupting slow oscillations and promoting tonic firing of neurons (Nistico et al., 1994; Cudeiro et al., 2000). In the present work, we studied the role of NO in cortical arousal induced by the cholinergic–BF system. We hypothesized that if NO is implicated in this activating system, we should be able to modify the effect of BF stimulation on cortical activity by manipulating NO levels through NOS inhibition.
Materials and Methods
Experiments were performed on 11 adult cats of either sex. Anesthesia was induced with ketamine (10–20 mg/kg, i.m.) and maintained with α-chloralose (60 mg/kg, i.v.; n = 5) or ketamine–xylazine (10–15 mg/kg and 2–3 mg, i.m.; n = 6). Animals were paralyzed (pancuronium bromide, 1 mg · kg−1 · hr−1, i.v.) and artificially ventilated; the end-tidal CO2 concentration was adjusted to 4%, body temperature was maintained at 37–38°C, and heart rate was continuously monitored. Animals were suspended on a stereotaxic frame, and the pressure points were infiltrated with lidocaine. The depth of anesthesia was maintained by additional doses of α-chloralose or ketamine–xylazine, and particular care was taken to keep a stable pattern of slow oscillatory activity throughout the entire experiment. Four craniotomies were performed to insert recording as well as stimulating electrodes, and all exposed cortical surfaces were bathed in mineral oil or saline to prevent desiccation. The procedures conformed to the Spanish Physiology Society and the International Council for Laboratory Animal Science and the European Union (statute 86/809).
Cortical recordings. Cortical activity was continuously monitored using two different methods. Focal activity, or electrocorticogram (ECoG), was recorded through electrodes (FHC, Bowdoinham, ME) implanted in the primary somatosensory (S1; coordinates: anterior, 21–23; lateral, 8–10) and visual (V1; posterior, 0–4; lateral, 1–2) cortices at a depth of 1–1.5 mm. In addition, in three experiments, surface electrodes for EEG recording were placed on the skull at frontal, parietal, and occipital areas.
Electrical stimulation. BF neurons were activated by electrical micro-stimulation at intervals of 5–10 min. Trains of rectangular cathodal shocks (0.05 msec, 0.1–1 mA) were delivered at a frequency of 50 Hz for a period of 2–4 sec through a bipolar electrode (insulated except for 500 μm at the tip; contacts separated by 500 μm) stereotaxically placed at the following Horsley–Clark coordinates: anterior, 10–13; lateral, 8.5–10; ventral, −1–0. The final position in the vertical axis was adjusted by stimulating at 0.5 Hz during insertion of the electrode while monitoring the evoked potential recorded through the recording electrodes previously placed in S1 (Fig. 1 A). The first clear signal to appear was the field potential evoked from the internal capsule, which had a fast first component, with a latency to the peak of ∼3–4 msec [Tremblay et al. (1990), their Fig. 1]. This potential disappeared as the electrode was advanced (typically 3–4 mm above BF region), and a slower waveform, with a latency of 8–10 msec, appeared when stimulating around BF stereotaxic coordinates. In addition, to better localize the optimal position inside the BF, in four experiments we inserted an array of three stimulating bipolar electrodes positioned mediolaterally at 500 μm separation. In all cases, the current was adjusted to obtain the minimum intensity capable of evoking a cortical activation. Usually, stimulating for 2 sec with an intensity of 0.5 mA was enough to achieve the desired effect. Subsequently, to guarantee an adequate effect on EEG activity throughout the entire experiment, we decided to apply a “suprathreshold” stimulation of 4 sec duration without increasing the intensity. Repetitive electrical stimulation over several hours may cause electrolytic lesions, reducing the effect of the stimulus. This was not the case, however, for the stimulus parameters used in this study. It is possible to obtain some cortical activation by means of current spread to the internal capsule, which could have interfered in our results. We tested for this possible artifact in one control experiment in which we examined the ability to evoke cortical activation along the entire descending track with various current intensities. After adjusting the intensity to evoke cortical activation from the BF, the stimulation effect changed significantly ∼4 mm above the BF site, and more than twice the initial intensity was required to evoke some EEG activation. This indicates the high power of BF neurons to influence cortical activity through their highly widespread connections, compared with the more focal targets of axons running through a local region of the internal capsule. Thus, BF stimulation provided us with a very reliable tool for switching cortical activity. To verify the stimulation site histologically, positive current (100 μA, 20 sec) was passed through the stimulation electrode at the end of the experiment. Animals were perfused with normal saline followed by 4% paraformaldehyde. Transverse 60 μm frozen sections were cut, serially mounted, and stained with cresyl violet; the location of the electrode was then determined. Reconstruction of the electrode tracks (Fig. 1 B) revealed that the tips were located in the BF, where cholinergic cells projecting to the cerebral cortex in the cat have been described previously (for comparison, see Bickford et al., 1994).
Figure 1.

A, Field potentials recorded in S1 evoked by electrical stimulation through a bipolar electrode while it was advanced from the cortical surface toward the BF. See Materials and Methods for details. The arrow and the vertical line indicate the beginning of the electrical stimulation. B, Histological localization of BF stimulation sites. The coronal section shows a lesion made trough the stimulation electrode. Vertical dotted lines mark the track of the bipolar electrode. The open circled area signals the location of the electrode tips. AC, Anterior commissure; CA, caudate; CC, corpus callosum; CL, claustrum; F, fornix; GP, globus pallidus; IC, internal capsule; OC, optic chiasm.
Pharmacological manipulation. After 60–90 min of control recordings, during which BF stimulation induced clear and reproducible cortical activation, we administered one of two NOS inhibitors. In four experiments (two performed under ketamine–chloralose and two under ketamine–xylazine), NG-nitro-L-arginine (L-NOArg, which blocks both isoforms of NOS) was locally applied (30 mm, 0.5 μl) by microinjection using a 0.5 μl Hamilton syringe. l-NOArg was dissolved in saline and injected over a period of ∼40 sec. We injected at four sites, at 1 mm depth, 1–2 mm around the S1 recording electrode. In seven experiments (three using ketamine–chloralose and four using ketamine–xylazine), we used the specific neuronal NOS (nNOS) inhibitor 7-nitroindazole (7-NI) (80 mg/kg, i.p., which must be suspended in peanut oil) (Burlet et al., 1999). The injected volume was 6 ml. The possible effects of vehicle were tested in two animals in the opposite hemisphere to the l-NOArg injections. All of the chemicals were purchased from Sigma–Aldrich (Madrid, Spain).
Voltammetric recordings. Two experiments were devoted to the measurement of cortical NO release using voltammetric techniques, in which NO release is monitored using an electrochemical method, as described previously (Escrig et al., 1999). Briefly, the procedure derives from the approach first described by Malinski and Taha (1992). It is on the basis of the catalytic oxidation of NO on polymeric metalloporphyrins. Differential normal pulse voltammetry (DNPV) with carbon fiber microelectrodes covered with a polymeric porphyrin film and coated with a perflourinated polyacid with cation exchange properties (Nafion) was performed. Voltammetric recordings were made with a microprocessor-controlled pontentiostat system (Bioelectrochemical Analyser; University of La Laguna, Tenerife, Spain). The following DNPV parameters were used: potential range, −100–1000 mV; scan rate, 10 mV/sec; pulse amplitude, 40 mV; pulse duration, 40 msec; and prepulse duration, 50–120 msec. Under these conditions, NO solutions show an oxidation peak at ∼650 mV. To measure NO release, electrodes were gently placed on top of the cortex with a micromanipulator and slowly lowered at a depth of 500 μm. NO electrodes were placed in the vicinity of the recording electrode (2–3 mm apart).
Data acquisition and analysis. ECoG activity was stored unfiltered on videotape as well as filtered (0.1–100 Hz) on a hard disk through a Digi-data 1200A board (Axon Instruments, Foster City, CA). EEG activity was acquired and stored using hardware and software from ATI (Lermed, Argentina).
In all experiments, the power spectrum relationship of recorded cortical activity was calculated for periods of 5–10 sec immediately before and after BF electrical stimulation. ECoG recordings were analyzed using in-house software written in Matlab. Calculation of the fast Fourier transform (FFT) of ECoG activity was used to obtain the power spectrum estimate of data sequences. We used Welch's averaged periodogram method: nonoverlapping sections of data were windowed (Hanning window with 1024 or 4096 points) and zero padded to the selected length (1024 or 4096). The resulting squared magnitudes of the sections were averaged to form the power spectrum. The statistical significance of the pharmacologically induced changes was determined using the following paradigm: After a period in which baseline NO release was observed and stabilized, electrical stimulation was repeated on a fixed time schedule, with observations just before; 15 sec after; and ∼2, 4, and 6 min after each stimulation. With this paradigm, under control conditions, a clear increase in NO was seen at 15 sec immediately after stimulation, falling back to prestimulation levels by 6 min (see Fig. 5). For statistical analysis, prestimulation and poststimulation observations for each animal were compared using the Wilcoxon paired test for each of the predrug and postdrug periods. p < 0.01 was considered statistically significant.
Figure 5.

NO cortical levels as measured by voltammetry (representative sample). A, A 2 hr period of continuous recording in one animal is shown. Each arrow signals those data points preceded by BF stimulation (50 Hz/5 sec, ∼15 sec before the NO signal). This segment of the trace is representative of the data set as a whole, and clearly demonstrates the shift in NO release (basal and stimulated) after 7-NI administration. B, Representative voltammograms before and after BF stimulation.
Results
BF stimulation produced changes on cortical activity
Anesthesia induced sleep-like oscillatory activity that could be modified through electrical stimulation of the BF, giving rise to a change in the ECoG: Activity shifted from a high-amplitude–low-frequency to a low-amplitude–high-frequency activity or awake-like pattern. This result was obtained either with α-chloralose or with ketamine as the anesthetic agent. The evoked awake-like pattern persisted for a variable period of time, usually lasting from 2 to 20 sec. Figure 2 is an example of the effect evoked by stimulation in the BF. We show here the spontaneous ECoG activity simultaneously recorded through intracranial electrodes placed in the S1 and V1 and the effect obtained when the BF region was stimulated (the horizontal bar indicates the period of BF stimulation). ECoG activity changed dramatically to the awake-like state.
Figure 2.

ECoG activity simultaneously recorded in the S1 and V1 under control conditions (left) and after electrical stimulation (right) of the BF. The stimulation of the BF for 4 sec (horizontal line) produced a change in ECoG from a sleep-like to a wake-like pattern. In the experiments presented in this work, we compare this cortical modulation with the activity obtained after blocking of NO production.
To test the hypothesis that these effects were attributable to activation of cholinergic neurons produced by our BF stimulation, in one cat, we repeated the same protocol before and after systemic administration (0.5 mg/kg) of atropine (Szymusiak et al., 1990). As has been demonstrated previously, in the control situation, BF stimulation produced a clear change in the ECoG activity recorded in both the primary visual cortex and somatosensory cortex. This effect is completely abolished when stimulation is performed after atropine injection (data not shown).
Inhibition of NOS activity altered the effects of BF stimulation
In an initial set of experiments (n = 4), we attempted to study the effect of local blockade of cortical NO production on ECoG activity during BF stimulation. An example of the data is shown in Figure 3, in which a segment of ECoG and the derived power spectrum are illustrated under control conditions, after l-NOArg application, and after recovery. Figure 3B represents the power spectrum obtained immediately after BF stimulation, as marked by a horizontal line over the ECoG traces. The power spectrum before stimulation (Fig. 3A) indicates the predominance of low-frequency–high-amplitude oscillatory activity, which, during the control period, was abolished and shifted toward high-frequency–low-amplitude activity after BF stimulation (Fig. 3B, control). Low amplitude is an inherent feature of high-frequency brain activity, because of the widespread neural desynchronization, and is reflected in low power values in the frequency/power histograms. Therefore, to reveal changes in the range of high frequencies, we subtracted the power spectrum data before BF stimulation from the power spectrum after it. The results obtained are shown in Figure 3C and reveal that under control conditions (Fig. 3C, control), there is a clear increase in high frequencies of ∼40 Hz. Local microinjections of the NOS inhibitor l-NOArg in S1 clearly reduced the ability of BF stimulation to shift the ECoG toward awake-like parameters: The ECoG and the power spectrum (l-NOArg column) reflected the persistence of low-frequency activity after BF stimulation (Fig. 3B) but failed to show high-frequency activity (Fig. 3C). This effect was seen 10–15 min after injection and returned to normal conditions after 45–60 min (Fig. 3, recovery). Application of saline did not modify the effect of BF stimulation (data not shown).
Figure 3.

Power spectrum histograms obtained from periods of 5 sec of activity recorded in S1 under control conditions, after local injection of l-NOArg, and after recovery. The lines above the ECoG records indicate the periods of the recordings taken for this analysis: 1, Before stimulation; 2, after stimulation. A, Normalized power spectrum histograms computed immediately before electrical stimulation. B, Power spectrum histograms computed immediately after electrical stimulation in the BF. The slow sleep-like oscillations disappear except during the l-NOArg application (middle record). C, Histograms computed after subtracting the activity in A from the activity in B. This reveals more clearly that the high-frequency activity elicited under normal conditions by BF stimulation did not appear under the effect of l-NOArg.
Inhibition of neuronal NOS by 7-nitroindazole prevented changes in ECoG activity produced by BF stimulation
The systemic application of 7-NI strongly diminished the capacity of BF to modulate cortical activity. Again, this effect was obtained regardless of the type of anesthetic used. Figure 4 (control) shows an example of the switch from sleep-like (Fig. 4A) to awake-like (Fig. 4B) ECoG activity by means of BF stimulation. In all experiments (n = 7), after 15–40 min of 7-NI application, BF stimulation was not able to modulate cortical activity (Fig. 4, 35 min after 7-NI). The injection of the vehicle alone did not induce any change in the control ECoG activity or in the effect induced by BF stimulation (data not shown).
Figure 4.

ECoG recordings from S1 under control conditions (left) and 35 min after intraperitoneal injection of 7-NI (right). A, A 10 sec recording epoch made immediately before BF stimulation. B, A 10 sec recording epoch made immediately after BF stimulation.
To further confirm that the observed lack of effect of BF stimulation was because of inhibition of NO production, we recorded cortical levels of NO in two cats. The recording of NO by voltammetry indicated an increase in the release of NO after BF stimulation under control conditions. This is illustrated in Figure 5A, in which we show 2 hr of continuous NO recording extracted from a single experiment. Each “arrowed” point represents an NO measurement in which the BF was stimulated (at 50 Hz for 5 sec) ∼15 sec before the NO signal (which appears at 650 mV) was expected. After 7-NI injection (dotted line), the same protocol was used, and ∼40 min later, BF stimulation was unable to increase the levels of NO. NO data in control (n = 15 paired observations; prestimulation and poststimulation) versus NO after 7-NI injection (n = 15) were statistically significant (p < 0.01). Figure 5B shows two superimposed single voltammetric traces. The BF stimulation increased the NO signal. The blockade of NOS by 7-NI eliminated this effect and also reduced baseline levels of NO. These results, obtained in two cats, indicate that BF stimulation is actually inducing an increase in NO (∼26%), and that this release may be reduced by systemic application of 7-NI. Figure 6 shows the results for each of the two animals, demonstrating the significant NO release induced by BF stimulation before administration of 7-NI and the loss of such release after drug administration. The clear drop in baseline NO release is also evident.
Figure 6.
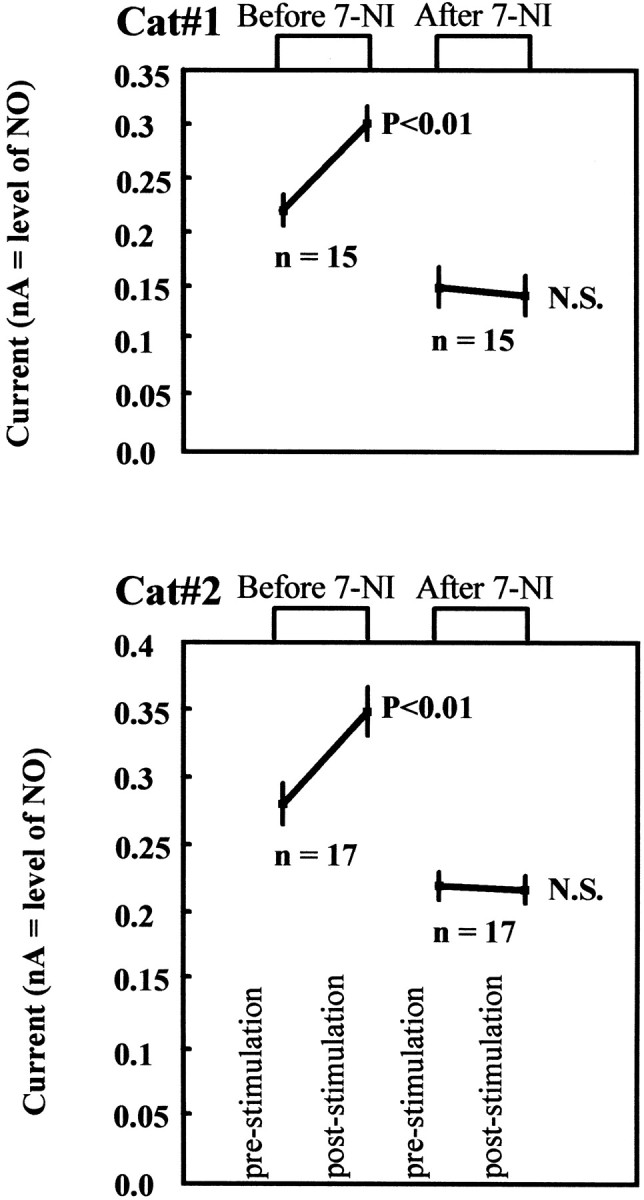
NO cortical levels as measured by voltammetry (full data set). The panels show the mean ± SD of all data points recorded over the 8 hr of the experiment in two cats. Data were obtained under two different conditions, before and after intraperitoneal application of 7-NI. For each condition, the values immediately before electrical stimulation were compared with those obtained immediately after stimulation. The observed changes are statistically significant (Wilcoxon test; p < 0.01) only for the predrug condition.
To better illustrate the effect of 7-NI on cortical activation, Figure 7 shows the variations obtained during a prolonged experimental period (90 min). The figure shows time–power representations, divided into low and high ECoG frequencies for clarity. In each part of the figure, the top illustrates the control situation (without BF stimulation), and the bottom illustrates the data obtained with BF stimulation. The arrow marks the time of the intraperitoneal injection of 7-NI. For low frequencies, the injection of 7-NI had no effect in the control situation, and the predominant δ activity of ∼2 Hz observed remains generally unchanged (Fig. 7, low frequency, top). This dominant slow activity was abolished by BF stimulation (Fig. 7, bottom, 0–22 min), which evoked high-frequency activity of ∼35 Hz (Fig. 7, high frequency, bottom). However, the injection of 7-NI (arrows) produced a clear suppression of the effectiveness of BF stimulation. This is already evident ∼15 min after 7-NI injection (minute 34) and became most evident from approximately minute 45–65. The ability of BF stimulation to desynchronize the ECoG disappeared after NOS blockade. This is also illustrated at the bottom, in which high frequencies are represented. In controls, the injection of 7-NI did not produce any effect but severely affected the changes obtained with BF stimulation (bottom). The inset shows two representative traces, one for the control situation (top) and the other 50 min after injection of 7-NI (the horizontal line indicates BF stimulation).
Figure 7.
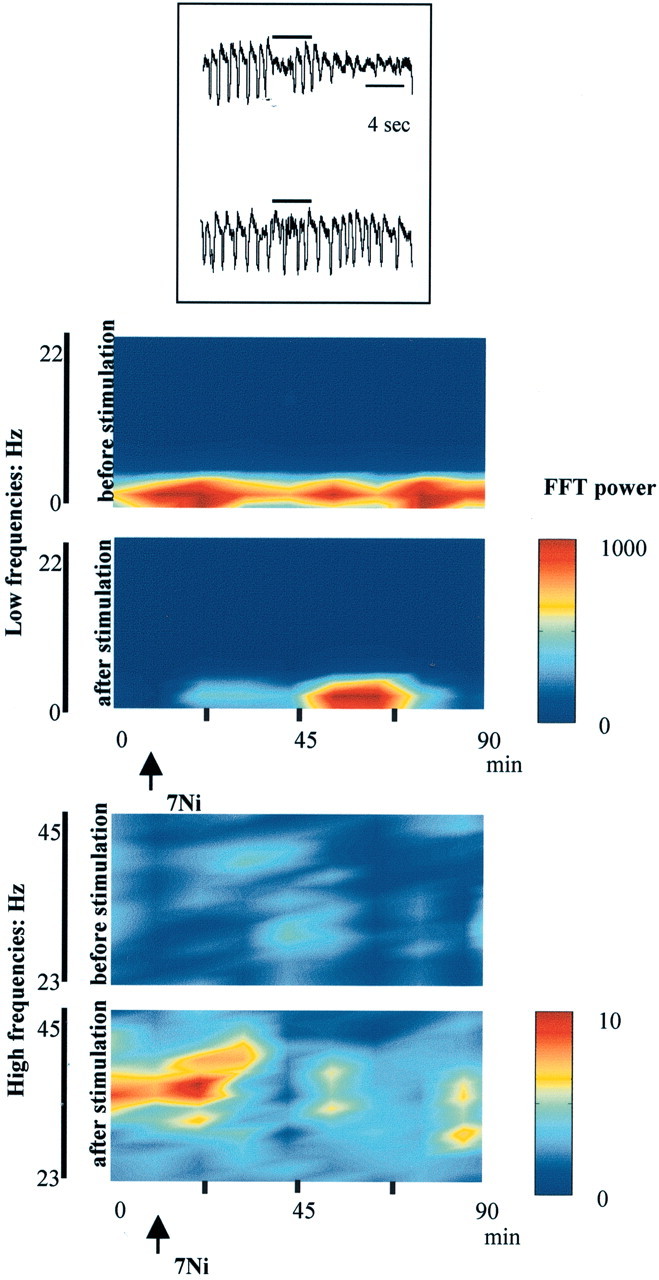
Time–power relationships throughout 90 min for the frequencies 0–22 Hz (top) and 23–45 Hz (bottom). The graph was computed taking intervals of 10 sec of activity every 10 min and calculating the FFT for every interval. The resulting color-grid was smoothed using an interpolation function. The color bar was adjusted to the power scale. The inset shows two representative traces: control situation (top) and the effect of 7-NI (50 min after injection). Horizontal bars illustrate BF stimulation. See Results for additional details.
Figure 8 indicates the mean changes observed throughout the experiment shown in Figure 7. Power-spectrum histograms were made computing the mean values of six samples (60 min) before (control) and after 7-NI application. Data for low and high frequencies are depicted in different histograms. Typically, the switch in cortical activity was statistically significant for the most prominent low and high frequencies (in this example, ∼2 and 35 Hz, respectively), but this modulatory function of BF was impaired when NOS was blocked (Fig. 7) (after 7-NI).
Figure 8.

Power-spectrum histograms representing the mean of six consecutive samples. Black bars correspond to FFT power values computed before BF stimulation, whereas white bars are the values calculated immediately after stimulation. The differences obtained under control conditions are significant (p < 0.01) for the most prominent low ranges (1.5–6 Hz; 12–15 Hz, the spindle range, with expanded view in the inset) and high frequencies (gamma range), whereas after 7-NI, the changes evoked by BF stimulation were not significant except for 3 Hz (note, however, in this case, p < 0.05).
A summary of our findings is shown in Figure 9. Here, we represent the percentage change in the FFT power obtained after BF electrical stimulation. We have grouped the results into six frequency ranges. In the control situation, low frequencies are clearly reduced and high frequencies are enhanced (the strongest effect was detected in the gamma range). These effects are strongly diminished in the presence on 7-NI.
Figure 9.

Summary of the results. The plots show the percentage change in FFT power after BF stimulation. The data are means ± SEM from six experiments. Only changes obtained in the control situation are statistically significant.
Discussion
In recent years, the proposed functional role(s) of the BF has expanded in tandem with increased knowledge of its anatomy and neurochemistry. This diffuse group or set of groups of cells was originally considered to be the cholinergic arousal system for the cerebral cortex. More recent evidence suggests multiple cell types: not only cholinergic, but also a high proportion of GABAergic cells, many using an excitatory amino acid neurotransmitter (Semba, 2000). These cells are intimately interspersed throughout an elongated bilateral structure that begins medially at its rostral pole, extending laterally more caudally. Cells may project to the cerebral cortex, but some may also project locally. In their projection to the cortex, some authors suggest that cells may project over wide areas, whereas others suggest more restricted terminations (Zaborszky et al., 1999; Semba, 2000), which may in fact reflect multiple roles for the various components of this heterogeneous structure. Acetylcholine has been implicated in the transition from sleep to wake, but recently, an active role in the promotion and maintenance of sleep has also been proposed, as well as involvement in attention, motivation, and learning (for review, see Zaborszky et al., 1999; Semba, 2000; Sarter and Bruno, 2000). Despite this near-exponential expansion in proposed functions, one facet has remained relatively unchanged: the role of the BF in arousal, mediated via ACh release within the cortex, enhancing cell responsiveness and increasing signal-to-noise ratios, shifting the cortex from the classical sleep slow-wave EEG pattern to the desynchronized waveform of wake and arousal. The high concentration of cholinergic cells of the Ch4 group at the caudal end of the structure makes this the logical target for the experimental paradigms we have reported above. As expected, electrical stimulation of this region resulted in a shift in recorded EEG, or ECoG, from slow-wave activity to desynchronous, higher frequency, low-amplitude spectra, as shown, for example, in Figure 2. Interestingly, our electrical stimulation paradigm induced such changes in widespread cortical regions (S1 and V1, simultaneously). However, we should not suggest too much about the nonspecificity exhibited (our stimulation parameters were chosen to maximize activation to test a simple hypothesis); i.e., that some component of this arousal was mediated by the gaseous neurotransmitter NO.
In the cerebral cortex, neuronal NO may arise from two main sources: BF terminals (Bickford et al., 1994) and cortical cells containing NOS (Dawson et al., 1991; Vincent and Kimura, 1992). It is widely accepted that the BF terminals play key roles in cortical activation (Perry et al., 1999) and in conveying ascending activation from the brainstem to the neocortex (Szymusiak et al., 2000). Furthermore, the physiological role of the BF ascending system covers several fronts, and these neurons have been ascribed a variety of behavioral functions, including learning and memory (Bartus et al., 1982; Fibiger, 1991), sensory processing (Metherate and Ashe, 1993; Sarter and Bruno, 1997), attention (Muir et al., 1994; Perry et al., 1999), and control of cortical EEG patterns (Detari et al., 1999). In fact, it has been reported that in atropine-treated cats, the EEG becomes synchronized during quiet waking, with the spectral profile identical to that of non-rapid-eye-movement sleep (Szymusiak et al., 1990). More importantly to our study, NOS is colocalized with ACh in BF terminals (Bickford et al., 1994). This enzyme can exist in a number of isoforms (Bredt and Snyder, 1994), of which one, nNOS, is specific to neurons. We tested the effectiveness of the NOS inhibitor l-NOArg in altering cortical arousal at a local level, by intracortical injection close to an ECoG recording electrode, and such injections clearly heavily suppressed the ability of BF stimulation to change the recorded ECoG. This suppression was attributable to application of the inhibitor, vehicle alone was ineffective, and activation of the V1 site was unchanged by injections around S1 (data not shown). However, l-NOArg is a nonspecific inhibitor of NOS (blocking both the nNOS and endothelial NOS isoforms), and the effects described could be the result of, for example, local blood-flow shifts or other non-neuronal changes induced by blockade of other isoforms of NOS. To examine this more specifically, we used 7-NI, considered to be a relatively selective inhibitor for nNOS in vivo, a compound that is not water-soluble and therefore was given intraperitoneally in peanut oil (for review, see Moore and Handy, 1997). Because the effect was essentially the same (although seen at both recording sites), we are confident that the local application acted via nNOS within the cortex. At this point, a note of caution must be introduced, because it has been reported in mice and rats that 7-NI also acts as a monoaminoxidase inhibitor (Di Monte et al., 1997; Desvignes et al., 1999). Although in the primary visual cortex, noradrenaline has been related to specific modulation of visual responses and plasticity, rather than having a more general modulatory effect (as we claim here for NO), we cannot completely disregard the possibility of another type of 7-NI-mediated action, different from nNOS blockade.
The effect we describe here may be mediated directly through an action of NO on cortical cells or via a secondary action mediated through Ach. Our methods cannot distinguish between these options. In several systems, it has been reported that NO modulates ACh release; in fact, in a recent paper, it was clearly shown that at the level of the BF, inhibition of NO synthesis resulted in an increase in ACh release (Vazquez et al., 2002), although a similar experiment in a different neural structure, the pontine reticular formation, produced opposite results (Leonard and Lydic, 1997). These results emphasize, as we have stated, the importance of taking into account the site of drug action within the brain. In this scenario, NO production after BF stimulation (either produced experimentally or, for instance, during arousal) would lead to ACh release, both directly and via an NO-mediated pathway. Another explanation for the action of NO seen here is a straightforward modulation of the cGMP secondary messenger system. Such cGMP modulation has been widely reported in a number of brain systems, including the cat visual cortex (Cudeiro et al., 1997). Because of its gaseous nature, NO can affect the activity of a relatively large neuronal population by local diffusion, thus being an ideal substance for the activation of an extensive cortical volume, and also affecting the thalamus by means of extensive corticofugal connections. Thus, the combination of NO and ACh would produce a widespread tonic excitation during the shift from sleep to wake states. This arousal function is probably different from the excitation induced during active waking, because during this attentional process, the BF neurons are controlled differently (i.e., these cells receive different afferent regulation, depending on the behavioral state), mediated by the brainstem ascending systems during arousal and by their telencephalic afferents during attentional functions (Sarter and Bruno, 2000). A similar collaboration between ACh and NO seems to operate subcortically. For example, at the level of the dorsal lateral geniculate nucleus, the transmission of visual information is enhanced by the release of both ACh and NO from parabrachial terminals (Cudeiro and Rivadulla, 1999); NO actively cooperates with ACh, greatly increasing the activation of the visual pathway (Cudeiro et al., 1994, 1996, 1997).
We have demonstrated previously that local application of the NO donor diethylamine-NO or application of 8-bromo-cGMP (the permeable analog of cGMP), although inducing potent excitation, disrupts the rhythmic activity of cortical neurons (Cudeiro et al., 2000). Similarly, local NOS blockade decreased the cell firing rate without enhancing rhythmic behavior, indicating that although NO enhances excitability, at the levels found in the anesthetized animal, it is not involved in the generation or maintenance of the powerful oscillatory activity produced by thalamo–cortico–thalamic networks. In fact, in the present study, systemic inhibition of NOS, although significantly lowering cortical NO levels, did not affect cortical slow oscillatory activity. In conclusion, therefore, we propose that NO release during the activation of BF ascending fibers is implicated in the regulation of sleep–wake states, promoting the switch from the slow oscillations characteristic of sleep to the high-frequency tonic activity that occurs during arousal and the awake state. This suggestion is also supported by the finding that in rats, the highest NO signal measured in the sleep–wake cycle occurs during the waking state (Burlet and Cespuglio, 1997; Cespuglio et al., 1998), and that NOS inhibition reduces wakefulness (Dzoljic and De Vries, 1994). The very nature of NO, a highly diffusible neuro-modulator thought to be able to influence >2 million synapses from a single point source (Wood and Garthwaite, 1994), suggests a powerful, global system to wake up the brain, the dysfunction of which might be related to sleep disorders.
In conclusion, we propose that NO collaborates with ACh, after the activation of BF ascending fibers, and induces the switch from the slow oscillations characteristic of sleep to the high-frequency tonic activity that occurs in arousal and during the waking condition. The mechanism by which NO interacts with the cholinergic system at this level still remains unclear.
Footnotes
This work was supported by Comisión Interministerial de Ciencia y Tecnología (PB1998-0179), Spain. We thank A. Canedo for technical support and Drs. Luis Martínez, Casto Rivadulla, and James Schummers for comments on a previous version of this manuscript. We thank Kenneth Grieve for his suggestions and corrections on the final version.
Correspondence should be addressed to Javier Cudeiro, Facultad de Ciencias de la Salud, Department Medicina, Campus de Oza, 15006 A Coruña, Spain. E-mail: jcud@udc.es.
Copyright © 2003 Society for Neuroscience 0270-6474/03/234299-09$15.00/0
References
- Adams CE, Cepeda C, Boylan MK, Fisher RS, Hull CD, Buchwald NA, Wainer BH, Levine MS ( 1986) Basal forebrain neurons have axon collaterals that project to widely divergent cortical areas in the cat. Brain Res 397: 365–371. [DOI] [PubMed] [Google Scholar]
- Bartus RT, Dean RL, Beer B, Lippa AS ( 1982) The cholinergic hypothesis of geriatric memory dysfunction. Science 217: 408–414. [DOI] [PubMed] [Google Scholar]
- Bickford ME, Gunluk AE, Guido W, Sherman SM ( 1993) Evidence that cholinergic axons from the parabrachial region of the brainstem are the exclusive source of nitric oxide in the lateral geniculate nucleus of the cat. J Comp Neurol 334: 410–430. [DOI] [PubMed] [Google Scholar]
- Bickford ME, Gunluk AE, Van Horn SC, Sherman SM ( 1994) GABAergic projection from the basal forebrain to the visual sector of the thalamic reticular nucleus in the cat. J Comp Neurol 348: 481–510. [DOI] [PubMed] [Google Scholar]
- Boylan MK, Fisher RS, Hull CD, Buchwald NA, Levine MS ( 1986) Axonal branching of basal forebrain projections to the neocortex: a double-labeling study in the cat. Brain Res 375: 176–181. [DOI] [PubMed] [Google Scholar]
- Bredt DS, Snyder SH ( 1994) Nitric oxide: a physiologic messenger molecule. Annu Rev Biochem 63: 175–195. [DOI] [PubMed] [Google Scholar]
- Burlet S, Cespuglio R ( 1997) Voltammetric detection of nitric oxide (NO) in the rat brain: its variations throughout the sleep-wake cycle. Neurosci Lett 226: 131–135. [DOI] [PubMed] [Google Scholar]
- Burlet S, Leger L, Cespuglio R ( 1999) Nitric oxide and sleep in the rat: a puzzling relationship. Neuroscience 92: 627–639. [DOI] [PubMed] [Google Scholar]
- Casamenti F, Deffenu G, Abbamondi AL, Pepeu G ( 1986) Changes in cortical acetylcholine output induced by modulation of the nucleus basalis. Brain Res Bull 16: 689–695. [DOI] [PubMed] [Google Scholar]
- Cespuglio R, Burlet S, Faradji-Prevautel H ( 1998) 5-Hydroxyindoles compounds and nitric oxide voltammetric detection in the rat brain: changes occurring throughout the sleep-wake cycle. J Neural Transm 105: 205–215. [DOI] [PubMed] [Google Scholar]
- Cudeiro J, Rivadulla C ( 1999) Sight and insight: on the physiological role of nitric oxide in the visual system. Trends Neurosci 22: 109–116. [DOI] [PubMed] [Google Scholar]
- Cudeiro J, Rivadulla C, Rodriguez R, Martinez-Conde S, Acuna C, Alonso JM ( 1994) Modulatory influence of putative inhibitors of nitric oxide synthesis on visual processing in the cat lateral geniculate nucleus. J Neurophysiol 7: 146–149. [DOI] [PubMed] [Google Scholar]
- Cudeiro J, Rivadulla C, Rodriguez R, Martinez-Conde S, Martinez L, Grieve KL, Acuna C ( 1996) Further observations on the role of nitric oxide in the feline lateral geniculate nucleus. Eur J Neurosci 8: 144–152. [DOI] [PubMed] [Google Scholar]
- Cudeiro J, Rivadulla C, Rodriguez R, Grieve KL, Martinez-Conde S, Acuna C ( 1997) Actions of compounds manipulating the nitric oxide system in the cat primary visual cortex. J Physiol (Lond) 504: 467–478. [DOI] [PMC free article] [PubMed] [Google Scholar]
- Cudeiro J, Rivadulla C, Grieve KL ( 2000) A possible role for nitric oxide at the sleep/wake interface. Sleep 23: 829–835. [PubMed] [Google Scholar]
- Dawson TM, Bredt DS, Fotuhi M, Hwang PM, Snyder SH ( 1991) Nitric oxide synthase and neuronal NADPH diaphorase are identical in brain and peripheral tissues. Proc Natl Acad Sci USA 88: 7797–7801. [DOI] [PMC free article] [PubMed] [Google Scholar]
- Desvignes C, Bert L, Vinet L, Denoroy L, Renaud B, Lambas-Senas L ( 1999) Evidence that the neuronal nitric oxide synthase inhibitor 7-nitroindazole inhibits monoamine oxidase in the rat: in vivo effects on extracellular striatal dopamine and 3,4-dihydroxyphenylacetic acid. Neurosci Lett 261: 175–178. [DOI] [PubMed] [Google Scholar]
- Detari L, Rasmusson DD, Semba K ( 1999) The role of basal forebrain neurons in tonic and phasic activation of the cerebral cortex. Prog Neurobiol 58: 249–277. [DOI] [PubMed] [Google Scholar]
- Di Monte DA, Royland JE, Anderson A, Castagnoli K, Castagnoli Jr N, Langston JW ( 1997) Inhibition of monoamine oxidase contributes to the protective effect of 7-nitroindazole against MPTP neurotoxicity. J Neurochem 69: 1771–1773. [DOI] [PubMed] [Google Scholar]
- Dzoljic MR, De Vries R ( 1994) Nitric oxide synthase inhibition reduces wakefulness. Neuropharmacology 33: 1505–1509. [DOI] [PubMed] [Google Scholar]
- Escrig A, Gonzalez-Mora JL, Mas M ( 1999) Nitric oxide release in penile corpora cavernosa in a rat model of erection. J Physiol (Lond) 516: 261–269. [DOI] [PMC free article] [PubMed] [Google Scholar]
- Fibiger HC ( 1991) Cholinergic mechanisms in learning, memory and dementia: a review of recent evidence. Trends Neurosci 14: 220–223. [DOI] [PubMed] [Google Scholar]
- Garthwaite J, Boulton CL ( 1995) Nitric oxide signaling in the central nervous system. Annu Rev Physiol 57: 683–706. [DOI] [PubMed] [Google Scholar]
- Kurosawa M, Sato A, Sato Y ( 1989) Well-maintained responses of acetylcholine release and blood flow in the cerebral cortex to focal electrical stimulation of the nucleus basalis of Meynert in aged rats. Neurosci Lett 100: 198–202. [DOI] [PubMed] [Google Scholar]
- Leonard TO, Lydic R ( 1997) Pontine nitric oxide modulates ACh release, rapid eye movement sleep generation, and respiratory rate. J Neurosci 17: 774–785. [DOI] [PMC free article] [PubMed] [Google Scholar]
- LoConte G, Casamenti F, Bigi V, Milaneschi E, Pepeu G ( 1982) Effect of magnocellular forebrain nuclei lesions on acetylcholine output from the cerebral cortex, electrocorticogram, and behaviour. Arch Ital Biol 120: 176–188. [PubMed] [Google Scholar]
- Malinski T, Taha Z ( 1992) Nitric oxide release from a single cell measured in situ by a porphyrinic-based microsensor. Nature 58: 676–678. [DOI] [PubMed] [Google Scholar]
- Mesulam MM, Mufson EJ, Wainer BH, Levey AI ( 1983) Central cholinergic pathways in the rat: an overview based on an alternative nomenclature (Ch1-Ch6). Neuroscience 10: 1185–1201. [DOI] [PubMed] [Google Scholar]
- Metherate R, Ashe JH ( 1993) Nucleus basalis stimulation facilitates thalamocortical synaptic transmission in the rat auditory cortex. Synapse 14: 132–143. [DOI] [PubMed] [Google Scholar]
- Metherate R, Cox CL, Ashe JH ( 1992) Cellular bases of neocortical activation: modulation of neural oscillations by the nucleus basalis and endogenous ACh. J Neurosci 12: 4701–4711. [DOI] [PMC free article] [PubMed] [Google Scholar]
- Moore PK, Handy RL ( 1997) Selective inhibitors of neuronal nitric oxide synthase–is no NOS really good NOS for the nervous system? Trends Pharmacol Sci 18: 204–211. [DOI] [PubMed] [Google Scholar]
- Moruzzi G, Magoun HW ( 1942) Brain stem reticular formation and activation of EEG. Electroencephalogr Clin Neurophysiol 1: 455–473. [PubMed] [Google Scholar]
- Muir JL, Everitt BJ, Robbins TW ( 1994) AMPA-induced excitotoxic lesions of the basal forebrain: a significant role for the cortical cholinergic system in attentional function. J Neurosci 14: 2313–2326. [DOI] [PMC free article] [PubMed] [Google Scholar]
- Nistico G, Bagetta G, Iannone M, Del Duca C ( 1994) Evidence that nitric oxide is involved in the control of electrocortical arousal. Ann NY Acad Sci 738: 191–200. [DOI] [PubMed] [Google Scholar]
- Pape HC, Mager R ( 1992) Nitric oxide controls oscillatory activity in thalamocortical neurons. Neuron 9: 441–448. [DOI] [PubMed] [Google Scholar]
- Perry E, Walker M, Grace J, Perry R ( 1999) Acetylcholine in mind: a neurotransmitter correlate of consciousness? Trends Neurosci 22: 273–280. [DOI] [PubMed] [Google Scholar]
- Sarter M, Bruno JP ( 1997) Cognitive functions of cortical acetylcholine: toward a unifying hypothesis. Brain Res Brain Res Rev 23: 28–46. [DOI] [PubMed] [Google Scholar]
- Sarter M, Bruno JP ( 2000) Cortical cholinergic inputs mediating arousal, attentional processing and dreaming: differential afferent regulation of the basal forebrain by telencephalic and brainstem afferents. Neuroscience 95: 933–952. [DOI] [PubMed] [Google Scholar]
- Semba K ( 2000) Multiple output pathways of the basal forebrain: organization, chemical heterogeneity, and roles in vigilance. Behav Brain Res 115: 117–141. [DOI] [PubMed] [Google Scholar]
- Steriade M, Jones EG, McCormick DA ( 1997) Thalamus, Vol I: Organization and function, pp 269–337. Oxford: Elsevier. [Google Scholar]
- Stewart DJ, MacFabe DF, Vanderwolf CH ( 1984) Cholinergic activation of the electrocorticogram: role of the substantia innominata and effects of atropine and quinuclidinyl benzilate. Brain Res 322: 219–232. [DOI] [PubMed] [Google Scholar]
- Szymusiak R ( 1995) Magnocellular nuclei of the basal forebrain: substrates of sleep and arousal regulation. Sleep 18: 478–500. [DOI] [PubMed] [Google Scholar]
- Szymusiak R, McGinty D ( 1989) Sleep-waking discharge of basal forebrain projection neurons in cats. Brain Res Bull 22: 423–430. [DOI] [PubMed] [Google Scholar]
- Szymusiak R, McGinty D ( 1994) Brainstem and forebrain regulation of sleep onset and slow-wave sleep. In: Sleep and breathing (Saunders NA, Sullivan CE, eds), pp 27–45. New York: Dekker.
- Szymusiak R, McGinty D, Shouse MN, Shepard D, Sterman MB ( 1990) Effects of systemic atropine sulfate administration on the frequency content of the cat sensorimotor EEG during sleep and waking. Behav Neurosci 10: 217–225. [DOI] [PubMed] [Google Scholar]
- Szymusiak R, Alam N, McGinty D ( 2000) Discharge patterns of neurons in cholinergic regions of the basal forebrain during waking and sleep. Behav Brain Res 115: 171–182. [DOI] [PubMed] [Google Scholar]
- Tremblay N, Warren RA, Dykes RW ( 1990) Electrophysiological studies of acetylcholine and the role of the basal forebrain in the somatosensory cortex of the cat. I. Cortical neurons excited by glutamate. J Neurophysiol 64: 1199–1211. [DOI] [PubMed] [Google Scholar]
- Vazquez J, Lydic R, Baghdoyan HA ( 2002) The nitric oxide synthase inhibitor NG-Nitro-l-arginine increases basal forebrain ACh release during sleep and wakefulness. J Neurosci 22: 5597–5605. [DOI] [PMC free article] [PubMed] [Google Scholar]
- Vincent SR, Kimura H ( 1992) Histochemical mapping of nitric oxide synthase in the rat brain. Neuroscience 46: 755–784. [DOI] [PubMed] [Google Scholar]
- Wood J, Garthwaite J ( 1994) Models of the diffusional spread of nitric oxide: implications for neural nitric oxide signalling and its pharmacological properties Neuropharmacology 33: 1235–1244. [DOI] [PubMed] [Google Scholar]
- Zaborszky L, Pang K, Somogyi J, Nadasdy Z, Kallo I ( 1999) The basal forebrain corticopetal system revisited. Ann NY Acad Sci 877: 339–367. [DOI] [PubMed] [Google Scholar]