

Introduction
The good coverage and high resolution afforded by functional magnetic resonance imaging (fMRI) make it an excellent tool for the noninvasive imaging of the human brain. Equally interesting, however, is the use of this technique in animal studies using high magnetic fields. In the latter case, highly spatiotemporally resolved fMRI can reveal how widespread neural networks are organized, and accompanying electrophysiological recordings can show how small neural assemblies contribute to this organization.
By applying fMRI and magnetic resonance spectroscopic imaging (MRS) to the nonhuman primate, the most frequently used laboratory animal for the study of the neural basis of cognition, scientists may be able to investigate levels of neural organization that cannot be studied by electrodes alone. These include (1) long-range interactions between different brain structures, (2) task- and learning-related neurochemical changes by means of localized in vivo spectroscopy or MRS, (3) dynamic connectivity patterns by means of labeling techniques involving MR contrast agents, and (4) plasticity and reorganization after experimentally placed focal lesions. Such applications promise to bridge the gap between human neuroimaging studies and the large body of animal research performed over the last half a century. Ultimately, however, the success of fMRI as a tool for visualizing brain function in humans or animals is crucially dependent on a deeper understanding of the relationship between the observed signal and the underlying neuronal activity that we think it represents.
The fMRI technique, like most current brain imaging techniques, capitalizes on the coupling of cerebral blood flow (CBF), energy demand, and neural activity. The interactions between these variables are overwhelmingly complex and involve interrelated factors such as the type of neural activity involved, the cell groups generating this activity, the link between this activity and energy demands, and the processes ultimately coupling the energy demand to the supply of energy to the brain. In this review I will concentrate on only one aspect of this complex issue, namely the type of neural activity that could play a dominant role in the generation of one sort of fMRI signal: the imaging signal capitalizing on the blood oxygen level-dependent (BOLD) contrast mechanism.
The BOLD fMRI signal
BOLD was first described by Seiji Ogawa (Ogawa and Lee, 1990; Ogawa et al., 1990a,b) in rat brain studies with strong magnetic fields (7 and 8.4 T). He noticed that the contrast of very high resolution brain images (65 × 65 × 700 μm3) acquired with a gradient-echo pulse sequence depicts a number of dark lines of varying thickness that could not be seen when the usual spin echo sequences were used. They turned out to be signal dropouts from blood vessels (Ogawa et al., 1990a). In other words, by accentuating the susceptibility effects of deoxyhemoglobin in the venous blood with gradient-echo techniques, Ogawa discovered a contrast mechanism reflecting the blood oxygen level. With remarkable insight he realized the potential importance of its application, concluding that “BOLD contrast adds an additional feature to magnetic resonance imaging and complements other techniques that are attempting to provide positron emission tomography-like measurements related to regional neural activity” (Ogawa et al., 1990b). Shortly after this, the effect was nicely demonstrated in the cat brain during the course of anoxia (Turner et al., 1991).
Not surprisingly, the groundbreaking work of Ogawa excited great interest in the application of BOLD fMRI to humans. Initial studies presented MR-detectable changes in cerebral blood volume using high-speed echo planar imaging techniques and exogenous paramagnetic contrast agents (gadolinium) (Belliveau et al., 1991; Rosen et al., 1991). In 1992, three groups simultaneously and independently took the method an exciting step further, obtaining results in humans using the BOLD mechanism without exogenous contrast agents (Bandettini et al., 1992; Kwong et al., 1992; Ogawa et al., 1992) and starting the flood of fMRI publications that have been appearing in scientific journals ever since. We now know that BOLD contrast depends not only on blood oxygenation but also on cerebral blood flow and volume, representing a complex response controlled by several parameters (Boxerman et al., 1995; Buxton and Frank, 1997; Ogawa et al., 1998).
Despite this complexity, much progress has been made toward quantitatively elucidating various aspects of the BOLD signal and the way it relates to the hemodynamic and metabolic changes occurring in response to elevated neuronal activity (Kim and Ugurbil, 1997; Buxton et al., 1998; Van Zijl et al., 1998). More recently, BOLD fMRI has also been applied successfully in anesthetized or conscious animals, including rodents, rabbits, cats, bats, and monkeys (for review, see Logothetis, 2002).
To study the relationship between the BOLD signal and its underlying neural activity, it is first necessary to have a thorough understanding of the variations in the hemodynamic response over space and time. Not surprisingly, a large number of investigators have extensively examined the time course of BOLD in humans and animals. The onset of the stimulus-induced hemodynamic response is typically delayed by ∼2 sec (Kwong et al., 1992), the time that it takes blood to travel from arteries to capillaries and draining veins. The signal reaches plateau after 6–12 sec and returns to the baseline with a similar ramp, although a prolonged post-stimulus undershoot is often evident (Frahm et al., 1996; Buxton et al., 1998; Logothetis et al., 1999). The signal intensity enhancement typically observed in BOLD fMRI reflects an increase in CBF that actually overcompensates for the increase in oxygen, so that ultimately an oversupply of oxygenated blood is delivered (Fox and Raichle, 1986; Fox et al., 1988).
Theoretical models of brain oxygenation have suggested that this oversupply compensates for the less efficient, passively driven tissue oxygen diffusion found at higher flow rates (Buxton and Frank, 1997; Hyder et al., 1998), but contradictory empirical observations (Shimojyo et al., 1968; Mintun et al., 2001) have appeared leaving the exact interpretation of these circulatory and metabolic changes uncertain. The vasodilation underlying the increased blood flow has also been suggested to be associated with passive dilation of venules and veins because of their balloon-like elasticity. It has been suggested, further, that this passive dilation of venules and veins may lie at the root of the poststimulus undershoot mentioned above (Buxton et al., 1998; Mandeville et al., 1999).
The compound neural signal
To discuss the relation of the BOLD signal to its underlying neural events it is worth briefly reviewing the nature of the neurophysiological signal commonly reported in animal studies. Physiological studies at the systems and behavioral level in anesthetized or conscious animals typically report extracellular recordings. Although the mechanisms at work during the monitoring of transmembrane electrical events with intracellularly placed electrodes are reasonably well understood, the interpretation of different types of extracellular recordings, in particular those reporting on the activity of neural masses, proved to be difficult and requires some discussion [for background information and references, see also the recent review by Logothetis (2002)].
What do extracellularly placed electrodes actually measure? From a theoretical point of view, neurons are considered to be embedded in an extracellular medium that acts as a volume conductor. The specific impedance of this conductor is higher (∼200–400 Ω/cm, depending on neural site) (Ranck, 1963, 1966; Nicholson and Freeman, 1975; Mitzdorf, 1985) than that measured in a saline bath (∼65 Ω/cm, 1 Hz-10 kHz; unpublished measurements), mainly because of the fact that ions must move around cellular processes in a very limited space. For the frequency range that is of interest in physiology studies (0 to ∼2 kHz), the inductive, magnetic, and propagative effects of the bioelectrical signals in the extracellular space can be neglected, permitting a quasi-static description of the electric field for which Ohm's law applies. For an extracellular recording point, the inflow of Na+ into the active sites of a neuron appears as a current sink (inward currents); the current flows down the core of the dendrites or axon, and because of the continuity of current, inactive membrane sites act as a source (outward currents) for the active regions. Because of the aforementioned resistance of the extracellular medium, such currents generate so-called extracellular field potentials (EFPs).
The signal measured by an electrode placed at a neural site represents the mean EFP (mEFP) from the weighted sum of all sinks and sources along multiple cells. This weighting is attributable to the fact that the capacitance added to the volume conductor by the lipid membranes of neurons endows the latter with low-pass filter properties. This is one reason for the difficulties encountered in interpreting mEFP. Another is the superposition principle itself, that is, the very fact that EFPs from multiple cells add up linearly and algebraically throughout the volume conductor. Thus, for cells with diametrically opposite orientations, currents of equal magnitude but opposite polarity will generate potentials that tend to cancel each other. As a result, information is lost that cannot be recovered without additional knowledge (e.g., anatomical or intracellularly obtained single-unit data). For certain geometrical arrangements, the way the current flows and the position of sinks and sources along the membranes can be calculated; for others they cannot. Finally, the volume conductor is strongly anisotropic (i.e., the conductivity tensor of the field has different values in different directions) because of the alignment of the elongated processes of its neural elements. This orientation-dependent conductivity, too, means that detailed anatomical and geometrical information is necessary to ensure the correct interpretation of the mEFP signal. Despite these difficulties, mEFP remains the most important tool of the systems neurophysiologist, conveying a great deal of information about the underlying brain functions. Depending on the choice of electrodes, their exact positioning, and the recording site, it can be used to study the physiological properties of single units, the ensemble properties of neuronal masses, which provide useful information about local spatiotemporal cooperativity of afferent and associational operations in a given structure, or both.
Single-unit recordings
If a microelectrode with a small tip is placed close to the soma or axon of a neuron, then the measured mEFP directly reports the spike traffic of that neuron and frequently that of its immediate neighbors as well. Recent studies in rats, for instance, show that tetrodes placed close (within 50 μm) to pyramidal neurons in hippocampus provide accurate information on a number of their parameters such as latency, amplitude, and shape of action potentials, because they are simultaneously measured by intracellular recordings (Harris et al., 2000; Henze et al., 2000).
The firing rate of such well isolated neurons has been the critical measure for comparing neural activity with sensory processing or behavior ever since the early development of microelectrodes (Adrian and Zotterman, 1926), and it has been the mainstay of systems neuroscience for decades. This concentration on the firing rates of single units remained unquestioned for many years and was strengthened by its suitability for studying the first steps of afferent information processing in sensory physiology (Kuffler, 1953; Mountcastle, 1957; Lettvin et al., 1959; Hubel and Wiesel, 1962).
A great deal has been learned since then, and the single-electrode single-unit recording technique still remains the method of choice in many behavioral experiments with conscious animals. However, it also has the drawback of providing information mainly on single receptive fields, with no access to subthreshold integrative processes or the associational operations taking place at a given site. Moreover, it suffers from an element of bias toward certain cell types (Stone, 1973) and sizes (Towe and Harding, 1970). The size bias, which is partially responsible for the cell-type bias as well, is considerable. For equivalent transmembrane action potentials, the discharge of a large neuron generates a substantially greater flow of membrane current and a larger extracellular spike than a small cell, and the resulting extracellular field remains above recording noise levels over a greater distance. Larger neurons (cells with diameter of ≥20–30 μm diameter) are estimated to generate a potential of ≥100 μV within a 100-μm-diameter sphere with the electrode tip at its center (Rall, 1962). The amplitude of this potential decreases rapidly with increasing distance from the electrode tip because of the aforementioned low-pass properties of the extracellular medium. For distances larger than ∼140 μm, spikes become indistinguishable from background noise (Henze et al., 2000). Spikes generated by large neurons will thus remain above the noise level over a greater distance from the cell than spikes from small neurons, so microelectrodes are likely to sample their somas or axons preferentially, a prediction supported by experimental work (Towe and Harding, 1970; Humphrey and Corrie, 1978). It follows that the measured spikes may actually represent only very small neural populations of large cells, which in cortex are by and large the principal cells (e.g., pyramidal cells in cerebral cortex and Purkinje neurons in cerebellar cortex). This bias is particularly pronounced in experiments with alert, behaving animals or humans (Fried et al., 1997; Kreiman et al., 2000a,b), in which even slight movements of the subjects make it extremely difficult to hold smaller neurons for a sufficiently long time. Recording from interneurons (e.g., inhibitory cells) is often very difficult both because of their size and because their response is often found to be uncorrelated to the stimulus or behavior state of the animal.
In conclusion, most of the experiments using single-unit extracellular recordings report on the activity of large principal cells, which represent the output of the cortical area under study. It is the firing rate of these principal neurons that is commonly used to compare the results of animal and human studies. Recently it was also used to quantitatively examine the relationship between the BOLD signal and neural activity by comparing human fMRI data with electrophysiological data in monkeys performing the same task (Heeger et al., 2000; Rees et al., 2000) (for review, see Heeger and Ress, 2002; Logothetis, 2002).
Neural ensemble recordings
If the impedance of the microelectrode is sufficiently low and its exposed tip is a bit farther from the spike-generating sources so that action potentials do not predominate the neural signal, then the electrode can monitor the totality of the potentials in that region. The EFPs recorded under these conditions [see the seminal studies of Bishop and O'Leary (1942) and Lorente de Nó (1947)] are related both to integrative processes (dendritic events) and to spikes generated by several hundreds of neurons. The two different signal types can be segregated by frequency band separation. A high-pass filter cutoff of ∼300–400 Hz is used in most recordings to obtain multiple-unit spiking activity (MUA), and a low-pass filter cutoff of ∼300 Hz is used to obtain the so-called local field potentials (LFPs). A large number of experiments have presented data indicating that such a band separation does indeed underlie different neural events.
Multiunit spiking activity
The magnitude of EFPs in the MUA range, for example, was shown to be a function of cell and axon size. Combined physiology–histology experiments demonstrated that the magnitude of MUA is site specific (Buchwald and Grover, 1970) and thus also cell-size specific (Nelson, 1966), varying considerably from one brain region to another but remaining relatively constant for any particular site (e.g., neocortex vs hippocampus). Homogeneous populations of large cells were found to systematically occur at sites of large-amplitude fast activity and vice versa (Grover and Buchwald, 1970). Similarly, the magnitude of axonal spikes is directly correlated with the size of the transmitting axon (Gasser and Grundfest, 1939; Hunt, 1951). All of these experiments show that MUA-range activity reflects the variations in the magnitude of extracellular spike potentials. In other words, large-amplitude signal variations in the MUA range reflect large-amplitude extracellular potentials, and small-amplitude fast activity is correlated with small ones.
The summation range for the fast MUA has also been studied by a number of investigators. Electrodes with exposed tips of ∼100 μm (impedance from 40–120 kΩ), for example, were estimated to record from a sphere with a radius of 50–350 μm (Grover and Buchwald, 1970; Legatt et al., 1980; Gray et al., 1995), whereby the activity from each point within the sphere is weighted by a factor depending on the distance of the point from the tip of the electrode (Nicholson and Llinas, 1971). Recent tetrode recordings suggest that it is possible to sample individual spikes up to a distance of ∼140 μm from the electrode tip (Henze et al., 2000). Given the estimated number of neurons contained in a cylindrical region with 140 μm diameter in the hippocampal area CA1 (Boss et al., 1985; Aika et al., 1994), single-electrode recordings could provide information concerning the activity of ∼1000 neurons (Henze et al., 2000). In the primary visual cortex, which contains ∼200,000 neurons beneath 1 mm2 of cortical surface (Powell and Hendrickson, 1981; O'Kusky and Colonnier, 1982), this number is likely to be considerably higher.
All in all, depending on the recording site and the electrode properties, the MUA most likely represents a weighted sum of the extracellular action potentials of all neurons within a sphere of ∼140–300 μm radius, with the electrode at its center. Spikes produced by the synchronous firings of many cells can be enhanced, in principle, by summation and thus detected over a larger distance (Huang and Buchwald, 1977; Arezzo et al., 1979).
Local field potentials
The LFPs, the low-frequency range of the mEFP signal, represent mostly slow events reflecting cooperative activity in neural populations. Until recently these signals were thought to represent exclusively synaptic events. Evidence for this came from combined electro-encephalographic (EEG) and intracortical recordings showing that the slow wave activity in the EEG is essentially independent of neuronal spiking (Fromm and Bond, 1964, 1967; Ajmone-Marsan, 1965; Buchwald et al., 1965). These studies showed that, unlike the multiunit activity, the magnitude of the slow field fluctuations is not correlated with cell size, but instead reflects the extent and geometry of dendrites in each recording site. Cells in the so-called open field geometrical arrangement, in which dendrites face in one direction and somata in another, produce strong dendrite-to-soma dipoles when they are activated by synchronous synaptic input. Other cortical neurons are oriented horizontally and contribute less efficiently or not at all to the sum of potentials. The pyramidal cells with their apical dendrites running parallel to each other and perpendicular to the pial surface form an ideal open field arrangement and contribute maximally to both the macroscopically measured EEG and the local field potentials.
Evidence concerning the origin of LFPs can also be gathered from current-source density (CSD) analysis and combined field potential and intracellular recordings [for a review of CSD as well as other types of ensemble recordings, see Mitzdorf (1985) and Nadasdy et al. (1998)]. Mitzdorf has suggested that LFPs actually reflect a weighted average of synchronized dendrosomatic components of the synaptic signals of a neural population within 0.5–3 mm of the electrode tip (Mitzdorf, 1987; Juergens et al., 1999). The upper limits of the spatial extent of LFP summation were indirectly calculated by computing the phase coherence of LFPs as a function of inter-electrode distance in experiments with simultaneous multiple-electrode recordings (Juergens et al., 1996).
Combined intracellular and field potential recordings also suggest a synaptic/dendritic origin of the LFPs. Experiments comparing membrane and network properties typically investigate the phase-locking of membrane potential oscillations (rhythmic discharges) to certain frequency bands. Traditionally, low-frequency signal modulations are classified in a number of specific frequency bands initially introduced in the EEG literature (Elul, 1969, 1971; Pedley and Traub, 1990). Rhythmic EEG is subdivided into frequency bands known as delta (δ, 0–4 Hz), theta (Θ, 4–8 Hz), alpha (α, 8–12 Hz), beta (β, 12–24 Hz), and gamma (γ, 24–40/80 Hz) that are typically characterized by different amplitudes (Lindsley and Wicke, 1974; Steriade and Hobson, 1976; Basar, 1980; Steriade, 1991). The classification is based on the strong correlation of each band with a distinct behavioral state. The oscillatory activity in these bands is associated with the thalamocortical loops and is modulated by the ascending network system and basal forebrain (Steriade, 1991; Steriade et al., 1993), but rhythmic activity related to some of the EEG frequency bands has also been reported for the spiking principal neurons. Many pyramidal neurons in layer 5 of the neocortex show prolonged, 5–12 Hz rhythmic firing patterns caused by intrinsic membrane properties such as sodium conductance, which is essential for rhythmicity, and calcium-dependent conductance, which strongly modifies it (Silva et al., 1991). Although synaptic networks of intrinsically rhythmic neurons may still be the origin of the synchronized cortical oscillations, spiking activity in this case will be tightly correlated with the LFPs and will contribute to the modulation of their amplitude.
Similar behavior has been reported for a biophysically distinct class of pyramidal cells (chattering cells) in the superficial cortex layers of cats (Gray and McCormick, 1996). Their oscillatory behavior (20–60 Hz), which is accompanied by periodic changes in membrane potential, is induced in response to suprathreshold depolarizing current injections or visual stimulation and is absent during periods of spontaneous activity. Oscillations were also observed in the peripheral olfactory system of insects (Laurent and Davidowitz, 1994), the olfactory cortex of rats and rabbits (Granger and Lynch, 1991), and the somatosensory cortex of monkeys (Ahissar and Vaadia, 1990; Mountcastle et al., 1990; Recanzone et al., 1992; Romo and Salinas, 1999). New insights into their generation and into intracortical processing in general have come from the study of inhibitory networks in hippocampus (Buzsaki and Chrobak, 1995; Kandel and Buzsaki, 1997; Kocsis et al., 1999).
As mentioned above, LFPs were initially attributed exclusively to population EPSPs or IPSPs that are considerably slower than the spiking activity. Later studies, however, provided evidence of the existence of other types of slow activity unrelated to synaptic events, including voltage-dependent membrane oscillations (Kamondi et al., 1998) and spike afterpotentials. To be more specific, the soma–dendritic spikes in the neurons of the CNS are generally followed by afterpotentials, a brief delayed depolarization, the afterdepolarization, and a longer lasting afterhyperpolarization, which are thought to play an important role in the control of excitation-to-frequency transduction (Granit et al., 1963; Harada and Takahashi, 1983; Gustafsson, 1984). Afterpotentials, which were shown to be generated by calcium-activated potassium currents (Harada and Takahashi, 1983; Walton and Fulton, 1986; Higashi et al., 1993; Chandler et al., 1994; Kobayashi et al., 1997) have a duration on the order of tens of milliseconds and most likely contribute to the generation of the LFP signals, as was first suggested by Buzsaki and colleagues (Buzsaki, 1931; Buzsaki et al., 1988). These investigators proposed that the delta wave of the EEG signal is not necessarily a result of synaptic activity, but it rather reflects summation of long-lasting afterhyperpolarizations of layer V pyramidal neurons, and that the suppression of delta waves during neocortical arousal is attributable mainly to blockade of this hyperpolarization by cholinergic input.
In summary, MUA mostly represents the spiking of neurons, with single-unit recordings mainly reporting on the activity of the projection neurons that form the exclusive output of a cortical area. LFPs, on the other hand, represent slow waveforms, including synaptic potentials, afterpotentials of somatodendritic spikes, and voltage-gated membrane oscillations, that reflect the input of a given cortical areas as well as its local intracortical processing, including the activity of excitatory and inhibitory interneurons.
The relation of neural activity to the BOLD response
A number of studies using a variety of different techniques have presented data suggesting a linear relationship between neural activity and the subsequent hemodynamic response (Mathiesen et al., 1998; Brinker et al., 1999; Rees et al., 2000; Ogawa et al., 2000). Notably, Rees et al. (2000) compared human fMRI measurements with electrophysiological data from single-unit recordings in monkeys. The monkey data sets were collected from the middle temporal visual area (MT or V5), which is known to be specialized for visual motion processing, whereas the human fMRI responses were measured in human MT complex, a motion-responsive cortical region that is believed to be homologous with monkey MT along with adjacent motion-sensitive areas (e.g., middle superior temporal area). On the basis of this comparison, Rees et al. (2000) suggested that the BOLD signal is directly proportional to the average neuronal firing rate, with a constant of proportionality of approximately nine spikes per second per unit and per percentage BOLD increase.
We recently examined the relationship of BOLD to neural activity directly by simultaneously acquiring electrophysiological and fMRI data from monkeys in a 4.7 T vertical scanner that was specially designed for combined neurophysiology and imaging experiments (Logothetis et al., 1999, 2001). We found that the BOLD response indisputably directly reflects a local increase in neural activity assessed by the mEFP signal. For the majority of recording sites, the BOLD signal was found to be a linear but not time-invariant function of LFPs, MUA, and the firing rate of small neural populations, partly confirming the results mentioned above. Very recently, this correlation between firing rate and BOLD was also confirmed with MRI/MRS studies in rats, whereby a linear relationship between CMRO2, glutamatergic neurotransmitter flux, and neural activity was demonstrated (Hyder et al., 2002; Smith et al., 2002). Moreover, a proportional increase in neural and hemodynamic signals was observed in experiments varying, within a limited range, the stimulus luminance contrast (Logothetis et al., 2001). In all of our experiments, however, increases in the LFP range were of both greater spectral power and higher reliability (Logothetis et al., 2001, their Fig. 3).
Specifically, the contribution of MUA and LFP signals to the hemodynamic response was examined by applying time-dependent frequency analysis to the raw data. After stimulus presentation, a transient increase in power was typically observed across all frequencies, followed by a lower level of activation that was maintained for the entire duration of stimulus presentation. A prominent characteristic in all of the spectrograms was a marked stimulus-induced increase in the magnitude of the LFP, which was always larger than that observed for MUA. A decrease in neural activity was also observed immediately after the termination of the stimulus. To elucidate further the relationship between the neural and the fMRI signal system, we applied system identification techniques that permit an assessment of the predictability of BOLD from the neural data.
LFPs and MUA as predictors of the BOLD response
In a linear, time-invariant (LTI) system, the relationship between input and output can be characterized completely by the hemodynamic impulse response function. Although the constraint of linearity may not apply to the hemodynamic system under all stimulation conditions, we initially applied linear systems analysis to examine the relationship of the BOLD fMRI signal to the different types of neural activities. Correlation analysis was applied to both the measurements obtained during visual stimulation and the measurements of spontaneous activity. The estimated impulse response functions were used to convolve the LFP and MUA responses to various stimuli.
Figure 1 shows the neural responses as well as the measured and estimated BOLD responses for two different stimulus durations. Residual analysis showed increased errors (in the least-square sense) as the pulse durations increased. Simple visual inspection of the data from the 24-sec-long stimulus presentation shows greatly increased residuals after the initial ramp of the BOLD response, suggesting deviations from the behavior of an LTI system. Deconvolution of the BOLD response showed that the estimation of the neural response is relatively accurate for low temporal frequencies (up to 0.16 Hz). Increasing temporal frequency strongly increased the residuals. For stimulation frequencies >0.21 Hz, reconstruction of the neural response was no longer possible. Residual analysis showed that LFPs and MUA vary in a similar manner, in that at those sites where LFPs proved to be good predictors of BOLD, MUA was a good predictor as well. However, LFP-based estimates generally yielded smaller errors (in the least-square sense) than estimates based on MUA responses. Specifically, the LFPs accounted for ∼7.6% more of the variance in the fMRI responses than the MUA. The difference, although small, was statistically significant. The larger variability of MUA was mostly attributable to the stronger adaptation effects observed in this frequency range of the mEFP.
Figure 1.
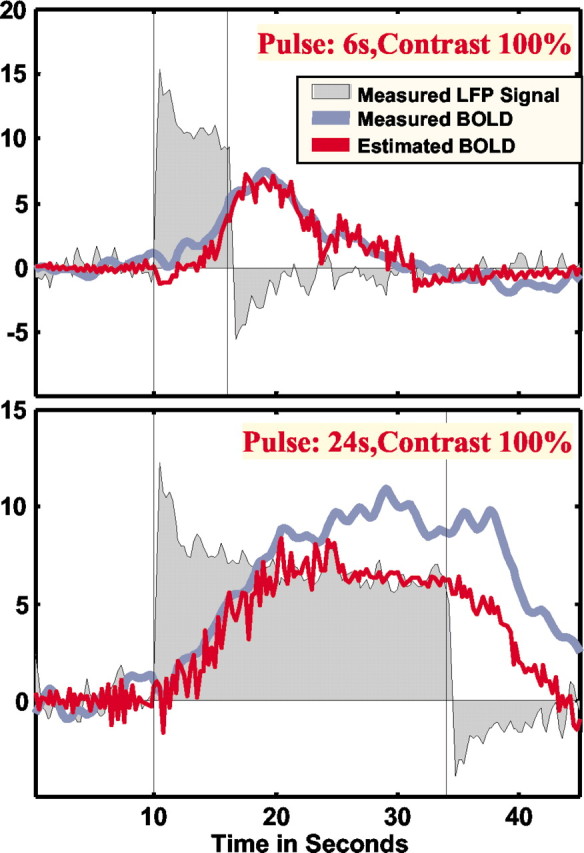
Measured responses as well as the measured and estimated BOLD response. Residual analysis showed increased error for longer pulse duration. Visual inspection of the data from 24-sec-long stimulus presentation revealed greatly increased residuals after the initial ramp of the BOLD response, suggesting lack of time invariance and the existence of nonlinearities not captured by the Wiener–Kernel analysis applied here to the data.
Dissociation of spiking and LFP activity
Our findings as summarized above partly confirm and extend previous studies suggesting an analogy between spiking activity and BOLD. They demonstrate, however, that the strong contribution of nonspiking activity to the fMRI signal makes it impossible to determine a quantitative relationship in the sense of defining the number of spikes needed to cause a certain BOLD increase. Most importantly, the results show that spike rate is only a “fortuitous” predictor of the BOLD signal. LFPs are a substantially more reliable predictor than MUA or the rate of single spikes. Not surprisingly, LFPs are usually correlated with MUA. We have seen already that the LFPs, MUA, and BOLD in V1 all increase monotonically with stimulus contrast (Logothetis et al., 2001). Circumstances may exist, however, in which there is a dissociation between these signals.
An exquisite example of such a dissociation between intracortical processing and output of a brain structure was recently offered by Mathiesen et al. (1998, 2000). These investigators stimulated the parallel fibers of cerebellum while recording Purkinje cell activity. Such stimulation causes monosynaptic excitation of the Purkinje cells and a disynaptic inhibition of the same neurons through the basket cells. The net effect is an inhibition of the spike activity of the Purkinje cells, although at the same time synaptic activity may be increased. Mathiesen et al. (1998) were actually able to demonstrate exactly this by measuring LFPs, single-unit activity, and changes in cerebral flow by means of laser Doppler flowmetry. Both LFPs and CBF were found to increase at the same time that spiking activity ceased.
We observed a similar dissociation at neuronal sites exhibiting strong multiunit response adaptation (Logothetis et al., 2001). Figure 2 illustrates such responses together with the simultaneously recorded LFPs and the BOLD signal. As can be seen, both the spike density function, representing the instantaneous firing rate of one or more neurons isolated, and the MUA show strong adaptation, returning to the baseline ∼2.5 sec after stimulus onset. In contrast, the activity underlying the local field potentials remains elevated for the entire duration of the visual stimulus, and it is the only neural signal that can be associated with the BOLD response. There was no single observation period or recording site for which the opposite result was observed, namely a highly correlated multiunit activity signal and an uncorrelated or missing LFP signal. Finally, preliminary results from ongoing research in our laboratory involving the injection of various neurotransmitters show that selective blocking of MUA has minimal effects on the BOLD responses averaged over regions coextensive with the spread of the injected substance.
Figure 2.

Simultaneous neural and hemodynamic recordings from a cortical site showing transient neural response. Note that both single-and multiple-unit responses adapt a couple of seconds after stimulus onset, with LFP remaining the only signal correlated with the BOLD response. The spike density function (SDF) reflects the instantaneous firing rate of a small population of neurons isolated during the analysis by using standard mathematical methods.
BOLD signal and cortical activity: input, local processing, and output
Taken together, these results suggest that changes in the LFPs are more closely related to the evolution of the BOLD signal than changes in the spiking activity of single or multiple neurons. I have already discussed the rationale behind LFP/MUA band separation and the reason why the former is thought to represent cortical input and local, intracortical processing, and the latter is thought to represent the weighted sum of spiking activity. With these arguments in mind, the results of the combined physiological and fMRI experiments suggest that the BOLD signal mainly reflects the incoming specific or association inputs into an area and the processing of this input information by the local cortical circuitry (including excitatory and inhibitory interneurons).
What exactly do we mean by input, output, and intracortical processing? A large body of research has shown that the excitatory cortical input can be divided into extrinsic and intrinsic afferents, whereby the former is subcortical, usually called the specific thalamic afferents, which actually include sensory afferents from thalamus and afferents from cerebellum and basal ganglia, and the latter has cortical (association) origin (Braitenberg, 1978) (for review, see Douglas and Martin, 1990). The thalamocortical input primarily synapses the pyramidal or spiny stellate cells, or both.
Pyramidal cells receive a certain amount of input from non-pyramidal cells, including the chandelier cells, the small and large basket cells, but most of their input comes from other pyramidal neurons. They, in turn, provide most of the excitatory output of the neocortex but also act as a major intracortical excitatory input through their axonal collaterals. Many of these collaterals ascend back to and synapse in superficial layers, and some distribute excitation in the horizontal plane (Lund et al., 1994), forming the so-called recurrent excitatory input. In this sense, most cortical neurons may be seen as interneurons, and the traditional cortical scheme of input–elaboration–output, commonly presented as an instantiation of the tripartite perception–cognition–action model, is revealed to be an oversimplification, if not disingenuous (Braitenberg and Schuez, 1998).
Cortex does much more than simply assigning a certain sensory input to its corresponding motor act; its major input comes from other cortical areas, and its subcortical input forms a small fraction of its afferents (Braitenberg, 1978). This is not to say that the input and output of a given cortical area are ill-defined concepts!
Most neocortical areas have well defined thalamic input which goes mainly to layers IV and layer III, and nonspecific thalamic afferents which are distributed very diffusely over many cortical areas and make synapses mainly in layer I or VI, or both (for review, see Steriade et al., 1990). Cortical connectivity patterns have been studied extensively and in certain cases can be used unambiguously to even dissect feedforward from feedback pathways in the sensory systems (Felleman and Van Essen, 1991). Cortical output has clear thalamic and other subcortical projections originating in layers VI and V, respectively, and corticocortical projections mostly from supragranular layers (for review, see Jones, 1984). Moreover, a great deal of processing is local (intracortical), reflecting the intrinsic, local circuits of cortex. Inhibitory connections, for instance, are local, most likely serving the fine tuning of the projection neurons. The amount of local processing is also reflected in the number of short intracortical connections. Schuez and Braitenberg (2002) recently provided data on the distribution of axonal lengths in the human cortex. They roughly estimated the number of fibers for each of three groups: (1) intracortical (horizontal) connections, (2) U-fibers, which are longer than the horizontal connections and leave the cortex and reenter it a few centimeters away from the exit point, and (3) long fibers in deep bundles and the callosal system. They showed that for an increase of one order of magnitude in length, their number goes down by one order of magnitude (Schuez and Braitenberg, 2002).
It is with this classification scheme in mind that I have suggested that the BOLD fMRI signal will always reflect the input and intracortical processing taking place in an imaged cortical area [for a fairly common misinterpretation of this statement and some confusion regarding cortical organization, see Smith et al. (2002)]. Very often the incoming subcortical or cortical input to an area will generate the kind of output activity typically measured in intracortical recordings. In this case, the spike rate will indeed be correlated to the measured BOLD signal. If the activity of large projection neurons, however, is shunted by concurrent modulatory input, the incoming afferent signals and the ongoing intracortical activity will still elicit strong hemodynamic responses. In such cases spiking activity measured with microelectrodes will be a poor predictor of the BOLD response. A number of experiments demonstrate the plausibility of this argument.
In a recent study, Tolias and colleagues used an adaptation technique (Grill-Spector et al., 1999; Kourtzi and Kanwisher, 2001) to study the brain areas processing motion information (Tolias et al., 2001). They repeatedly imaged a monkey's brain while the animal viewed continuous motion in a single, unchanging direction. Under these conditions, the BOLD response adapts. When the direction of motion reverses abruptly, the measured activity immediately shows a partial recovery, or rebound. The extent of this rebound was considered to be an index of the average directional selectivity of neurons in any activated area. The results confirmed previous electrophysiological studies revealing a distributed network of visual areas (V1, V2, V3, V5/MT) in the monkey that process information about the direction of visual motion. Surprisingly, however, strong activation was also observed in area V4. Single-unit recordings have demonstrated repeatedly the very weak involvement of this area in motion processing (Desimone and Schein, 1987). BOLD fMRI, on the other hand, suggested that the rebound activity, and thus the sensitivity of this area, is as pronounced as that of the area V5. It is possible to explain this result on the basis of the arguments developed earlier. Areas V4 and MT are interconnected (Felleman and Van Essen, 1983; Maunsell and Van Essen, 1983; Ungerleider and Desimone, 1986; Steele et al., 1991). Although they process separate stimulus properties, each area may influence the sensitivity of the others by providing some kind of “modulatory” input, which in and of itself is insufficient to drive the pyramidal cells recorded in a typical electrophysiology experiment. In such cases BOLD fMRI will reveal significant activation and appear to provide results that do not match those of neurophysiology.
For this reason a number of experiments in monkeys appear to be inconsistent with fMRI experiments using the same tasks or stimulation conditions (Tong and Engel, 1910; Gandhi et al., 1999; Kastner and Ungerleider, 2000; Polonsky et al., 2000) (for review, see Blake and Logothetis, 2002), because synaptic activity produced by lateral or feedback input is visible with imaging but is not always detectable with single-unit recordings. A good example is the measurement of the effects of spatial attention on neural activation. Attentional effects on the neurons of striate cortex have indeed been very difficult to measure in monkey electrophysiology experiments (Luck et al., 1997; McAdams and Maunsell, 1999). Yet for similar tasks, strong attentional effects have been readily measurable with fMRI in human V1 (Tong and Engel, 1910; Gandhi et al., 1999; Kastner and Ungerleider, 2000). In addition, attentional effects in area V4 were found to be considerable larger in human fMRI than in monkey electrophysiology (Kastner et al., 1998; Ress et al., 2000).
Summary
Simultaneous fMRI and electrophysiological recordings suggest that the BOLD contrast mechanism directly reflects the neural responses elicited by a stimulus. In a first approximation, BOLD responses and neural responses are shown to have a linear relationship for stimulus presentation of short duration. The hemodynamic response appears to be better correlated with the local field potentials, implying that activation in an area is often likely to reflect the incoming input and the local processing in a given area rather than the spiking activity. Although it is reasonable to expect that output activity will usually correlate with neurotransmitter release and presynaptic and postsynaptic currents, when input into a particular area plays what is primarily a modulatory role, fMRI experiments may reveal activation in areas in which physiological experiments find no single-unit activity.
Footnotes
This research was supported by the Max Planck Society. I thank Prof. Almut Schuez for many useful discussions and suggestions regarding her excellent work with Prof. Valentino Braitenberg, and D. Blaurock for English corrections and editing.
Correspondence should be addressed to Nikos K. Logothetis, Spemannstrasse 38, 72076 Tuebingen, Germany. E-mail: nikos.logothetis@tuebingen.mpg.de.
Copyright © 2003 Society for Neuroscience 0270-6474/03/233963-09$15.00/0
References
- Adrian ED, Zotterman Y ( 1926) The impulses produced by sensory nerve-endings, Part 2. The response of a single end-organ. J Physiol (Lond) 61: 151–171. [DOI] [PMC free article] [PubMed] [Google Scholar]
- Ahissar E, Vaadia E ( 1990) Oscillatory activity of single units in a somatosensory cortex of an awake monkey and their possible role in texture analysis. Proc Natl Acad Sci USA 87: 8935–8939. [DOI] [PMC free article] [PubMed] [Google Scholar]
- Aika Y, Ren JQ, Kosaka K, Kosaka T ( 1994) Quantitative analysis of GABA-like-immunoreactive and parvalbumin-containing neurons in the CA1 region of the rat hippocampus using a stereological method, the dissector. Exp Brain Res 99: 267–276. [DOI] [PubMed] [Google Scholar]
- Ajmone-Marsan C ( 1965) Electrical activity of the brain: slow waves and neuronal activity. Israel J Med Sci 1: 104–117. [PubMed] [Google Scholar]
- Arezzo J, Legatt AD, Vaughan HGJ ( 1979) Topography and intracranial sources of somatosensory evoked potentials in the monkey. I. Early components. Electroencephalogr Clin Neurophysiol 46: 155–172. [DOI] [PubMed] [Google Scholar]
- Bandettini PA, Wong EC, Hinks RS, Tikofsky RS, Hyde JS ( 1992) Time course EPI of human brain function during task activation. Magn Reson Med 25: 390–397. [DOI] [PubMed] [Google Scholar]
- Basar E ( 1980) EEG-Brain dynamics: relation between EEG and brain evoked potentials. Amsterdam: Elsevier.
- Belliveau JW, Kennedy DN, McKinstry RC, Buchbinder BR, Weisskoff RM, Cohen MS, Vevea JM, Brady TJ, Rosen BR ( 1991) Functional mapping of the human visual cortex by magnetic resonance imaging. Science 254: 716–719. [DOI] [PubMed] [Google Scholar]
- Bishop GH, O'Leary JL ( 1942) Factors determining the form of the potential record in the vicinity of the synapses of the dorsal nucleus of the lateral geniculate body. J Cell Comp Physiol 19: 315–331. [Google Scholar]
- Blake R, Logothetis NK ( 2002) Visual competition. Nat Rev Neurosci 3: 13–23. [DOI] [PubMed] [Google Scholar]
- Boss BD, Peterson GM, Cowan WM ( 1985) On the number of neurons in the dentate gyrus of the rat. Brain Res 338: 144–150. [DOI] [PubMed] [Google Scholar]
- Boxerman JL, Bandettini PA, Kwong KK, Baker JR, Davis TL, Rosen BR, Weisskoff RM ( 1995) The intravascular contribution to fMRI signal change: Monte Carlo modeling and diffusion-weighted studies in vivo. Magn Reson Med 34: 4–10. [DOI] [PubMed] [Google Scholar]
- Braitenberg V ( 1978) Cortical architectonics: general and areal. In: Architectonics of the cerebral cortex (Brazier M, Petsche H, eds), pp 443–465. New York: Raven.
- Braitenberg V, Schuez A ( 1998) Cortex: statistics and geometry of neuronal connectivity. In: Anatomy of the cortex: statistics and geometry, Ed 2. Berlin: Springer.
- Brinker G, Bock C, Busch E, Krep H, Hossmann KA, Hoehn-Berlage M ( 1999) Simultaneous recording of evoked potentials and T2*-weighted MR images during somatosensory stimulation of rat. Magn Reson Med 41: 469–473. [DOI] [PubMed] [Google Scholar]
- Buchwald JS, Grover FS ( 1970) Amplitudes of background fast activity characteristic of specific brain sites. J Neurophysiol 33: 148–159. [DOI] [PubMed] [Google Scholar]
- Buchwald JS, Hala ES, Schramm S ( 1965) A comparison of multi-unit activity and EEG activity recorded from the same brain site in chronic cats during behavioral conditioning. Nature 205: 1012–1014. [Google Scholar]
- Buxton RB, Frank LR ( 1997) A model for the coupling between cerebral blood flow and oxygen metabolism during neural stimulation. J Cereb Blood Flow Metab 17: 64–72. [DOI] [PubMed] [Google Scholar]
- Buxton RB, Wong EC, Frank LR ( 1998) Dynamics of blood flow and oxygenation changes during brain activation: the balloon model. Magn Reson Med 39: 855–864. [DOI] [PubMed] [Google Scholar]
- Buzsaki G ( 1931) Theta oscillations in the hippocampus. Neuron 33: 325–340. [DOI] [PubMed] [Google Scholar]
- Buzsaki G, Chrobak JJ ( 1995) Temporal structure in spatially organized neuronal ensembles: a role for interneuronal networks. Curr Opin Neurobiol 5: 504–510. [DOI] [PubMed] [Google Scholar]
- Buzsaki G, Bickford RG, Ponomareff G, Thal LJ, Mandel R, Gage FH ( 1988) Nucleus basalis and thalamic control of neocortical activity in the freely moving rat. J Neurosci 8: 4007–4026. [DOI] [PMC free article] [PubMed] [Google Scholar]
- Chandler SH, Hsaio CF, Inoue T, Goldberg LJ ( 1994) Electrophysiological properties of guinea pig trigeminal motoneurons recorded in vitro. J Neurophysiol 71: 129–145. [DOI] [PubMed] [Google Scholar]
- Desimone R, Schein SJ ( 1987) Visual properties of neurons in area V4 of the macaque: sensitivity to stimulus form. J Neurophysiol 57: 835–868. [DOI] [PubMed] [Google Scholar]
- Douglas RJ, Martin KAC ( 1990) Neocortex. In: The synaptic organization of the brain, Ed. 3 (Shepherd GM, ed), pp 389–438. New York: Oxford UP.
- Elul R ( 1969) The physiological interpretation of amplitude histograms of the EEG. Electroencephalogr Clin Neurophysiol 27: 703–704. [DOI] [PubMed] [Google Scholar]
- Elul R ( 1971) The genesis of the EEG. Int Rev Neurobiol 15: 227–272. [DOI] [PubMed] [Google Scholar]
- Felleman DJ, Van Essen DC ( 1983) The connections of area V4 of macaque extrastriate cortex. Soc Neurosci Abstr 9: 153. [Google Scholar]
- Felleman DJ, Van Essen DC ( 1991) Distributed hierarchical processing in primate cerebral cortex. Cereb Cortex 1: 1–47. [DOI] [PubMed] [Google Scholar]
- Fox PT, Raichle ME ( 1986) Focal physiological uncoupling of cerebral blood flow and oxidative metabolism during somatosensory stimulation in human subjects. Proc Natl Acad Sci USA 83: 1140–1144. [DOI] [PMC free article] [PubMed] [Google Scholar]
- Fox PT, Raichle ME, Mintun MA, Dence C ( 1988) Nonoxidative glucose consumption during focal physiologic neural activity. Science 241: 462–464. [DOI] [PubMed] [Google Scholar]
- Frahm J, Kruger G, Merboldt KD, Kleinschmidt A ( 1996) Dynamic uncoupling and recoupling of perfusion and oxidative metabolism during focal brain activation in man. Magn Reson Med 35: 143–148. [DOI] [PubMed] [Google Scholar]
- Fried I, MacDonald KA, Wilson CL ( 1997) Single neuron activity in human hippocampus and amygdala during recognition of faces and objects. Neuron 18: 753–765. [DOI] [PubMed] [Google Scholar]
- Fromm GH, Bond HW ( 1964) Slow changes in the electrocorticogram and the activity of cortical neurons. Electroencephalogr Clin Neurophysiol 17: 520–523. [DOI] [PubMed] [Google Scholar]
- Fromm GH, Bond HW ( 1967) The relationship between neuron activity and cortical steady potentials. Electroencephalogr Clin Neurophysiol 22: 159–166. [DOI] [PubMed] [Google Scholar]
- Gandhi SP, Heeger DJ, Boynton GM ( 1999) Spatial attention affects brain activity in human primary visual cortex. Proc Natl Acad Sci USA 96: 3314–3319. [DOI] [PMC free article] [PubMed] [Google Scholar]
- Gasser HS, Grundfest H ( 1939) Axon diameters in relation to the spike dimensions and the conduction velocity in mammalian A fibers. Am J Physiol 127: 393–414. [Google Scholar]
- Granger R, Lynch G ( 1991) Higher olfactory processes: perceptual learning and memory. Curr Opin Neurobiol 1: 209–214. [DOI] [PubMed] [Google Scholar]
- Granit R, Kernell D, Smith RS ( 1963) Delayed depolarization and the repetitive response to intracellular stimulation of mammalian motoneurons. J Physiol (Lond) 168: 890–910. [DOI] [PMC free article] [PubMed] [Google Scholar]
- Gray CM, McCormick DA ( 1996) Chattering cells—superficial pyramidal neurons contributing to the generation of synchronous oscillations in the visual cortex. Science 274: 109–113. [DOI] [PubMed] [Google Scholar]
- Gray CM, Maldonado PE, Wilson M, McNaughton B ( 1995) Tetrodes markedly improve the reliability and yield of multiple single-unit isolation from multi-unit recordings in cat striate cortex. J Neurosci Methods 63: 43–54. [DOI] [PubMed] [Google Scholar]
- Grill-Spector K, Kushnir T, Edelman S, Avidan G, Itzchak Y, Malach R ( 1999) Differential processing of objects under various viewing conditions in the human lateral occipital complex. Neuron 24: 187–203. [DOI] [PubMed] [Google Scholar]
- Grover FS, Buchwald JS ( 1970) Correlation of cell size with amplitude of background fast activity in specific brain nuclei. J Neurophysiol 33: 160–171. [DOI] [PubMed] [Google Scholar]
- Gustafsson B ( 1984) Afterpotentials and transduction properties in different types of central neurones. Arch Ital Biol 122: 17–30. [PubMed] [Google Scholar]
- Harada Y, Takahashi T ( 1983) The calcium component of the action potential in spinal motoneurons of the rat. J Physiol (Lond) 335: 89–100. [DOI] [PMC free article] [PubMed] [Google Scholar]
- Harris KD, Henze DA, Csicsvari J, Hirase H, Buzsaki G ( 2000) Accuracy of tetrode spike separation as determined by simultaneous intracellular and extracellular measurements. J Neurophysiol 84: 401–414. [DOI] [PubMed] [Google Scholar]
- Heeger DJ, Ress D ( 2002) What does fMRI tell us about neuronal activity? Nat Rev Neurosci 3: 142–151. [DOI] [PubMed] [Google Scholar]
- Heeger DJ, Huk AC, Geisler WS, Albrecht DG ( 2000) Spikes versus BOLD: what does neuroimaging tell us about neuronal activity? Nat Neurosci 3: 631–633. [DOI] [PubMed] [Google Scholar]
- Henze DA, Borhegyi Z, Csicsvari J, Mamiya A, Harris KD, Buzsaki G ( 2000) Intracellular features predicted by extracellular recordings in the hippocampus in vivo. J Neurophysiol 84: 390–400. [DOI] [PubMed] [Google Scholar]
- Higashi H, Tanaka E, Inokuchi H, Nishi S ( 1993) Ionic mechanisms underlying the depolarizing and hyperpolarizing afterpotentials of single spike in guinea-pig cingulate cortical neurons. Neuroscience 55: 129–138. [DOI] [PubMed] [Google Scholar]
- Huang CM, Buchwald JS ( 1977) Interpretation of the vertex short-latency acoustic response: a study of single neurons in the brain stem. Brain Res 137: 291–303. [DOI] [PubMed] [Google Scholar]
- Hubel DH, Wiesel TN ( 1962) Receptive fields, binocular interaction and functional architecture in the cat's visual cortex. J Physiol 160: 106–154. [DOI] [PMC free article] [PubMed] [Google Scholar]
- Humphrey DR, Corrie WS ( 1978) Properties of pyramidal tract neuron system within a functionally defined subregion of primate motor cortex. J Neurophysiol 41: 216–243. [DOI] [PubMed] [Google Scholar]
- Hunt C ( 1951) The reflex activity of mammalian small-nerve fibers. J Physiol (Lond) 115: 456–469. [DOI] [PMC free article] [PubMed] [Google Scholar]
- Hyder F, Shulman RG, Rothman DL ( 1998) A model for the regulation of cerebral oxygen delivery. J Appl Physiol 85: 554–564. [DOI] [PubMed] [Google Scholar]
- Hyder F, Rothman DL, Shulman RG ( 2002) Total neuroenergetics support localized brain activity: implications for the interpretation of fMRI. Proc Natl Acad Sci USA 99: 10771–10776. [DOI] [PMC free article] [PubMed] [Google Scholar]
- Jones EG ( 1984) Laminar distribution of cortical efferent cells. 521–553.
- Juergens E, Eckhorn R, Frien A, Woelbern T ( 1996) Restricted coupling range of fast oscillations in striate cortex of awake monkey. In: Goettingen neurobiology report (Elsner N, Schnitzler H-U, eds), p 418. Stuttgart, Germany: Thieme.
- Juergens E, Guettler A, Eckhorn R ( 1999) Visual stimulation elicits locked and induced gamma oscillations in monkey intracortical-and EEG-potentials, but not in human EEG. Exp Brain Res 129: 247–259. [DOI] [PubMed] [Google Scholar]
- Kamondi A, Acsady L, Wang XJ, Buzsaki G ( 1998) Theta oscillations in somata and dendrites of hippocampal pyramidal cells in vivo: activity-dependent phase-precession of action potentials. Hippocampus 8: 244–261. [DOI] [PubMed] [Google Scholar]
- Kandel A, Buzsaki G ( 1997) Cellular-synaptic generation of sleep spindles, spike-and-wave discharges, and evoked thalamocortical responses in the neocortex of the rat. J Neurosci 17: 6783–6797. [DOI] [PMC free article] [PubMed] [Google Scholar]
- Kastner S, Ungerleider LG ( 2000) Mechanisms of visual attention in the human cortex. Annu Rev Neurosci 23: 315–341. [DOI] [PubMed] [Google Scholar]
- Kastner S, De Weerd P, Desimone R, Ungerleider LG ( 1998) Mechanisms of directed attention in the human extrastriate cortex as revealed by functional MRI. Science 282: 108–111. [DOI] [PubMed] [Google Scholar]
- Kim SG, Ugurbil K ( 1997) Comparison of blood oxygenation and cerebral blood flow effects in fMRI: estimation of relative oxygen consumption change. Magn Reson Med 38: 59–65. [DOI] [PubMed] [Google Scholar]
- Kobayashi M, Inoue T, Matsuo R, Masuda Y, Hidaka O, Kang Y, Morimoto T ( 1997) Role of calcium conductances on spike afterpotentials in rat trigeminal motoneurons. J Neurophysiol 77: 3273–3283. [DOI] [PubMed] [Google Scholar]
- Kocsis B, Bragin A, Buzsaki G ( 1999) Interdependence of multiple theta generators in the hippocampus: a partial coherence analysis. J Neurosci 19: 6200–6212. [DOI] [PMC free article] [PubMed] [Google Scholar]
- Kourtzi Z, Kanwisher N ( 2001) Representation of perceived object shape by the human lateral occipital complex. Science 293: 1506–1509. [DOI] [PubMed] [Google Scholar]
- Kreiman G, Koch C, Fried I ( 2000a) Imagery neurons in the human brain. Nature 408: 357–361. [DOI] [PubMed] [Google Scholar]
- Kreiman G, Koch C, Fried I ( 2000b) Category-specific visual responses of single neurons in the human medial temporal lobe. Nat Neurosci 3: 946–953. [DOI] [PubMed] [Google Scholar]
- Kuffler SW ( 1953) Discharge patterns and functional organization of the mammalian retina. J Neurophysiol 16: 37–68. [DOI] [PubMed] [Google Scholar]
- Kwong KK, Belliveau JW, Chesler DA, Goldberg IE, Weisskoff RM, Poncelet BP, Kennedy DN, Hoppel BE, Cohen MS, Turner R ( 1992) Dynamic magnetic resonance imaging of human brain activity during primary sensory stimulation. Proc Natl Acad Sci USA 89: 5675–5679. [DOI] [PMC free article] [PubMed] [Google Scholar]
- Laurent G, Davidowitz H ( 1994) Encoding of olfactory information with oscillating neural assemblies. Science 265: 1872–1875. [DOI] [PubMed] [Google Scholar]
- Legatt AD, Arezzo J, Vaughan HGJ ( 1980) Averaged multiple unit activity as an estimate of phasic changes in local neuronal activity: effects of volume-conducted potentials. J Neurosci Methods 2: 203–217. [DOI] [PubMed] [Google Scholar]
- Lettvin JY, Maturana HR, McCulloch WS, Pitts WH ( 1959) What the frog's eye tells the frog's brain. Proc IRE 47: 1940–1951. [Google Scholar]
- Lindsley DB, Wicke JD ( 1974) The electroencephalogram: autonomous electrical activity in man and animals. In: Bioelectrical recording techniques, part B, Electroencephalography and human brain potentials (Thomas RF, Patterson MW, eds) pp 3–83. New York: Academic.
- Logothetis NK ( 2002) On the neural basis of the BOLD fMRI signal. Philos Trans R Soc Lond B Biol Sci 357: 1003–1037. [DOI] [PMC free article] [PubMed] [Google Scholar]
- Logothetis NK, Guggenberger H, Peled S, Pauls J ( 1999) Functional imaging of the monkey brain. Nat Neurosci 2: 555–562. [DOI] [PubMed] [Google Scholar]
- Logothetis NK, Pauls J, Augath M, Trinath T, Oeltermann A ( 2001) Neurophysiological investigation of the basis of the fMRI signal. Nature 412: 150–157. [DOI] [PubMed] [Google Scholar]
- Lorente de Nó R ( 1947) Action potentials of the motoneurons of the hypoglossus nucleus. J Cell Comp Physiol 29: 207–288. [DOI] [PubMed] [Google Scholar]
- Luck SJ, Chelazzi L, Hillyard SA, Desimone R ( 1997) Neural mechanisms of spatial selective attention in areas V1, V2, and V4 of macaque visual cortex. J Neurophysiol 77: 24–42. [DOI] [PubMed] [Google Scholar]
- Lund JS, Yoshioka T, Levitt JB ( 1994) Substrates for interlaminar connections in area V1 of macaque monkey cerebral cortex. In: Cerebral cortex, Vol 10, Primary visual cortex in primates (Peters AA, Rockland KS, eds), pp 37–60. New York: Plenum. [Google Scholar]
- Mandeville JB, Marota JJ, Ayata C, Zaharchuk G, Moskowitz MA, Rosen BR, Weisskoff RM ( 1999) Evidence of a cerebrovascular postarteriole wind-kessel with delayed compliance. J Cereb Blood Flow Metab 19: 679–689. [DOI] [PubMed] [Google Scholar]
- Mathiesen C, Caesar K, Akgoren N, Lauritzen M ( 1998) Modification of activity-dependent increases of cerebral blood flow by excitatory synaptic activity and spikes in rat cerebellar cortex. J Physiol 512: 555–566. [DOI] [PMC free article] [PubMed] [Google Scholar]
- Mathiesen C, Caesar K, Lauritzen M ( 2000) Temporal coupling between neuronal activity and blood flow in rat cerebellar cortex as indicated by field potential analysis. J Physiol (Lond) 523: 235–246. [DOI] [PMC free article] [PubMed] [Google Scholar]
- Maunsell JH, Van Essen DC ( 1983) The connections of the middle temporal visual area (MT) and their relationship to a cortical hierarchy in the macaque monkey. J Neurosci 3: 2563–2586. [DOI] [PMC free article] [PubMed] [Google Scholar]
- McAdams CJ, Maunsell JH ( 1999) Effects of attention on orientation tuning functions of single neurons in macaque cortical area V4. J Neurosci 19: 431–441. [DOI] [PMC free article] [PubMed] [Google Scholar]
- Mintun MA, Lundstrom BN, Snyder AZ, Vlassenko AG, Shulman GL, Raichle ME ( 2001) Blood flow and oxygen delivery to human brain during functional activity: theoretical modeling and experimental data. Proc Natl Acad Sci USA 98: 6859–6864. [DOI] [PMC free article] [PubMed] [Google Scholar]
- Mitzdorf U ( 1985) Current source-density method and application in cat cerebral cortex: investigation of evoked potentials and EEG phenomena. Physiol Rev 65: 37–100. [DOI] [PubMed] [Google Scholar]
- Mitzdorf U ( 1987) Properties of the evoked potential generators: current source-density analysis of visually evoked potentials in the cat cortex. Int J Neurosci 33: 33–59. [DOI] [PubMed] [Google Scholar]
- Mountcastle VB ( 1957) Modality and topographic properties of single neurons of cat's somatic sensory cortex. J Neurophysiol 20: 408–434. [DOI] [PubMed] [Google Scholar]
- Mountcastle VB, Steinmetz MA, Romo R ( 1990) Frequency discrimination in the sense of flutter: psychophysical measurements correlated with post-central events in behaving monkeys. J Neurosci 10: 3032–3044. [DOI] [PMC free article] [PubMed] [Google Scholar]
- Nadasdy Z, Csicsvari J, Penttonen M, Hetke J, Wise K, Buzsaki G ( 1998) Extracellular recording and analysis of neuronal activity: from single cells to ensembles. In: Neuronal ensembles: strategies for recording and processing (Eichenbaum H, Davis H, eds), pp 17–55. New York: Wiley.
- Nelson PG ( 1966) Interaction between spinal motoneurons of the cat. J Neurophysiol 29: 275–287. [DOI] [PubMed] [Google Scholar]
- Nicholson C, Freeman JA ( 1975) Theory of current source-density analysis and determination of conductivity tensor for anuran cerebellum. J Neurophysiol 38: 356–368. [DOI] [PubMed] [Google Scholar]
- Nicholson C, Llinas R ( 1971) Field potentials in the alligator cerebellum and theory of their relationship to Purkinje cell dendritic spikes. J Neurophysiol 34: 509–531. [DOI] [PubMed] [Google Scholar]
- O'Kusky J, Colonnier M ( 1982) A laminar analysis of the number of neurons, glia and synapses in the visual cortex (area 17) of adult macaque monkeys. J Comp Neurol 210: 278–290. [DOI] [PubMed] [Google Scholar]
- Ogawa S, Lee TM ( 1990) Magnetic resonance imaging of blood vessels at high fields: in vivo and in vitro measurements and image simulation. Magn Reson Med 16: 9–18. [DOI] [PubMed] [Google Scholar]
- Ogawa S, Lee TM, Nayak AS, Glynn P ( 1990a) Oxygenation-sensitive contrast in magnetic resonance image of rodent brain at high magnetic fields. Magn Reson Med 14: 68–78. [DOI] [PubMed] [Google Scholar]
- Ogawa S, Lee TM, Kay AR, Tank DW ( 1990b) Brain magnetic resonance imaging with contrast dependent on blood oxygenation. Proc Natl Acad Sci USA 87: 9868–9872. [DOI] [PMC free article] [PubMed] [Google Scholar]
- Ogawa S, Tank DW, Menon R, Ellermann JM, Kim SG, Merkle H, Ugurbil K ( 1992) Intrinsic signal changes accompanying sensory stimulation: functional brain mapping with magnetic resonance imaging. Proc Natl Acad Sci USA 89: 5951–5955. [DOI] [PMC free article] [PubMed] [Google Scholar]
- Ogawa S, Menon RS, Kim SG, Ugurbil K ( 1998) On the characteristics of functional magnetic resonance imaging of the brain. Annu Rev Biophys Biomol Struct 27: 447–474. [DOI] [PubMed] [Google Scholar]
- Ogawa S, Lee TM, Stepnoski R, Chen W, Zhu XH, Ugurbil K ( 2000) An approach to probe some neural systems interaction by functional MRI at neural time scale down to milliseconds. Proc Natl Acad Sci USA 97: 11026–11031. [DOI] [PMC free article] [PubMed] [Google Scholar]
- Pedley TA, Traub RD ( 1990) Physiological basis of the EEG. In: Current practice of clinical electroencephalography, Ed Z (Daly, DD, Pedly TA, eds), pp 107–137. New York: Raven.
- Polonsky A, Blake R, Braun J, Heeger DJ ( 2000) Neuronal activity in human primary visual cortex correlates with perception during binocular rivalry. Nat Neurosci 3: 1153–1159. [DOI] [PubMed] [Google Scholar]
- Powell TP, Hendrickson AE ( 1981) Similarity in number of neurons through the depth of the cortex in the binocular and monocular parts of area 17 of the monkey. Brain Res 216: 409–413. [DOI] [PubMed] [Google Scholar]
- Rall W ( 1962) Electrophysiology of a dendritic neuron. Biophys J 2: 145–167. [DOI] [PMC free article] [PubMed] [Google Scholar]
- Ranck JBJ ( 1963) Specific impedance of rabbit cerebral cortex. Exp Neurol 7: 144–152. [DOI] [PubMed] [Google Scholar]
- Ranck JBJ ( 1966) Electrical impedance in the subicular area of rats during paradoxical sleep. Exp Neurol 16: 416–437. [DOI] [PubMed] [Google Scholar]
- Recanzone GH, Merzenich MM, Schreiner CE ( 1992) Changes in the distributed temporal response properties of SI cortical neurons reflect improvements in performance on a temporally based tactile discrimination task. J Neurophysiol 67: 1071–1091. [DOI] [PubMed] [Google Scholar]
- Rees G, Friston K, Koch C ( 2000) A direct quantitative relationship between the functional properties of human and macaque V5. Nat Neurosci 3: 716–723. [DOI] [PubMed] [Google Scholar]
- Ress D, Backus BT, Heeger DJ ( 2000) Activity in primary visual cortex predicts performance in a visual detection task. Nat Neurosci 3: 940–945. [DOI] [PubMed] [Google Scholar]
- Romo R, Salinas E ( 1999) Sensing and deciding in the somatosensory system. Curr Opin Neurobiol 9: 487–493. [DOI] [PubMed] [Google Scholar]
- Rosen BR, Belliveau JW, Aronen HJ, Kennedy D, Buchbinder BR, Fischman A, Gruber M, Glas J, Weisskoff RM, Cohen MS ( 1991) Susceptibility contrast imaging of cerebral blood volume: human experience. Magn Reson Med 22: 293–299. [DOI] [PubMed] [Google Scholar]
- Schuez A, Braitenberg V ( 2002) The human cortical white matter: quantitative aspects of cortico-cortical long-range connectivity. In: Cortical areas: unity and diversity (Schüz A, Miller R, eds), pp 377–386. London: Taylor and Francis.
- Shimojyo S, Scheinberg P, Kogure K, Reinmuth OM ( 1968) The effect of graded hypoxia upon transient cerebral blood flow and oxygen consumption. Neurology 18: 133. [DOI] [PubMed] [Google Scholar]
- Silva LR, Amitai Y, Connors BW ( 1991) Intrinsic oscillations of neocortex generated by layer 5 pyramidal neurons. Science 251: 432–435. [DOI] [PubMed] [Google Scholar]
- Smith AJ, Blumenfeld H, Behar KL, Rothman DL, Shulman RG, Hyder F ( 2002) Cerebral energetics and spiking frequency: the neurophysiological basis of fMRI. Proc Natl Acad Sci USA 99: 10765–10770. [DOI] [PMC free article] [PubMed] [Google Scholar]
- Steele GE, Weller RE, Cusick CG ( 1991) Cortical connections of the caudal subdivision of the dorsolateral area (V4) in monkeys. J Comp Neurol 306: 495–520. [DOI] [PubMed] [Google Scholar]
- Steriade M ( 1991) Alertness, quiet sleep, dreaming. In: Cerberal cortex, Vol 9, Normal and altered states of function (Peters A, Jones EG, eds), pp 279–357. New York: Plenum. [Google Scholar]
- Steriade M, Hobson J ( 1976) Neuronal activity during the sleep-waking cycle. Prog Neurobiol 6: 155–376. [PubMed] [Google Scholar]
- Steriade M, Jones EG, Llinas RR ( 1990) Thalamic oscillations and signaling.
- Steriade M, McCormick DA, Sejnowski TJ ( 1993) Thalamocortical oscillations in the sleeping and aroused brain. Science 262: 679–685. [DOI] [PubMed] [Google Scholar]
- Stone J ( 1973) Sampling properties of microelectrodes assessed in the cat's retina. J Neurophysiol 36: 1071–1079. [DOI] [PubMed] [Google Scholar]
- Tolias AS, Smirnakis SM, Augath MA, Trinath T, Logothetis NK ( 2001) Motion processing in the macaque: revisited with functional magnetic resonance imaging. J Neurosci 21: 8594–8601. [DOI] [PMC free article] [PubMed] [Google Scholar]
- Tong F, Engel SA ( 1910) Interocular rivalry revealed in the human cortical blind-spot representation. Nature 411: 195–199. [DOI] [PubMed] [Google Scholar]
- Towe AL, Harding GW ( 1970) Extracellular microelectrode sampling bias. Exp Neurol 29: 366–381. [DOI] [PubMed] [Google Scholar]
- Turner R, Le Bihan D, Moonen CT, DesPres D, Frank J ( 1991) Echo-planar time course MRI of cat brain oxygenation changes. Magn Reson Med 22: 159–166. [DOI] [PubMed] [Google Scholar]
- Ungerleider LG, Desimone R ( 1986) Cortical connections of visual area MT in the macaque. J Comp Neurol 248: 190–222. [DOI] [PubMed] [Google Scholar]
- Van Zijl PC, Eleff SM, Ulatowski JA, Oja JM, Ulug AM, Traystman RJ, Kauppinen RA ( 1998) Quantitative assessment of blood flow, blood volume and blood oxygenation effects in functional magnetic resonance imaging. Nat Med 4: 159–167. [DOI] [PubMed] [Google Scholar]
- Walton K, Fulton BP ( 1986) Ionic mechanisms underlying the firing properties of rat neonatal motoneurons studied in vitro. Neuroscience 19: 669–683. [DOI] [PubMed] [Google Scholar]