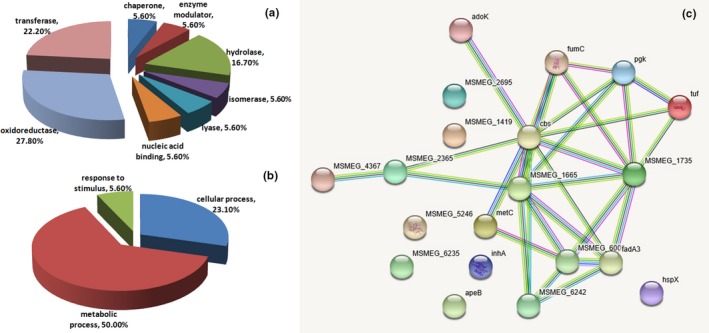
Figure 6.

Bioinformatic analysis of 20 differentially expressed proteins identified by MS/MS between the control and DdlA downregulation by ddlA antisense RNA groups. (a and b) Protein classification analysis using the PANTHER database. The representative pie chart displays the enrichment percentage for different functional categories of proteins. (a) Proteins were categorized into groups according to protein class; (b) Proteins were categorized into groups according to biological process; (c) Protein‐protein interaction network analysis using the STRING database
