

Abstract
The role of cyclic nucleotides as second messengers for intracellular signal transduction has been well described in bacteria. One recently discovered bacterial second messenger is cyclic di‐adenylate monophosphate (c‐di‐AMP), which has been demonstrated to be essential in bacteria. Compared to bacteria, significantly less is known about second messengers in archaea. This study presents the first evidence of in vivo presence of c‐di‐AMP in an archaeon. The model organism Haloferax volcanii was demonstrated to produce c‐di‐AMP. Its genome encodes one diadenylate cyclase (DacZ) which was shown to produce c‐di‐AMP in vitro. Similar to bacteria, the dacZ gene is essential and homologous overexpression of DacZ leads to cell death, suggesting the need for tight regulation of c‐di‐AMP levels. Such tight regulation often indicates the control of important regulatory processes. A central target of c‐di‐AMP signaling in bacteria is cellular osmohomeostasis. The results presented here suggest a comparable function in H. volcanii. A strain with decreased c‐di‐AMP levels exhibited an increased cell area in hypo‐salt medium, implying impaired osmoregulation. In summary, this study expands the field of research on c‐di‐AMP and its physiological function to archaea and indicates that osmoregulation is likely to be a common function of c‐di‐AMP in bacteria and archaea.
Keywords: archaea, cyclic di‐AMP, diadenylate cyclase, Haloferax volcanii, osmoregulation, second messenger
1. INTRODUCTION
Bacteria use cyclic nucleotide derivates to relay environmental signals to downstream receptors and thereby modulate various cellular pathways in response to changes in their environment (Gomelsky, 2011; Kalia et al., 2013; McDonough & Rodriguez, 2011). Therefore, these molecules are mostly referred to as second messengers. One such second messenger that is conserved in many bacterial species is cyclic di‐adenylate monophosphate (c‐di‐AMP) (Römling, 2008; Witte, Hartung, Büttner, & Hopfner, 2008). It is involved in various cellular processes and pathways such as DNA integrity sensing (Bejerano‐Sagie et al., 2006; Witte et al., 2008), control of cell size and cell wall homeostasis (Corrigan, Abbott, Burhenne, Kaever, & Gründling, 2011), regulation of fatty acid synthesis (Zhang, Li, & He, 2013), and maintenance of the osmotic homeostasis of the cell (Bai et al., 2014; Corrigan et al., 2013; Gundlach et al., 2017). Based on current knowledge, eukaryotic cells do not use c‐di‐AMP as second messenger. However, c‐di‐AMP‐based signaling is not completely absent in eukaryotes. It has been reported that c‐di‐AMP released by intracellular pathogens, such as Listeria monocytogenes and Mycobacterium tuberculosis, activates the hosts' immune system by triggering a type I interferon response (Woodward, Iavarone, & Portnoy, 2010; Yang et al., 2014). Amongst cyclic nucleotide‐based second messengers, c‐di‐AMP has a unique position as it is (under standard growth conditions) the only second messenger that is essential for the vast majority of species that produce it (Blötz et al., 2017; Chaudhuri et al., 2009; Luo & Helmann, 2012; Song et al., 2005; Whiteley, Pollock, & Portnoy, 2015). In addition, the intracellular level of c‐di‐AMP needs to be tightly regulated as both decreased and increased amounts of c‐di‐AMP in the cytoplasm cause severe negative effects on the cells (Gundlach et al., 2015; Huynh & Woodward, 2016).
In vivo, c‐di‐AMP is synthesized from two molecules of adenosine triphosphate (ATP) by diadenylate cyclases (DACs) (Witte et al., 2008), and is degraded to two molecules of adenosine monophosphate (AMP) by phosphodiesterases (PDEs) (Manikandan et al., 2014). Phylogenetic analysis has revealed several classes of DACs, all of which contain a conserved DAC domain (also called DisA_N domain [Pfam: PF02457]) in addition to several other functionally different domains (Commichau, Heidemann, Ficner, & Stülke, 2018; Corrigan & Gründling, 2013). Hypothetical proteins containing predicted DAC domains are present in diverse bacterial but also some archaeal species of the phylum Euryarchaeota, in which a previous study identified five unique putative DAC classes (DacV–DacZ) (Corrigan & Gründling, 2013). For the archaeal DacY class (also referred to as CdaZ class (Commichau et al., 2018)) it has been shown that a representative of this class, CdaZ from Methanocaldococcus jannaschii, exhibits DAC activity when expressed in a heterologous host (Commichau et al., 2018; Kellenberger, Chen, Whiteley, Portnoy, & Hammond, 2015). However, the actual production of c‐di‐AMP in vivo has not been reported for any archaeal species so far.
Research on cyclic nucleotides started with the discovery of cyclic AMP (cAMP) in 1956 (Sutherland & Wosilait, 1956). Since then, various cyclic nucleotide second messengers and their corresponding signaling pathways have been revealed in bacteria and eukaryotes. However, surprisingly little is known about the presence and molecular function of cyclic nucleotides in archaea. In 1986, the presence of cAMP was reported in the archaeal species Methanobacterium thermautotrophicus, Sulfolobus solfataricus, and Haloferax volcanii (then referred to as Halobacterium volcanii) (Leichtling, Rickenberg, Seely, Fahrney, & Pace, 1986), and cAMP levels have also been investigated in Halobacterium salinarum where a cell cycle‐dependent fluctuation of the intracellular cAMP concentration has been observed (Baumann, Lange, & Soppa, 2007). Another cyclic nucleotide that has been characterized in archaea is cyclic oligoadenylate, which has been shown to be involved in type III CRISPR‐mediated immunity in S. solfataricus (Rouillon, Athukoralage, Graham, Grüschow, & White, 2018). Comparative genome analyses have predicted different cyclases, including DACs, in additional archaeal species (Corrigan & Gründling, 2013; Shenroy & Visweswariah, 2004). However, the above three mentioned studies represent the only direct in vivo evidence on any cyclic nucleotides in archaea to date.
In this study, we show that c‐di‐AMP is produced by the euryarchaeon H. volcanii, which is the first direct evidence on the in vivo presence of this cyclic nucleotide in an archaeal species. The genome of H. volcanii encodes a single DAC belonging to the proposed DacZ subfamily (Corrigan & Gründling, 2013). The dacZ gene is constantly expressed at different growth phases in rich and selective media. Additionally, the gene is essential indicating that c‐di‐AMP is essential for H. volcanii, as reported for various bacteria. Overexpression of DacZ caused cell death suggesting the need for tight regulation of intracellular c‐di‐AMP levels. Data on in vitro enzymatic activity of heterologously expressed DacZ confirmed its identity as DAC. To investigate the function of c‐di‐AMP‐related signaling in H. volcanii, the expression of dacZ in media containing low sodium chloride concentrations was modulated using two different tryptophan‐inducible promoters; this revealed a possible link between intracellular c‐di‐AMP levels and osmohomeostasis.
2. MATERIAL AND METHODS
Unless stated otherwise all chemicals were purchased from Carl Roth.
2.1. Strains and growth conditions
Haloferax volcanii strains were either grown in rich YPC (Allers, Ngo, Mevarech, & Lloyd, 2004) (0.5 g/L Yeast Extract [Oxoid]; 0.1 g/L Peptone [Oxoid]; 0.1 g/L Bacto™ Casamino acids [BD biosciences]; pH 7.2 adjusted with KOH) medium or selective CA (Allers et al., 2004) (0.5 g/L Bacto™ Casamino acids; pH 7.2 adjusted with KOH) medium modified with an expanded trace element solution (referred to as CAB) (Duggin et al., 2015). Strains were grown at 45°C in liquid medium rotating (volumes up to 5 ml) or shaking at 170 rpm (volumes > 5 ml). Strains with auxotrophic marker deletions were grown in CAB medium supplemented with the respective compound (50 µg/ml uracil [Sigma] for ΔpyrE2; 50 µg/ml tryptophan for ΔtrpA; 40 µg/ml thymidine & hypoxanthine [Sigma] for ΔhdrB).
For CAB media with defined NaCl concentrations (concentrations of other components were not altered) used in salt stress experiments (1.8 M: hypo‐salt; 2.5 M: standard‐salt; 4.5 M: high‐salt), media without NaCl and with 5 M NaCl were mixed in defined proportions to obtain media with the desired final NaCl concentration.
Escherichia coli strains were cultivated in Lysogeny Broth‐medium (LB‐medium Luria/Miller) (Miller, 1971) supplemented with antibiotics if necessary (100 µg/ml ampicillin; 25 µg/ml kanamycin; 30 µg/ml chlorampenicol) at 37°C under constant shaking at 170 rpm.
All strains used in this study are listed in Table A1.
2.2. Plasmid construction
Plasmids transformed into H. volcanii were cloned using classical restriction enzyme‐based molecular cloning. Inserts were amplified from wild type (H26) genomic DNA (isolated as described previously (Allers et al., 2004)) via polymerase chain reaction (PCR) using PHUSION® polymerase (NEB). All restriction endonucleases used were purchased from NEB. Restriction enzyme digestions and PCR were performed according to the manufacturer’s protocols. All plasmids transformed to H. volcanii were isolated from dam−/dcm− competent E. coli cells (NEB).
Plasmids for heterologous protein overexpression in E. coli were cloned using FX‐cloning system as described earlier (Geertsma & Dutzler, 2011). Primers, backbones, and restriction enzymes used are summarized in Tables A2 and A3.
2.3. Genetic manipulation of H. volcanii and creation of deletion mutants
Transformation and construction of deletion mutants in H. volcanii H26 based on selection with uracil were performed as described previously (Allers et al., 2004). In brief: pTA131‐based deletion constructs, carrying a pyrE2‐cassette and the desired knock‐out construct consisting out of ~500 bp upstream and downstream flanking regions of the target gene, were transformed to the desired background strain. Transformed cells were plated on selective CA plates and incubated for 5 days. Single pop‐in colonies were restreaked on CA plates and, following a 3‐day incubation, cell material was inoculated in 5 ml‐rich YPC medium for unselective growth to relieve selective pressure for the pyrE2 cassette on the integrated plasmid. Nonselective growth in YPC was repeated three times o/n. Selection for pop‐out cells was achieved by plating on CA medium containing 50 µg/ml 5‐fluoroorotic acid (5‐FOA) (Fermentas) and 10 µg/ml uracil. After incubation for 5 days, up to 100 cells were transferred to a YPC plate and incubated for 2 days. These colonies were subjected to a colony blot hybridization on a Zeta®‐Probe GT blotting membrane (BioRad). DNA was UV cross‐linked to the membrane at 120 mJ/cm2. Subsequently, the membrane was subjected to pre‐hybridization and hybridization using the DIG (Digoxigenin) High Prime DNA labelling and detection starter kit II (Roche) according to the manufacturer's protocol. Colonies which did not hybridize to the probe were grown in 5 ml YPC for isolation of genomic DNA. Gene deletions were validated via PCR analysis using primers annealing outside of the flanking regions used in the knock‐out plasmid. PCR products of putative deletion strains were compared to corresponding PCR products of the wild type strain H26 and verified through sequencing.
Creation of mutants with an exchange of the native promotor of dacZ with the tryptophan‐inducible promotor (p.tnaA) (Large et al., 2007) used an integrative approach described previously (Skowyra & MacNeill, 2012). Briefly, the coding sequence of dacZ was cloned in pTA1369 (induction with p.tnaA)/pTA1451 (induction with p.tnaM3); pTA1369 and pTA1451 are shown in Figure A11. The resulting inducible gene +hdrB marker construct was digested with BglII and inserted at the BamHI site located between the upstream and downstream flanking regions of dacZ in the dacZ gene deletion construct (pSVA3930). Transformation and pop‐in procedure in H98 were performed as described for gene deletion trials. Correct upstream pop‐in position and orientation were examined using PCR. Pop‐out procedure was performed as described above with maintained selection for hdrB. 5‐FOAR colonies were checked for promotor exchange by PCR and sequencing.
Verification of dacZs essentiality based on a in trans complementation approach reported previously (Lestini, Duan, & Allers, 2010). In brief: The triple auxotroph strain H99 (ΔpyrE2; ΔtrpA; ΔhdrB) was transformed with a trpA‐marked dacZ deletion construct (pSVA5420). The resulting pop‐in strain HTQ409 was transformed with the episomal plasmids pSVA5421 (pTA356 + dacZ), pSVA5422 (pTA409 + dacZ), and corresponding empty backbone controls. The pop‐out procedure for pSVA5421 and pTA356 (Norais et al., 2007) was performed in medium without thymidine. Pop‐outs for pSVA5422 and pTA409 (Delmas, Shunburne, Ngo, & Allers, 2009) in medium with thymidine (releasing selection pressure for hdrB). For each construct, 5‐FOAR colonies were checked for complete deletion of dacZ from its chromosomal locus by PCR and sequencing. Additionally, complete deletion was confirmed by specific restriction digest (using StuI + EcoRV) and Southern Blotting. To demonstrate essentiality of dacZ, the genomic dacZ deletion strain carrying pSVA5421 (HTQ413) was grown three times overnight in liquid CA + uracil + thymidine & hypoxanthine followed by two consecutive rounds of growth on nonselective CA + uracil + thymidine & hypoxanthine plates to allow loss of pSVA5421. As a control for plasmid loss, H98 (ΔpyrE2; ΔhdrB) was also transformed with pSVA5421 and subjected to identical unselective growth conditions. Loss of plasmid was checked by transferring nonselectively grown colonies to selective plates without thymidine & hypoxanthine.
2.4. Phase‐contrast light microscopy and cell shape quantification
Haloferax volcanii cells were imaged at a magnification of 1000x using an Axio Observer.Z1 inverted microscope (Zeiss). For imaging, cell cultures were diluted back to an OD600 of 0.1 and 3 µl of the diluted cell suspension was spotted on an agarose pad (0.4% [w/v] agarose in 18% salt water [144 g/L NaCl; 21 g/L MgSO4 * 7 H2O; 18 g/L MgCl2 * 6 H2O; 4.2 g/L KCl; 12 mmol/L Tris/HCl, pH 7.5]), and allowed to air dry. The agarose pad was covered with a coverslip and visualized. For each strain, at least 500 cells/biological replicate were used for cell morphology evaluation. Evaluation of cell shape was performed using Fiji (Schindelin et al., 2012) in combination with the MicrobeJ plug‐in (Ducret, Quardokus, & Brun, 2016).
2.5. RNA isolation and dacZ expression level determination by quantitative PCR
RNA was isolated from H. volcanii H26 cells growing exponentially/stationary in YPC/CAB using the RNeasy® Mini Kit (Qiagen) in combination with the RNAse‐Free DNAse Set (Qiagen) for on column genomic DNA digestion according to the manufacturer's protocol. cDNA synthesis was performed using the QuantiNova™ Reverse Transcription Kit (Qiagen) according to the manufacturer's protocol with optimized duration of the reverse transcription step of 13 min. Analysis of cDNA libraries was performed with a final assay volume of 10 µl/sample using the qPCRBIO SyGreen Mix Lo‐ROX (PCRBIOSYSTES) as advised by the manufacturer. Quantitative PCR (qPCR) cycling was conducted in a Magnetic Induction Cycler (MIC) (Bio Molecular Systems) with the following cycling parameters: 2 min initial denaturation at 95°C; 40 cycles with 5 s denaturation at 95°C, and 30 s elongation at 65°C. For absolute quantification of dacZ transcripts, a standard curve was created using a 1,029 bp dacZ PCR product at defined concentrations as template. Absolute expression of dacZ in YPC‐stationary, CAB‐exponential, and CAB‐stationary phase was normalized to expression in YPC‐exponential phase.
2.6. c‐di‐AMP extraction from H. volcanii cells
The extraction of c‐di‐AMP from H. volcanii cells was performed as described previously (Spangler, Böhm, Jenal, Seifert, & Kaever, 2010). Briefly, H. volcanii cells were grown in 340 ml YPC/CAB or 50 ml CAB with 1.8 M NaCl. For exponentially grown cells 20 ml, for stationary grown cells 15 ml were harvested. For each time point, an additional 2 ml aliquot of each culture was harvested for the determination of total protein content (BCA Protein Assay Macro Kit [Serva]). Cell pellets were snap‐frozen in liquid nitrogen and subsequently resuspended in 300 µl extraction solution (acetonitrile/methanol/water: 2:2:1 [v/v/v]). Resuspended pellets were incubated in ice for 15 min followed by a heating step at 95°C for 10 min. After cooling on ice, the solution was centrifuged for 10 min at 4°C and maximum speed (21,100× g). The resulting supernatant was transferred to a fresh vial. The extraction was repeated two times (three extraction steps in total) with 200 µl fresh extraction solution, omitting the heating step. Combined supernatants were stored overnight at −20°C to precipitate protein. To remove precipitates, the samples were centrifuged again (10 min, 4°C; 21,100× g) and the supernatant was transferred to a fresh vial. Final extracts were desiccated using a vacuum concentrator (Eppendorf) at 45°C.
2.7. Quantification of c‐di‐AMP from cell extracts by liquid chromatography tandem mass spectrometry
Dried nucleotide extracts/enzyme assay mixtures were resuspended in 200 µl water, centrifuged and, following the addition of the internal standard ([13C,15N]c‐di‐AMP), analyzed by a liquid chromatography tandem mass spectrometry (LC‐MS/MS) method as described earlier (Mehne et al., 2013). The measured concentration of c‐di‐AMP was normalized for each cell extract sample to the total protein concentration of the respective sample.
2.8. Heterologous expression and purification of DacZ
Overexpression of N‐terminal 10x histidine‐tagged DacZ was performed by transforming pSVA5408 to chemically competent E. coli Rosetta (Novagen) cells. For expression, a preculture of transformed cells (grown in LBKana/Cam) was diluted back to an OD600 of ~0.05 in 2 L of LB/SMMKana/Cam medium (conventional LB‐medium with osmotically active substances: 1x LB; 0.5 M sucrose; 16.85 mmol/L maleic acid; 50 mmol/L KCl; 20 mmol/L MgCl2; pH: 7.0) and grown to an OD600 of ~0.5. Induction was performed with 0.2 mmol/L isopropyl β‐D‐1‐thiogalactopyranoside (IPTG) (Fisher Science) for 3 hr at 37°C. Following harvesting by centrifugation, cell pellets were resuspended in H. volcanii protein purification buffer (1.5 M KCl; 100 mmol/L NaCl; 100 mmol/L HEPES; 1 mmol/L DTT; pH 7.5) supplemented with 10 µg/ml DNAseI (Roche). Cell lysis was accomplished by sonification followed by the removal of cell debris by centrifugation at 48,200× g at 4°C for 20 min. Supernatant was loaded on a 5 ml HisTrap™HP column (GE Healthcare) connected to an ÄKTApurifier fast protein liquid chromatography (FPLC) system (GE Healthcare) and eluted using H. volcanii protein purification buffer supplemented with 400 mmol/L imidazole. Elution fractions were checked for DacZ content by SDS‐PAGE and Western Blot. Imidazole was removed by dialysis overnight in 5 L of H. volcanii protein purification buffer (supplemented with 2.5 M EDTA) using a MEMBRA‐CEL® dialysis tubing with a molecular weight cutoff of 7.5 kDa (Serva). Following dialysis, the elution fractions were concentrated with a Microsep™ Advance Centrifugal Devices (Pall Corporation) with a 10 kDa cutoff. The final protein content of concentrated elution fractions was determined using the BCA (bicinchoninic acid) protein assay macro kit (Serva) according to the manufacturer’s protocol.
2.9. In vitro activity determination of DacZ by thin‐layer chromatography using [α‐32P]ATP
In vitro DAC activity assays and detection of radioactive c‐di‐AMP were adapted from Bai et al (Bai et al., 2012). DacZ activity assays were performed in a total volume of 25 µl in H. volcanii protein purification buffer supplemented with 10 mmol/L of MnCl2 (respectively 10 mmol/L of MgCl2; CaCl2; NiCl2; CoCl2 for the cofactor dependence experiment). Final protein concentration of purified DacZ within the assay mixture was 10 µmol/L. As substrate, 100 µmol/L unlabeled ATP (Sigma) (solved in 500 mmol/L Tris/HCl, pH 7.5) mixed with [α‐32P]ATP (Hartmann Analytic) to a final activity of 200 Ci/mmol (final concentration of [α‐32P]ATP: 55 nmol/L) was used. For testing activity with GTP, 100 µmol/L of unlabeled GTP (Sigma) (dissolved in 500 mmol/L Tris/HCl, pH 7.5) mixed with [α‐32P]GTP (Hartmann Analytic) to a final activity of 167 Ci/mmol (final concentration of [α‐32P]GTP: 66 nmol/L) was used. Reactions were started by the addition of ATP. Assays were incubated at 37°C for 1 hr and stopped by adding an equal volume of 0.5 M EDTA. One microliter of this mixture was spotted on Polygram® CEL 300 polyethyleneimine‐cellulose thin‐layer chromatography (TLC) plates (Machery‐Nagel) and allowed to air dry. Plates were developed in 1:1.5 (v/v) saturated NH4SO4 and 1.5 M KH2PO4, pH 3.6, air dried and exposed to a phosphor imaging screen BAS‐MS 2040 (Fujifilm) overnight. Imaging plates were developed using a Typhoon FLA 9500 (GE Healthcare).
2.10. In vitro activity of DacZ and product verification by LC‐MS/MS
To verify c‐di‐AMP as in vitro, DacZ product assays were performed using an identical setup as described in the preceding section. However, the total volume of the assay was increased to 350 µl and 100 µmol/L ATP was added. The assay was incubated for 1 hr at 37°C. Following incubation, the reaction was stopped by heating the assay mixture at 95°C for 5 min. The inactivated assay mixture was mixed with 1.4 ml assay extraction solution (acetonitrile/methanol: 1:1 [v/v]) and incubated overnight at −20°C. The mixture was then centrifuged for 10 min at 4°C and maximum speed (21,100x g). The resulting supernatant was transferred to a fresh vial and evaporated to dryness using a vacuum concentrator (Eppendorf) at 45°C.
3. RESULTS
3.1. The genome of H. volcanii encodes for one putative DAC belonging to the DacZ/CdaZ subfamily
Putative DAC genes are present in various euryarchaeal genomes and, similarly to bacterial DACs, they have been previously classified according to their attached domains (Corrigan & Gründling, 2013). Analysis of the genome of the euryarchaeal model organism H. volcanii DS2 (Hartman et al., 2010) revealed the presence of a single putative DAC encoded by the gene dacZ (HVO_1660) in an operon with mscS2 (HVO_1659), a mechanosensitive channel of small conductance. An alignment of DacZ from H. volcanii and several putative DacZs from euryarchaeal model organisms with the biochemically and structurally characterized bacterial DAC CdaA from L. monocytogenes (Rosenberg et al., 2015) showed strong conservation of the DAC domain (Figure 1) with especially conservation of the catalytically important residues, like the highly conserved DGA motif followed by three hydrophobic residues (Rosenberg et al., 2015) (Figure 1, orange rectangles). No homology between DacZ from H. volcanii and CdaA from L. monocytogenes is found in the N‐terminal region. DACs of the DacA/CdaA family contain transmembrane domains at their N‐terminus (Corrigan & Gründling, 2013; Rosenberg et al., 2015), while until now no typical N‐terminal domain was identified for DacZ from H. volcanii which grouped this protein with other archaeal DacZ proteins (Corrigan & Gründling, 2013). To analyze the relation of DacZ from H. volcanii with other DACs, sequences related to DacZ and representatives from previously identified bacterial and archaeal classes were collected, the adenylate cyclase domains were aligned, and a phylogenetic tree was constructed (Figure A1). This analysis revealed that the adenylate cyclase domains of proteins of the DacZ and DacY/CdaZ classes are found in a similar branch of the tree, which is distinct from other bacterial and archaeal classes, and that this branch also contained several bacterial proteins. Homologs were identified in most euryarchaeal species, but no DACs were identified in crenarchaeota. Proteins of the DacY/CdaZ class, like CdaZ from M. jannaschii, contain an N‐terminal pyruvate kinase C‐terminal alpha/beta domain (PK_C) (Commichau et al., 2018; Corrigan & Gründling, 2013). Remarkably, although the conservation of the N‐terminal primary sequence of DacZ proteins was very low, homology modeling of the 3D structure of the N‐termini of these proteins indicated that members of the DacZ class and of the identified bacterial close homologs have a predicted fold similar to the N‐terminus of members of the DacY/CdaZ class. Thus, although they have low sequence similarity, DACs of the DacY/CdaZ and DacZ class most likely belong to a single widespread family of DACs sharing the common feature of an N‐terminal domain with a fold similar to the C‐terminal alpha/beta domain of pyruvate kinase.
Figure 1.
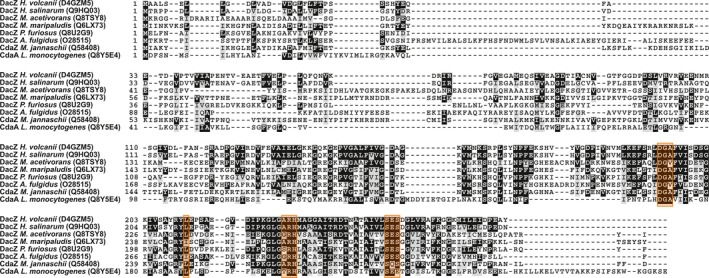
Alignment of euryarchaeal diadenylate cyclase DacZ proteins (protein ID in brackets) with the biochemically and structurally characterized bacterial DAC CdaA from Listeria monocytogenes (Rosenberg et al., 2015). Conservation of catalytically important residues within the DAC domain (Rosenberg et al., 2015) is indicated by orange rectangles
3.2. c‐di‐AMP is present in H. volcanii grown in different media and at different growth phases
The presence of a putative DAC in the genome of H. volcanii suggested that c‐di‐AMP might be present in this species as well. To answer this question, H. volcanii wild type strain (H26) (Allers et al., 2004) was grown to exponential and stationary phase in rich YPC and selective CAB media (Figure A2a), and cell pellet extracts were analyzed for the presence of c‐di‐AMP. For both media and growth phases, comparable amounts of c‐di‐AMP were detected (Figure A2b), however, with a tendency for increased c‐di‐AMP concentrations in cells grown in CAB medium. Combining two biological replicates (with three technical replicates each), a mean c‐di‐AMP concentration for growth in YPC of 8.17 ± 0.73 ng/mg protein was measured. For growth in CAB medium, a value of 12.01 ± 0.31 ng/mg protein was determined.
3.3. Heterologously expressed DacZ shows manganese‐dependent in vitro DAC activity
In order to investigate whether the H. volcanii dacZ encodes an active DAC, the coding sequence of dacZ was cloned into the expression vector p7XNH3, which adds a 10x histidine‐tag to the N‐terminus of the protein. Expression in conventional LB medium did not yield any soluble protein (Figure A3a) as the high‐salt environment adapted DacZ from H. volcanii most likely misfolded in the cytoplasm of E. coli. However, it is known that the addition of osmotically active substances (i.e., sucrose) to the medium increases the intracellular concentration of K+ ions and organic counterions in E. coli (Lucht & Bremer, 1994; McLaggan, Naprstek, Buurman, & Epstein, 1994). This increased intracellular osmolarity is likely to assist the proper folding of proteins from halophilic organisms as their native hosts naturally exhibit increased osmolarities in their cytoplasm as well (Oren, 2008). Indeed, the expression in osmotically active LB/SMM medium (see Section 2) led to soluble expression of DacZ in E. coli (Figure A3b). DacZ was purified by Ni‐affinity chromatography (Figure A4a,b) and assayed for in vitro DAC activity. Using α‐32P‐labeled ATP as a substrate, the synthesis of c‐di‐AMP (DAC activity) was observed for purified DacZ (Figure 2a). This DAC activity was specific for ATP as substrate (Figure 2a) and manganese (II)‐ions as cofactor (Figure 2b). In addition to TLC with radioactive [α‐32P]ATP, the formation of c‐di‐AMP by DacZ was also confirmed by mass spectrometry. 10 µmol/L DacZ obtained from three independent purifications was incubated with ATP for 1 hr at 37°C, which resulted in the production of a mean c‐di‐AMP concentration of 6.01 ± 0.11 µmol/L (with three technical replicates for each enzyme batch). Notably, E. coli, which was used as heterologous host for protein expression, does not possess any DACs (Corrigan et al., 2011). Therefore, the DAC activity observed in vitro originated from the haloarchaeal DacZ, confirming its identity as c‐di‐AMP producing DAC.
Figure 2.
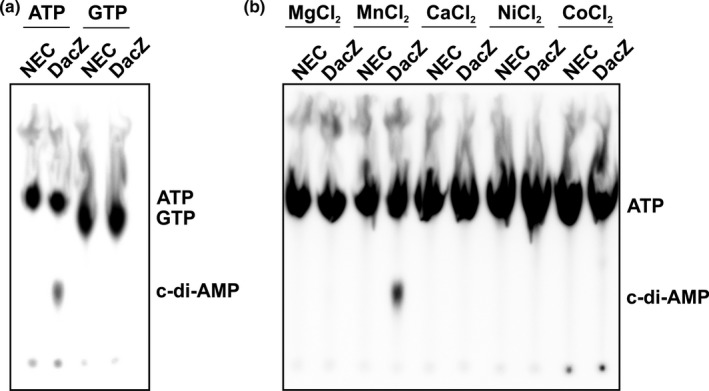
DAC activity measurements for substrate specify and metal cofactor usage of DacZ purified from Escherichia coli. (a) Phosphor screen of thin‐layer chromatography separating enzymatic products of in vitro DAC activity of DacZ using [α‐32P]ATP, respectively, [α‐32P]GTP as substrate. Figure represents one of three technical replicates with similar results. (b) Phosphor screen of thin‐layer chromatography separating enzymatic products of in vitro DAC activity of DacZ incubated with different metal‐(II) chloride solutions using [α‐32P]ATP as substrate. Figure represents one of three technical replicates with similar results. Position of cyclic di‐adenylate monophosphate (c‐di‐AMP) is indicated based on previous results from comparable assays (Bai et al., 2012) (NEC: non enzyme control)
3.4. c‐di‐AMP is essential and its levels need to be tightly regulated
Several studies showed that DAC genes in bacteria are essential and cannot be deleted under standard growth conditions (Commichau & Stülke, 2018; Corrigan & Gründling, 2013; Fahmi, Port, & Cho, 2017). Having validated the identity of dacZ as gene encoding a DAC in H. volcanii the question arose whether this gene is also essential for this archaeal species. Using qPCR, the expression profile of dacZ was analyzed in identical growth conditions as used for the extraction and isolation of c‐di‐AMP. The normalized absolute expression levels of dacZ were similar for exponential and stationary growth in rich YPC and selective CAB media (Figure A5), suggesting a constitutive expression of the gene under these standard conditions. The construction of a single gene deletion mutant of dacZ was then attempted. Comparable to results in various bacteria, it was not possible to obtain a ΔdacZ strain via the standard pop‐in/pop‐out method (Allers et al., 2004). In all halobacteria, the dacZ gene is found in an operon with the mscS2 gene (Figure A1). Deletion of the predicted dacZ + mscS2 operon also failed, but a single gene deletion of mscS2 could be obtained (Strain: HTQ412). These findings indicate that dacZ is an essential gene. To prove its essentiality, the dacZ gene was deleted from its chromosomal locus in a triple auxotrophic background strain (ΔpyrE2 ΔtrpA ΔhdrB; Strain: H99) using a trp +‐marked deletion construct, in the presence of dacZ on a low‐copy replicative plasmid marked with hdrB ([p‐dacZ + hdrB +]) to complement the genomic deletion in trans. Successful deletion of dacZ from its chromosomal locus was confirmed by restriction digest (using a unique StuI site within the trpA gene that replaced dacZ at its native locus) and subsequent Southern Blot analysis (Figure A6). The resulting chromosomal dacZ deletion strain (∆pyrE2 ∆trpA ∆hdrB ∆dacZ::trpA + p[dacZ + hdrB +]; Strain: HTQ413) was grown in medium containing thymidine and hypoxanthine, which relieves selective pressure for hdrB. When nonselectively cultivated cells of the chromosomal dacZ deletion strain were transferred to selective plates without thymidine and hypoxanthine, no auxotrophic colonies were obtained (Figure A7a), indicating that the complementing plasmid [p‐dacZ + hdrB +] could not be lost. As corresponding control experiment, a double auxotrophic background strain (ΔpyrE2 ΔhdrB; Strain: H98) was also transformed with the dacZ‐complementing plasmid [p‐dacZ + hdrB +] and subsequently subjected to identical unselective growth conditions. In these control experiments, several colonies auxotrophic for thymidine and hypoxanthine could be detected (Figure A7b). In three biological replicates of the control experiments, a mean loss‐of‐plasmid‐frequency of 64.56 ± 2.05% was determined. This proved that retention of the plasmid‐encoded dacZ gene is essential for the genomic dacZ deletion strain (Lestini et al., 2010).
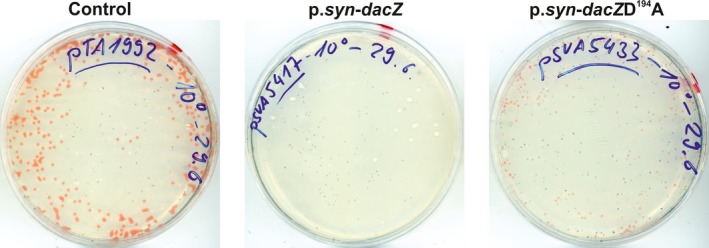
The fact that the dacZ gene is essential indicates that a certain level of c‐di‐AMP is essential for the viability of H. volcanii. For bacteria, it has been reported that increased levels of c‐di‐AMP have a harmful effect on the cells (Gundlach et al., 2015). To determine if this is also the case in H. volcanii, a plasmid for homologous overexpression of DacZ was constructed where the dacZ gene is under the control of a strong constitutively active promotor (p.syn) (Large et al., 2007). Transformation of a H. volcanii strain (H1424) that has been optimized for protein expression (Stroud, Liddell, & Allers, 2012) with this construct did not yield any transformed cells (Figure 3a; Figure A8), whereas an empty vector control gave several transformants (Figure 3a; Figure A8). A single amino acid mutation (D194→A) in the highly conserved D194GA motive of DacZ (Figure 1) was introduced in the overexpression plasmid as such a mutation is expected to abolish DAC activity (Rosenberg et al., 2015). This construct could be transformed into H. volcanii and yielded positive colonies, but they were smaller than those containing the empty vector control (Figure 3a; Figure A8). The expression of DacZ(D194A) was also confirmed by SDS‐PAGE and Western Blot analysis, making use of a 6x histidine‐tag fused to the N‐terminus (Figure 3b,c). This result suggested that increased expression of wild type DacZ leading to increased intracellular c‐di‐AMP levels is lethal for H. volcanii.
Figure 3.
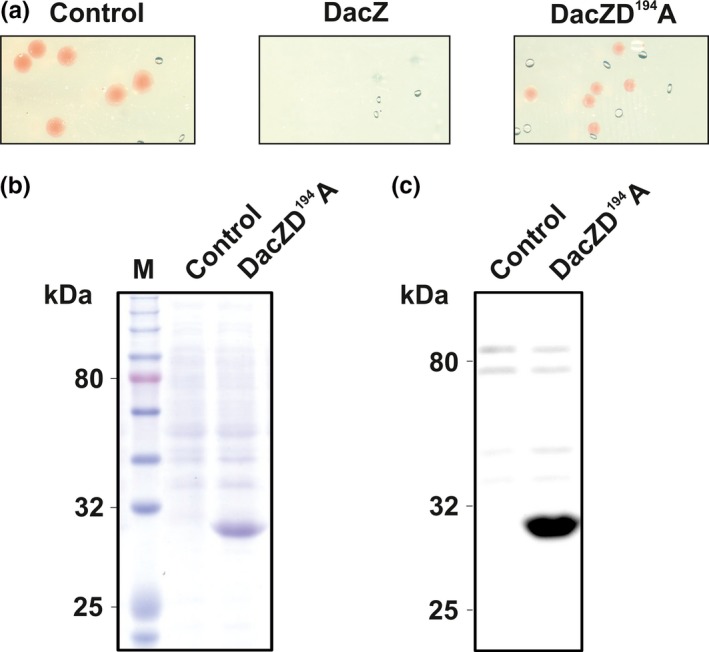
Homologous overexpression of DacZ and DacZD194A in Haloferax volcanii H1424. Figure represents one of three biological replicates with similar results. (a) Plate sections of H1424 transformed with empty backbone control (pTA1991), 6x histidine‐tagged DacZ overexpression construct (pSVA5417) and 6x histidine‐tagged DacZD194A overexpression construct (pSVA5433). (b) SDS‐PAGE of total cell pellet of H1424 cells transformed with empty backbone control or DacZD194A construct (Molecular weight 6x His‐DacZ: 29.8 kDa). (c) α‐histidine Western blot of total cell pellet of H1424 cells transformed with empty backbone control or DacZD194A construct. Bands appearing in both lines are unspecific bands characteristic for H. volcanii. (M: molecular weight marker)
3.5. Changed intracellular c‐di‐AMP levels causes increased cell volume in medium with low sodium chloride concentration
Because neither gene deletion nor overexpression of dacZ had been possible, a promotor exchange approach (Skowyra & MacNeill, 2012) was used to examine the effects of altered intracellular c‐di‐AMP levels. Two mutant strains were created where the native promotor of dacZ was replaced with the tryptophan‐inducible promotor (p.tnaA) of the tryptophanase gene tnaA (HVO_0789) (Large et al., 2007) or, respectively, with a genetically engineered version of p.tnaA with ~50% reduced activity (with regard to p.tnaA) (p.tnaM3) (MacNeill, unpublished data). The expression levels of dacZ were altered to the basal activity of p.tnaA (Strain: HTQ406) and p.tnaM3 (Strain: HTQ410), respectively. These two mutant strains showed no growth phenotype in medium with the standard concentration of NaCl (2.5 M) (Figure 4a). To investigate how the respective exchange of the native dacZ promotor influences the c‐di‐AMP concentration in the p.tnaA‐ and p.tnaM3‐induced dacZ‐expressing strains, cell extracts from standard‐salt medium stationary grown cultures were analyzed for their c‐di‐AMP content (Figure 4c). A comparison of the strains with the wild type revealed that, even though there was no obvious growth phenotype visible, they exhibit significantly reduced c‐di‐AMP levels. Especially the p.tnaM3‐induced strain showed considerably lower intracellular c‐di‐AMP levels. This observation suggested that due to the replacement of the promotor of dacZ with p.tnaA and p.tnaM3, respectively, the expression of DacZ was reduced which in turn led to decreased c‐di‐AMP concentrations within the two mutant strains.
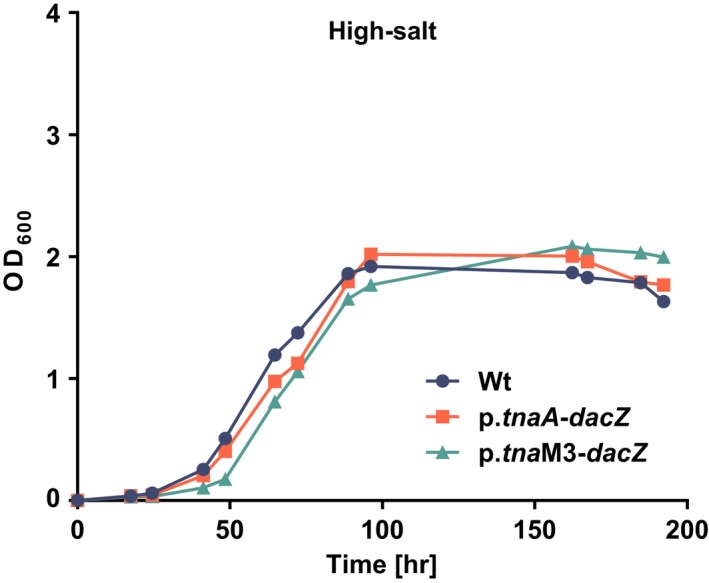
Figure 4.
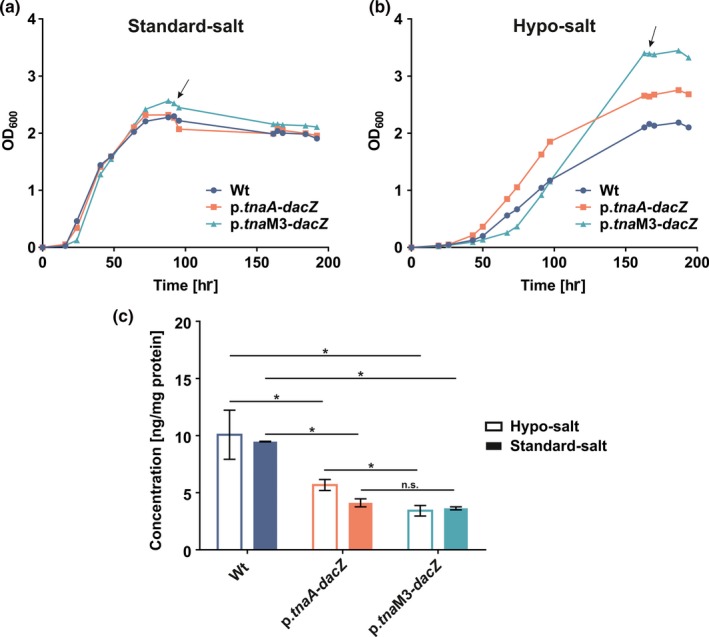
Measurement of cyclic di‐adenylate monophosphate (c‐di‐AMP) levels in Haloferax volcanii wild type (Wt), p.tnaA‐dacZ strain and p.tnaM3‐dacZ strain grown to stationary phase in hypo‐ (1.8 M NaCl) and standard‐salt (2.5 M NaCl) CAB medium. (a) Growth curves of wild type, p.tnaA‐dacZ strain and p.tnaM3‐dacZ strain in standard‐salt CAB medium. Figure represents one of five biological replicates with similar results. Curves represent mean of three technical replicates. Arrow indicates time point of cell material sampling for cyclic nucleotide extraction. (b) Growth curves of wild type, p.tnaA‐dacZ strain and p.tnaM3‐dacZ strain in hypo‐salt CAB medium. Figure represents one of five biological replicates with similar results. Curves represent mean of three technical replicates. Arrow indicates time point of cell material sampling for cyclic nucleotide extraction. (c) Levels of c‐di‐AMP detected for wild type, p.tnaA‐dacZ strain and p.tnaM3‐dacZ strain normalized to the protein content of each sample. Column values represent average of four biological replicates (hypo‐salt conditions), respectively, two biological replicates (standard‐salt conditions) with three technical replicates each. Error bars indicate standard deviation. Statistical analysis was performed using a two‐tailed Student's t test with a critical p‐value for significance corrected according to Bonferroni (p‐value: 0.05/3 (number of statistical tests) = 0.016). Asterisk (*) indicates a significant difference (p‐value < 0.016) (Hypo‐salt: Wt vs. p.tnaA‐dacZ: 0.0071; Wt vs. p.tnaM3‐dacZ: 0.0009; p.tnaA‐dacZ vs. p.tnaM3‐dacZ: 0.0005; Standard‐salt: Wt vs. p.tnaA‐dacZ: 0.0021; Wt vs. p.tnaM3‐dacZ: 0.0003). n.s.: not significant. For reasons of clarity statistical analysis for the comparison of a strain in hypo‐ and standard‐salt medium is excluded from the figure. Using a two‐tailed Student's t test with a critical p‐value for significance of 0.05 only the p.tnaA‐dacZ strain showed a significant (p‐value: 0.016) difference in these two different media)
The conservation of a predicted operon containing a DAC and an msc gene in various Haloarchaea suggests that c‐di‐AMP‐related signaling might be involved in the regulation of osmotic homeostasis. In order to test this hypothesis, the p.tnaA‐dacZ strain, the p.tnaM3‐dacZ strain, and the wild type as a control were subjected to growth in CAB medium with low (1.8 M: hypo‐salt) and increased (4.5 M: high‐salt) NaCl concentration. All three strains exhibited equal growth in high‐salt medium (Figure A9). However, in hypo‐salt medium, a growth phenotype for both mutants was observed (Figure 4b). In comparison to the wild type, the p.tnaA‐dacZ strain exhibited in general slightly elevated OD600 values in this condition. The p.tnaM3‐induced mutant had a different phenotype as it exhibited a prolonged lag phase followed by an extended exponential phase that peaked at an increased maximal OD. Additional analysis of the c‐di‐AMP levels of hypo‐salt medium stationary grown wild type, p.tnaA‐dacZ, and p.tnaM3‐dacZ cultures closely resembled the levels measured for growth in standard‐salt medium (Figure 4c). All three strains exhibited similar concentrations of c‐di‐AMP for growth in hypo‐ and standard‐salt medium with a slight tendency for increased c‐di‐AMP levels in hypo‐salt conditions. However, only for the p.tnaA‐induced strain, a significant difference between hypo‐ and standard‐salt c‐di‐AMP levels could be detected. The observation that the decreased intracellular c‐di‐AMP levels of the two mutant strains also occurred in hypo‐salt conditions suggested that the observed growth phenotypes are linked to the changes in the c‐di‐AMP levels. To investigate the hypo‐salt phenotype further, stationary phase cells were analyzed using phase‐contrast light microscopy. The cells of the p.tnaM3‐induced mutant were round but had an increased cell area (Figure 5c), compared to the wild type (Figure 5a) and p.tnaA‐dacZ cells (Figure 5b). Quantification of cell area (Figure 5d) and circularity (Figure 5e) confirmed that p.tnaM3‐dacZ cells were round (and not rod‐shaped and/or elongated which would also cause an increased cell area), like the wild type and p.tnaA‐dacZ cells, but in general bigger. Notably, there was a population among the analyzed p.tnaM3‐induced cells that exhibited a greatly increased cell area, suggesting that the increased OD600 values observed for this strain were caused by a swelling of the cells rather than elevated growth levels.
Figure 5.
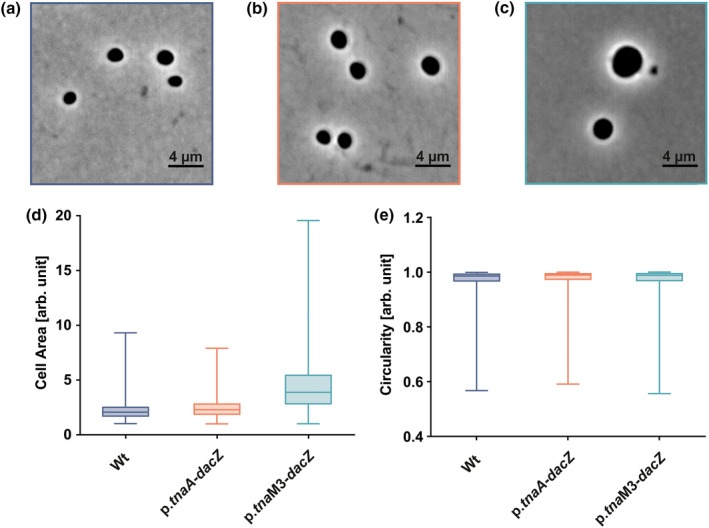
Phase‐contrast light microscopy and cell shape evaluation of Haloferax volcanii wild type, p.tnaA‐dacZ strain and p.tnaM3‐dacZ strain grown to stationary phase in hypo‐salt CAB medium (1.8 M NaCl). (a) Representative phase‐contrast image of wild type cells at a magnification of 1000x. Scale bar of 4 µm is indicated in the picture. (b) Representative phase‐contrast image of p.tnaA‐dacZ cells at a magnification of 1000x. (c) Representative phase‐contrast image of p.tnaM3‐dacZ cells at a magnification of 1000x. (d) Cell area distribution for wild type, p.tnaA‐dacZ strain and p.tnaM3‐dacZ strain. Boxes represent values from three biological replicates with >500 cells analyzed for each strain. Whiskers indicate the full range of variation (from minimal to maximal value). Band inside the box indicates the median. Higher values indicate increased cell area. (e) Cell circularity distribution for wild type, p.tnaA‐dacZ strain and p.tnaM3‐dacZ strain. Values close to one indicate that cells resemble a circle. Boxes represent values from three biological replicates with >500 cells analyzed for each strain. Whiskers indicate the full range of variation (from minimal to maxima value). Band inside the box indicates the median
As mentioned earlier, the conservation of a predicted operon of a DAC and an msc gene in haloarchaea suggests the involvement of c‐di‐AMP‐related signaling in osmotic homeostasis. To examine the role of the operonic msc gene and to exclude the possibility that the observed phenotypes of the p.tnaA‐dacZ strain and the p.tnaM3‐dacZ strain were rather caused by changes in expression of mscS2 than dacZ, the ΔmscS2 strain was also subjected to growth in hypo‐, standard‐, and high‐salt medium. This strain showed no growth phenotype in standard‐ and high‐salt medium (Figure A10b,c). However, at hypo‐salt conditions, the strain showed a phenotype that was distinct from the phenotypes of the p.tnaA‐, respectively, p.tnaM3‐induced strain as it exhibited slightly reduced growth (Figure A10a), suggesting an in general decreased adaption to low salt conditions.
4. DISCUSSION
This study provides the first direct evidence for the in vivo presence of c‐di‐AMP in an archaeal species. The haloarchaeal protein DacZ was identified as DAC and the corresponding gene dacZ was demonstrated to be essential, suggesting a vital function of c‐di‐AMP‐mediated signaling in H. volcanii. Growth experiments of H. volcanii strains with altered intracellular c‐di‐AMP levels showed distinct phenotypes and cell morphologies in hypo‐salt medium, but not in media with standard or increased NaCl concentration.
Various studies on intracellular c‐di‐AMP levels of bacteria have been conducted so far and a comparison with results presented here suggests that the intracellular concentration of c‐di‐AMP in H. volcanii (10.09 ng/mg protein on average under the tested conditions) is comparable to that reported for bacterial species. It was similar to levels in wild type Bacillus subtilis (5.6 ± 2.82 ng/mg protein) (Mehne et al., 2013), however, considerably lower than the measurements in Staphylococcus aureus (~140 ng/mg protein) (Bowman, Zeden, Schuster, Kaever, & Gründling, 2016).
All c‐di‐AMP‐producing DACs share a conserved DAC domain (also known as DisA_N) that catalyzes the reaction of two ATP to form c‐di‐AMP. Several different families of DACs have been identified, which all differ in their additional regulatory domain (Commichau et al., 2018; Corrigan & Gründling, 2013). So far, members of four bacterial DAC classes have been characterized in more detail: DisA (Witte et al., 2008), DacA/CdaA (Rosenberg et al., 2015), DacB/CdaS (Mehne et al., 2014), and CdaM (Blötz et al., 2017). Additionally, DAC activity has been demonstrated for a representative of the archaeal DacY/CdaZ class (Kellenberger et al., 2015). For bacterial DACs, it has been reported that the aspartic acid within the highly conserved DGA motif interacts with an ATP molecule bound to a second DAC molecule (Rosenberg et al., 2015). As this motif is also conserved in the haloarchaeal (and other euryarchaeal) DacZ it suggests that this DAC also forms dimers or higher oligomers to catalyze the formation of c‐di‐AMP. Contrary to biochemically characterized bacterial DAC representatives, which were reported to have a certain promiscuity for their metal cofactor (Bai et al., 2012; Rosenberg et al., 2015), DacZ from H. volcanii exhibited activity exclusively with manganese. A phylogenetic analysis of the DAC domain of proteins related to DacZ from H. volcanii showed that homologs are presents in almost all euryarchaea and in some bacteria and that, remarkably, structure prediction methods revealed that the N‐terminal domain has, despite low sequence homology, a fold that resembles the pyruvate kinase C‐terminal alpha/beta domain (PK_C) fold. This domain is also found in DAC representatives of the DacY/CdaZ class (Commichau et al., 2018; Corrigan & Gründling, 2013) suggesting that the archaeal DAC classes DacZ and DacY/CdaZ form one large family that is not exclusively found in archaea but also in some bacteria (Figure A1). The PK_C fold was initially identified to bind fructose‐1,6‐bisphosphate to allosterically regulate the activity of pyruvate kinase. Alternatively, the putative pyruvate kinase (AF0103) from Archaeoglobus fulgidus (PDB: 1VP8) was shown to bind flavin mononucleotide ([Link]). This suggests a regulatory role for this N‐terminal domain.
Various studies in bacterial model organisms have shown that both a complete deletion of c‐di‐AMP (by deletion of DACs) and increased levels of the nucleotide are lethal for cells under standard growth conditions, which has earned c‐di‐AMP the name of “an essential poison” (Gundlach et al., 2015). The results presented in this study suggest that this is also the case for H. volcanii. However, for species where c‐di‐AMP‐related signaling was described in more detail, conditions were found under which DAC(s) could be deleted (Gundlach et al., 2017; Whiteley et al., 2015). Therefore, it is possible that under certain conditions, a deletion of dacZ, and thereby c‐di‐AMP, in H. volcanii could be accomplished.
Nevertheless, for standard growth conditions c‐di‐AMP is essential, suggesting its involvement in a vital cellular function. In order to survive in their high salinity habitats, haloarchaea like H. volcanii concentrate high amounts of potassium chloride in their cytoplasm to balance the high osmolarity of the surrounding environment (Meury & Kohiyama, 1989; Thombre, Shinde, Oke, Dhar, & Shouche, 2016). Results from bacteria that demonstrated c‐di‐AMPs' involvement in osmotic regulation and the fact that a membrane channel lies within the conserved haloarchaeal DAC operon indicated that c‐di‐AMP might have an osmoregulatory function in H. volcanii as well. The results for growth of the p.tnaM3‐dacZ strain with its reduced c‐di‐AMP levels in hypo‐salt medium support this assumption. Cells of this strain had an increased cell area (and thereby also volume) which suggests an increased influx of medium/liquid to the cytoplasm. This observation matches with current models in bacteria where mutant strains of various species with decreased c‐di‐AMP levels exhibited phenotypes which were thought to be caused by an uncontrolled influx of osmolytes (Commichau, Gibhardt, Halbedel, Gundlach, & Stülke, 2017). For the p.tnaM3‐induced strain, this suggests an in general increased (in comparison to the wild type) import of osmotically active substances to the cytoplasm. Under standard growth conditions (and also in high‐salt medium), p.tnaM3‐dacZ cells showed no phenotype despite their reduced c‐di‐AMP content (Figure 4a,c; Figure A9). For these conditions, an increased influx of osmolytes might not necessarily cause a swelling of the cells as the high osmolarity of the surrounding medium would balance the increased osmolarity of the cytoplasm. However, in hypo‐salt medium, an uncontrolled import of osmolytes would increase the osmotic imbalance between medium and cytoplasm leading to the proposed influx of medium/liquid to the cells. In addition, the p.tnaA‐induced strain, which exhibited also a trend to lower c‐di‐AMP levels than the wild type (Figure 4c), showed also a growth phenotype in hypo‐salt medium slightly resembling the one of p.tnaM3‐dacZ cells. However, the phenotypical effects of the c‐di‐AMP level reduction in this strain were considerably weaker than what could have been expected given the fact that the p.tnaA‐induced strain exhibited only a slightly higher c‐di‐AMP content than p.tnaM3‐induced cells. These results again suggest that c‐di‐AMP levels in H. volcanii are subjected to a tight regulation and that a slight deviation already causes perceptible effects. Comparing c‐di‐AMP levels of wild type cells grown in hypo‐ and standard‐salt medium, a tendency to an increase of intracellular c‐di‐AMP in hypo‐salt conditions could be observed. Even though the difference was statistically not significant it supports the theory that a decrease in c‐di‐AMP concentration leads to an uncontrolled osmolyte influx as, in turn, increased c‐di‐AMP levels in the wild type grown in hypo‐salt conditions would cause a reduced import of osmolytes equivalent to an adaption to the reduced osmolarity of the surrounding environment.
As the mscS2 gene lies in a predicted operon with dacZ, a change in the promotor for dacZ would most likely also influence expression of the mechanosensitive channel. However, the fact that mscS2 could be deleted under standard growth conditions, indicates that this DAC operon included channel protein is, at least, not one of the main targets of c‐di‐AMP signaling under the tested conditions. This is also in line with bacterial studies that showed that mechanosensitive channels are rather controlled by means of their expression rate (Booth, 2014; Edwards et al., 2012), suggesting a function of the mscS2 gene under conditions where increased c‐di‐AMP levels, and thereby increased expression of the operon dacZ and mscS2, are necessary.
Future experiments will elucidate the targets of c‐di‐AMP in H. volcanii and uncover the regulatory mechanism, which seems to be important for the osmotic homeostasis in this organism.
CONFLICT OF INTERESTS
None declared.
AUTHORS CONTRIBUTION
F.B. designed the experiments and analyzed data under supervision from C.v.d.D. and S.V.A. Most of the experiments were performed by F.B., except for several growth experiments (performed by L.T.) and enzyme assays using radioactive‐labeled nucleotides (performed by C.v.d.D.). The manuscript was written by F.B. with input from C.v.d.D., T.A., and S.V.A. V.K. supervised LC‐MS/MS measurements of c‐di‐AMP. T.Q. helped in supervising the project and S.V.A. conceived the original idea.
ETHICS STATEMENT
None required.
ACKNOWLEDGEMENTS
FB was supported by an ERC starting grant (ARCHAELLUM, 311523). We thank Annette Garbe and Anna Lena Hagemann for performing c‐di‐AMP mass spectrometry measurements and their technical assistance. In addition, we wish to thank Friedhelm Pfeifer for pointing out the conservation of the predicted dacZ+msc operon in Haloarchaea and Phillip Nussbaum for assistance with H. volcanii microscopy. We are grateful to Stuart MacNeill for providing pNPM‐tnaM3‐HfxMCM (source of p.tnaM3 promotor).
APPENDIX 1.
Table A1.
Strains used in this study
| Strain name | Background strain | Genotype | Source/reference |
|---|---|---|---|
| Haloferax volcanii | |||
| H26 | – | ∆pyrE2 | Allers et al., 2004 |
| H98 | – | ∆pyrE2 ∆hdrB | Allers et al., 2004 |
| H99 | – | ∆pyrE2 ∆trpA ∆hdrB | Allers et al., 2004 |
| H1424 | – | ∆pyrE2 ∆hdrB Nph‐pitA ∆mrr cdc48d‐Ct | Stroud et al., 2012 |
| HTQ92 | H26 | ∆pyrE2 dacZ +::[dacZ pyrE2 +] | This study |
| HTQ405 | H98 | ∆pyrE2 ∆hdrB dacZ +::[p.tna‐dacZ hdrB + pyrE2 +] | This study |
| HTQ406 | H98 | ∆pyrE2 ∆hdrB p.tna‐dacZ‐hdrB + | This study |
| HTQ407 | H98 | ∆pyrE2 ∆hdrB dacZ +::[p.tnaM3‐dacZ hdrB + pyrE2 +] | This study |
| HTQ408 | H26 | ∆pyrE2 Operon dacZ+mscS2 +::[∆dacZ+mscS2 pyrE2 +] | This study |
| HTQ409 | H99 | ∆pyrE2 dacZ +::[∆dacZ::trpA + pyrE2 +] | This study |
| HTQ410 | H98 | ∆pyrE2 ∆hdrB p.tnaM3‐dacZ‐hdrB + | This study |
| HTQ411 | H26 | ∆pyrE2 mscS2 +::[∆mscS2 pyrE2 +] | This study |
| HTQ412 | H26 | ∆pyrE2 ∆mscS2 | This study |
| HTQ413 | H99 | ∆pyrE2 ∆trpA ∆hdrB ∆dacZ::trpA + p[dacZ + hdrB +] | This study |
| Escherichia coli | |||
| 10‐beta competent cells “TOP10” | – | Δ(ara‐leu) 7697 araD139 fhuA ΔlacX74 galK16 galE15 e14‐ ϕ80dlacZΔM15 recA1 relA1 endA1 nupG rpsL (StrR) rph spoT1 Δ(mrr‐hsdRMS‐mcrBC) | New England Biolabs |
| dam−/dcm− competent | – | ara‐14 leuB6 fhuA31 lacY1 tsx78 glnV44 galK2 galT22 mcrA dcm‐6 hisG4 rfbD1 R(zgb210::Tn10) TetS endA1 rspL136 (StrR) dam13::Tn9 (CamR) xylA‐5 mtl‐1 thi‐1 mcrB1 hsdR2 | New England Biolabs |
| Rosetta™(DE3) competent cells | – | F − ompT hsdS B(rB ‐ mB ‐) gal dcm (DE3) pRARE (CamR) | Novagen |
Table A2.
Plasmids used in this study
| Plasmid number | Description | Primers used | Enzymes used | Source/reference |
|---|---|---|---|---|
| pTA131 | pyrE2 marked integrative vector for knock‐outs in Haloferax volcanii (Ampr) | – | – | Allers et al., 2004 |
| pTA298 | Vector containing trpA marker under a ferredoxin promoter between two BamHI sites (Ampr) | – | – | Lestini et al., 2010 |
| pTA356 | hdrB marked shuttle vector with pHV1 replication origin (Ampr) | – | – | Norais et al., 2007 |
| pTA409 | pyrE2 and hdrB marked shuttle vector with pHV1 replication origin (Ampr) | – | – | Delmas et al., 2009 |
| pTA1228 | pyrE2 and hdrB marked expression vector with pHV2 replication origin and tryptophanase promoter p.tnaA, for tryptophan‐inducible gene expression of N‐terminal 6x His‐tagged protein (Ampr) | – | – | Brendel et al., 2014 |
| pTA1369 | pyrE2 marked vector containing a tryptophan promotor (p.tnaA)‐multiple cloning site‐construct with a hdrB marker under a ferredoxin promotor between two BglII sites; used to generate a tryptophan‐inducible allele of gene (Ampr) | – | – | This study; derived from pTA131 and pTA1228 (see Figure A11) |
| pTA1392 | pyrE2 and hdrB marked expression vector pTA1228 with insertion of Strep II tag, for tryptophan‐inducible gene expression of N‐terminal 6x His‐tagged and/or C‐terminal StrepII‐tagged protein (Ampr) | – | – | Gamble‐Milner, 2016 |
| pTA1451 | pyrE2 marked vector containing a tryptophan promotor with reduced leak activity (p.tnaM3)‐multiple cloning site‐construct with a hdrB marker under a ferredoxin promotor between two BglII sites; used to generate a tryptophan‐inducible allele of gene (Ampr) | – | ClaI; BclI; NdeI | This study; p.tnaM3 promoter from pNPM‐tnaM3‐HfxMCM (S. MacNeill, unpublished)(see Figure A11) |
| pTA1992 | pyrE2 and hdrB marked expression vector with pHV2 replication origin and synthetic promoter (p.syn), for constitutive gene expression of N‐terminal 6x His‐tagged and/or C‐terminal StrepII‐tagged protein (Ampr) | p.synF; p.synR2 | BstBI; NdeI | This study |
| p7XNH3 | Expression vector for E. coli using T7‐promotor with N‐terminal 10x His‐Tag (FX‐Cloning system) (Kanar) | – | – | Geertsma & Dutzler, 2011 |
| pSVA3930 | pTA131‐based deletion construct for dacZ containing ~500 bp upstream and downstream flanking regions ligated via BamHI site (Ampr) | 8001; 8002; 8003; 8004 | KpnI; BamHI; XbaI | This study |
| pSVA5408 | p7XNH3‐based expression vector for heterologous expression of dacZ with N‐terminal 10x His‐Tag in Escherichia coli (Kanar) | 7644; 7645 | SapI | This study |
| pSVA5411 | pTA1369‐based vector containing a tryptophan‐inducible (p.tnaA) allele of dacZ with a hdrB marker under a ferredoxin promotor between two BglII sites (Ampr) | 7654; 7662 | NdeI; EcoRI | This study |
| pSVA5414 | pSVA3930‐based integrative vector with tryptophan‐inducible (p.tnaA) allele of dacZ with a hdrB marker under a ferredoxin promotor inserted between upstream and downstream flanking regions at BamHI site (Ampr) | – | BglII; BamHI | This study |
| pSVA5417 | pTA1992‐based expression vector for homologous expression of dacZ with N‐terminal 6x His‐Tag in H. volcanii (Ampr) | 7669; 7633 | PciI; NcoI; EcoRI | This study |
| pSVA5418 | pTA131‐based deletion construct for predicted Operon dacZ+mscS2 containing ~500 bp upstream and downstream flanking regions ligated via BamHI site (Ampr) | 8001; 7672 | KpnI; BamHI; XbaI | This study |
| pSVA5419 | pTA1451‐based vector containing a tryptophan‐inducible (p.tnaM3) allele of dacZ with a hdrB marker under a ferredoxin promotor between two BglII sites (Ampr) | – | NdeI; XhoI | This study |
| pSVA5420 | pSVA3930‐based integrative vector marked with trpA under a ferredoxin promoter ligated at BamHI site (Ampr) | – | BamHI | This study |
| pSVA5421 | pTA356‐based episomal vector containing dacZ with ~1,000 bp upstream and downstream flanking regions (Ampr) | 7680; 7681 | KpnI; BamHI | This study |
| pSVA5422 | pTA409‐based episomal vector containing dacZ with ~1,000 bp upstream and downstream flanking regions (Ampr) | 7680; 7681 | KpnI; BamHI | This study |
| pSVA5427 | pTA131‐based deletion construct for mscS2 containing ~500 bp upstream and downstream flanking regions ligated via BamHI site (Ampr) | 7690; 7693 | KpnI; BamHI; XbaI | This study |
| pSVA5433 | pSVA5417‐based expression vector for homologous expression of dacZ(D194A) with N‐terminal 6x His‐Tag in H. volcanii (Ampr) | 9804; 9805 | – | This study |
Table A3.
Primers used in this study
| Primer number/name | Sequence 5ʹ→3ʹ | Description |
|---|---|---|
| pPCR primers | ||
| 7687 | GAACTGCAGGGGCAACTCCACGAAC | Forward qPCR‐primer amplifying short fragment of dacZ (amplicon size: 160 bp) |
| 7688 | ATTATTGGGCGACCTCGTGGCGGAC | Reverse qPCR‐primer amplifying short fragment of dacZ (amplicon size: 160 bp) |
| Generation and identification of Haloferax volcanii knock‐out strains | ||
| 8001 | GATAGGTACCCGTACTCCCACTTCAACTTC | Forward primer amplifying upstream flank of dacZ/predicted Operon dacZ+mscS2 for knock‐out construct with KpnI site (cloned in pTA131) |
| 7608 | GATTGGATCCTGGTGGAGAGAGACACCGGGTGAG | Reverse primer amplifying upstream flank of dacZ/predicted Operon dacZ+mscS2 for knock‐out construct with BamHI site (cloned in pTA131) |
| 7609 | TAGTATGGATCCGATGCCGGGGTTCGCTTC | Forward primer amplifying downstream flank of dacZ for knock‐out construct with BamHI site (cloned in pTA131) |
| 8004 | GTACTCTAGACGACGAGCAGTTCGACCTTG | Reverse primer amplifying downstream flank of dacZ for knock‐out construct with XbaI site (cloned in pTA131) |
| 7610 | GCCCTTCTGCCCTTTCTTGC | Forward primer amplifying 113 bp probe of dacZ |
| 7634 | AGAACATGCGGTCGGGCATC | Reverse primer amplifying 113 bp probe of dacZ |
| 7612 | TGTTCACGCCCGAGATACTG | Forward primer used to check if knock‐out of dacZ/predicted Operon dacZ+mscS2 was successful (annealing outside the flanking regions used on the knock‐out construct) |
| 7613 | AGCGTGGCGAGAAAGAAGAC | Reverse primer used to check if knock‐out of dacZ was successful (annealing outside the flanking regions used on the knock‐out construct) |
| 7671 | ATATAATGGATCCGCGCTCGGACCCGGGGTCACTG | Forward primer amplifying downstream flank of predicted Operon dacZ+mscS2 for knock‐out construct with BamHI site (cloned in pTA131) |
| 7672 | TGCATCTAGAGCCGACACGACCGAATCCAGCACCAC | Reverse primer amplifying downstream flank of predicted Operon dacZ+mscS2 for knock‐out construct with XbaI site (cloned in pTA131) |
| 7683 | GAACCGACCGACGAGTGGATGAG | Forward primer amplifying 108 bp probe of predicted Operon dacZ+mscS2 |
| 7684 | CTCGTCCGGGCGTTCAAGG | Reverse primer amplifying 108 bp probe of predicted Operon dacZ+mscS2 |
| 7673 | ATCGACCACATGGCCGAACTC | Reverse primer used to check if knock‐out of predicted Operon dacZ+mscS2/mscS2 was successful (annealing outside the flanking regions used on the knock‐out construct) |
| 7690 | GTAGGTACCGCGTGATGCTCAACTACGTGTTCG | Forward primer amplifying upstream flank of mscS2 for knock‐out construct with KpnI site (cloned in pTA131) |
| 7691 | TATTATAGGATCCGCGCTCGGACCCGGGGTCAC | Reverse primer amplifying upstream flank of mscS2 for knock‐out construct with BamHI site (cloned in pTA131) |
| 7692 | AATGGATCCCTCAGTACGCCTCCGGGTCGATTTC | Forward primer amplifying downstream flank of mscS2 for knock‐out construct with BamHI site (cloned in pTA131) |
| 7693 | TCATTCTAGACGCGTCCGCGTCGAGGAGAACATGC | Reverse primer amplifying downstream flank of mscS2 for knock‐out construct with XbaI site (cloned in pTA131) |
| 7694 | CCAGAATGGCGATGAACAAC | Forward primer amplifying 118 bp probe of mscS2 |
| 7695 | TATTTCGTCCTCGGCATCAG | Reverse primer amplifying 118 bp probe of mscS2 |
| 7611 | AACGTCAAAGACCGCATCCGCTTCG | Forward primer used to check if knock‐out of mscS2 was successful (annealing outside the flanking regions used on the knock‐out construct) |
| pTA131 fw seq | GGGGGATGTGCTGCAAGG | Forward primer used for sequencing pTA131/pTA356/pTA409/pTA1992 based constructs |
| pTA131 rv seq | TGACCATGATTACGCCAAGC | Reverse primer used for sequencing pTA131/pTA356/pTA409/pTA1992 based constructs |
| Generation and identification of H. volcanii strains with exchanged promotor | ||
| 7654 | ATCGCATATGGCGGCGTTATCCGAATTATTGGGCGAC | Forward primer amplifying dacZ for generation of tryptophan‐inducible alleles with NdeI site (cloned in pTA1369) |
| 7662 | ATGCGAATTCTCAGTACGCCTCCGGGTCGATTTCGAG | Reverse primer amplifying dacZ for generation of tryptophan‐inducible alleles with EcoRI site (cloned in pTA1369) |
| 7610 | GCCCTTCTGCCCTTTCTTGC | Forward primer used to check correct (=upstream) pop‐in of tryptophan‐inducible alleles of dacZ |
| 7665 | TCACGCCCGAGATACTGACAAC | Reverse primer used to check correct (=upstream) pop‐in of tryptophan‐inducible alleles of dacZ |
| Cloning of protein expression constructs | ||
| 7669 | GATACCATGGCGGCGTTATCCGAATTATTGGG | Forward primer amplifying dacZ for homologous protein expression with NcoI site (cloned in pTA1992) |
| 7633 | GATTGAATTCTCAGTACGCCTCCGGGTCGAT | Reverse primer amplifying dacZ for homologous protein expression with EcoRI site (cloned in pTA1992) |
| 7644 | GCACATGCTCTTCTAGTGCTGCGTTATCCGAATTATTGGGCGAC | Forward primer amplifying dacZ for heterologous protein expression with SapI site (cloned with FX‐system in p7XNH3) |
| 7645 | GCTGTAGCTCTTCATGCGTACGCCTCCGGGTCGATTTCGAGAAT | Reverse primer amplifying dacZ for heterologous protein expression with SapI site (cloned with FX‐system in p7XNH3) |
| 9804 | GGCTCGCCGGCGCGTTCGTCATCTC | Froward primer introducing single base pair mutation in pSVA5417 changing codon for Asp194 (GAC) to Ala (GCC) |
| 9805 | GCGCCGGCGAGCCGCGAGAACTC | Reverse primer introducing single base pair mutation in pSVA5417 changing codon for Asp194 (GAC) to Ala (GCC) |
| p.synF | CGAGAATCGAAACGCTTATAAGTGCCCCCCGGCTAGAGAGAT | Forward primer to generate p.syn synthetic promoter (Large et al., 2007) |
| p.synR2 | TAATCTCTCTAGCCGGGGGGCACTTATAAGCGTTTCGATTCT | Reverse primer to generate p.syn synthetic promoter (Large et al., 2007) |
| Genomic dacZ knock‐out and in trans complementation | ||
| 7680 | TAAGGTACCGACGGAGCGTAATCGGTCGTCGTAG | Forward primer amplifying dacZ +approx. 1,000 bp upstream and downstream as episomal copy with KpnI site (cloned in pTA356/pTA409) |
| 7681 | TATGGATCCTGTGGTGTAGACCTTCGCAGGTTCG | Reverse primer amplifying dacZ +approx. 1,000 bp upstream and downstream as episomal copy with BamHI site (cloned in pTA356/pTA409) |
| 7682 | CGACTACGAGTCCTCGCTCGAATACG | Forward primer binding in trpA gene to check for correct orientation in trpA‐marked deletion construct |
| 8004 | GTACTCTAGACGACGAGCAGTTCGACCTTG | Reverse primer binding in downstream flanking region of dacZ to check for correct trpA orientation in trpA‐marked deletion construct |
| 7689 | TATCGTTGCGGGAAATGTGC | Forward primer used to check for dacZ replacement by trpA (annealing outside the upstream regions used on the episomal plasmid) |
| 7673 | ATCGACCACATGGCCGAACTC | Reverse primer used to check for dacZ replacement by trpA (annealing outside the downstream regions used on the episomal plasmid) |
| 9802 | AGTTCCGGCCAGAACACGTC | Forward primer amplifying 154 bp probe of HVO_1658 for verification of genomic dacZ replacement by genomic DNA digestion |
| 9803 | GGCGCGTGATGCTCAACTAC | Reverse primer amplifying 154 bp probe of HVO_1658 for verification of genomic dacZ replacement by genomic DNA digestion |
qPCR: quantitative PCR.
Figure A1.
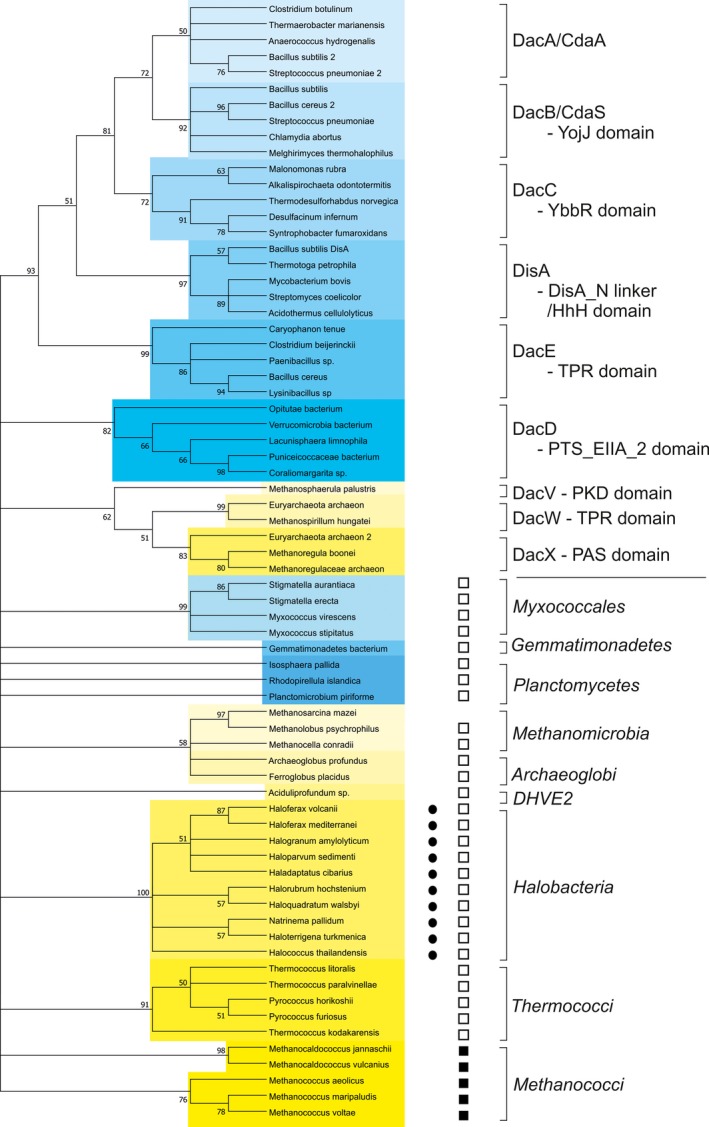
Molecular Phylogenetic analysis of Haloferax volcanii diadenylate cyclase (DacZ) and other di‐adenylate cyclases by Maximum Likelihood method. To analyze the phylogenetic relation between H. volcanii DacZ and other di‐adenylate cyclases, sequences related to DacY/CdaZ and representatives from previously identified bacterial and archaeal classed were collected (Commichau et al., 2018; Corrigan & Gründling, 2013), the adenylate cyclase domains were aligned, all positions containing gaps and missing data were eliminated and a phylogenetic tree was constructed (for details see below) using the Maximum Likelihood method based on the JTT matrix‐based model (Jones, Taylor, & Thornton, 1992). A bootstrap consensus tree inferred from 500 replicates is shown. Branches corresponding to partitions reproduced in less than 50% bootstrap replicates are collapsed. The percentage of replicate trees in which the associated taxa clustered together in the bootstrap test are shown next to the branches (Felsenstein, 1985). There were a total of 99 positions in the final dataset. Evolutionary analyses were conducted in MEGA7 (Kumar, Stecher, & Tamura, 2016). Within the tree, bacteria are indicated in blue, while archaea are indicated in yellow. On the right side, either the corresponding families of adenylate cycles are indicated (upper part), or the order or class to which the organisms belong is indicated (lower part). The closed circles indicate proteins which are encoded in an operon with a gene encoding a MscS channel. Closed black squares indicate proteins where a N‐terminal PK_C pyruvate kinase C‐terminal alpha/beta domain was identified via a conserved domain search (Marchler‐Bauer et al., 2017; result mode: Full). Open squares indicate proteins for which the Swiss‐model server (https://swissmodel.expasy.org) (Waterhouse et al., 2018) predicts an N‐terminal PK_C pyruvate kinase C‐terminal alpha/beta domain. Detailed method: H. volcanii DacZ was blasted against the NCBI non redundant database and the first 1,000 hits were selected and sequences with a similarity above 99% were removed, resulting in 600 sequences. Then, 10 representatives of the bacterial DacA/CdaA, DacB/CdaS, DacC, DisA, DacD classes, six representatives of the bacterial DacE, and 1, 2, 3, 10 and 10 representatives of the archaeal DacV, DacW, DacX, DacY/CdaZ and DacZ classes were selected. These sequences were combined and aligned using the MUSCLE algorithm. N‐ and C‐terminal sequences that did not encode for the di‐adenylate cyclase domain were removed, sequences were aligned again, and an initial phylogenetic tree was inferred by using the Maximum Likelihood method based on the JTT matrix‐based model (Jones et al., 1992). The bootstrap consensus tree inferred from 500 replicates (Felsenstein, 1985) was taken to represent the evolutionary history of the taxa analyzed (Felsenstein, 1985) Five sequences were selected that were representative of the main branches representing the DacA/CdaA (Bacillus subtilis [CDAA_BACSU], Clostridium botulinum [C5UT34_CLOBO], Anaerococcus hydrogenalis [A0A133LPS3_9FIRM], Streptococcus pneumoniae [A0A0B7L730_STREE], Thermaerobacter marianensis [013494666.1]), DacB/CdaS (B. subtilis [CDAS_BACSU], Bacillus cereus [J8JE08_BACCE], Chlamydia abortus [A0A1X6W494_CHLAO], S. pneumoniae [A0A0U0GIF0_STREE], Melghirimyces thermohalophilus [A0A1G6LWF9_9BACL]), DacC (Desulfacinum infernum (A0A1M5FM14_9DELT), Alkalispirochaeta odontotermitis (A0A0A0DNA5_9SPIO), Syntrophobacter fumaroxidans (A0LNX4_SYNFM), Malonomonas rubra (A0A1M6KRJ1_MALRU), Thermodesulforhabdus norvegica (A0A1I4QRW4_9DELT), DacD (Lacunisphaera limnophila (A0A1D8AXP5_9BACT), Puniceicoccaceae bacterium (A0A2A5VW89_9BACT), Coraliomargarita sp. (A0A1Z8WJT9_9BACT), Verrucomicrobia bacterium (A0A1Q6UHC2_9BACT), Opitutae bacterium (A0A2D5Y9T6_9BACT), DacE (Caryophanon tenue [A0A1C0YAV7_9BACL], B. cereus [A0A2C1SCY1_BACCE], Lysinibacillus sp. A [0A1T5G8C8_9BACI], Clostridium beijerinckii [A0A0B5QT99_CLOBE], Paenibacillus sp. [A0A198A0N3_9BACL]) and DisA (B. subtilis [DISA_BACSU], Streptomyces coelicolor [DISA_STRCO], Acidothermus cellulolyticus [DISA_ACIC1], Thermotoga petrophila [DISA_THEP1], Mycobacterium bovis [DISA_MYCBO]) classes. Also, representatives for the archaeal classes, DacV (Methanosphaerula palustris [B8GHP5_METPE]), DacW (Euryarchaeota archaeon [A0A1V5Z8G7_9EURY], Methanospirillum hungatei [Q2FM57_METHJ]) and DacX (Methanoregula boonei [A7I8S2_METB6], Methanoregulaceae archaeon [A0A1V4U3L9_9EURY], Euryarchaeota archaeon [A0A1V5ST82_9EURY] were included. From the other main branches, representatives of the bacterial orders Myxococcales (Myxococcus virescens [WP_090495195.1], Stigmatella erecta [WP_093522591.1], Myxococcus stipitatus (WP_015350295.1), Stigmatella aurantiaca [EAU67761.1]), Planctomycetales (Planctomicrobium piriforme [WP_092053393.1], Isosphaera pallida [WP_013566515.1], Rhodopirellula islandica [WP_047812869.1]) and Gemmatimonadales (Gemmatimonadetes bacterium [A0A2E4MZL2_9BACT]) were included. As members of the identified archaeal branches, organism from the following classes were included: Methanomicrobia (Methanolobus psychrophilus [WP_015053149.1], Methanosarcina mazei [AGF97235.1], Methanocella conradii [WP_014406877.1]), Archaeoglobi (Ferroglobus placidus [WP_012964775.1], Archaeoglobus profundus [WP_012940054.1]), the DHVE2 group (Aciduliprofundum sp. [WP_015283473.1]), Halobacteria (H. volcanii [WP_004041551.1], Haloferax mediterranei [WP_004056629.1], Natrinema pallidum [WP_006184372.1], Halococcus thailandensis [WP_007742370.1], Halorubrum hochstenium [WP_008580891.1], Haloquadratum walsbyi [WP_011571793.1], Haloterrigena turkmenica [WP_012943624.1], Haloparvum sedimenti [WP_058366734.1], Haladaptatus cibarius [WP_049970384.1], Halogranum amylolyticum [WP_089824883.1]), Thermococci (Thermococcus kodakarensis [WP_011249465.1], Thermococcus paralvinellae [WP_042679771.1], Pyrococcus furiosus [WP_011011999.1], Pyrococcus horikoshii_OT3 [BAA30112.1], Thermococcus litoralis [WP_004066846.1]) and Methanococci (Methanococcus voltae [D7DR02_ METV3], Methanocaldococcus vulcanius [C9RHV3_METVM], Methanococcus aeolicus [A6UTS6_ META3], Methanococcus maripaludis [WP_011867877.1], Methanocaldococcus jannaschii [WP_010870515.1]). The adenylate cyclase domains of these sequences were again aligned with MUSCLE, and from this alignment a bootstrap consensus tree was inferred from 500 replicates (Felsenstein, 1985) and taken to represent the evolutionary history of the taxa analyzed (Felsenstein, 1985). Initial tree(s) for the heuristic search were obtained automatically by applying Neighbor‐Join and BioNJ algorithms to a matrix of pairwise distances estimated using a JTT model, and then selecting the topology with superior log likelihood value
Figure A2.
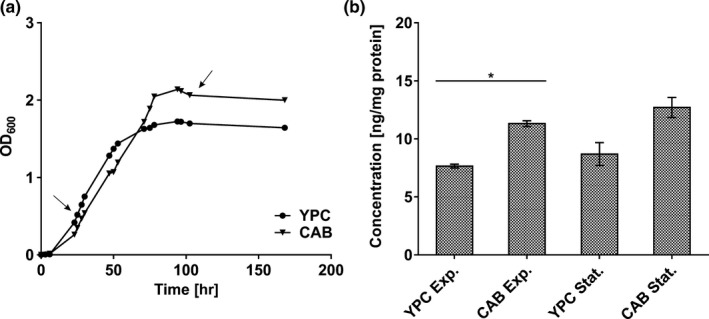
Measurement of cyclic di‐adenylate monophosphate (c‐di‐AMP) levels in Haloferax volcanii wild type grown under normal conditions in rich YPC and selective CAB medium. (a) Growth curves of wild type in YPC and CAB medium. Figure represents one of three biological replicates with similar results. Curves represent mean of three technical replicates. Arrows indicate time points of cell material sampling for cyclic nucleotide extraction. (b) Levels of c‐di‐AMP detected for H. volcanii wild type normalized to the protein content of each sample. Column values represent average of two biological replicates with three technical replicates each. Error bars indicate standard deviation. Statistical analysis was performed using a two‐tailed Student's t test with a critical p‐value for significance corrected according to Bonferroni (p‐value: 0.05/6 [number of statistical tests] = 0.0083). Asterisk (*) indicates a significant difference (p‐value < 0.0083) (YPC Exp. vs. CAB Exp.: 0.0034). (Exp.: exponential; Stat.: stationary)
Figure A3.
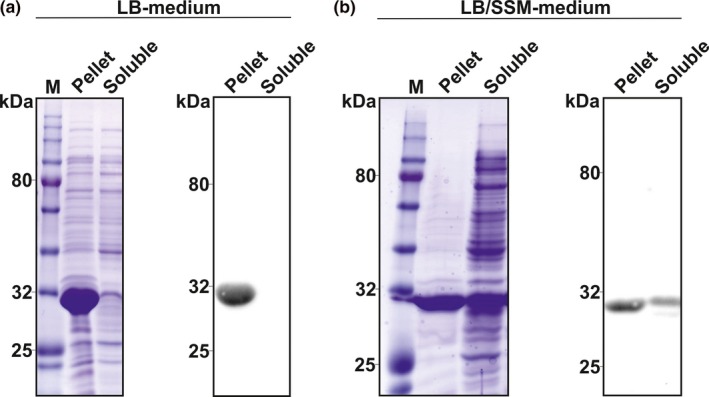
Analysis of heterologous expressed DacZ in Escherichia coli grown in LB‐ or LB/SMM‐medium. (a) SDSPAGE (left) and α‐histidine Western Blot (right) of pellet (insoluble) and soluble fraction of lysed E. coli cells expressing 10x histidine‐tagged DacZ (molecular weight 10x His‐DacZ: 30.3 kDa) grown in standard LB medium (M: molecular weight marker). (B) SDS‐PAGE (left) and α‐histidine Western Blot (right) of pellet (insoluble), and soluble fraction of lysed E. coli cells expressing 10x histidine‐tagged DacZ grown in osmotically active LB/SMM‐medium
Figure A4.
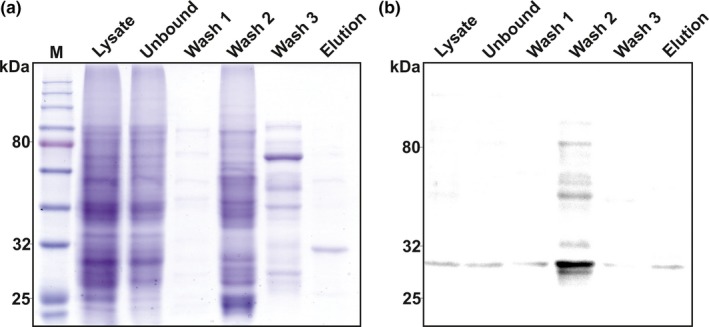
Heterologous expression and purification of Haloferax volcanii DacZ in Escherichia coli. (a) SDS‐PAGE of lysate, unbound, wash 1‐3, and elution fractions following purification of 10x histidine‐tagged DacZ (molecular weight 10x His‐DacZ: 30.3 kDa) (M: molecular weight marker). (b) α‐histidine Western blot of lysate, unbound, wash 1‐3, and elution fractions
Figure A5.
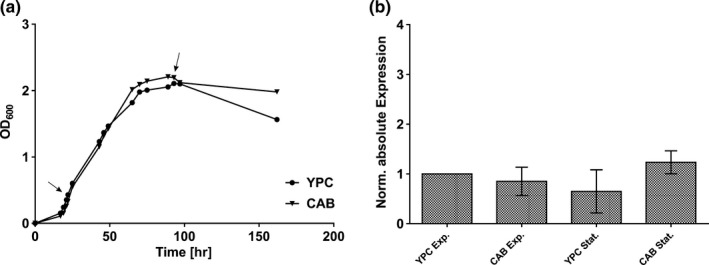
Comparison of dacZ transcription in Haloferax volcanii wild type grown under normal conditions in rich YPC and selective CAB medium. (a) Growth curves of wild type in YPC and CAB medium. Figure represents one of three biological replicates with similar results. Curves represent mean of three technical replicates. Arrows indicate time points of cell material sampling for RNA extraction. (b) Normalized absolute expression levels of dacZ in wild type grown in YPC and CAB medium. Column values represent average of three biological replicates with three technical replicates each. Error bars indicate standard deviation. Absolute expression was calculated using a standard curve of Cq‐values obtained for a defined amount of dacZ target sequence. Absolute expression levels for conditions YPC stationary growth and CAB exponential and stationary growth were normalized to expression in YPC exponential cells (set to 1). (Exp.: exponential; Stat.: stationary)
Figure A6.
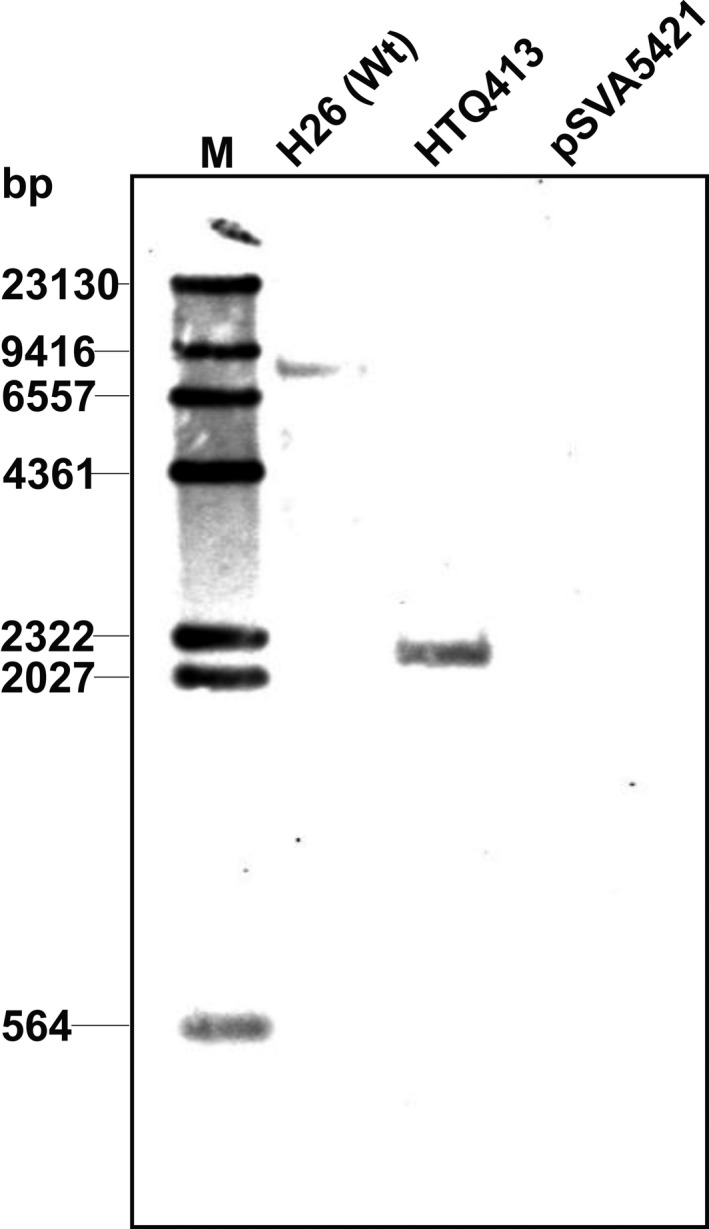
Southern blot detection of complete replacement of dacZ from its chromosomal locus by trpA gene (=Strain HTQ413) using a DIG‐labeled DNA probe against a flanking region within HVO_1659 that was not present on the trp +‐marked deletion construct pSVA5421. The genomic DNA of wild type and genomic dacZ deletion strain was digested with EcoRV and StuI. Expected size of target fragments differs due to a unique StuI site in the trpA gene: Wild type: 7,825 bp; HTQ413: 2,128 bp. The trp +‐marked deletion construct pSVA5421 was included as control. (M: molecular weight marker)
Figure A7.
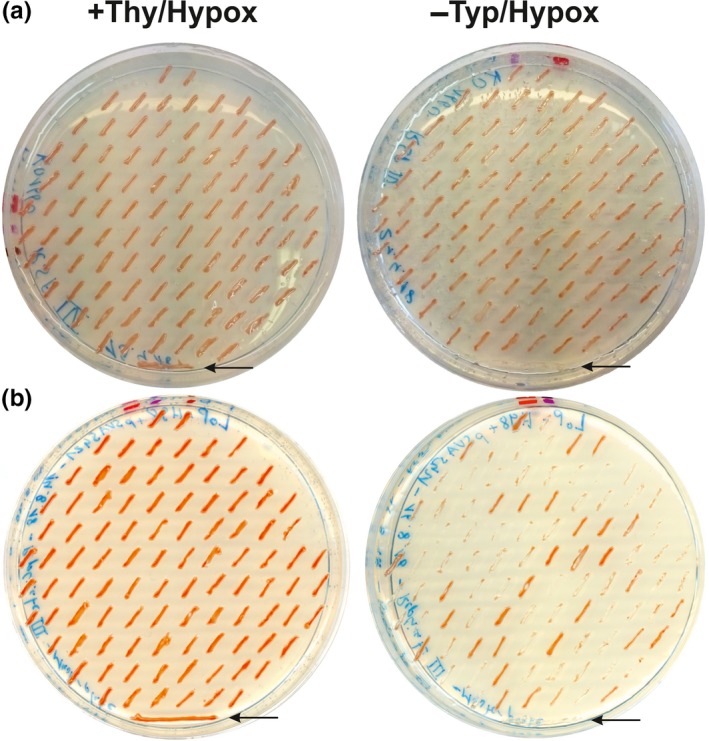
Loss of pSVA5421 (p[dacZ+hdrB+]) from HTQ413 (genomic dacZ deletion strain) and H98 (ΔpyrE2; ΔhdrB) (control) after unselective growth in CAB medium with thymidine & hypoxanthine. Figure represents one of three biological replicates with similar results. (a) Unselectively grown HTQ413 colonies (left) and growth of identical colonies on selective plate (right). Position of a colony within the grid pattern on the left plate is identical to the colonies' position on the right plate. Arrow indicates position of untransformed H98 as control strain. (b) Unselectively grown pSVA5421‐transformed H98 colonies (left) and growth of identical colonies on selective plate (right). Arrows indicate position of untransformed H98 as control strain
Figure A8.
Complete plates of H1424 transformed with the empty backbone control (pTA1992; p.syn‐), DacZ overexpression construct (pSVA5417; p.syn‐dacZ) and DacZD194A overexpression construct (pSVA5433; p.syn‐dacZD194A). Plates contain sections presented in main figure 4 and represent a biological replicate of three independent experiments with similar results
Figure A9.
Growth of H. volcanii wild type, p.tnaA‐dacZ strain and p.tnaM3‐dacZ strain in high‐salt (4.5 M NaCl) medium. Figure represents one of five biological replicates with similar results. Curves represent mean of three technical replicates
Figure A10.
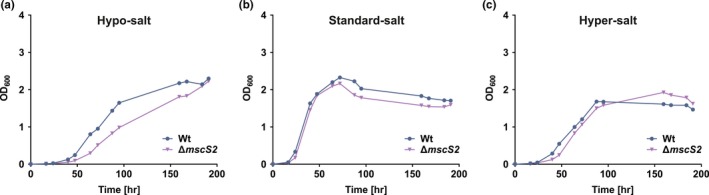
Growth of Haloferax volcanii wild type and ΔmscS2 in hypo‐, standard‐, and high‐salt medium. Figure represents one of three biological replicates with similar results. Curves represent mean of three technical replicates. (a) Growth curves of wild type and ΔmscS2 in CAB medium with 1.8 M NaCl (hypo‐salt). (b) Growth curves of wild type and ΔmscS2 in CAB medium with 2.5 M NaCl (standard‐salt). (c) Growth curves of wild type and ΔmscS2 in CAB medium with 4.5 M NaCl (high‐salt)
Figure A11.
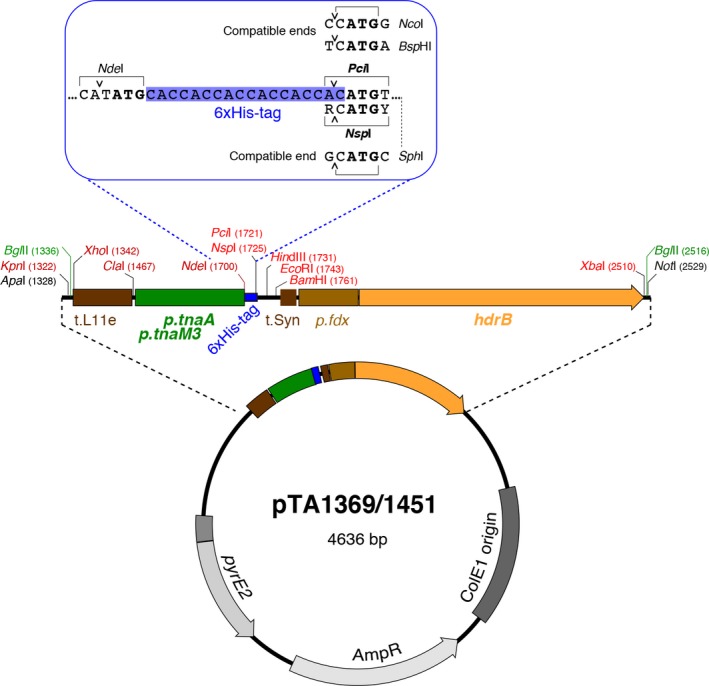
pTA1369 and pTA1451 are pyrE2‐marked vectors used to generate tryptophan‐inducible alleles of genes at their native chromosomal locus. They feature a multiple cloning site comprising a tryptophanase promotor p.tnaA in pTA1369 or a reduced activity p.tnaM3 promoter in pTA1451, an optional 6x His tag, and an hdrB marker under a ferredoxin promotor; the multiple cloning site is flanked by BglII sites, so that it can be inserted at the compatible BamHI site between the upstream and downstream flanking sequences of a gene deletion construct
Braun F, Thomalla L, van der Does C, et al. Cyclic nucleotides in archaea: Cyclic di‐AMP in the archaeon Haloferax volcanii and its putative role. MicrobiologyOpen. 2019;8:e829 10.1002/mbo3.829
DATA ACCESSIBILITY
No sequence or proteomic data need to be accessible for this manuscript.
REFERENCES
- Allers, T. , Ngo, H.‐P. , Mevarech, M. , & Lloyd, R. G. (2004). Development of additional selectable markers for the halophilic archaeon Haloferax volcanii based on the leuB and trpA genes. Applied and Environment Microbiology, 70, 943–953. 10.1128/AEM.70.2.943-953.2004 [DOI] [PMC free article] [PubMed] [Google Scholar]
- Bai, Y. , Yang, J. , Zarrella, T. M. , Zhang, Y. , Metzger, D. W. , & Bai, G. (2014). Cyclic di‐AMP impairs potassium uptake mediated by a cyclic di‐AMP binding protein in Streptococcus pneumoniae. Journal of Bacteriology, 196, 614–623. 10.1128/JB.01041-13 [DOI] [PMC free article] [PubMed] [Google Scholar]
- Bai, Y. , Yang, J. , Zhou, X. , Ding, X. , Eisele, L. E. , & Bai, G. (2012). Mycobacterium tuberculosis Rv3586 (DacA) is a diadenylate cyclase that converts ATP or ADP into c‐di‐AMP. PLoS ONE, 7, e35206 10.1371/journal.pone.0035206 [DOI] [PMC free article] [PubMed] [Google Scholar]
- Baumann, A. , Lange, C. , & Soppa, J. (2007). Transcriptome changes and cAMP oscillations in an archaeal cell cycle. BMC Cell Biology, 8, 21 10.1186/1471-2121-8-21 [DOI] [PMC free article] [PubMed] [Google Scholar]
- Bejerano‐Sagie, M. , Oppenheimer‐Shaanan, Y. , Berlatzky, I. , Rouvinski, A. , Meyerovich, M. , & Ben‐Yehuda, S. (2006). A checkpoint protein that scans the chromosome for damage at the start of sporulation in Bacillus subtilis . Cell, 125, 679–690. 10.1016/j.cell.2006.03.039 [DOI] [PubMed] [Google Scholar]
- Blötz, C. , Treffon, K. , Kaever, V. , Schwede, F. , Hammer, E. , & Stülke, J. (2017). Identification of the components involved in cyclic di‐AMP signaling in Mycoplasma pneumoniae . Frontiers in Microbiology, 8, 1328 10.3389/fmicb.2017.01328 [DOI] [PMC free article] [PubMed] [Google Scholar]
- Booth, I. R. (2014). Bacterial mechanosensitive channels: Progress towards an understanding of their roles in cell physiology. Current Opinion in Microbiology, 18, 16–22. 10.1016/j.mib.2014.01.005 [DOI] [PMC free article] [PubMed] [Google Scholar]
- Bowman, L. , Zeden, M. S. , Schuster, C. F. , Kaever, V. , & Gründling, A. (2016). New insights into the cyclic di‐adenosine monophosphate (c‐di‐AMP) degradation pathway and the requirement of the cyclic dinucleotide for acid stress resistance in Staphylococcus aureus . Journal of Biological Chemistry, 291, 26970–26986. 10.1074/jbc.m116.747709 [DOI] [PMC free article] [PubMed] [Google Scholar]
- Brendel, J. , Stoll, B. , Lange, S. J. , Sharma, K. , Lenz, C. , Stachler, A.‐E. , … Marchfelder, A. (2014). A complex of Cas proteins 5, 6, and 7 is required for the biogenesis and stability of clustered regularly interspaced short palindromic repeats (crispr)‐derived rnas (crrnas) in Haloferax volcanii . Journal of Biological Chemistry, 289, 7164–7177. 10.1074/jbc.M113.508184 [DOI] [PMC free article] [PubMed] [Google Scholar]
- Chaudhuri, R. R. , Allen, A. G. , Owen, P. J. , Shalom, G. , Stone, K. , Harrison, M. , … Charles, I. G. (2009). Comprehensive identification of essential Staphylococcus aureus genes using Transposon‐Mediated Differential Hybridisation (TMDH). BMC Genomics, 10, 291 10.1186/1471-2164-10-291 [DOI] [PMC free article] [PubMed] [Google Scholar]
- Commichau, F. M. , Gibhardt, J. , Halbedel, S. , Gundlach, J. , & Stülke, J. (2017). A delicate connection: c‐di‐AMP affects cell integrity by controlling osmolyte transport. Trends in Microbiology, 26, 175–185. 10.1016/j.tim.2017.09.003 [DOI] [PubMed] [Google Scholar]
- Commichau, F. M. , Heidemann, J. L. , Ficner, R. , & Stülke, J. (2018). Making and breaking of an essential poison: The cyclases and phosphodiesterases that produce and degrade the essential second messenger cyclic di‐AMP in bacteria. Journal of Bacteriology, 201 10.1128/JB.00462-18 [DOI] [PMC free article] [PubMed] [Google Scholar]
- Commichau, F. M. , & Stülke, J. (2018). Coping with an essential poison: A genetic suppressor analysis corroborates a key function of c‐di‐AMP in controlling potassium ion homeostasis in gram‐positive bacteria. Journal of Bacteriology, 200 10.1128/JB.00166-18 [DOI] [PMC free article] [PubMed] [Google Scholar]
- Corrigan, R. M. , Abbott, J. C. , Burhenne, H. , Kaever, V. , & Gründling, A. (2011). c‐di‐AMP is a new second messenger in Staphylococcus aureus with a role in controlling cell size and envelope stress. PLoS Path, 7, e1002217 10.1371/journal.ppat.1002217 [DOI] [PMC free article] [PubMed] [Google Scholar]
- Corrigan, R. M. , Campeotto, I. , Jeganathan, T. , Roelofs, K. G. , Lee, V. T. , & Gründling, A. (2013). Systematic identification of conserved bacterial c‐di‐AMP receptor proteins. Proceedings of the National Academy of Sciences, 110, 9084–9089. 10.1073/pnas.1300595110 [DOI] [PMC free article] [PubMed] [Google Scholar]
- Corrigan, R. M. , & Gründling, A. (2013). Cyclic di‐AMP: Another second messenger enters the fray. Nature Reviews Microbiology, 11, 513–524. 10.1038/nrmicro3069 [DOI] [PubMed] [Google Scholar]
- Delmas, S. , Shunburne, L. , Ngo, H.‐P. , & Allers, T. (2009). Mre11‐Rad50 promotes rapid repair of DNA damage in the polyploid archaeon Haloferax volcanii by restraining homologous recombination. PLoS Genetics, 5, e1000552 10.1371/journal.pgen.1000552 [DOI] [PMC free article] [PubMed] [Google Scholar]
- Ducret, A. , Quardokus, E. M. , & Brun, Y. V. (2016). MicrobeJ, a tool for high throughput bacterial cell detection and quantitative analysis. Nature Microbiology, 1, 16077 10.1038/nmicrobiol.2016.77 [DOI] [PMC free article] [PubMed] [Google Scholar]
- Duggin, I. G. , Aylett, C. H. S. , Walsh, J. C. , Michie, K. A. , Wang, Q. , Turnbull, L. , … Löwe, J. (2015). CetZ tubulin‐like proteins control archaeal cell shape. Nature, 519, 362–365. 10.1038/nature13983 [DOI] [PMC free article] [PubMed] [Google Scholar]
- Edwards, M. D. , Black, S. , Rasmussen, T. , Rasmussen, A. , Stokes, N. R. , Stephen, T.‐L. , … Booth, I. R. (2012). Characterization of three novel mechanosensitive channel activities in Escherichia coli . Channels (Austin), 6, 272–281. 10.4161/chan.20998 [DOI] [PMC free article] [PubMed] [Google Scholar]
- Fahmi, T. , Port, G. C. , & Cho, K. H. (2017). c‐di‐AMP: An essential molecule in the signaling pathways that regulate the viability and virulence of gram‐positive bacteria. Genes (Basel), 8, 1–17. 10.3390/genes8080197 [DOI] [PMC free article] [PubMed] [Google Scholar]
- Felsenstein, J. (1985). Confidence limits on phylogenies: An approach using the bootstrap. Evolution, 39, 783–791. 10.1111/j.1558-5646.1985.tb00420.x [DOI] [PubMed] [Google Scholar]
- Gamble‐Milner, R. J. (2016 ). Genetic analysis of the Hel308 helicase in the archaeon Haloferax volcanii . PhD thesis, University of Nottingham. Retrieved from http://eprints.nottingham.ac.uk/37153/1/Rebecca%20Gamble-Milner.pdf
- Geertsma, E. R. , & Dutzler, R. (2011). A versatile and efficient high‐throughput cloning tool for structural biology. Biochemistry, 50, 3272–3278. 10.1021/bi200178z [DOI] [PubMed] [Google Scholar]
- Gomelsky, M. (2011). cAMP, c‐di‐GMP, c‐di‐AMP and now cGMP: Bacteria use them all!. Molecular Microbiology, 79, 562–565. 10.1111/j.1365-2958.2010.07514.x [DOI] [PMC free article] [PubMed] [Google Scholar]
- Gundlach, J. , Herzberg, C. , Kaever, V. , Gunka, K. , Hoffmann, T. , Weiß, M. , … Stülke, J. (2017). Control of potassium homeostasis is an essential function of the second messenger cyclic di‐AMP in Bacillus subtilis . Science Signalling, 10, eaal3011 10.1126/scisignal.aal3011 [DOI] [PubMed] [Google Scholar]
- Gundlach, J. , Mehne, F. M. P. , Herzberg, C. , Kampf, J. , Valerius, O. , Kaever, V. , & Stülke, J. (2015). An essential poison: Synthesis and degradation of cyclic di‐AMP in Bacillus subtilis . Journal of Bacteriology, 197, 3265–3274. 10.1128/JB.00564-15 [DOI] [PMC free article] [PubMed] [Google Scholar]
- Hartman, A. L. , Norais, C. , Badger, J. H. , Delmas, S. , Haldenby, S. , Madupu, R. , … Eisen, J. A. (2010). The complete genome sequence of Haloferax volcanii DS2, a model archaeon. PLoS ONE, 5, e9605 10.1371/journal.pone.0009605 [DOI] [PMC free article] [PubMed] [Google Scholar]
- Huynh, T. N. , & Woodward, J. J. (2016). Too much of a good thing: Regulated depletion of c‐di‐AMP in the bacterial cytoplasm. Current Opinion in Microbiology, 30, 22–29. 10.1016/j.mib.2015.12.007 [DOI] [PMC free article] [PubMed] [Google Scholar]
- JCSG . Crystal structure of hypothetical protein (NP_068944.1) from Archaeoglobus fulgidus at 1.30 A resolution.
- Jones, D. T. , Taylor, W. R. , & Thornton, J. M. (1992). The rapid generation of mutation data matrices from protein sequences. Computer Applications in the Biosciences, 8, 275–282. 10.1093/bioinformatics/8.3.275 [DOI] [PubMed] [Google Scholar]
- Kalia, D. , Merey, G. , Nakayama, S. , Zheng, Y. , Zhou, J. , Luo, Y. , … Sintim, H. O. (2013). Nucleotide, c‐di‐GMP, c‐di‐AMP, cGMP, cAMP, (p)ppGpp signaling in bacteria and implications in pathogenesis. Chemical Society Reviews, 42, 305–341. 10.1039/C2CS35206K [DOI] [PubMed] [Google Scholar]
- Kellenberger, C. A. , Chen, C. , Whiteley, A. T. , Portnoy, D. A. , & Hammond, M. C. (2015). RNA‐based fluorescent biosensors for live cell imaging of second messenger cyclic di‐AMP. Journal of the American Chemical Society, 137, 6432–6435. 10.1021/jacs.5b00275 [DOI] [PMC free article] [PubMed] [Google Scholar]
- Kumar, S. , Stecher, G. , & Tamura, K. (2016). MEGA7: Molecular evolutionary genetics analysis version 7.0 for bigger datasets. Molecular Biology and Evolution, 33, 1870–1874. 10.1093/molbev/msw054 [DOI] [PMC free article] [PubMed] [Google Scholar]
- Large, A. , Stamme, C. , Lange, C. , Duan, Z. , Allers, T. , Soppa, J. , & Lund, P. A. (2007). Characterization of a tightly controlled promoter of the halophilic archaeon Haloferax volcanii and its use in the analysis of the essential cct1 gene. Molecular Microbiology, 66, 1092–1106. 10.1111/j.1365-2958.2007.05980.x [DOI] [PubMed] [Google Scholar]
- Leichtling, B. H. , Rickenberg, H. V. , Seely, R. J. , Fahrney, D. E. , & Pace, N. R. (1986). The occurrence of cyclic AMP in archaebacteria. Biochemical and Biophysical Research Communications, 136, 1078–1082. 10.1016/0006-291X(86)90443-2 [DOI] [PubMed] [Google Scholar]
- Lestini, R. , Duan, Z. , & Allers, T. (2010). The archaeal Xpf/Mus81/FANCM homolog Hef and the Holliday junction resolvase Hjc define alternative pathways that are essential for cell viability in Haloferax volcanii . DNA Repair (Amst), 9, 994–1002. 10.1016/j.dnarep.2010.06.012 [DOI] [PubMed] [Google Scholar]
- Lucht, J. M. , & Bremer, E. (1994). Adaptation of Escherichia coli to high osmolarity environments: Osmoregulation of the high‐affinity glycine betaine transport system proU. FEMS Microbiology Reviews, 14, 3–20. 10.1016/0168-6445(94)90008-6 [DOI] [PubMed] [Google Scholar]
- Luo, Y. , & Helmann, J. D. (2012). Analysis of the role of Bacillus subtilis σ(M) in β‐lactam resistance reveals an essential role for c‐di‐AMP in peptidoglycan homeostasis. Molecular Microbiology, 83, 623–639. 10.1111/j.1365-2958.2011.07953.x [DOI] [PMC free article] [PubMed] [Google Scholar]
- Manikandan, K. , Sabareesh, V. , Singh, N. , Saigal, K. , Mechold, U. , & Sinha, K. M. (2014). Two‐step synthesis and hydrolysis of cyclic di‐AMP in Mycobacterium tuberculosis. PLoS ONE, 9, e86096 10.1371/journal.pone.0086096 [DOI] [PMC free article] [PubMed] [Google Scholar]
- Marchler‐Bauer, A. , Bo, Y. , Han, L. , He, J. , Lanczycki, C. J. , Lu, S. , … Bryant, S. H. (2017). CDD/SPARCLE: Functional classification of proteins via subfamily domain architectures. Nucleic Acids Research, 45(D1), D200–D203. 10.1093/nar/gkw1129 [DOI] [PMC free article] [PubMed] [Google Scholar]
- McDonough, K. A. , & Rodriguez, A. (2011). The myriad roles of cyclic AMP in microbial pathogens: From signal to sword. Nature Reviews Microbiology, 10, 27–38. 10.1038/nrmicro2688 [DOI] [PMC free article] [PubMed] [Google Scholar]
- McLaggan, D. , Naprstek, J. , Buurman, E. T. , & Epstein, W. (1994). Interdependence of K+ and glutamate accumulation during osmotic adaptation of Escherichia coli . Journal of Biological Chemistry, 269, 1911–1917. [PubMed] [Google Scholar]
- Mehne, F. M. P. , Gunka, K. , Eilers, H. , Herzberg, C. , Kaever, V. , & Stülke, J. (2013). Cyclic di‐AMP homeostasis in Bacillus subtilis: Both lack and high level accumulation of the nucleotide are detrimental for cell growth. Journal of Biological Chemistry, 288, 2004–2017. 10.1074/jbc.M112.395491 [DOI] [PMC free article] [PubMed] [Google Scholar]
- Mehne, F. M. P. , Schröder‐Tittmann, K. , Eijlander, R. T. , Herzberg, C. , Hewitt, L. , Kaever, V. , et al. (2014). Control of the diadenylate cyclase CdaS in Bacillus subtilis: An autoinhibitory domain limits cyclic di‐AMP production. Journal of Biological Chemistry, 289, 21098–21107. 10.1074/jbc.M114.562066 [DOI] [PMC free article] [PubMed] [Google Scholar]
- Meury, J. , & Kohiyama, M. (1989). ATP is required for K+ active transport in the archaebacterium Haloferax volcanii . Archives of Microbiology, 151, 530–536. 10.1007/BF00454870 [DOI] [Google Scholar]
- Miller, J. H. (1971). Experiments in molecular genetics. Cold Spring Harbor, NY: Cold Spring Harbor Laboratory. [Google Scholar]
- Norais, C. , Hawkins, M. , Hartman, A. L. , Eisen, J. A. , Myllykallio, H. , & Allers, T. (2007). Genetic and physical mapping of DNA replication origins in Haloferax volcanii . PLoS Genetics, 3, e77 10.1371/journal.pgen.0030077 [DOI] [PMC free article] [PubMed] [Google Scholar]
- Oren, A. (2008). Microbial life at high salt concentrations: Phylogenetic and metabolic diversity. Saline Systems, 4, 2 10.1186/1746-1448-4-2 [DOI] [PMC free article] [PubMed] [Google Scholar]
- Römling, U. (2008). Great times for small molecules: c‐di‐AMP, a second messenger candidate in Bacteria and Archaea. Science Signaling, 1, pe39 10.1126/scisignal.133pe39 [DOI] [PubMed] [Google Scholar]
- Rosenberg, J. , Dickmanns, A. , Neumann, P. , Gunka, K. , Arens, J. , Kaever, V. , … Commichau, F. M. (2015). Structural and biochemical analysis of the essential diadenylate cyclase CdaA from Listeria monocytogenes . Journal of Biological Chemistry, 290, 6596–6606. 10.1074/jbc.M114.630418 [DOI] [PMC free article] [PubMed] [Google Scholar]
- Rouillon, C. , Athukoralage, J. S. , Graham, S. , Grüschow, S. , & White, M. F. (2018). Control of cyclic oligoadenylate synthesis in a type III CRISPR system. Elife, 7, 1–25. 10.7554/eLife.36734 [DOI] [PMC free article] [PubMed] [Google Scholar]
- Schindelin, J. , Arganda‐Carreras, I. , Frise, E. , Kaynig, V. , Longair, M. , Pietzsch, T. , … Cardona, A. (2012). Fiji: An open‐source platform for biological‐image analysis. Nature Methods, 9, 676–682. 10.1038/nmeth.2019 [DOI] [PMC free article] [PubMed] [Google Scholar]
- Shenroy, A. R. , & Visweswariah, S. S. (2004). Class III nucleotide cyclases in bacteria and archaebacteria: Lineage‐specific expansion of adenylyl cyclases and a dearth of guanylyl cyclases. FEBS Letters, 561, 11–21. 10.1016/S0014-5793(04)00128-0 [DOI] [PubMed] [Google Scholar]
- Skowyra, A. , & MacNeill, S. A. (2012). Identification of essential and non‐essential single‐stranded DNA‐binding proteins in a model archaeal organism. Nucleic Acids Research, 40, 1077–1090. 10.1093/nar/gkr838 [DOI] [PMC free article] [PubMed] [Google Scholar]
- Song, J.‐H. , Ko, K. S. , Lee, J.‐Y. , Baek, J. Y. , Oh, W. S. , Yoon, H. S. , … Chun, J. (2005). Identification of essential genes in Streptococcus pneumoniae by allelic replacement mutagenesis. Molecules and Cells, 19, 365–374. [PubMed] [Google Scholar]
- Spangler, C. , Böhm, A. , Jenal, U. , Seifert, R. , & Kaever, V. (2010). A liquid chromatography‐coupled tandem mass spectrometry method for quantitation of cyclic di‐guanosine monophosphate. Journal of Microbiol Methods, 81, 226–231. 10.1016/j.mimet.2010.03.020 [DOI] [PubMed] [Google Scholar]
- Stroud, A. , Liddell, S. , & Allers, T. (2012). Genetic and biochemical identification of a novel single‐stranded DNA‐binding complex in Haloferax volcanii . Frontiers in Microbiology, 3, 224 10.3389/fmicb.2012.00224 [DOI] [PMC free article] [PubMed] [Google Scholar]
- Sutherland, E. W. , & Wosilait, W. D. (1956). The relationship of epinephrine and glucagon to liver phosphorylase. I. Liver phosphorylase; preparation and properties. Journal of Biological Chemistry, 218, 459–468. [PubMed] [Google Scholar]
- Thombre, R. S. , Shinde, V. D. , Oke, R. S. , Dhar, S. K. , & Shouche, Y. S. (2016). Biology and survival of extremely halophilic archaeon Haloarcula marismortui RR12 isolated from Mumbai salterns, India in response to salinity stress. Scientific Reports, 6, 25642 10.1038/srep25642 [DOI] [PMC free article] [PubMed] [Google Scholar]
- Waterhouse, A. , Bertoni, M. , Bienert, S. , Studer, G. , Tauriello, G. , Gumienny, R. , … Schwede, T. (2018). SWISS‐MODEL: Homology modelling of protein structures and complexes. Nucleic Acids Research, 46(W1), W296–W303. 10.1093/nar/gky427 [DOI] [PMC free article] [PubMed] [Google Scholar]
- Whiteley, A. T. , Pollock, A. J. , & Portnoy, D. A. (2015). The PAMP c‐di‐AMP is essential for Listeria monocytogenes growth in rich but not minimal media due to a toxic increase in (p)ppGpp. [corrected]. Cell Host & Microbe, 17, 788–798. 10.1016/j.chom.2015.05.006 [DOI] [PMC free article] [PubMed] [Google Scholar]
- Witte, G. , Hartung, S. , Büttner, K. , & Hopfner, K.‐P. (2008). Structural biochemistry of a bacterial checkpoint protein reveals diadenylate cyclase activity regulated by DNA recombination intermediates. Molecular Cell, 30, 167–178. 10.1016/j.molcel.2008.02.020 [DOI] [PubMed] [Google Scholar]
- Woodward, J. J. , Iavarone, A. T. , & Portnoy, D. A. (2010). c‐di‐AMP secreted by intracellular Listeria monocytogenes activates a host type I interferon response. Science, 328, 1703–1705. 10.1126/science.1189801 [DOI] [PMC free article] [PubMed] [Google Scholar]
- Yang, J. , Bai, Y. , Zhang, Y. , Gabrielle, V. D. , Jin, L. , & Bai, G. (2014). Deletion of the cyclic di‐AMP phosphodiesterase gene (cnpB) in Mycobacterium tuberculosis leads to reduced virulence in a mouse model of infection. Molecular Microbiology, 93, 65–79. 10.1111/mmi.12641 [DOI] [PMC free article] [PubMed] [Google Scholar]
- Zhang, L. , Li, W. , & He, Z. G. (2013). DarR, a TetR‐like transcriptional factor, is a cyclic di‐AMP‐responsive repressor in Mycobacterium smegmatis . Journal of Biological Chemistry, 288, 3085–3096. 10.1074/jbc.M112.428110 [DOI] [PMC free article] [PubMed] [Google Scholar]
Associated Data
This section collects any data citations, data availability statements, or supplementary materials included in this article.
Data Availability Statement
No sequence or proteomic data need to be accessible for this manuscript.