

Abstract
It has been shown that cytoplasmic RNA oxidation occurs to a great extent in the brains of Alzheimer's disease (AD) patients. The goal of this study was to isolate and identify oxidized RNA species in AD. We show that significant amounts of poly(A)+ mRNAs are oxidized in AD brains. RNA oxidation is not random but highly selective. Importantly, many identified oxidized mRNA species have been implicated in the pathogenesis of AD. Quantitative analysis revealed that some mRNA species are more susceptible to oxidative damage. We also investigated the biological consequence of oxidatively damaged mRNAs by expressing them in cell lines. Our data indicated that abnormal processing of proteins occurred to the oxidized mRNAs. This may implicate the potential contribution of RNA oxidation in the pathogenesis of AD.
Keywords: Alzheimer's disease; oxidative damage; 8-oxo-7,8-dihydroguanosine; 8OHG; RNA oxidation; reactive oxygen species; protein aggregation
Introduction
There is increasing evidence indicating that oxidative stress is a contributor to neuronal death in Alzheimer's disease (AD). Reactive oxygen species (ROS) can cause functional and structural damages in neurons including lipid peroxidation (Subbarao et al., 1990; Sayre et al., 1997), protein oxidation (Smith et al., 1991; Castegna et al., 2002a,b), mitochondrial abnormality (Hirai et al., 2001), as well as nucleic acid oxidation (Mecocci et al., 1993, 1994). ROS-induced oxidative damage is restricted to a defined group of neurons at risk of death in AD.
ROS can hydroxylate guanine to produce 8-oxo-7,8-dihydro-2′-deoxyguanosine (8OHdG) in DNA and 8-oxo-7,8-dihydroguanosine (8OHG) in RNA (Kasai et al., 1991); these compounds can serve as sensitive biomarkers for oxidative stress (Fiala et al., 1989; Wamer et al., 1997). Several studies have shown an increase in 8OHdG and 8OHG levels in the brains and cerebrospinal fluid of patients with AD (Gabbita et al., 1998; Lovell and Markesbery, 2001). Nunomura et al. (1999) used an in situ immunohisto-chemistry approach to identify oxidized nucleosides in AD. They found that oxidative damage to nucleic acids occurs predominantly in cytoplasmic RNA rather than in nuclear DNA. This finding raises several interesting questions. The first question is what type of RNAs is oxidized in AD. If mRNAs are oxidized, which mRNA species are damaged? Is there some specific mRNA species that are more susceptible to oxidative damage? The second question involves the biological consequence of oxidized mRNAs. The oxidized mRNAs may degrade rapidly or produce normal or defective proteins. Finally, does oxidative damage to mRNAs contribute to AD?
In this study, we used a biochemical approach to isolate and identify oxidized RNA species. We found that significant amounts of poly(A)+ mRNAs are oxidatively damaged in AD. Surprisingly, instead of ROS-induced oxidative damage to mRNAs being a generalized phenomenon, specific functional classes of mRNAs are oxidized. In addition, we expressed the oxidized luciferase and enhanced green fluorescent protein (EGFP) mRNAs in cell lines and observed that the oxidized mRNAs cannot be translated to proteins properly leading to aggregation.
Materials and Methods
Tissue. Frozen postmortem brain tissues were obtained by autopsy from 11 AD patients (65–86 years of age; postmortem intervals, 3–11 hr), seven age-matched control subjects (postmortem intervals, 3–18 hr), two young control subjects (22–49 years of age; postmortem intervals, 6–12 hr), and seven amyotrophic lateral sclerosis (ALS) patients (58–65 years of age; postmortem intervals, 6–9 hr). Specimens from the hippocampus (Hip), Brodman areas 9 and 10 in the frontal cortex (FC) and cerebellar cortex, were studied. These postmortem brain tissues were provided by Johns Hopkins Alzheimer's Disease Research Center Brain Bank and Amyotrophic Lateral Sclerosis Brain Bank, Harvard Brain Tissue Resource Center, and University of Maryland Brain and Tissue Banks for Developmental Disorders.
Northwestern blotting. Total RNAs were extracted using RNeasy Mini kit (Qiagen, Valencia, CA). After DNase I (Invitrogen, Carlsbad, CA) treatment, poly(A) + RNAs were selected using the Oligo-tex mRNA Purification Kit (Qiagen). Poly(A) + RNAs were size-fractionated in agarose/formaldehyde gels and blotted onto positively charged nylon membrane (Roche Products, Indianapolis, IN). The membrane was washed by PBS followed by incubation in 1% BSA blocking solution for 1 hr at room temperature. The membrane was incubated in a monoclonal anti-8OHG antibody (Ab) 15A3 (1:2000; QED Bioscience, San Diego, CA) for 4 hr at room temperature and then incubated in a secondary peroxidaseconjugated goat anti-mouse antibody (1:1200; ICN Biochemicals, Aurora, OH). The signals were detected with LumiLight Western Blotting Substrate (Roche Products) according to the directions of the manufacturer and exposed on x-ray films (Kodak, Rochester, NY).
Immunoprecipitation. Poly(A) + RNAs (1.5 μg) were incubated with 2.5 μg of anti-8OHG antibody 15A3 at room temperature for 1 hr. For negative control trials, the primary antibody was omitted or preincubated with 24 ng/μl of 8OHG (Cayman Chemical, Ann Arbor, MI). Immobilized Protein L gel beads (20 μl) (Pierce, Rockford, IL) were added and incubated at 4°C for an additional 15 hr. The beads were washed three times with PBS and 0.04% (v/v) NP-40 (Roche Products). Afterward, the following items were added in the following order: 300 μl of PBS with 0.04% NP-40, 30 μl of 10% (w/v) SDS, and 300 μl of PCI (phenol:chloroform:isoamyl alcohol, 25:24:1). The mixture was incubated at 37°C for 15 min (vortexing every 5 min) and separated to aqueous phase and organic phase by spinning at 14,000 rpm for 5 min. The aqueous layer was collected and mixed with 40 μl of 3 M sodium acetate, pH 5.2, 2 μl of 5 mg/ml glycogen, plus 1 ml of 95% (v/v) ethanol. The sample was frozen at -80°C for 1 hr and centrifuged for 20 min. The pellet was washed with 75% ethanol and air-dried. It was resuspended in 10 μl of DEPC-treated H2O.
cDNA synthesis and Southern blotting. Immunoprecipitated mRNAs were reversely transcribed using avian myeloblastosis virus (AMV) reverse transcriptase (Roche Products). For 30 μl of reaction mixture, 10 μl of immunoprecipitate mRNAs and 0.75 μg of oligo-(dT) 24-T7 primer were mixed and incubated at 70°C for 10 min. After 2 min on ice, the master mix contained 6 μl of 5× first-strand buffer (Roche Products), 0.5 mm 2′-deoxynucleoside 5′-triphosphates [deoxy (d)-ATP, dCTP and dGTP], 0.13 mm 2′-deoxythymidine-5′-triphosphate, 0.03 mm digoxigenin-11-2′-deoxy-uridine-5′-triphosphate (Roche Products), 2.5 U of RNase Inhibitor (Invitrogen), and 10 U of AMV reverse transcriptase (Roche Products). The mixture was incubated at 42°C for 90 min. Second strand synthesis was accomplished with E. coli DNA polymerase I (United States Biochemicals, Cleveland, OH) in the presence of E. coli DNA ligase (United States Biochemicals) and RNase H (United States Biochemicals) following the protocol of the manufacturer. Double-strand cDNAs were extracted by phenol-chloroform. Five microliters from 30 μl of digoxigenin-labeled cDNAs were used for additional detection by the Southern blotting method to compare the difference of cDNA quantities between AD and control cases. cDNAs were resolved in 1% agarose gel and then transferred electrophoretically to a positively charged nylon membrane (Roche Products) using the Trans-Blot SD semidry transfer system (Bio-Rad, Hercules, CA) according to the directions of the manufacturer. Digoxogenin labeled on cDNAs was detected with a Digoxogenin High Prime DNA Labeling and Detection Starter Kit II (Roche Products).
cDNA amplification and cloning. For the PCR-based amplification, 2 μl of cDNAs were mixed with 5 μlof10× PCR buffer, 3 mm MgCl2, 0.2 mm dNTPs, 1 μg of T7primer, 1 μg of random hexamers, and 2.5 U of TaqDNA polymerase (Invitrogen) in a 50 μl reaction volume. The PCR conditions were 40 cycles of 95°C for 20 sec, 40°C for 3 min, and 72°C for 3 min. The resulting PCR products were purified using QIAquick PCR Purification Kit (Qiagen). Afterward, they were digested with MboI (Invitrogen) and then gel fractioned in 1% agarose gel followed by purification using QIAquick Gel Extraction Kit (Qiagen). The products were subcloned into plasmid (p)-PCR-Script Amp SK (+) (Stratagene, La Jolla, CA), previously digested with BamH I (Invitrogen), and dephosphorylated with calf intestinal alkaline phosphatase (Invitrogen). The plasmid template DNA was prepared from individual colonies using the Wizard Plus SV Minipreps System (Promega, Madison, WI) or performing PCR from inoculated culture media directly. Sequencing analysis was preformed by Plant-Microbe Genomics Facility at the Ohio State University. The acquired sequence data were aligned against the GenBank nucleotide database (National Center for Biotechnology Information), using Basic Local Alignment Search Tool to search for matching sequences.
Filter array and densitometric analysis. PCR product (100 ng) from each sequenced cDNA fragment was used to make filters. For one filter, three sets of PCR products (12 in each set) were loaded on 1% agarose gel sequentially with 10 min intervals and resolved by electrophoresis (100 V). After the transfer of linearized PCR-amplified cDNAs to nylon membranes (i.e., filters), digoxigenin-labeled cDNAs from the frontal cortex or cerebellar cortex of the AD brain and control brain were used as probes to hybridize to the filters for 20 hr at 42°C. The signals were detected by digoxigenin (DIG) High Prime DNA Labeling and Detection Starter Kit II (Roche Products) and exposed on x-ray films for 4 and 24 hr. The Sigma (St. Louis, MO) Gel software was used to measure the signal intensity of each band. The mean density of a given cDNA among the AD or control cases was calculated and significant differences between the AD and control groups were evaluated.
Primers used for PCR. With gene-specific primers, PCR was performed on cDNAs and PCR-amplified cDNA products. The following primers specific for human gene transcripts were used: cytochrome b F (5′-gctactcagtagacagtcccaccc-3′), R (5′-gaggaggtctgcggctaggagtc-3′); apolipoprotein D (Apo D) F (5′-agatggtgatgctgctgct-3′), R (5′-gcagcctccctgtagaacctgg-3′); HRAS1 F (5′-atgacggaatataagctggtggtggtgg-3′), R (5′-tcaggagagcacacacttgcagct-3′); β-actin F (5′-cgggacctgacagactacctcat-3′), R (5′-accgactgctgtcaccttcacc-3′); excitatory amino acid transporter 2 (EAAT2) F (5′-ggcaactggggatgtaca-3′), R (5′-acgctggggagtttattcaagaat-3′); neurofilament light chain F (5′-ggacaagcagaacgccgacatca-3′), R (5′-cttgttcctccccagcaccttca-3′); amyloid precursor protein (APP) F (5′-tgaacgtgggagttcagctgcttc-3′),R (5′-aaagaagggtttgtccaggcatgc-3′); presenilin 1 F (5′-gggcaggggttccagcttcc-3′), R (5′-acagcagggctgacagcacc-3′); and tau F (5′-cctgctgtgggtcagtgtgcc-3′), R (5′-aggggtataggcagtgattgggct-3′). PCR products were visualized on 1% agarose gels stained with ethidium bromide.
In vitro transcription and oxidation. RNAs synthesized in vitro were considered to be nonoxidized. As the negative control for immunoprecipitation, in vitro synthesized RNAs were obtained using an amplified antisense RNA (aRNA) technique (Eberwine et al., 1992). aRNA was made from the double-strand cDNA template containing T7 promotor using T7 RNA polymerase (United States Biochemicals). Two rounds of amplification were performed for the overall 10 6-fold amplification. For p21ras (HRAS 1), firefly luciferase and EGFP cDNA sequences, the coding regions plus parts of 5′and 3′ untranslated regions were selected and inserted into the pcDNA3 vector. PCR was performed by using T7 + and SP6-(dT)30 primers (T7+: 5′-GGATCCTAATACGACTCACTATAGG; SP6-(dT)30: 5′-(dT)30CATTTAGGTGACACTATAG). After purification, the amplified cDNAs were transcribed by T7 RNA polymerase (United States Biochemicals) to RNAs containing poly(A) tail and m 7G(5′)ppp(5′)G RNA capping analog (Invitrogen). For oxidation, the capped poly(A)-tailed RNAs were incubated with H2O2 and cytochrome c (Sigma) at different dosage at 37 oC for 1 hr. RNA was purified by RNeasy mini kit (Qiagen).
In vitro translation. In vitro translation using Rabbit Reticulocyte Lysate system (Promega) was performed according to the direction of the manufacturer on in vitro-generated luciferase RNAs, both nonoxidized and oxidized, for 1.5 hr at 30°C. Luciferase activity was examined using Luciferase Assay System (Promega). Biotinylated luciferase was created by incorporating biotinylated lysine residues into nascent proteins during translation using the Transcend Nonradioactive Translation Detection Systems (Promega). Horseradish peroxidase avidin D (Vector Laboratories, Burlingame, CA) was used to visualize the biotinylated proteins followed by chemiluminescent detection.
Cell culture and RNA transfection. PC12 cells were generously provided by Dr. Richard W. Burry (Department of Neuroscience, The Ohio State University, Columbus, Ohio) and maintained in DMEM (Invitrogen) supplemented with 10% fetal bovine serum (FBS) (Invitrogen) and penicillin-streptomycin-glutamine (100 U/ml, 100 μg/ml, 2 mm; Invitrogen). Human embryonic kidney (HEK) 293 cells were obtained from American Type Culture Collection (Manassas, VA) and cultured in Minimum Essential Medium (MEM) with Eagle's salts (Invitrogen) supplemented with 10% FBS, 100 μm of MEM nonessential amino acids (Invitrogen) and penicillin-streptomycin-glutamine. They were seeded to 80–90% confluence in six well tissue culture plates. In vitro synthesized RNAs (2 μg) were diluted in serum-free OPTI-MEM (Invitrogen) containing 6 μl of DMRIE-c reagent [1:1 (M/M) liposome formulation of the cationic lipid DMRIE (1,2-dimyristyloxypropyl-3-dimethylhydroxy ethyl ammonium bromide) and cholesterol in membrane-fittered water] (Invitrogen). After incubating with the RNA mixture for 4 hr at 37 oC, cells were cultured in normal complete cell media for an additional 14 hr.
Quantitative reverse transcription PCR. To examine the stability of transfected RNAs, we collected RNAs at different time points (4, 8, 16, 24, and 32 hr) after RNA transfection. Total RNAs were isolated from cells directly by Trizol (Invitrogen). Reverse transcription (RT) was performed by using (2′-deoxy-thymidine)30 primer and Superscript II reverse transcriptase (Invitrogen) following the protocol of the manufacturer. PCR was then performed on the RT products using specific primers for β-actin and EGFP F (5′-atggtgagcaagggcgaggag-3′), R (5′-gtccatgccgagagtgatccc-3′) with different amplification cycle numbers (20, 25, 30 cycles).
Luciferase assay. Cells were rinsed by PBS and lysed in 1× luciferase lysis buffer (Promega). The lysates were assayed for luciferase activity using GENios microplate reader (Tecan, San Jose, CA).
Immunoprecipitation and Western blotting. Cells were harvested 16 hr after RNA transfection. Cells were solubilized in PBS containing Complete protease inhibitor mixture (Roche Products) with 1% Triton X-100 at 4°C for 30 min with gentle shaking. Cell debris was removed (15,000 gm, 15 min) and supernatants were incubated with protein G agarose beads and rabbit anti-luciferase polyclonal antibody (1:100; Cortex Biochem, San Leandro, CA) at 4°C for 16 hr. The immunobead-bound protein complexes were washed three times by PBS buffer plus 0.1 mm PMSF and 5 mm EDTA in 1% Triton X-100 followed by washing with PBS buffer plus 0.1 mm PMSF and 5 mm EDTA for an additional three times. Immunoprecipitated proteins were separated on a 7.5% polyacrylamide gel containing 0.1% SDS by electrophoresis and then electrotransferred onto a polyvinylidene difluoride membrane (0.45 μm; Roche Products). The membrane was incubated with rabbit anti-luciferase polyclonal antibody at 1:1000 dilution in 1% nonfat milk in PBS plus 0.1% Tween 20 overnight at 4°C followed by peroxidase-conjugated goat anti-rabbit IgG (1:1200; ICN Biomedicals, Aurora, OH) for 60 min at room temperature. The immunoreactive bands were detected using the LumiLight Western Blotting Substrate (Roche Products) according to the directions of the manufacturer.
Immunofluorescence. HEK293 cells were transfected with in vitro synthesized luciferase RNAs and analyzed for luciferase protein by immunofluorescence using the rabbit anti-luciferase polyclonal antibody (1: 200; Cortex Biochem) and the following secondary Alexa Fluor 594-goat anti-rabbit antibody (1:1000; Molecular Probes, Eugene, OR).
Results
Significant amounts of poly(A)+ mRNAs are oxidized in the AD brain
We performed Northwestern analysis to investigate whether poly(A)+ mRNAs are responsible for RNA oxidation in AD previously observed by Nunomura et al. (1999). The Northern blot was prepared from poly(A)+ mRNAs isolated from AD frontal cortex tissues as well as age-matched normal frontal cortex tissues. The blot was probed with a monoclonal antibody 15A3 that recognizes the oxidized nucleosides 8OHdG and 8OHG. To validate this approach, the in vitro synthesized p21ras RNAs were used as the negative control and in vitro oxidized p21ras RNAs, which were prepared by treating in vitro synthesized p21ras RNAs with H2O2 and cytochrome were used as the positive control. As shown in Figure 1A, the binding of 15A3 to mRNAs was much more prominent in AD cases than that in control cases. These results indicate that poly(A)+ mRNAs are oxidized in AD.
Figure 1.

Significant amounts of mRNAs are oxidized in AD brains. A, Northwestern blot analysis of mRNAs with an anti-8OHG antibody 15A3. mRNAs were prepared from AD or normal frontal cortexes.An in vitro generated p21ras RNA (Non-ox ras) was used as the negative control and an in vitro oxidized p21ras RNA (Ox ras) was used as the positive control. The binding of 15A3 was much more prominent in AD samples than control samples. B, Southern blot analysis of 15A3-immunoprecipitated mRNAs. Significant amounts of oxidized mRNAs were immunoprecipitated from AD FC and AD Hip. Very few amounts of oxidized mRNAs were immunoprecipitated from normal frontal cortex or AD Cbm. No mRNA was precipitated when the antibody was omitted (no Ab) or preabsorbed with 8OHG (Ab block). C, The 15A3 antibody specifically immunoprecipitated oxidized RNAs but not nonoxidized RNAs. The nonoxidized RNA sample (Non-ox RNA) was generated from the cDNAs prepared from the immunoprecipitated mRNAs of AD1, frontal cortex sample. The oxidized RNA sample (Ox RNA) was treated with 3.2 μm H2O2 and 0.2 μm cytochrome c.
To investigate whether RNA oxidation contributes to the disease, we decided to isolate and identify these oxidized mRNA species. We separated oxidized mRNA species from nonoxidized mRNA species by immunoprecipitation with 15A3. The immunoprecipitated mRNAs were then reverse transcribed to cDNAs. DIG-labeled dUTPs were incorporated into cDNAs to facilitate analysis by Southern blotting. As shown in Figure 1B, significant amounts of mRNAs were immunoprecipitated from AD frontal cortex tissues (lanes 3–5, affected area) but not from the AD cerebellum (Cbm) (lane 6, unaffected area) or the normal frontal cortex tissues (lanes 8–10). A less amount of mRNAs was immunoprecipitated from the AD hippocampus (lane 7) compared with the AD frontal cortex. These immunoprecipitated mRNA species are specific to 15A3, as confirmed by the no antibody control (lane 1) and the antibody blocked with 8OHG control (lane 2). To rule out the possibility that this antibody may non-specifically bind to a group of mRNAs that are only present in AD frontal cortex, we synthesized RNAs from the cDNAs that were prepared from the immunoprecipitated mRNAs of the AD1, frontal cortex sample (Fig. 1B, lane 3). These in vitro synthesized RNAs were then oxidized with H2O2 and cytochrome c. As shown in Figure 1C, 15A3 only precipitated the in vitro oxidized RNAs but not the nonoxidized RNAs. These results clearly demonstrate that the immunoprecipitated mRNAs are oxidized RNAs. We have used this procedure to analyze 11 AD frontal cortexes, three AD hippocampi, three AD cerebella, and nine normal frontal cortexes including young, presenile, and senile tissues. The RNA quality of postmortem tissues was examined by Northern blotting analysis using β-actin antisense RNA probe and only the samples that showed a well defined single β-actin band, indicating no degradation, were included in this study. All AD frontal cortex samples showed strong signals on the Southern blot analyses, moderate signals for AD hippocampus samples and no or very weak signals for AD cerebellum or normal frontal cortex samples. Among the AD frontal cortex samples, the AD1 sample (Fig. 1B, lane 3) showed the strongest signal and the AD3 samples (lane 5) showed the weakest signal; signals from the rest of the samples such as AD2 (lane 4) were between them. Three AD hippocampus samples showed signals with similar intensities (as represented in lane 7). The postmortem interval did not affect the amount of immunoprecipitated mRNAs. To exclude the possible role of agonal state in oxidation of mRNAs, we examined the oxidized mRNA levels on ALS frontal cortexes (n = 7) and no significant amount of oxidized mRNAs was found (data not shown). These results indicate that significant amounts of poly(A)+ mRNAs are oxidized in the AD brain.
Many oxidized mRNA species are AD-related gene transcripts
To identify these oxidized mRNA species, we cloned the cDNAs that were prepared from the immunoprecipitated mRNAs of AD1, frontal cortex sample (Fig. 1B, lane 3) into pPCR-Script Amp SK(+) vector. Two procedures were applied for efficient cloning. We first amplified the cDNAs using PCR and then digested the amplified cDNAs with the four-cutter enzyme MboI. The MboI-digested fragments, which represent each oxidized mRNA species, were efficiently cloned into the vector. A total of 340 clones were randomly selected for additional analysis. They were first analyzed by HaeIII restriction digestion. The clones with different restriction patterns were subjected to sequencing. Sixty-three different transcripts were consequently identified. They were grouped into 10 categories as shown in Table 1: 24 transcripts are known genes; 17 transcripts correspond to uncharacterized genes; 12 transcripts correspond to uncharacterized EST clones; and 10 transcripts are unidentified genes. For those known genes, their gene products are involved in free radical modulation, detoxification, cell death pathway, signal transduction, synaptic plasticity, long-term potentiation (LTP), and cell proliferation. Importantly, at least 10 of those known genes have been previously characterized in AD, which include p21ras, mitogen-activated protein kinase (MAPK) kinase 1, α-enolase 1, carbonyl reductase, apolipoprotein D, transferrin, phosphotriesterase protein, glutamate dehydrogenase, calpain, and Cu/Zn superoxide dismutase (SOD1). To exclude the possibility that some immunoprecipitated mRNAs were derived from nonspecific binding to the antibody or protein L, we examined some immunoprecipitated mRNA species (i.e., apolipoprotein D, cytochrome b, and p21ras mRNAs) by RT-PCR in the no antibody control or the antibody block control. The results showed that they were not present in both controls (data not shown).
Table 1.
Classification of clones and statistical analysis on filter array
|
Description |
GenBank accession number |
Ratio |
|
|---|---|---|---|
| Intracellular signal transduction and intercellular communication | |||
| Tubby superfamily protein | NM_020245 | 1 | |
| Mammary tumor and squamous cell carcinoma-associated (p80/85 src substrate) (EMS1), transcript variant 2 | NM_138565 | 1.9 ± 0.10 | |
| Cell death-inducing DFFA-like effector b | AF218586 | 3 ± 0.23 | |
| Purinergic receptor P2X | U83993 | 6 ± 0.32 | |
| MAPK kinase 1 | L11284 | 8.7 ± 0.96 | |
| Cadherin 18, type 2 | XM_011214 | 8.8 ± 0.3 | |
| c-Ha-ras | J00277 | 10.3 ± 0.56 | |
| Gene regulatory proteins | |||
| SWI/SNF-related, matrix-associated, actin-dependent regulator of chromatin subfamily a, member 4 | XM_009081 | 3.1 ± 0.69 | |
| Inhibitor of DNA binding, dominant negative helix-loop-helix protein | XM_046179 | 4 ± 1.1 | |
| Helicase/primase complex protein | AF487338 | 6 ± 1.25 | |
| Ribosomal protein L7a | BE559788 | 6.3 ± 0.67 | |
| α Enolase 1 | NM_001428 | 9.9 ± 1.06 | |
| Free radical modulation proteins | |||
| Carbonyl reductase 1 | XM_009749 | 4.5 ± 1.25 | |
| Cu/Zn SOD1 | X02317 | 6.8 ± 1.1 | |
| Intracellular or intercellular transport proteins | |||
| Apolipoprotein D | XM_049984 | 2.1 ± 0.25 | |
| Transferrin | XM_002793 | 7.5 ± 1.46 | |
| Phosphotidylinositol transfer protein β | NM_012399 | 9.6 ± 0.86 | |
| Mitochondrial related | |||
| Cytochrome b | AF254896 | 7.1 ± 0.68 | |
| mRNA containing 12S rRNA sequence | AY012136 | 17.3 ± 3 | |
| Metabolism | |||
| Phosphotriesterase-related | AI819400 | 2.3 ± 0.17 | |
| Uridine-cytidine kinase 1 (UCK1) | XM_033385 | 2.7 ± 0.54 | |
| Glutamate dehydrogenase 1 | NM_005271 | 5.9 ± 0.68 | |
| Calpain, small subunit 1 | XM_009338 | 18.2 ± 1.50 | |
| Cytoskeleton regulation | |||
| RNB6 | XM_007244 | 2.9 ± 0.46 | |
| Uncharacterized mRNAs with complete open reading frame | |||
| Clone image 5261941 | BC035097 | 1.5 ± 0.23 | |
| FLJ10743 | NM_018201 | 1.9 ± 0.51 | |
| FLJ12123 | AK022185 | 1.9 ± 0.19 | |
| FLJ10994 | AK001856 | 2.4 ± 0.6 | |
| LOC257167 | XM_173054 | 2.6 ± 1.15 | |
| FLJ12387 similar to kinase light chain | BC034373 | 3.1 ± 0.31 | |
| FLJ14220 | AK024282 | 5.1 ± 1.14 | |
| FLJ12936 | AK022998 | 3.5 ± 0.66 | |
| FLJ 14936 | NM_032864 | 4.4 ± 0.17 | |
| FLJ31340 | AK055902 | 5.4 ± 1.22 | |
| MAC3077 | XM_018160 | 5.7 ± 0.51 | |
| FLJ33905 | AK091224 | 6.1 ± 1.06 | |
| Similar to FK506 binding protein 9 | BC007443 | 6.5 ± 1.32 | |
| FLJ13658 | AK023720 | 6.5 ± 0.87 | |
| Secreted protein of unknown function | BC008823 | 8.5 ± 1.45 | |
| AD-003 protein | XM_052723 | 14.4 ± 0.74 | |
| Clone MGC: 33424, IMAGE: 5266665 | BC036526 | 30.9 ± 2.4 | |
| EST clones | |||
| EST | BI463414 | 2.9 ± 0.49 | |
| EST | BM706879 | 3.1 ± 1.07 | |
| EST | AA584851 | 4.1 ± 0.35 | |
| EST | AA084569 | 6.7 ± 2.09 | |
| EST | AV755263 | 7.6 ± 1.58 | |
| EST | BG013057 | 8.7 ± 0.96 | |
| EST | AI457597 | 9.9 ± 0.81 | |
| EST | AI720416 | 10.3 ± 1.64 | |
| EST | AA828749 | 11.2 ± 2.3 | |
| EST | AA828970 | 11.2 ± 1.99 | |
| EST | AA923791 | 21.8 ± 1.71 | |
| EST | AA488746 | 27.5 ± 2.43 | |
| Unidentified | |||
| 1 | 1.7 ± 0.47 | ||
| 2 | 3 ± 0.84 | ||
| 3 | 5 ± 0.8 | ||
| 4 | 5.2 ± 0.58 | ||
| 5 | 6.1 ± 0.4 | ||
| 6 | 10.2 ± 1.65 | ||
| 7 | 13.7 ± 2.31 | ||
| 8 | 20.8 ± 2.17 | ||
| 9 | 21 ± 3.43 | ||
| 10
|
|
22.7 ± 1.31
|
|
The ratio represents the relative abundance of each oxidized RNA species in AD frontal cortex and refers to the fold change by normalizing the value of each band to the least intense band (i.e., tubby superfamily).
RNA oxidation is not random but highly selective
We also used RT-PCR to examine whether highly abundant mRNA species such as β-actin or other AD-related genes, such as APP, are present in the oxidized mRNA pool. All of the postmortem tissues included in this study were examined. Interestingly, no β-actin, neurofilament light chain protein, or astrocyte-specific glutamate transporter EAAT2 mRNAs were found in any AD or normal control samples. In addition, the APP and tau mRNAs were not found in the oxidized mRNA pool. The presenilin 1 mRNA was found in two AD frontal cortex samples that had high levels of oxidized mRNA. These results indicate that RNA oxidation is not random but highly selective.
Some mRNA species are more susceptible to oxidative damage
We used a filter array method to quantify the level of oxidation for each identified mRNA species and also to screen these oxidized mRNA species in other AD and normal control cases. The filters were blotted with an equal amount of each identified cDNA fragment and then probed with a DIG-labeled cDNA probe that was prepared from the immunoprecipitated mRNAs (Fig. 2). All samples were processed in the same manner. The signal intensity of each band represents the abundance of the corresponding mRNA species in the oxidized mRNA pool. It clearly demonstrates that the identified mRNA species are highly oxidized in the AD FC (Fig. 2, AD3, FC, 4 hr) and much less oxidized in the normal FC (normal 1, FC, 4 hr) or the AD Cbm (AD3, Cbm, o/n). Importantly, these results also indicate that some mRNA species are more susceptible to oxidative damage as shown by the stronger signal in the filter array. Furthermore, it appears that most mRNA species that show oxidative damage in AD frontal cortex are also oxidized in the normal frontal cortex but to a much lesser extent. These signals are specific to the identified mRNA species because no signal was detected in negative controls in which 15A3 was blocked by 8OHG (AD3, FC, Ab block, o/n) or was omitted during the immunoprecipitation. Densitometric analysis was performed for each oxidized mRNA species in AD brains (n = 11) and control brains (n = 9) on filter arrays (Table 1). Because it is difficult to assess the absolute amount of each cDNA, normalization of the relative abundance for a desired band to the least intense cDNA band (tubby super family protein) across all filter arrays enables a reliable indicator of the relative oxidation level of each oxidized mRNA species. All 11 AD samples had the same pattern of signal intensities on the filter arrays, indicating the oxidized RNA profile is similar among AD patients.
Figure 2.
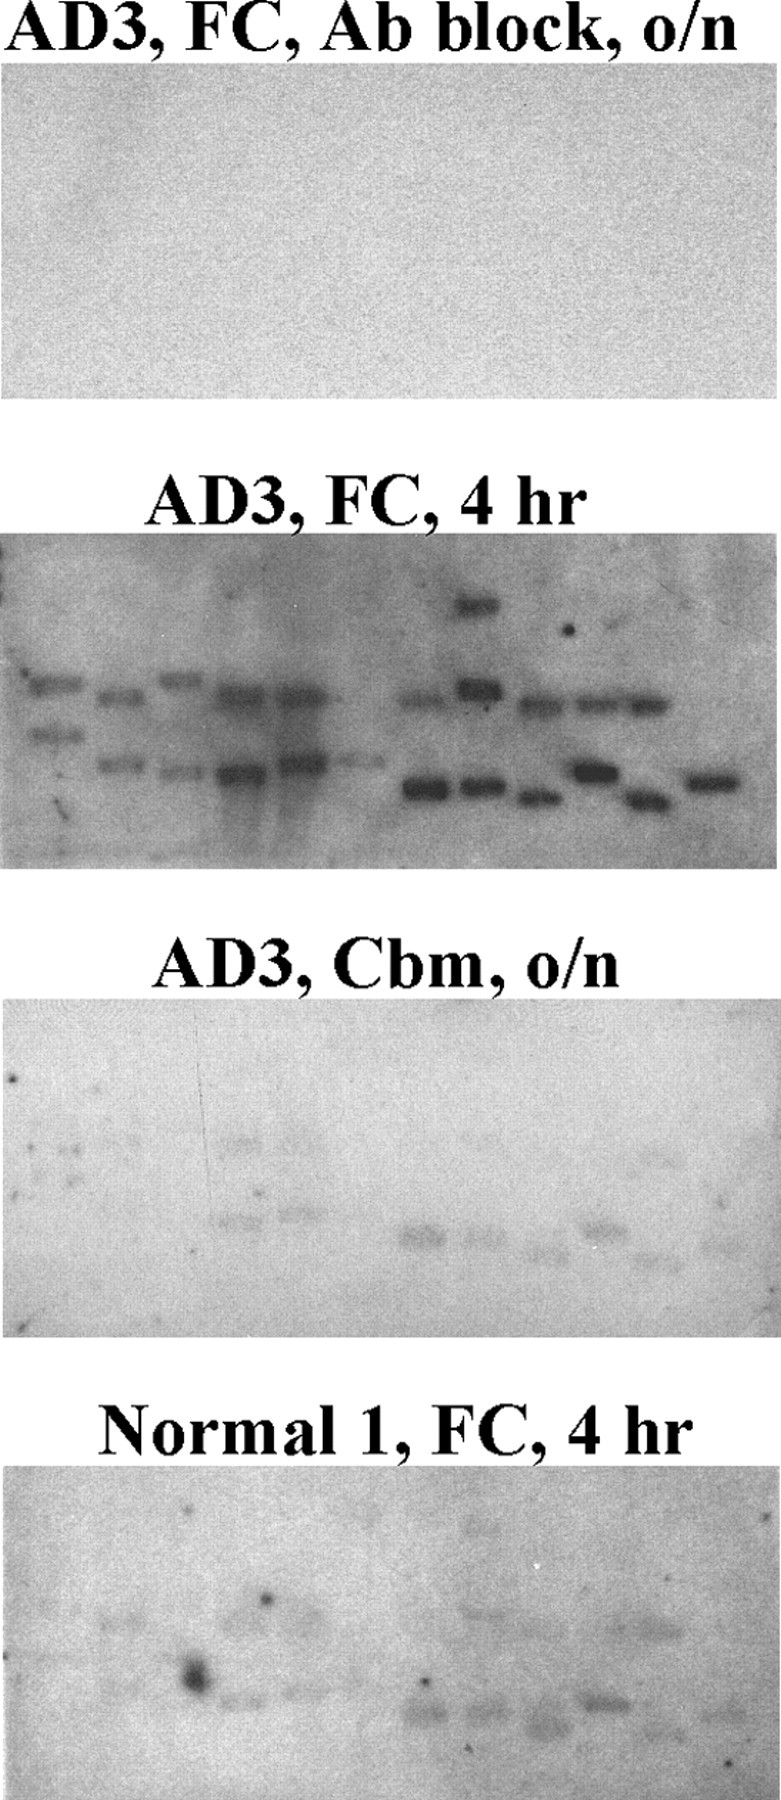
Filter array analyses of identified oxidized mRNA species reveal that some mRNA species are more susceptible to oxidative damage. DIG-labeled cDNAs prepared from the immunoprecipitated mRNAs were used as probes to hybridize DNA fragments, which were PCR-amplified from the identified clones and then immobilized onto nylon membranes. The signal intensity of each band represents the abundance of the corresponding mRNA species in the oxidized mRNA pool. The identified mRNA species are highly oxidized in the AD frontal cortex (AD3, FC, 4 hr exposure to film) and much less oxidized in the normal frontal cortex (Normal 1, FC, 4 hr exposure) or the AD cerebellum (AD3, Cbm, o/n, overnight exposure). No signal was detected in the negative controls in which 15A3 was blocked by 8OHG (AD3, FC, Ab block, o/n) or was omitted during the immunoprecipitation (data not shown).
Oxidized luciferase and EGFP mRNAs cannot be translated to protein properly leading to aggregation
What is the biological consequence of the oxidized mRNAs? They may degrade rapidly or may produce defective proteins leading to loss of normal protein expression and function. Firefly luciferase mRNAs were used for the initial study. As in the first experiment, we synthesized luciferase mRNAs in vitro and then oxidized these luciferase mRNAs in a dose-denpendent manner. More than 80% of mRNAs were oxidized when treated with 1.6 μm H2O2 and 0.1 μm cytochrome c as determined by immunoprecipitation. We used a rabbit reticulocyte lysate to translate the oxidized luciferase mRNAs into proteins and then measured their activities and protein levels by the functional assay and Western blotting respectively. As shown in Figure 3A, there was a dramatic, dose-dependent loss of luciferase activities as well as the detectable protein levels in the oxidized mRNA samples. To further investigate this observation, we expressed the oxidized luciferase mRNAs in HEK293 cells by transfection. The transfected cells were harvested for functional assay and protein expression detection 16 hr after transfection. Consistent with the rabbit reticulocyte lysate results, we observed a dose-dependent loss of luciferase activities and the detectable protein levels in the oxidized mRNA samples (Fig. 3B). The similar results were also observed in PC12 cells (data not shown). Furthermore, we expressed oxidized EGFP mRNAs in HEK293 cells and a decrease of EGFP expression was also observed (data not shown). To investigate whether the decline of protein function and Western blot detectable protein level is the result of rapid degradation of the oxidized mRNAs after entering the cells, we examined the levels of oxidized EGFP mRNAs at different time points after transfection using quantitative RT-PCR. The oxidized mRNA levels remained similar to the nonoxidized mRNA levels for as long as 32 hr (Fig. 3C). These results indicate that the oxidized mRNAs may produce defective proteins.
Figure 3.
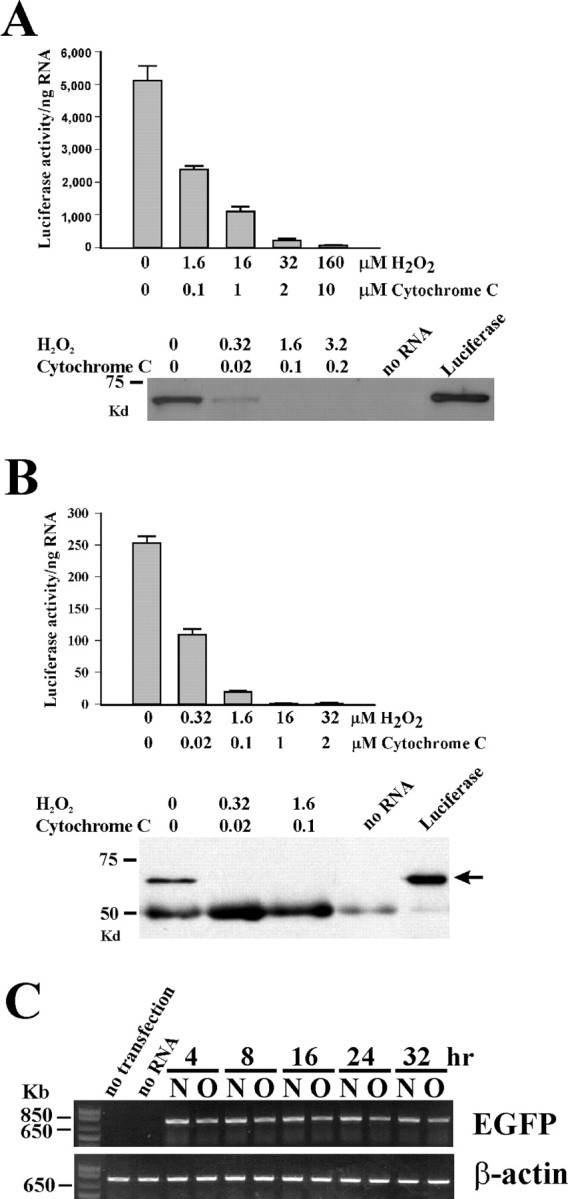
The oxidized luciferase and EGFP mRNAs produce defective proteins leading to loss of normal protein level and protein function. A, Expression of oxidized and nonoxidized firefly luciferase mRNAs in the rabbit reticulocyte lysate. The luciferase activities as well as detectable luciferase protein levels decrease in the oxidized mRNA samples in a dose-dependent manner. The protein levels were determined by visualizing luciferase proteins labeled with biotinylated lysine residues by Western blot analysis. B, Expression of oxidized and nonoxidized firefly luciferase mRNAs in HEK293 cells by transfection. Nonoxidized Renilla luciferase mRNAs were cotransfected into the cells to assess equal transfection efficiency among the samples. A dose-dependent loss of luciferase activities and detectable protein levels in the oxidized mRNA samples was also observed. The protein levels were determined by immunoprecipitation using anti-luciferase antibodies followed by immunoblotting. The arrow indicates expressed luciferase proteins; the last lane is purified luciferase protein. The 50 kDa bands are immunoglobin heavy chain bands. C, Detection of levels of oxidized and nonoxidized mRNAs at different time points after transfection by quantitative RT-PCR analysis. HEK293 cells were transfected with either oxidized EGFP mRNAs (O; treated with 3.2 μm H2O2 and 0.2 μm cytochrome c) or nonoxidized EGFP mRNAs (N). Cells were harvested at indicated times and total RNAs were subsequently isolated for quantitative RT-PCR analysis. β-actin mRNA was used as an internal control. Two negative controls were included: omission of mRNAs during transfection and omission of transfection reagent DMRIE-c during transfection. The oxidized mRNAs remained the similar level as nonoxidized mRNAs for up to 32 hr. Slightly decreased band intensity in the oxidized samples is the result of lower RT-PCR efficiency from oxidized mRNAs than nonoxidized mRNAs as confirmed by quantitative RT-PCR using the RNA samples for transfection as templates (data not shown).
To determine the effect of RNA oxidation on protein localization, we examined luciferase protein expression by immunostaining in HEK293 cells transfected with either nonoxidized or oxidized luciferase mRNAs. Surprisingly, we observed protein aggregation in the HEK293 cells transfected with oxidized luciferase mRNAs (Fig. 4). Protein aggregation was also observed in the cells transfected with oxidized EGFP mRNAs (Fig. 4). These results indicate that oxidized luciferase and EGFP mRNAs cannot be translated to proteins properly resulting in protein aggregation.
Figure 4.

Intracellular protein aggregation in HEK293 cells transfected with oxidized luciferase and EGFP mRNAs. HEK293 cells were transfected with nonoxidized or oxidized in vitro synthesized luciferase mRNAs or EGFP mRNAs. Cells transfected with luciferase mRNAs were fixed and stained with polyclonal anti-luciferase antibodies. The oxidized RNA samples were treated with 3.2 μm H2O2 and 0.2 μm cytochrome c. Scale bar, 20 μm.
Discussion
It has been well documented that nucleic acid oxidation is increased in AD (Mecocci et al., 1993, 1994, 1997). Nunomura et al. (1999) have recently used a cytological approach to localize oxidized nucleic acids in AD. They reported that oxidative damage to nucleic acids is restricted to vulnerable neurons and most of the oxidized nucleosides are associated with cytoplasmic RNAs. In this study, we used a biochemical approach to isolate and identify oxidized mRNA species in AD. We showed that significant amounts of mRNAs are oxidized in AD frontal cortex. Importantly, mRNA oxidation is not random but highly selective and some mRNA species are more susceptible to oxidative damage. Many identified oxidized mRNA species have been implicated in the pathogenesis of AD. We also demonstrated the biological consequence of oxidized luciferase and EGFP mRNAs by expressing them in cell lines. Our results revealed that the oxidized luciferase or EGFP mRNAs can not be translated to proteins properly leading to aggregation. This is the first study that characterizes oxidized mRNA species in AD.
We used a monoclonal antibody against 8OHG (15A3) to separate oxidized mRNAs from nonoxidized mRNAs. This is the first report of using antibodies to precipitate RNAs. The procedure was validated by using appropriate controls (Fig 1B,C). The isolated oxidized mRNAs are specifically present in cells and not artifacts, as supported by the following facts: (1) no effect of postmortem intervals on the amount of oxidized mRNAs was found; (2) no effect of the agonal state in oxidation of mRNAs was found; (3) in the same AD patient, significant amounts of oxidized mRNAs were isolated from the affected areas (frontal cortex and hippocampus), but no or very few amounts of oxidized mRNAs were isolated from the unaffected area (cerebellum); and (4) many identified oxidized mRNA species have been implicated in the pathogenesis of AD. We used the filter array method to quantify the level of each oxidized mRNA species in AD and normal control brain samples. This procedure is reliable because: (1) the cDNA probes were directly generated from immunoprecipitated oxidized mRNAs and therefore, the signal intensity on the arrays truly represents the abundance of each oxidized mRNA species, (2) by using semiquantitative RT-PCR, we confirmed the signal intensity of each band correlated to the amount of oxidized mRNA species, and (3) no signal appeared on the negative control filters even after long exposure (Fig. 3).
Less oxidized mRNAs were immunoprecipitated from the AD hippocampus compared with frontal cortex. It is possible that the hippocampus is the most affected area in AD and significant numbers of neurons are degenerated so that a less amount of oxidized mRNAs was immunoprecipitated. This also agrees with the previous study by Nunomura et al. (1999). They demonstrated that nucleic acid damage is not dependent on proximity to senile plaques and is reduced in neurons containing neurofibrillary tangles, suggesting that RNA oxidation may precede lesion formation.
The very striking finding in this study is that most of the identified known oxidized transcripts are related to AD. Either these transcripts or their family members have been characterized in AD or their protein functions have been implicated in the pathogenesis of AD. The p21ras proteins as well as downstream elements of the MAPK cascade, including MAPK kinase 1, are elevated at very early stages of AD (Arendt et al., 1995; Gartner et al., 1999). The increased expression of these proteins associates with neurofibrillary degeneration. Furthermore, it has been shown that p21ras/MEK/extracellular signal-regulated kinase pathway modulates the expression and posttranslational processing of tau and APP proteins (Mills et al., 1997; Sadot et al., 1998; Ferrer et al., 2001). Carbonyl reductase, which plays an important role in detoxification of protein carbonylation, was found increased in several brain regions of AD (Balcz et al., 2001). SOD1, an antioxidant enzyme, was found to increase expression in AD brains, but its activity was reduced (Omar, 1999). Phosphotriesterases catalyze the hydrolysis of a range of phosphotriester compounds. Paraoxonase, a member of phosphotriesterase family, can metabolize oxidized lipids, thereby functioning as an antioxidative enzyme (Furlong, 2000). Paraoxonase activity is significantly lower in AD than in healthy controls (Paragh et al., 2002). Glutamate dehydrogenase plays an important role in maintaining extracellular glutamate level, and its activity is decreased in lymphocytes from AD patients (Iwatsuji et al., 1989). Cytochrome b is a subunit of complex III of the mitochondrial respiratory chain. A mutation in cytochrome b causes oxidative stress and aging in nematodes (Ishii et al., 1998). Several point mutations of cytochrome b have been associated with Parkinson disease (von Eitzen et al., 2000; Fisher and Meunier, 2001; Tanaka, 2002). Apo D, a member of the lipocalin family, is increased in the cerebrospinal fluid and hippocampus of AD (Terrisse et al., 1998; Belloir et al., 2001). Transferrin, an iron-transporting protein, is significantly increased in AD brains (Loeffler et al., 1995; Focht et al., 1997). The transferrin C2 variant is associated with late-onset AD (Namekata et al., 1997; van Rensburg et al., 2000). Purinergic receptors are involved in extracellular nucleotide-mediated fast excitatory synaptic transmission. The P2Y1 purinergic receptor localizes to a number of characteristic AD structures such as neurofibrillary tangles, neuritic plaques, and neuropil treads (Moore et al., 2000). Cadherins, a family of cell adhesion molecules, play important roles in synaptic structure, function, and plasticity (Goda, 2002). These molecules have been implicated in the induction of LTP of hippocampal synaptic strength, a cellular model for learning and memory (Huntley et al., 2002). RNB6 is a member of enabled (Ena)/vasodilator-stimulated phosphoprotein (VASP) family that is involved in actin filament assembly (Ohta et al., 1997). The Ena/VASP family protein has been suggested to contribute to the perpetuation of the plastic changes in synaptic transmission during LTP by regulating actin polymerization (Kato et al., 1997). Calpains, a family of calcium-activated cysteinyl/thiol proteases, have been implicated in neurodegenerative processes (Chan and Mattson, 1999). Calpain activation is increased in AD and the active form of calpain 2 is colocalized with hyperphosphorylated tau protein (Nixon, 2000; Adamec et al., 2002). Cell death-inducing DFF45 (DNA fragmentation factor 45kDa)-like effector B (CIDE-B) shares homology with the apoptosis-inducing DNA fragmentation factor (Inohara et al., 1998). In summary, the mRNA species that are heavily oxidized in AD frontal cortex normally serve a variety of important physiological functions. Although these gene transcripts and their protein products have not been established to be very important in AD, their roles in AD may be underestimated and need additional investigations. Furthermore, oxidation of one mRNA species may not affect normal cellular function; however, oxidation of numerous mRNA species may strongly interfere with the fine regulation of cell physiology that may contribute to the pathogenesis of AD. One interesting observation is that most of these AD-related mRNA species have been reported upregulation in AD. It is conceivable that oxidized mRNAs may produce defective proteins and the cells try to compensate the loss of functional proteins by increasing their expressions. However, the increased mRNAs may still be damaged and produce defective proteins resulting in loss of activity. Furthermore, the defective proteins may have not only a loss of normal function but also a gain of toxic function.
One important finding in this study is that mRNA oxidation is not random but highly selective and some mRNA species are more susceptible to oxidative damage. The highly abundant mRNAs such as β-actin mRNAs are not oxidized in AD. Those identified known oxidized mRNA species are not abundant in cells. This would indicate that mRNAs are not randomly hit by free radicals. RNA oxidation may be regulated by unknown mechanisms. We have examined RNA sequences and RNA structures (available at http://www.tbi.univie.ac.at) for those identified mRNA species, and no common motifs or structures were found. The spatial conformation of mRNAs may regulate the rate of base hydroxylation by oxidants. RNA stability may affect the possibility of individual mRNA species to be oxidized under oxidative attacks. Also, the turnover rate of oxidative damaged mRNAs may be a factor to determine their presence in the cytosol. Studies from Butterfield group on oxidatively modified proteins reveal the presence of specific targets of protein oxidation in AD brain (Castegna et al., 2002a,b). Together, these observations on protein and RNA oxidation may indicate that specific macromolecules are more prone to free radical oxidation in AD.
The biological consequence of oxidized mRNAs is the next issue to investigate. We used oxidized luciferase and EGFP mRNAs as the initial study. We observed the following: (1) oxidized luciferase and EGFP mRNAs are as stable as the nonoxidized mRNA in the HEK293 cells, (2) oxidation of luciferase and EGFP mRNAs leads to loss of normal protein level and protein function in the rabbit reticulocyte lysate as well as in the HEK293 cells, and (3) oxidized luciferase and EGFP mRNAs may produce defective proteins leading to protein aggregation in HEK293 cells. It is possible that different oxidized mRNA species may behave differently and have different effects depending on their natures. Furthermore, these experiments were studied in the cell lines. It is possible that oxidized mRNAs may have different outcomes in neurons. Investigation of those highly oxidized mRNAs found in AD in neurons is our future goal. Because protein aggregation is a common feature for neurodegenerative diseases (Tran and Miller, 1999), it is important to explore whether RNA oxidation contributes to protein aggregation observed in AD.
In conclusion, these studies contribute to a growing body of evidence of oxidative damage in AD. In Alzheimer frontal cortex, some mRNA species are heavily damaged by oxidants. Such RNA oxidation may lead to protein dysfunction and/or protein aggregation, which may contribute to the pathogenesis of Alzheimer's disease.
Footnotes
This work was supported by National Institutes of Health Grants MH59805 and AG17317 and the Alzheimer's Association. We thank Johns Hopkins Alzheimer's Disease Research Center Brain Bank and Amyotrophic Lateral Sclerosis Brain Bank, Harvard Brain Tissue Resource Center, and University of Maryland Brain and Tissue Banks for Developmental Disorders for providing Alzheimer's disease and normal control brain tissues. We thank Drs. Georgia A. Bishop and James S. King for access to the microscope, Matthew E. R. Butchbach and Dr. James R. Van Brocklyn for reviewing this manuscript, and Dr. Jeffrey Kuret for vigorous discussions.
Correspondence should be addressed to Dr. Chien-liang Glenn Lin, Department of Neuroscience, The Ohio State University, 4068 Graves Hall, 333 West Tenth Avenue, Columbus, OH 43210. E-mail: lin.492@osu.edu.
Copyright © 2003 Society for Neuroscience 0270-6474/03/234913-09$15.00/0
References
- Adamec E, Mohan P, Vonsattel JP, Nixon RA ( 2002) Calpain activation in neurodegenerative diseases: confocal immunofluorescence study with antibodies specifically recognizing the active form of calpain 2. Acta Neuropathol (Berl) 104: 92–104. [DOI] [PubMed] [Google Scholar]
- Arendt T, Holzer M, Grossmann A, Zedlick D, Bruckner MK ( 1995) Increased expression and subcellular translocation of the mitogen activated protein kinase kinase and mitogen-activated protein kinase in Alzheimer's disease. Neuroscience 68: 5–18. [DOI] [PubMed] [Google Scholar]
- Balcz B, Kirchner L, Cairns N, Fountoulakis M, Lubec G ( 2001) Increased brain protein levels of carbonyl reductase and alcohol dehydrogenase in Down syndrome and Alzheimer's disease. J Neural Transm Suppl 193–201. [DOI] [PubMed]
- Belloir B, Kovari E, Surini-Demiri M, Savioz A ( 2001) Altered apolipoprotein D expression in the brain of patients with Alzheimer disease. J Neurosci Res 64: 61–69. [DOI] [PubMed] [Google Scholar]
- Castegna A, Aksenov M, Thongboonkerd V, Klein JB, Pierce WM, Booze R, Markesbery WR, Butterfield DA ( 2002a) Proteomic identification of oxidatively modified proteins in alzheimer's disease brain, I: creatine kinase BB, glutamine synthase, and ubiquitin carboxy-terminal hydrolase L-1. Free Radic Biol Med 33: 562–571. [DOI] [PubMed] [Google Scholar]
- Castegna A, Aksenov M, Thongboonkerd V, Klein JB, Pierce WM, Booze R, Markesbery WR, Butterfield DA ( 2002b) Proteomic identification of oxidatively modified proteins in Alzheimer's disease brain, II: dihydropyrimidinase-related protein 2, alpha-enolase and heat shock cognate 71. J Neurochem 82: 1524–1532. [DOI] [PubMed] [Google Scholar]
- Chan SL, Mattson MP ( 1999) Caspase and calpain substrates: roles in synaptic plasticity and cell death. J Neurosci Res 58: 167–190. [PubMed] [Google Scholar]
- Eberwine J, Yeh H, Miyashiro K, Cao Y, Nair S, Finnell R, Zettel M, Coleman P ( 1992) Analysis of gene expression in single live neurons. Proc Natl Acad Sci USA 89: 3010–3014. [DOI] [PMC free article] [PubMed] [Google Scholar]
- Ferrer I, Blanco R, Carmona M, Ribera R, Goutan E, Puig B, Rey MJ, Cardozo A, Vinals F, Ribalta T ( 2001) Phosphorylated map kinase (ERK1, ERK2) expression is associated with early tau deposition in neurones and glial cells, but not with increased nuclear DNA vulnerability and cell death, in Alzheimer disease, Pick's disease, progressive supranuclear palsy and corticobasal degeneration. Brain Pathol 11: 144–158. [DOI] [PMC free article] [PubMed] [Google Scholar]
- Fiala ES, Conaway CC, Mathis JE ( 1989) Oxidative DNA and RNA damage in the livers of Sprague-Dawley rats treated with the hepatocarcinogen 2-nitropropane. Cancer Res 49: 5518–5522. [PubMed] [Google Scholar]
- Fisher N, Meunier B ( 2001) Effects of mutations in mitochondrial cytochrome b in yeast and man. Deficiency, compensation and disease. Eur J Biochem 268: 1155–1162. [DOI] [PubMed] [Google Scholar]
- Focht SJ, Snyder BS, Beard JL, Van Gelder W, Williams LR, Connor JR ( 1997) Regional distribution of iron, transferrin, ferritin, and oxidatively-modified proteins in young and aged Fischer 344 rat brains. Neuroscience 79: 255–261. [DOI] [PubMed] [Google Scholar]
- Furlong CE ( 2000) PON1 status and neurologic symptom complexes in Gulf War veterans. Genome Res 10: 153–155. [DOI] [PubMed] [Google Scholar]
- Gabbita SP, Lovell MA, Markesbery WR ( 1998) Increased nuclear DNA oxidation in the brain in Alzheimer's disease. J Neurochem 71: 2034–2040. [DOI] [PubMed] [Google Scholar]
- Gartner U, Holzer M, Arendt T ( 1999) Elevated expression of p21ras is an early event in Alzheimer's disease and precedes neurofibrillary degeneration. Neuroscience 91: 1–5. [DOI] [PubMed] [Google Scholar]
- Goda Y ( 2002) Cadherins communicate structural plasticity of presynaptic and postsynaptic terminals. Neuron 35: 1–3. [DOI] [PubMed] [Google Scholar]
- Hirai K, Aliev G, Nunomura A, Fujioka H, Russell RL, Atwood CS, Johnson AB, Kress Y, Vinters HV, Tabaton M, Shimohama S, Cash AD, Siedlak SL, Harris PL, Jones PK, Petersen RB, Perry G, Smith MA ( 2001) Mitochondrial abnormalities in Alzheimer's disease. J Neurosci 21: 3017–3023. [DOI] [PMC free article] [PubMed] [Google Scholar]
- Huntley GW, Gil O, Bozdagi O ( 2002) The cadherin family of cell adhesion molecules: multiple roles in synaptic plasticity. Neuroscientist 8: 221–233. [DOI] [PubMed] [Google Scholar]
- Inohara N, Koseki T, Chen S, Wu X, Nunez G ( 1998) CIDE, a novel family of cell death activators with homology to the 45 kDa subunit of the DNA fragmentation factor. EMBO J 17: 2526–2533. [DOI] [PMC free article] [PubMed] [Google Scholar]
- Ishii N, Fujii M, Hartman PS, Tsuda M, Yasuda K, Senoo-Matsuda N, Yanase S, Ayusawa D, Suzuki K ( 1998) A mutation in succinate dehydrogenase cytochrome b causes oxidative stress and aging in nematodes. Nature 394: 694–697. [DOI] [PubMed] [Google Scholar]
- Iwatsuji K, Nakamura S, Kameyama M ( 1989) Lymphocyte glutamate dehydrogenase activity in normal aging and neurological diseases. Gerontology 35: 218–224. [DOI] [PubMed] [Google Scholar]
- Kasai H, Chung MH, Jones DS, Inoue H, Ishikawa H, Kamiya H, Ohtsuka E, Nishimura S ( 1991) 8-Hydroxyguanine, a DNA adduct formed by oxygen radicals: its implication on oxygen radical-involved mutagenesis/carcinogenesis. J Toxicol Sci 16 Suppl 1: 95–105. [DOI] [PubMed] [Google Scholar]
- Kato A, Ozawa F, Saitoh Y, Hirai K, Inokuchi K ( 1997) vesl, a gene encoding VASP/Ena family related protein, is upregulated during seizure, long-term potentiation and synaptogenesis. FEBS Lett 412: 183–189. [DOI] [PubMed] [Google Scholar]
- Loeffler DA, Connor JR, Juneau PL, Snyder BS, Kanaley L, DeMaggio AJ, Nguyen H, Brickman CM, LeWitt PA ( 1995) Transferrin and iron in normal, Alzheimer's disease, and Parkinson's disease brain regions. J Neurochem 65: 710–724. [DOI] [PubMed] [Google Scholar]
- Lovell MA, Markesbery WR ( 2001) Ratio of 8-hydroxyguanine in intact DNA to free 8-hydroxyguanine is increased in Alzheimer disease ventricular cerebrospinal fluid. Arch Neurol 58: 392–396. [DOI] [PubMed] [Google Scholar]
- Mecocci P, MacGarvey U, Kaufman AE, Koontz D, Shoffner JM, Wallace DC, Beal MF ( 1993) Oxidative damage to mitochondrial DNA shows marked age-dependent increases in human brain. Ann Neurol 34: 609–616. [DOI] [PubMed] [Google Scholar]
- Mecocci P, MacGarvey U, Beal MF ( 1994) Oxidative damage to mitochondrial DNA is increased in Alzheimer's disease. Ann Neurol 36: 747–751. [DOI] [PubMed] [Google Scholar]
- Mecocci P, Beal MF, Cecchetti R, Polidori MC, Cherubini A, Chionne F, Avellini L, Romano G, Senin U ( 1997) Mitochondrial membrane fluidity and oxidative damage to mitochondrial DNA in aged and AD human brain. Mol Chem Neuropathol 31: 53–64. [DOI] [PubMed] [Google Scholar]
- Mills J, Laurent Charest D, Lam F, Beyreuther K, Ida N, Pelech SL, Reiner PB ( 1997) Regulation of amyloid precursor protein catabolism involves the mitogen-activated protein kinase signal transduction pathway. J Neurosci 17: 9415–9422. [DOI] [PMC free article] [PubMed] [Google Scholar]
- Moore D, Iritani S, Chambers J, Emson P ( 2000) Immunohistochemical localization of the P2Y1 purinergic receptor in Alzheimer's disease. NeuroReport 11: 3799–3803. [DOI] [PubMed] [Google Scholar]
- Namekata K, Imagawa M, Terashi A, Ohta S, Oyama F, Ihara Y ( 1997) Association of transferrin C2 allele with late-onset Alzheimer's disease. Hum Genet 101: 126–129. [DOI] [PubMed] [Google Scholar]
- Nixon RA ( 2000) A “protease activation cascade” in the pathogenesis of Alzheimer's disease. Ann NY Acad Sci 924: 117–131. [PubMed] [Google Scholar]
- Nunomura A, Perry G, Pappolla MA, Wade R, Hirai K, Chiba S, Smith MA ( 1999) RNA oxidation is a prominent feature of vulnerable neurons in Alzheimer's disease. J Neurosci 19: 1959–1964. [DOI] [PMC free article] [PubMed] [Google Scholar]
- Ohta S, Mineta T, Kimoto M, Tabuchi K ( 1997) Differential display cloning of a novel rat cDNA (RNB6) that shows high expression in the neonatal brain revealed a member of Ena/VASP family. Biochem Biophys Res Commun 237: 307–312. [DOI] [PubMed] [Google Scholar]
- Omar RA ( 1999) Increased expression but reduced activity of antioxidant enzymes in Alzheimer's disease. J Alzheimers Dis 1: 139–145. [DOI] [PubMed] [Google Scholar]
- Paragh G, Balla P, Katona E, Seres I, Egerhazi A, Degrell I ( 2002) Serum paraoxonase activity changes in patients with Alzheimer's disease and vascular dementia. Eur Arch Psychiatry Clin Neurosci 252: 63–67. [DOI] [PubMed] [Google Scholar]
- Sadot E, Jaaro H, Seger R, Ginzburg I ( 1998) Ras-signaling pathways: positive and negative regulation of tau expression in PC12 cells. J Neurochem 70: 428–431. [DOI] [PubMed] [Google Scholar]
- Sayre LM, Zelasko DA, Harris PL, Perry G, Salomon RG, Smith MA ( 1997) 4-Hydroxynonenal-derived advanced lipid peroxidation end products are increased in Alzheimer's disease. J Neurochem 68: 2092–2097. [DOI] [PubMed] [Google Scholar]
- Smith CD, Carney JM, Starke-Reed PE, Oliver CN, Stadtman ER, Floyd RA, Markesbery WR ( 1991) Excess brain protein oxidation and enzyme dysfunction in normal aging and in Alzheimer disease. Proc Natl Acad Sci USA 88: 10540–10543. [DOI] [PMC free article] [PubMed] [Google Scholar]
- Subbarao KV, Richardson JS, Ang LC ( 1990) Autopsy samples of Alzheimer's cortex show increased peroxidation in vitro. J Neurochem 55: 342–345. [DOI] [PubMed] [Google Scholar]
- Tanaka M ( 2002) Mitochondrial genotypes and cytochrome b variants associated with longevity or Parkinson's disease. J Neurol 249 Suppl 2: II11–II18. [DOI] [PubMed] [Google Scholar]
- Terrisse L, Poirier J, Bertrand P, Merched A, Visvikis S, Siest G, Milne R, Rassart E ( 1998) Increased levels of apolipoprotein D in cerebrospinal fluid and hippocampus of Alzheimer's patients. J Neurochem 71: 1643–1650. [DOI] [PubMed] [Google Scholar]
- Tran PB, Miller RJ ( 1999) Aggregates in neurodegenerative disease: crowds and power? Trends Neurosci 22: 194–197. [DOI] [PubMed] [Google Scholar]
- van Rensburg SJ, Potocnik FC, De Villiers JN, Kotze MJ, Taljaard JJ ( 2000) Earlier age of onset of Alzheimer's disease in patients with both the transferrin C2 and apolipoprotein E-epsilon 4 alleles. Ann NY Acad Sci 903: 200–203. [DOI] [PubMed] [Google Scholar]
- von Eitzen U, Kosel S, Grasbon-Frodl EM, Egensperger R, Graeber MB ( 2000) Sequence analysis of the MTCYB gene in Parkinson disease. Neurogenetics 3: 47–48. [DOI] [PubMed] [Google Scholar]
- Wamer WG, Yin JJ, Wei RR ( 1997) Oxidative damage to nucleic acids photosensitized by titanium dioxide. Free Radic Biol Med 23: 851–858. [DOI] [PubMed] [Google Scholar]