

Abstract
The aim of this study was to describe the induction and expression mechanisms of a persistent bursting activity in a horizontal slice preparation of the rat limbic system that includes the ventral part of the hippocampus and the entorhinal cortex. Disinhibition of this preparation by bicuculline led to interictal-like bursts in the CA3 region that triggered synchronous activity in the entorhinal cortex. Washout of bicuculline aftera1hr application resulted in a maintained production of hippocampal bursts that continued to spread to the entorhinal cortex. Separation of CA3 from the entorhinal cortex caused the activity in the latter to become asynchronous with CA3 activity in the presence of bicuculline and disappear after washout; however, in CA3, neither the induction of bursting nor its persistence were affected. Associated with the CA3 persistent bursting, a strengthening of recurrent collateral excitatory input to CA3 pyramidal cells and a decreased input to CA3 interneurons was found. Both the induction of the persistent bursting and the changes in synaptic strength were prevented by antagonists of metabotropic glutamate 5 (mGlu5) or NMDA receptors or protein synthesis inhibitors and did not occur in slices from mGlu5 receptor knock-out mice. The above findings suggest potential synaptic mechanisms by which the hippocampus switches to a persistent interictal bursting mode that may support a spread of interictal-like bursting to surrounding temporal lobe regions.
Keywords: epilepsy, mGluR5 knockout, interictal bursting, synaptic plasticity, CA3 recurrent collaterals, persistent bursting, horizontal slice
Introduction
In brains of epileptic patients, short spontaneous “interictal bursts” are observed between epileptic seizures. Although the exact relationship between interictal bursts and seizure activity is poorly understood, it appears that their development is closely related with the epileptic pathology. Interictal bursts have been suggested to both being predictive of seizure activity (Ralston, 1958; Cascino et al., 1996; Holmes et al., 1996) and playing a role in the control of epileptic activity (Avoli, 2001; de Curtis et al., 2001). An understanding of the mechanisms that lead to the development and maintenance of interictal bursting may thus shed additional light on the nature of epileptic pathology. In in vitro slice preparations of the hippocampus, discharges resembling interictal activity can be readily provoked by a blockade of GABAA-mediated inhibitory transmission. Anatomical (Ishizuka et al., 1990; Gomez-Di Cesare et al., 1997) and electrophysiological (Miles and Wong, 1986) studies have shown that a combination of spontaneous bursting in pyramidal cells and recurrent excitatory circuitry underlies the development of this interictal-like bursting in the hippocampus (for review, see Traub and Jefferys, 1994). Synaptic plasticity has been extensively described in this region, but its effects on the function of recurrent excitatory circuitry have been poorly characterized. Activity-dependent long-lasting modifications of synapses in recurrent loops may have drastic implications for the function of such networks and may push them into states of permanently altered network behavior (Bains et al., 1999; McEwen, 2001).
In the present study, we show that 30–60 min of bicuculline-mediated disinhibition induces a persistent interictal-like bursting that spreads from the CA3 region to the entorhinal cortex, where it triggers and maintains a synchronized interictal-like activity. Our data suggest that bursting is maintained because of a persistent potentiation of the recurrent collateral synapses on CA3 pyramidal cells and long-lasting depression of projections from the recurrent collaterals on CA3 interneurons. The induction, but not the maintenance of these persistent changes, depends on the activation of metabotropic glutamate 5 (mGlu5) and NMDA receptors and requires protein synthesis. These findings show how a restricted period of enhanced endogenous activity in the normal hippocampus can cause permanent changes in synaptic transmission and a persistent interictal-like activity that can control bursting activity in other parts of the temporal lobe.
Materials and Methods
Slice preparation. Male and female C57B1/6 mice (3–4 weeks old) were used throughout the study of either the wild type or, where indicated, lacking mGlu5 receptors [metabotropic glutamate 5 receptor (mGluR5)-knock-out (KO)] (Chiamulera et al., 2001). Horizontal slices were prepared using methods similar to those described for the slice preparation from the rat brain (Stoop and Pralong, 2000). Slices were transferred to the recording chamber (Fine Science Tools, Heidelberg, Germany), in which they were maintained on a nylon grid at the interface between humidified carbogen and a constant flow (1.5 ml/min) of artificial CSF (ACSF) containing the following (in mm): 118 NaCl, 25 NaHCO3, 10 glucose, 2 KCl, 2 MgCl2×6H2O, 2 CaCl2×2H2O, and 1.2 NaH2PO4 at 31°C, saturated with carbogen [95% O2 (5% CO2)], pH 7.4. After 1 hr of recovery in the bath, extracellular K+ concentration was augmented to 5 mm by the addition of KCl, and the slices were left for 1 hr in this condition before the experiments began.
Electrophysiological recordings. Extracellular recordings were made using 0.5 MΩ tungsten microelectrodes (Frederick Haer Company, Bowdoinham, ME); signals were preamplified 20 times and additionally amplified 100 times by a Cyberamp380 amplifier (Axon Instruments, Foster City, CA). Conventional intracellular voltage recordings were made from neurons in the CA3 pyramidal cell layer using an Axoclamp 2A amplifier (Axon Instruments) in the bridge mode and sharp glass electrodes filled with potassium acetate (4 m) with resistances ranging from 80 to 120 MΩ. The membrane potential was monitored on a digital recording oscilloscope (Kombigraf 4; Gould Instruments, Valley View, OH). Membrane currents were obtained from visually guided whole-cell patch-clamp recording under infrared videomicroscopy (DMLFS; Leica, Bensheim, Germany) using 5–10 MΩ borosilicate pipettes filled with the following (in mm): 150 KOH, 150 HCH3SO3, 10 HEPES, 2 MgCl2×6H2O, 0.1 BAPTA, 2 ATP (Na+ salt), and 0.4 GTP (Na+ salt), adjusted with KOH, pH 7.2, and held at –70 mV. The holding potential of –40 mV was used for measuring IPSCs when they were not pharmacologically isolated. Pharmacologically isolated IPSCs were measured at –70 mV, in which case KOH and HCH3SO3 were replaced with KCl (150 mm) in the intracellular solution, and the blockers of excitatory glutamate receptors d(–)-2-amino-5-phosphonopentanoic acid (AP-5) (100 μm) and 1,2,3,4-tetrahydro-6-nitro-2,3-dioxo-benzo[f]quinoxaline-7-sulfonamide (NBQX) (10 μm) were added to the ACSF immediately before the recordings. GABAergic identity of these currents was confirmed post hoc by perfusion with bicuculline (20 μm). For the patch-clamp recordings, the Axopatch 200B amplifier (Axon Instruments) was used.
Extracellular stimulation was performed using a bipolar tungsten electrode of 1 MΩ with a tip separation of 125 μm (Frederick Haer Company) that was connected to a Grass S88 stimulator. Single stimuli were delivered at 0.1–0.2 Hz frequency. NBQX (10 μm) and AP-5 (100 μm) were used to isolate IPSPs. Their averages were made of five consecutive traces. ACSF-filled glass pipettes were used for minimal stimulation of the mossy fiber or recurrent collateral pathway (0.1 Hz; 30–50 μsec). Stimulus intensities were adjusted to a level at which the mean amplitude of the EPSCs and failure rate were independent of the stimulus intensity over a range of approximately ±5% (see Fig. 7B), suggesting activation of a single presynaptic fiber (Raastad, 1995). Our pilot experiments showed that this “minimal stimulation protocol” induced ∼40–50% transmission failures (see Fig. 7D). Because the construction of a detailed stimulus–response curve (see Fig. 7B) was time consuming and could induce activity-dependent changes of synaptic efficacy, we typically used a simpler procedure to ensure activation of one presynaptic fiber (or only a few): the stimulus strength was set at the level corresponding to ∼40–50% of transmission failures. Evoked EPSCs were accepted for analysis if they appeared in the interval between 2 and 7 msec after stimulation, their latency was stable within <1 msec, and they exhibited characteristic fast rising and exponential decay phases and peak amplitudes that exceeded two SDs of the baseline noise. Stimulus trials that did not produce events meeting these criteria were considered transmission failures and were not used for additional analysis.
Figure 7.

Evoked EPSCs before and 3 hr after bicuculline washout A, Diagram of the slice preparation indicating the sites of the recordings (filled circles) and stimulation (arrows). B, Plot of EPSC amplitudes at different stimulus intensities (n = 5 measurements per point) from a representative experiment. C, Example traces of evoked EPSCs recorded in a CA3 pyramidal cell after minimal stimulation of the recurrent collaterals. D, Amplitude histogram from the same experiment illustrated in B and C. E, F, Mean amplitudes of the minimal evoked EPSCs recorded from pyramidal cells (E) and interneurons (F) before (black columns) and 3 hr after bicuculline (20 μm) washout (gray columns). All data were obtained from wild-type mice, except for the columns that indicated m5KO, which were from mGluR5-KO mice. +AP-5 and +MPEP indicate treatments with AP-5 (100 μm) and MPEP (50 μm). All experiments were performed at a holding potential of –70 mV. The drugs were applied 30 min before and kept throughout the 1 hr bicuculline incubation (n = 5–20 cells per bar). The stimulated pathways are indicated below the columns in F (*p < 0.05; ANOVA).
Data acquisition and statistical analysis. Data acquisition was performed using a Digidata 1200 interface (Axon Instruments) and an IBM-compatible computer running Axotape 7 software or pClamp 5.7.1 (Axon Instruments). Extracellular, intracellular, or patch-clamp signals were filtered at 1, 2, or 5 kHz, respectively, and digitized at a rate of 2, 5, or 10 kHz. For automated analysis of extracellular signals, Labview 4.1 software (National Instruments, Austin, TX) was used. Events with <700 msec delays between the end of one population spike and the beginning of the next were considered to belong to the same interictal burst. Effects of pharmacological agents or other treatments were quantified by measuring burst parameters (frequency and duration). Statistical significance was assessed using ANOVA test (p < 0.05, considered significant).
Postsynaptic currents obtained with whole-cell patch-clamp recordings were automatically detected and analyzed using the Strathclyde Electrophysiological Data Recorder V2.1.2 software and Whole Cell Program V3.1.4 software (Dr. John Dempster, University of Strathclyde, Glasgow, UK). Detected spontaneous synaptic currents or those evoked by minimal stimulation were visually inspected, and the events that immediately preceded or followed (within 50 msec before and 100 msec after) interictal bursts were manually removed. One to three cells were recorded from each slice. Two hundred to 300 spontaneous events were measured in each cell before and after bicuculline application, and respective mean values for each cell were calculated. The sets of these mean data were used afterward for calculations of general means across all recorded cells, and ±SEM is given in the text and tables. Rise time was defined as the time from 10 to 90% of the peak amplitude, and decay time was defined as the time to 50% of the peak amplitude. In general, the values before and after the treatments were derived from different cells. They were also compared using ANOVA (Van der Kloot, 1991). Cells were classified into pyramidal cells and interneurons according to their position relative to the pyramidal cell layer and their spiking behavior after current injections (van Hooft et al., 2000). Excitatory AMPA receptor-mediated currents were measured as inward currents and inhibitory GABAA receptor-mediated (Cl –) currents as outward currents at –70 mV. Only recordings in which all inward currents could be blocked by NBQX (10 μm) were used for analysis.
Pharmacological treatments. All drugs were applied by bath perfusion. Application of 20 μm bicuculline was started 1 hr after increasing extracellular KCl to 5 mm to ensure development of interictal bursting events (Tancredi and Avoli, 1987). NBQX, AP-5, cycloheximide, and actinomycin D were purchased from Sigma, and mGluR5 antagonist 2-methyl-6-(phenylethynyl)-pyridine (MPEP) and group II agonist (2S,2′R,3′R)-2-(2′,3′-dicarboxycyclopropyl)glycine (DCG-IV) were purchased from Tocris Cookson (Bristol, UK). Antagonists were perfused for 30 min before the start of the bicuculline application until bicuculline washout unless otherwise indicated.
Results
Persistence of bursting activity after bicuculline washout
Extracellular recordings were obtained from the CA3 region of the ventral hippocampus and superficial layers (I–III) of the entorhinal cortex, starting 1 hr after the mouse brain slices were transferred to the experimental chamber. Similar to previous findings in the rat horizontal slice preparation (Stoop and Pralong, 2000), regular interictal-like bursts (hereafter also referred to as bursts) started to appear in both regions within 5–10 min after bicuculline application (Fig. 1). Individual bursts consisted of a large amplitude spike, followed by a variable number of so-called “afterdischarges” (Fig. 1, bottom left). Although burst onsets in both the CA3 and entorhinal cortex were always synchronous, afterdischarges showed more autonomous patterns (Fig. 1, bottom row). After 20–30 min of bicuculline application, synchronous interictal-like bursting in both regions reached an average frequency of 6.6 ± 0.7 bursts per minute and an average burst duration of 331 ± 47 msec in the hippocampus and 403 ± 35 msec in the entorhinal cortex (Fig. 2A,B, respectively) (n = 35 slices). The burst onset in the entorhinal cortex occurred on average with a delay of 24 ± 4 msec after the burst onset in the hippocampal CA3 region (n = 30).
Figure 1.

Effects of bicuculline application and washout on spontaneous bursting activity in the hippocampus and entorhinal cortex. Top traces represent examples of extracellular recordings of bursting activity in the hippocampal CA3 region and EC before, during, and after bicuculline application. Insets represent enlarged parts of the top two traces to show the regularity of the bursting activity (middle traces) as well as the individual bursts with afterdischarges (bottom traces). Bicuculline application is indicated by the gray bar.
Figure 2.
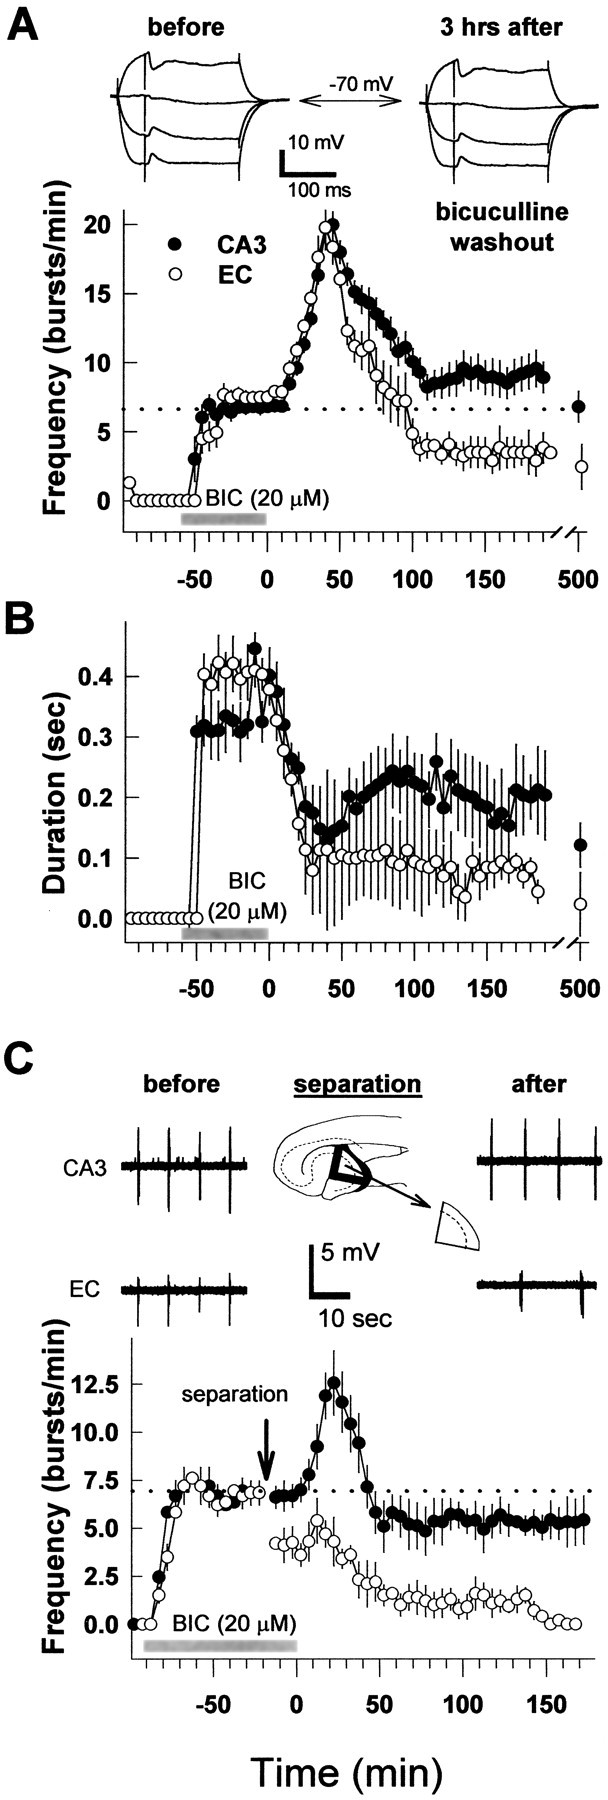
Summary of the effects of bicuculline application and washout on spontaneous bursting activity in intact slices and after separation of the hippocampus from the entorhinal cortex. A, Average burst frequencies before, during, and after 60 min of bicuculline application in the hippocampus (CA3; filled circles) and layers I–III of the entorhinal cortex (open circles). In all graphs, bicuculline application (BIC; 20 μm) is indicated by gray bars, and dotted lines indicate average frequencies obtained during 60 min bicuculline incubation. Insets show representative intracellular recordings from the same CA3 pyramidal neuron after stimulation of recurrent collaterals before (left) and 3 hr after bicuculline washout (right) in the presence of AP-5 (100 μm) and NBQX (10 μm) at holding potentials of –55, –70, –85, and –95 mV. B, Effects of 1 hr bicuculline application on the average burst duration in the same experiments as shown in A (n = 35 slices). C, Average frequencies of bursting activity in the hippocampus and entorhinal cortex before and after their separation (as indicated at the top) followed by bicuculline washout (n = 15 slices). Example traces show CA3 and EC bursting activity before and after separation. Notice the lower frequency in the EC after its separation from the CA3 area and the loss of synchrony with CA3 bursts.
Washout of bicuculline from the slice preparation started 1 hr after the beginning of its application. An immediate effect of the bicuculline washout was a decrease in the duration of the bursts, accompanied by a transient increase in their frequency (Fig. 1, middle column). Maximum average bursting frequencies were reached 30–40 min after bicuculline washout (20 ± 0.9 and 19.8 ± 0.8 bursts per minute in the hippocampus and entorhinal cortex, respectively) (Fig. 2A). Prolonged washout of bicuculline over a period of 2 hr resulted in a decrease in the bursting frequency in the CA3 region to the mean value of 9 ± 1.2 bursts per minute. Bursting in this region persisted at this level for as long as we could measure (≤8 hr). In the entorhinal cortex, the average burst frequency decreased to a lower steady level of 3.4 ± 1.2 bursts per minute. All bursts that could still be detected in this structure were synchronous with the bursts in the CA3 region. The changes in burst frequencies after bicuculline washout were accompanied by decreases in the average burst duration to 195 ± 66 msec in the hippocampus and 74 ± 33 msec in the entorhinal cortex (Fig. 2B, Table 1).
Table 1.
Average burst durations and frequencies of bicuculline-provoked bursts in CA3 region of the ventral hippocampus (CA3) and layers I–III of the entorhinal cortex (EC) under different conditions
|
|
Burst duration (msec) |
Burst frequency (bursts per min) |
|---|---|---|
| During bicuculline | ||
| Control (CA3) | 331 ± 47 | 6.6 ± 0.7 (n=35) |
| Control (EC) | 403 ± 35 | 6.6 ± 0.7 (n=35) |
| After separation (CA3) | 342 ± 59 | 6.7 ± 0.6 (n=15) |
| After separation (EC) | *950 ± 42 | *4 ± 0.6 (n=15) |
| + AP-5 (CA3) | *115 ± 21 | *11.5 ± 1.7 (n=15) |
| + Cycloheximide (CA3) | *200 ± 40 | *11.3 ± 2.2 (n= 8) |
| + Actinomycin D (CA3) | 346 ± 28 | 4.6 ± 0.9 (n= 9) |
| + MPEP (CA3) | 320 ± 32 | 6.8 ± 1.2 (n=12) |
| + mGluR5 knock-out (CA3) | 298 ± 67 | 5.9 ± 0.4 (n=15) |
| After bicuculline | ||
| Control (CA3) | *195 ± 66 | *9 ± 1.2 (n=35) |
| Control (EC) | *74 ± 33 | *3.5 ± 1.1 (n=35) |
| AP-5 (CA3)
|
*120 ± 42
|
*11.9 ± 1.6 (n=17)
|
After bicuculline, Data obtained 3 hr after the beginning of bicuculline washout. After separation, The values obtained immediately after separation of CA3 from the EC (Fig. 2C). Pharmacological treatments lasted from 30 min before bicuculline application until bicuculline washout; AP-5 application after bicuculline was started concomitant with bicuculline washout. Mean values ± SEM are given. Asterisks indicate significant differences (ANOVA; p < 0.05) compared with control before bicuculline. n indicates number of slices.
To test the effects of bicuculline washout on GABAergic inhibition, we recorded IPSPs intracellularly from CA3 pyramidal cells. The IPSPs were evoked by stimulation in the CA3 stratum radiatum, close to the recording site. They were measured from the same cell before and after bicuculline application and pharmacologically isolated by the application of 10 μm NBQX and 100 μm AP-5 throughout the recording (Fig. 2A, top traces). The IPSPs were similar before and 2 hr after bicuculline washout. Their mean amplitudes, measured at a holding potential of –55 mV, were –6.1 ± 1.1 mV before bicuculline washout and –5.9 ± 0.6 mV after bicuculline washout (p > 0.05; ANOVA; n = 8 cells). The data indicate that the washout of bicuculline leads to a full recovery of GABAergic inhibition.
CA3 as the source of persistent bursting
To assess whether the connection between the CA3 hippocampal region and entorhinal cortex plays a role in the maintenance of the persistent bursting, we separated the CA3 from the entorhinal cortex 1 hr after bicuculline application. Two cuts were made with the tip of a fine syringe needle that led to complete isolation of the CA3 region (Fig. 2C, inset). Extracellular bursts were recorded from the isolated CA3 region and layers I–III of the entorhinal cortex in the remaining part of the slice preparation. The separation did not affect the burst appearance in CA3 (Fig. 2C, top right trace). Neither the average burst frequency (Fig. 2C, graph) nor the average burst duration was changed (Table 1). However, in the entorhinal cortex, the bursts started to appear at a lower frequency (Fig. 2C, graph). Moreover, they no longer synchronized with the CA3 bursts, resulting in a total loss of the previous temporal relationship between bursting in the CA3 and entorhinal cortex (EC) (Fig. 2C, bottom right trace). The average bursting frequency in this region decreased immediately after separation to a value of 4 ± 0.6 bursts per minute (Fig. 2C) (n = 15), whereas the average burst duration increased to 950 ± 42 msec (Table 1).
Fifteen minutes after separation, bicuculline washout was started from both regions. As shown in Figure 2C (graph), bicuculline washout resulted in a gradual decrease in the frequency of the bursts in the entorhinal cortex. They disappeared completely after ∼3 hr of washout. In contrast, bursting continued in the CA3 region (Fig. 2C). These findings suggest that in the intact slice preparation, the persistent bursting originates in the CA3 region from where it drives the bursting in the entorhinal cortex. Therefore, in the following experiments, recordings were made only from the CA3 region.
Induction of persistent bursting requires activation of NMDA receptors
The enhanced excitability of the hippocampus resulting in a persistent bursting activity could be a direct result of underlying changes in synaptic strength. We studied whether NMDA receptor activation, often implicated in modifications of synaptic strength (Bliss and Collingridge, 1993), was needed to induce persistent bursting. To this purpose, the NMDA receptor antagonist AP-5 (100 μm) was added before and during bicuculline application (Fig. 3A, filled circles) (n = 15 slices). After bicuculline application, interictal-like bursting developed, although at somewhat higher frequency (11.5 ± 1.7 bursts per minute) compared with control (6.6 ± 0.7 bursts per minute; n = 35; p < 0.05) (Table 1, Fig. 2). The bursts were of shorter duration (115 ± 21 msec; n = 15 slices) compared with control (331 ± 47 msec; n = 35 slices; p < 0.05), similar to previous findings in rat horizontal slices (Stoop and Pralong, 2000).
Figure 3.

Requirement of NMDA receptor activation and effects of different time spans of bicuculline application on the induction of persistent bursting. A, Application of an NMDA receptor blocker AP-5 (100 μm) during (black bar; filled circles; n = 15 slices) or after (white bar; open circles; n = 17 slices) bicuculline application (BIC; 20 μm; gray bar). Notice that AP-5 prevents the persistence of the bursting only when applied during bicuculline application (filled circles), indicating the need for NMDA receptor activation for the induction but not for the expression of the persistent bursting activity. B, Average burst frequencies before, during, and after 15, 30, and 60 min of bicuculline application (white, gray, and black bars corresponding with open, gray, and filled circles in n = 8, 15, and 35 slices, respectively); the dotted line indicates the average frequency reached during 60 min bicuculline incubation.
In the slices pretreated with the NMDA receptor antagonist AP-5 (100 μm), the interictal-like bursting activity disappeared within 60 min after the start of bicuculline washout (Fig. 3A, filled circles). In contrast, when AP-5 was applied only after the start of bicuculline washout, bursting activity continued (Fig. 3A, open circles). In this case, a gradual increase in frequency was seen that reached a final level of 11.9 ± 1.6 bursts per minute after 120 min of bicuculline washout (Fig. 3A, open circles) (n = 17 slices). Thus, it appears that NMDA receptor activation is a necessary condition for the induction of the permanent bursting activity but not for its final expression.
A known type of persistent synaptic plasticity, hippocampal long-term potentiation (LTP), has been shown to have a certain threshold in terms of the strength and duration of challenges used for its induction (Bliss and Collingridge, 1993). Therefore, we explored the effects of different time periods of bicuculline application. We found that its 15 min application was sufficient to cause a development of bursting activity but was insufficient to induce a persistent bursting. Bursting in this case completely disappeared 3 hr after the start of bicuculline washout (Fig. 3B, open circles). Although 30 min of bicuculline application was able to induce a persistent bursting, the resulting final level after bicuculline washout (4.5 ± 1.9 bursts per minute; n = 15 slices) (Fig. 3B, gray circles) was lower than that resulting from 1 hr of bicuculline application (9 ± 1.2 bursts per minute; n = 35 slices; p < 0.05). These findings indicate that a process taking at least 30 min needs to be activated to induce the permanent hippocampal bursting activity.
Induction of persistent bursting requires protein synthesis
It is possible that the establishment of persistent bursting requires de novo protein synthesis. To determine the involvement of protein synthesis, we preincubated slices from wild-type mice with either the mRNA translation inhibitor cycloheximide (50 μm) (Fig. 4A) or DNA transcription inhibitor actinomycin D (25 μm) (Fig. 4B). The incubation started 30 min before and continued throughout the 1 hr bicuculline application. Preincubation with neither of these two inhibitors blocked the development of bursting activity during bicuculline application. Although in the presence of cycloheximide the average frequency of bursting was somewhat elevated and the individual burst duration was shorter compared with the untreated slices, these values were unaffected by actinomycin D (Fig. 4, Table 1). Either treatment completely prevented the development of persistent bursting so that washout of bicuculline resulted in a rapid decrease in bursting frequency and led to a disappearance of the bursting after a 2 hr washout (Fig. 4A,B). It therefore appears that protein synthesis constitutes an essential step in the development of the persistent bursting activity.
Figure 4.
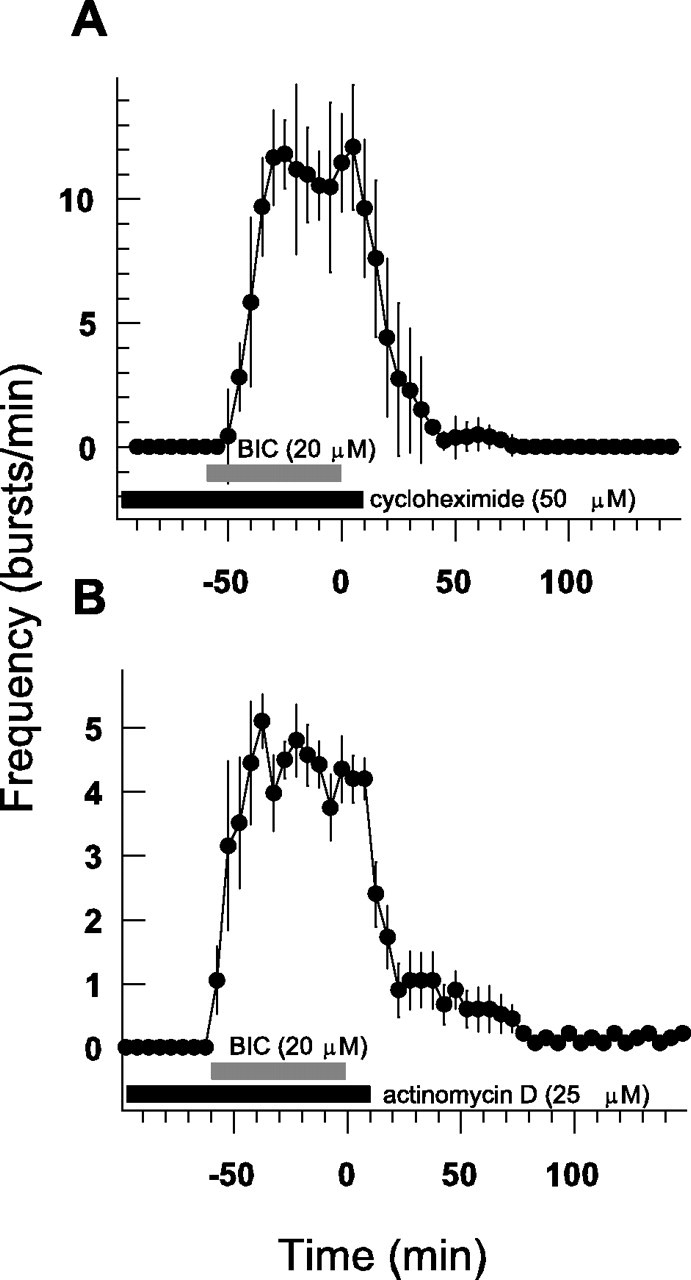
Requirement of protein synthesis for bicuculline-induced persistent bursting activity. Protein translation inhibitor cycloheximide (50 μm) (A, black bar) and mRNA transcription inhibitor actinomycin D (25 μm) (B, black bar) added to the slices 30 min before and kept throughout the bicuculline application (BIC; 20 μm; gray bar) inhibited the induction of the persistent bursting activity by bicuculline (n = 8 and 9 slices, respectively) (compare Fig. 2A).
Induction of persistent bursting requires mGlu5 receptor activation
Activation of metabotropic glutamate receptors, group I (mGluR1 and mGluR 5) in particular, has been implicated in the induction of hippocampal long-term synaptic plasticity (Conquet et al., 1994; Lu et al., 1997). To test the involvement of mGluR5 in the development of persistent bursting, we used slices from a recently generated strain of transgenic mice lacking these receptors (Chiamulera et al., 2001). We found that the bursting activity developed normally after bicuculline application and was indistinguishable in both extracellular and intracellular recordings from the activity in slices of wild-type mice (Fig. 5A). The average bursting frequency was 5.9 ± 0.4 bursts per minute and the average burst duration was 298 ± 67 msec (n = 15 slices), which is not significantly different from the wild-type values (Table 1) (p > 0.05).
Figure 5.
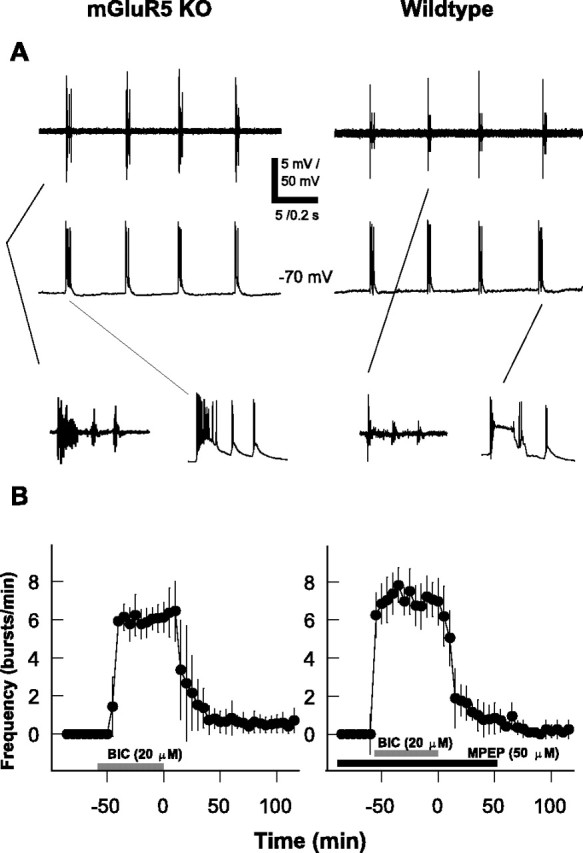
Requirement of mGlu5 receptor activation for bicuculline induced persistent bursting activity. A, Examples of bursts in the CA3 region of slices from mGluR5-KO (left) and wild-type (right) mice. Top and middle traces represent simultaneous extracellular and intracellular recordings, respectively. Insets below show respective bursts on an expanded time scale. B, Bicuculline (BIC; 20 μm) applied during the period indicated by the gray bar did not induce persistent bursting activity in slices of either mGluR5-KO mice (left graph; n = 15 slices) or wild-type mice treated with MPEP (50 μm; right graph, black bar; n = 12 slices).
When bicuculline was washed from the slices lacking mGluR5, an immediate decrease of bursting frequency followed, leading to a total suppression of the bursting activity after a 2 hr washout (Fig. 5B, left graph). This behavior did not result from unspecific developmental or compensatory changes caused by the absence of mGluR5. Indeed, slices from wild-type mice that were preincubated with the mGluR5 antagonist MPEP (Gasparini et al., 1999) showed a similar rapid decrease of the bursting frequency and total halt of bursting aftera2hr bicuculline washout (Fig. 5B, right graph). Neither the average frequency nor duration of the bursts during bicuculline application was affected by the preincubation with MPEP (Table 1). Furthermore, when MPEP was applied only after bicuculline application, bursting activity persisted as in untreated wild-type slices (data not shown). Thus, it appears that the activation of mGluR5 is essential for the induction of the persistent bursting activity, but that it is not needed for its expression.
Bursting increases pyramidal cell excitation and decreases that of interneurons
It follows from the previous findings that several signaling pathways often implicated in long-term synaptic plasticities in the hippocampus are also necessary for the induction of the persistent bursting. To determine which synaptic changes could underlie the persistent bursting, we performed whole-cell patch-clamp recordings from CA3 neurons in the pyramidal cell layer as well as from interneurons close to stratum pyramidale on either stratum radiatum or stratum oriens side. Examples of spontaneous postsynaptic currents recorded from a pyramidal cell and an interneuron are shown in Figure 6A and B. Spontaneous EPSCs appeared at a holding potential of –70 mV as downward inflections with average intervals of 2.4 ± 0.5 sec in pyramidal cells and 2.8 ± 0.4 sec in interneurons (n = 30 neurons of each type recorded from a total of 18 slices). Compared with EPSCs of the pyramidal cells, EPSCs of the interneurons exhibited shorter rise and decay times (Table 2). These values did not significantly change in slices that were still bursting after a 3 hr bicuculline washout.
Figure 6.

Spontaneous postsynaptic current amplitudes before and 3 hr after bicuculline washout. A, B, Examples of spontaneous EPSCs recorded from CA3 pyramidal cells (A) and interneurons (B) before bicuculline application. Insets show sample traces on an expanded time scale. C, D, Cumulative amplitude distributions of spontaneous EPSCs (negative values) and IPSCs (positive values) in pyramidal cells (C) and interneurons (D) before (solid line) and 3 hr after washout of bicuculline applied for 1 hr (dotted line). E, F, Mean amplitudes of EPSCs and IPSCs recorded from pyramidal cells (E) and interneurons (F) before (black columns) and 3 hr after bicuculline (20 μm) washout (gray columns). Each column represents the means from 10–20 cells. Recordings were made from slices of wild-type and mGluR5-KO (m5KO) mice. Recordings from slices of wild-type mice were made under control conditions and after treatments with AP-5 (100 μm) and MPEP (50 μm) as indicated. The drugs were applied 30 min before and subsequently throughout the 1 hr bicuculline incubation. All experiments were performed at a holding potential of –70 mV, except for the positive IPSCs, which were recorded at –40 mV. The IPSCs recorded at –70 mV were pharmacologically isolated by adding AP-5 (100 μm) and NBQX (10 μm); recording electrodes filled with KCl-based solution were used (see Materials and Methods). Their GABAergic identity was confirmed by the application of bicuculline (20 μm) at the end of the recordings. Notice the lack of persistent effects of bicuculline on IPSCs recorded under both conditions and significant effects on EPSC amplitudes (*p < 0.05; ANOVA test).
Table 2.
Characteristics of spontaneous EPSCs recorded from CA3 pyramidal cells and interneurons before bicuculline application was started (before bicuculline) or 3 hr after beginning its washout (after bicuculline)
|
Treatment |
CA3 pyramidal cells |
CA3 interneurons |
||||||||||||
|---|---|---|---|---|---|---|---|---|---|---|---|---|---|---|
|
|
Amplitude (pA)
|
Rise time (msec)
|
Decay time (msec)
|
n
|
Amplitude (pA)
|
Rise time (msec)
|
Decay time (msec)
|
n
|
||||||
| Wild type (WT) | ||||||||||||||
| Before bicuculline | 25 ± 2 | 2.2 ± 0.3 | 7.6 ± 1.4 | 30 | 40 ± 6 | 1.3 ± 0.2 | 3.3 ± 0.2 | 30 | ||||||
| After bicuculline | *39 ± 2 | 2.1 ± 0.4 | 6.7 ± 1.1 | 21 | *21 ± 3 | 1.2 ± 0.4 | 4.3 ± 0.9 | 19 | ||||||
| mGluR5 K0 | ||||||||||||||
| Before bicuculline | 26 ± 4 | 2.1 ± 0.3 | 6.5 ± 1.3 | 15 | 34 ± 3 | 1.5 ± 0.2 | 4.5 ± 0.9 | 18 | ||||||
| After bicuculline | 23 ± 3 | 2.3 ± 0.9 | 6.8 ± 0.9 | 13 | 36 ± 3 | 1.1 ± 0.5 | 4 ± 0.4 | 17 | ||||||
| WT + MPEP | ||||||||||||||
| Before bicuculline | 27 ± 5 | 2.2 ± 0.4 | 6.7 ± 1.3 | 17 | 39 ± 3 | 1.3 ± 0.3 | 3.4 ± 0.4 | 15 | ||||||
| After bicuculline | 26 ± 3 | 2.4 ± 0.5 | 6.5 ± 1.4 | 15 | 38 ± 2 | 1.4 ± 0.2 | 3.5 ± 0.5 | 11 | ||||||
| WT + AP-5 | ||||||||||||||
| Before bicuculline | 27 ± 5 | 2.2 ± 0.8 | 5.2 ± 1.4 | 14 | 37 ± 4 | 1.4 ± 0.6 | 2.8 ± 0.5 | 13 | ||||||
| After bicuculline
|
28 ± 3
|
2.4 ± 0.7
|
4.7 ± 1.1
|
12
|
38 ± 3
|
1.3 ± 0.9
|
2.5 ± 0.4
|
10
|
||||||
Incubations with MPEP and AP-5 were started 30 min before bicuculline application until bicuculline washout. Mean values ± SEM are given. Asterisks indicate significant differences (ANOVA; *p < 0.05) compared with wild type before bicuculline. n indicates number of cells.
However, the amplitudes of EPSCs recorded at 3 hr after bicuculline washout increased in pyramidal cells and decreased in interneurons ∼50% of control in pyramidal cells and decreased to approximately one-half of their initial amplitude in interneurons (Table 2). We also measured IPSCs in the pyramidal cells at –40 mV, which appeared as upward inflections at this holding potential. The average interval between these currents was 10.3 ± 3.1 sec and the average amplitude was 11.7 ± 2.2 pA (n = 21 neurons). Neither the amplitude distributions (Fig. 6C, positive values) nor the mean amplitudes changed after a 3 hr bicuculline washout (Fig. 6E, positive values). Neither of the postsynaptic response characteristics depended on the time of the response relative to the interictal bursts.
In another series of experiments, we measured pharmacologically isolated spontaneous IPSCs under conditions when glutamatergic synaptic transmission was blocked by an addition of AP-5 (100 μm) and NBQX (10 μm). The blockers were added to the ACSF either before or 3 hr after bicuculline application. KCH3SO3 in the patch pipette was replaced with KCl (see Materials and Methods). This allowed a measurement of these currents at a holding potential of –70 mV and provided a better signal-to-noise ratio and improved IPSC detection. The mean average IPSC amplitude in the control was 35.9 ± 3.9 pA and the mean interval between IPSCs was 0.5 ± 0.2 sec (n = 10 neurons). However, 1 hr bicuculline incubation also had no statistically significant effect on the average amplitudes of these pharmacologically isolated IPSCs. After a 3 hr bicuculline washout, the mean amplitude was 32.8 ± 2.6 pA and the mean interval was 0.6 ± 0.2 sec, also demonstrating that the long-term effects of bicuculline application are specifically related to changes in the excitatory rather than inhibitory circuitry (Fig. 6E, negative values). Together, these findings indicate that the effect of bicuculline treatment on the synaptic circuitry in the CA3 region is twofold, namely, a persistent increase in the excitatory drive on pyramidal cells and a persistent decrease in the excitatory drive on interneurons.
The activation of mGlu5 and NMDA receptors appeared necessary also for the observed changes in EPSC amplitudes. To establish the involvement of mGluR5, we measured the amplitudes of spontaneous EPSCs in both pyramidal cells and interneurons recorded in slices from mGluR5-KO mice. Before bicuculline application, there were no significant differences in the EPSC amplitude, rise time, decay time, and intervals compared with respective values obtained from wild-type slices (Table 2). However, in the slices from mGluR5-KO mice in distinction from the wild-type slices, no significant changes in EPSC amplitudes occurred 3 hr after bicuculline washout. Moreover, no significant changes could be seen in slices obtained from wild-type mice but incubated either with MPEP or AP-5 during bicuculline application (Fig. 6E,F). These findings suggest that both NMDA and mGlu5 receptors are essential for the induction of the permanent changes in the synaptic drives provoked by bicuculline application.
Minimal stimulation reveals changes in recurrent collateral input
To determine which pathways are responsible for the observed changes in the amplitudes of spontaneous EPSCs, we performed a series of experiments with stimulation of two different pathways. The minimal stimulation protocol (Raastad, 1995) was used (see Materials and Methods). Whole-cell patch-clamp recordings were made from CA3 pyramidal cells and interneurons, whereas stimulation was given to either the commissural–associative pathway (recurrent collateral) or the mossy fiber pathway (Fig. 7A). Specificity of the pathway stimulation was verified by comparison of the EPSC kinetics (Henze et al., 2000; our observations) and by the addition of the type II mGluR agonist DCG-IV (1 μm) (data not shown), which is known to block mossy fiber-evoked responses (Kamiya et al., 1996; Maccaferri et al., 1998).
Minimal stimulation was first established in the different pathways by varying stimulus intensities in such a way that measurable responses (successes) (Fig. 7C) showed no changes in amplitudes over changes in stimulus intensities of 5% (Fig. 7B). This corresponded to 40–50% failure rates as illustrated in the amplitude distribution (Fig. 7D) (n = 100 trials at 0.1 Hz). In most experiments, stimulus intensities were therefore chosen at the level that corresponded to failure rates of 40–50%, from which point the stimulus intensity was varied in both directions to verify that indeed no significant changes in failure rate or amplitude resulted from small changes in intensity. Post hoc analysis showed that these values did not vary as a function of the time of their occurrence relative to the interictal bursts. Figure 7C shows several example traces that resulted from minimal stimulation of the recurrent collateral pathway. It shows one sweep with response failure and four with successes. The response latency was stable within <1 msec in each cell. It ranged from 2 to 7 msec for different cells with most typical values of 3–4 msec (Fig. 7C). Successes were used for kinetic analysis and amplitude measurements. The mean rise and decay times were 2.9 ± 0.5 and 9.6 ± 1.1 msec (n = 19), respectively, after recurrent collateral stimulation and 1.6 ± 0.2 and 5.8 ± 0.9 msec (n = 10) after mossy fiber stimulation.
The mean amplitudes of the minimal EPSCs recorded from the pyramidal cells are shown in Figure 7E. On average, they were not significantly different for EPSCs evoked by the mossy fiber or recurrent collateral stimulation. However, after bicuculline application and its 3 hr washout, mossy fiber EPSCs showed no significant amplitude change, whereas the amplitudes of collateral fiber EPSCs significantly increased (from 22 ± 3 to 29 ± 4 pA; p < 0.05; n = 19 cells before and 17 cells after bicuculline application) (Fig. 7E). No changes in EPSC amplitudes were found in slices pretreated with either AP-5 or MPEP, or in slices from mGluR5-KO animals (Fig. 7E).
The same positions of the electrodes were used to evoke minimal responses from CA3 interneurons (Fig. 7A). In the interneurons, the amplitudes of the EPSCs resulting from recurrent collateral stimulation were also not significantly different from those after mossy fiber stimulation (Fig. 7F). Three hours after bicuculline washout, the mean amplitudes of the mossy fiber EPSCs did not change (Fig. 7F), whereas the EPSCs evoked by recurrent collateral stimulation significantly decreased (from 33 ± 4 to 19 ± 4 pA; p < 0.05; n = 21 neurons from 10 slices). This decrease was prevented by treatments with AP-5 or MPEP, and it was also absent in slices from mGluR5-KO animals (Fig. 7F). Together, these findings suggest that opposite changes in the synaptic inputs from recurrent collaterals to the pyramidal cells and interneurons underlie the maintenance of the bicuculline-induced persistent bursting activity.
Discussion
The main findings of this study are threefold: (1) a persistent interictal-like bursting that originates in the CA3 region of the ventral hippocampus and spreads to the entorhinal cortex can be induced by a period of 1 hr bicuculline-mediated disinhibition, (2) underlying induction mechanisms are similar to those typically implicated in long-term synaptic plasticity involving NMDA and mGlu5 receptor activation and protein synthesis, and (3) these changes are accompanied by increases in the excitatory synaptic input from recurrent collaterals to CA3 pyramidal cells and decreases in recurrent collateral input to CA3 interneurons.
Specific mechanisms underlie persistent burst induction
Previous experimental and modeling studies have described interictal-like bursting in the hippocampal slice preparation under continued GABAA receptor blockade (Miles and Wong, 1983, 1987). Under these conditions, disinhibition of recurrent excitatory circuitry in the CA3 region leads to the generation of synchronized bursts through the activation of recurrent excitatory synapses on pyramidal cells and interneurons (for review, see Traub and Jefferys, 1994). We show here that a 1 hr bicuculline application and ensuing interictal-like bursting lead to a persistent bursting activity in the ventral hippocampus that continues after bicuculline washout for as long as we could measure (8 hr) and is accompanied by specific changes in synaptic transmission. Several findings suggest that this persistence is not caused by the presence of residual bicuculline. First, an immediate decrease in burst duration was seen after the start of bicuculline washout (Fig. 2B). Second, pharmacologically isolated monosynaptic IP-SPs that were recorded from CA3 pyramidal cells showed full recovery 1–2 hr after bicuculline washout (Fig. 2A). Third, shorter (15 min) incubations with bicuculline that still provoked a complete bursting activity (indicating full bicuculline penetration) did not lead to persistent bursting (Fig. 3B). Finally, bursting activity in slices pretreated with pharmacological blockers (NMDA, mGlu5 receptor antagonists, and protein synthesis inhibitors) or taken from mGluR5 knock-out mice came to an arrest within 1–2 hr after bicuculline washout (Figs. 3, 4, 5).
Our findings point to specific changes that underlie the persistent bursting. These changes are restricted to the CA3 region (Fig. 2C) and associated with a modified input from recurrent collaterals on CA3 pyramidal cells and interneurons (Figs. 6, 7).
Synaptic strength of CA3 recurrent collaterals affected by bicuculline-induced inhibition
Previous studies have shown that the presence of bicuculline facilitates LTP induction (Wigstrom and Gustafsson, 1983; Bliss and Collingridge, 1993). The induction conditions and underlying synaptic changes that we found are analogous in some respects to those found for LTP induction and maintenance (Bliss and Collingridge, 1993). Rapid strengthening of CA3 pyramidal cell synapses may occur after short electrical stimulation of the recurrent collateral pathway (Zalutsky and Nicoll, 1990). However, the present model has advantages over the LTP paradigm as it studies the mechanisms of long-lasting synaptic plasticity induced by intrinsic (albeit pathological) activity of a neuronal network rather than by strong artificial challenges (Buzsaki et al., 1987; Schneiderman, 1997; Bains et al., 1999; Dobrunz and Stevens, 1999).
It is of interest that manipulations affecting the afterdischarges in the same preparation, namely NMDA receptor block (Traub and Jefferys, 1994) and cycloheximide administration (Ogata, 1977), prevented the persistent bursting (Figs. 3, 4). NMDA receptor activation seems to be necessary only during bicuculline incubation, because AP-5 application after bicuculline did not prevent persistent bursting. In both cases, AP-5 application caused an increase in bursting frequency, an effect that has been observed previously (Neuman et al., 1988; Stoop and Pralong, 2000) and could reflect the inverse relationship between burst duration and frequency (Tancredi and Avoli, 1987).
Rapid strengthening of CA3 pyramidal cell synapses after electrical stimulation of the recurrent collateral pathway is known to be NMDA receptor dependent (Zalutsky and Nicoll, 1990) and may also be induced by kainic acid- or potassium-provoked bursts (Ben-Ari and Gho, 1988; Bains et al., 1999). LTP induction in the collateral pathway depends on the precise time interval between the presynaptic stimulus and postsynaptic depolarization (Magee and Johnston, 1997; Markram et al., 1997; Debanne et al., 1998; Laezza et al., 1999). It is possible that the afterdischarges that appear at regular intervals are important for the precise timing of the voltage-dependent and NMDA receptor-mediated Ca2+ influx in specific synaptic contacts (Traub and Jefferys, 1994) that are essential for the induction of synaptic plasticity and persistent bursting.
To our knowledge, we show for the first time an involvement of mGluR5 in the plasticity of synapses between CA3 pyramidal cells (cf. Lu et al., 1997). This receptor is expressed in dendrites of CA3 pyramidal cells (Shigemoto et al., 1997) and has also been found to interact directly with NMDA receptors (Lüthi et al., 1994; Fitzjohn et al., 1996). Although activation of group I metabotropic glutamate receptors (mGluR1 and mGluR5) may affect bursting activity (Merlin and Wong, 1997; Rutecki and Yang, 1997; Chuang et al., 2001; Lee et al., 2002; Merlin 2002), we found no immediate effects of mGluR5 blockade on burst characteristics (Fig. 5). Merlin et al. (1998) and Galoyan and Merlin (2000) found that prolonged (100 min) activation of group I metabotropic glutamate receptors can produce a persistent increase in burst duration, which depends on protein synthesis but not NMDA receptor activation. It is possible that mGluR5 indirectly affects changes in synaptic plasticity through a slower acting signaling pathway (e.g., through activation of hippocampal glial cells) (Aronica et al., 2000; Haydon, 2001). However, none of the above findings indicate a direct interaction between mGlu5 and NMDA receptors in their effects on interictal-like burst behavior.
Changes in recurrent collateral input on interneurons
Our recordings showed a reduction of excitatory input to hippocampal interneurons (Fig. 6), lending support to specific synaptic plasticity at these cells (McBain and Maccaferri, 1997). Persistent bursting was expressed in the isolated CA3 region (Fig. 2C), and the results from the minimal stimulation experiments (Fig. 7) indicate changes in synaptic plasticity of recurrent collateral input to CA3 interneurons, rather than synaptic plasticity at dentate gyrus interneurons (Kapur and Macdonald, 1997; Doherty and Dingledine, 2001) or changes in the inhibitory synapses on pyramidal cells (Fig. 6E). We cannot exclude a reduction in inhibition attributable to a loss of inhibitory neurons. However, interneurons can be fully preserved in epileptic tissue (Babb et al., 1989; Sloviter, 1989), and we found obvious changes in neither the number of interneurons under infrared microscopic inspection (data not shown) nor the inhibitory input to pyramidal cells (Fig. 6E).
Synaptic plasticity of excitatory input to hippocampal interneurons has become a recent focus of attention (McBain et al., 1999). Although LTP has not been consistently found at these synapses, “interneuron long-term depression” was observed after high frequency activation of excitatory synapses on basket cells (McMahon and Kauer, 1997). The location of the interneurons from which we recorded (close to stratum pyramidale) and their high-frequency firing pattern after current injection are characteristic features of basket cells. These cells mediate the synchronous firing of many pyramidal cells (Cobb et al., 1995), and changes in their innervation may contribute to hippocampal disinhibition during epilepsy (McMahon and Kauer, 1997). Our findings may therefore be related to animal models of epilepsy in which basket cells remain viable and can release GABA but are functionally denervated or “dormant” (Sloviter, 1987).
Implications for epilepsy in vivo
The changes that we observed in the hippocampus may represent a specific adaptive response to extensive bursting activity during bicuculline application and may be part of a more general mechanism through which interictal activity develops during temporal lobe pathology (Avoli, 2001; de Curtis et al., 2001). In the intact horizontal slice preparation, the persistent bursting in the hippocampal region spreads to and controls the bursting activity in the entorhinal cortex for as long as we could measure (Fig. 2A). It has been shown in other models of epilepsy that bursts in the entorhinal cortex are under direct control of hippocampal interictal-like activity (Barbarosie and Avoli, 1997). If indeed such activity may be applied to control bursting activity in adjacent regions in the temporal lobe of epileptic patients (Avoli, 2001), our experimental paradigm may serve as a basis for the development of pharmacological tools to control epileptiform activity.
However, our principal finding is that an endogenous activity associated with the epileptic pathology can lead to specific changes in synaptic transmission and a persistent epileptiform bursting activity in vitro. Additional studies could be aimed at more precise analysis of the synaptic mechanisms underlying the modifications in recurrent connections on CA3 pyramidal cells and interneurons. A priori, they can be attributable to activity-dependent scaling of quantal amplitude (Van der Kloot, 1991; Turrigiano et al., 1998), appearance of additional clusters of glutamate receptors (Malinow and Malenka, 2002), or increased transmitter release (Stevens, 1993; Voronin, 1993; Sokolov et al., 2002). At the same time, such studies could address the relationship between the efficiency of endogenous epileptiform activity and stimulation protocols that are more usually applied to induce synaptic changes (Dobrunz and Stevens, 1999). Such findings could indicate how initial transient epileptiform bursts could lead to progressive changes associated with epilepsy and provide new leads on how to prevent or modify such changes in the treatment of epileptic pathologies.
Footnotes
This work was supported by INTAS and the Wellcome Trust. We thank Drs. Marie-Christine Broillet, Peter Clarke, Muming Poo, and Egbert Welker for their comments on this manuscript, and Daniel Huber for technical assistance.
Correspondence should be addressed to Ron Stoop, Institute of Cellular Biology and Morphology, University of Lausanne, Rue du Bugnon 9, CH-1005 Lausanne, Switzerland. E-mail: rstoop@ibcm.unil.ch.
F. Conquet's present address: Addex Pharmaceuticals, 1228 Plan-les-Ouates, Geneva, Switzerland.
Copyright © 2003 Society for Neuroscience 0270-6474/03/235634-11$15.00/0
References
- Aronica E, van Vliet EA, Mayboroda OA, Troost D, da Silva FH, Gorter JA ( 2000) Upregulation of metabotropic glutamate receptor subtype mGluR3 and mGluR5 in reactive astrocytes in a rat model of mesial temporal lobe epilepsy. Eur J Neurosci 12: 2333–2344. [DOI] [PubMed] [Google Scholar]
- Avoli M ( 2001) Do interictal discharges promote or control seizures? Experimental evidence from an in vitro model of epileptiform discharge. Epilepsia 42: 2–4. [DOI] [PubMed] [Google Scholar]
- Babb TL, Pretorius JK, Kupfer WR, Crandall PH ( 1989) Glutamate decarboxylase-immunoreactive neurons are preserved in human epileptic hippocampus. J Neurosci 9: 2562–2574. [DOI] [PMC free article] [PubMed] [Google Scholar]
- Bains JS, Longacher JM, Staley KJ ( 1999) Reciprocal interactions between CA3 network activity and strength of recurrent collateral synapses. Nat Neurosci 2: 720–726. [DOI] [PubMed] [Google Scholar]
- Barbarosie M, Avoli M ( 1997) CA3-driven hippocampal-entorhinal loop controls rather than sustains in vitro limbic seizures. J Neurosci 17: 9308–9314. [DOI] [PMC free article] [PubMed] [Google Scholar]
- Ben-Ari Y, Gho M ( 1988) Long-lasting modification of the synaptic properties of rat CA3 hippocampal neurones induced by kainic acid. J Physiol (Lond) 404: 365–384. [DOI] [PMC free article] [PubMed] [Google Scholar]
- Bliss TV, Collingridge GL ( 1993) A synaptic model of memory: long-term potentiation in the hippocampus. Nature 361: 31–39. [DOI] [PubMed] [Google Scholar]
- Buzsaki G, Haas HL, Anderson EG ( 1987) Long-term potentiation induced by physiologically relevant stimulus patterns. Brain Res 435: 331–333. [DOI] [PubMed] [Google Scholar]
- Cascino GD Trenerry MR, So EL, Sharbrough FW, Shin C, Lagerlund TD, Zupanc ML, Jack Jr CR ( 1996) Routine EEG and temporal lobe epilepsy: relation to long-term EEG monitoring, quantitative MRI, and operative outcome. Epilepsia 37: 651–656. [DOI] [PubMed] [Google Scholar]
- Chiamulera C, Epping-Jordan MP, Zocchi A, Marcon C, Cottiny C, Tacconi S, Corsi M, Orzi F, Conquet F ( 2001) Reinforcing and locomotor stimulant effects of cocaine are absent in mGluR5 null mutant mice. Nat Neurosci 4: 873–874. [DOI] [PubMed] [Google Scholar]
- Chuang SC, Bianchi R, Kim D, Shin HS, Wong RK ( 2001) Group I metabotropic glutamate receptors elicit epileptiform discharges in the hippocampus through PLCbeta1 signaling. J Neurosci 21: 6387–6394. [DOI] [PMC free article] [PubMed] [Google Scholar]
- Cobb SR, Buhl EH, Halasy K, Paulsen O, Somogyi P ( 1995) Synchronization of neuronal activity in hippocampus by individual GABAergic interneurons. Nature 378: 75–78. [DOI] [PubMed] [Google Scholar]
- Conquet F, Bashir ZI, Davies CH, Daniel H, Ferraguti F, Bordi F, Franz-Bacon K, Reggiani A, Matarese V, Conde F ( 1994) Motor deficit and impairment of synaptic plasticity in mice lacking mGluR1. Nature 372: 237–243. [DOI] [PubMed] [Google Scholar]
- Debanne D, Gahwiler BH, Thompson SM ( 1998) Long-term synaptic plasticity between pairs of individual CA3 pyramidal cells in rat hippocampal slice cultures. J Physiol (Lond) 507: 237–247. [DOI] [PMC free article] [PubMed] [Google Scholar]
- de Curtis M, Librizzi L, Biella G ( 2001) Discharge threshold is enhanced for several seconds after a single interictal spike in a model of focal epileptogenesis. Eur J Neurosci 14: 174–178. [DOI] [PubMed] [Google Scholar]
- Dobrunz LE, Stevens CF ( 1999) Response of hippocampal synapses to natural stimulation patterns. Neuron 22: 157–166. [DOI] [PubMed] [Google Scholar]
- Doherty J, Dingledine R ( 2001) Reduced excitatory drive onto interneurons in the dentate gyrus after status epilepticus. J Neurosci 21: 2048–2057. [DOI] [PMC free article] [PubMed] [Google Scholar]
- Fitzjohn SM, Irving AJ, Palmer MJ, Harvey J, Lodge D, Collingridge GL ( 1996) Activation of group I mGluRs potentiates NMDA responses in rat hippocampal slices. Neurosci Lett 203: 211–213. [DOI] [PubMed] [Google Scholar]
- Galoyan SM, Merlin LR ( 2000) Long-lasting potentiation of epileptiform bursts by group I mGluRs is NMDA receptor independent. J Neurophysiol 83: 2463–2467. [DOI] [PubMed] [Google Scholar]
- Gasparini F, Lingenhohl K, Stoehr N, Flor PJ, Heinrich M, Vranesic I, Biollaz M, Allgeier H, Heckendorn R, Urwyler S, Varney MA, Johnson EC, Hess SD, Rao SP, Sacaan AI, Santori EM, Velicelebi G, Kuhn R ( 1999) 2-Methyl-6-(phenylethynyl)-pyridine (MPEP), a potent selective and systemically active mGlu5 receptor antagonist. Neuropharmacology 38: 1493–1503. [DOI] [PubMed] [Google Scholar]
- Gomez-Di Cesare CM, Smith KL, Rice FL, Swann JW ( 1997) Axonal remodeling during postnatal maturation of CA3 hippocampal pyramidal neurons. J Comp Neurol 384: 165–180. [PubMed] [Google Scholar]
- Haydon PG ( 2001) Glia: listening and talking to the synapse. Nat Rev Neurosci 2: 185–193. [DOI] [PubMed] [Google Scholar]
- Henze DA, Urban NN, Barrionuevo G ( 2000) The multifarious hippocampal mossy fiber pathway: a review. Neuroscience 98: 407–427. [DOI] [PubMed] [Google Scholar]
- Holmes MD, Dodrill CB, Ojemann LM, Ojemann GA ( 1996) Five-year outcome after epilepsy surgery in nonmonitored and monitored surgical candidates. Epilepsia 37: 748–752. [DOI] [PubMed] [Google Scholar]
- Ishizuka N, Weber J, Amaral DG ( 1990) Organization of intrahippocampal projections originating from CA3 pyramidal cells in the rat. J Comp Neurol 295: 580–623. [DOI] [PubMed] [Google Scholar]
- Kamiya H, Shinozaki H, Yamamoto C ( 1996) Activation of metabotropic glutamate receptor type 2/3 suppresses transmission at rat hippocampal mossy fibre synapses. J Physiol (Lond) 493: 447–455. [DOI] [PMC free article] [PubMed] [Google Scholar]
- Kapur J, Macdonald RL ( 1997) Rapid seizure-induced reduction of benzodiazepine and Zn 2+ sensitivity of hippocampal dentate granule cell GABAA receptors. J Neurosci 17: 7532–7540. [DOI] [PMC free article] [PubMed] [Google Scholar]
- Laezza F, Doherty JJ, Dingledine R ( 1999) Long-term depression in hippocampal interneurons: joint requirement for pre- and postsynaptic events. Science 285: 1411–1414. [DOI] [PubMed] [Google Scholar]
- Lee AC, Wong RKS, Chuang SC, Shin HS, Bianchi R ( 2002) Role of synaptic metabotropic glutamate receptors in epileptiform discharges in hippocampal slices. J Neurophysiol 88: 1625–1633. [DOI] [PubMed] [Google Scholar]
- Lu YM, Jia Z, Janus C, Henderson JT, Gerlai R, Wojtowicz JM, Roder JC ( 1997) Mice lacking metabotropic glutamate receptor 5 show impaired learning and reduced CA1 long-term potentiation (LTP) but normal CA3 LTP. J Neurosci 17: 5196–5205. [DOI] [PMC free article] [PubMed] [Google Scholar]
- Lüthi A, Gahwiler BH, Gerber U ( 1994) Potentiation of a metabotropic glutamatergic response following NMDA receptor activation in rat hippocampus. Pflügers Arch 427: 197–202. [DOI] [PubMed] [Google Scholar]
- Maccaferri G, Toth K, McBain CJ ( 1998) Target-specific expression of presynaptic mossy fiber plasticity. Science 279: 1368–1370. [DOI] [PubMed] [Google Scholar]
- Magee JC, Johnston D ( 1997) A synaptically controlled associative signal for Hebbian plasticity in hippocampal neurons. Science 275: 209–213. [DOI] [PubMed] [Google Scholar]
- Malinow R, Malenka RC ( 2002) AMPA receptor trafficking and synaptic plasticity. Annu Rev Neurosci 25: 103–126. [DOI] [PubMed] [Google Scholar]
- Markram H, Lubke J, Frotscher M, Sakmann B ( 1997) Regulation of synaptic efficacy by coincidence of postsynaptic APs and EPSPs. Science 275: 213–215. [DOI] [PubMed] [Google Scholar]
- McBain CJ, Maccaferri G ( 1997) Synaptic plasticity in hippocampal interneurons? A commentary. Can J Physiol Pharmacol 75: 488–494. [PubMed] [Google Scholar]
- McBain CJ, Freund TF, Mody I ( 1999) Glutamatergic synapses onto hippocampal interneurons: precision timing without lasting plasticity. Trends Neurosci 22: 228–235. [DOI] [PubMed] [Google Scholar]
- McEwen BS ( 2001) Plasticity of the hippocampus: adaptation to chronic stress and allostatic load. Ann NY Acad Sci 933: 265–277. [DOI] [PubMed] [Google Scholar]
- McMahon LL, Kauer JA ( 1997) Hippocampal interneurons express a novel form of synaptic plasticity. Neuron 18: 295–305. [DOI] [PubMed] [Google Scholar]
- Merlin LR ( 2002) Differential roles for mGluR1 and mGluR5 in the persistent prolongation of epileptiform bursts. J Neurophysiol 87: 621–625. [DOI] [PubMed] [Google Scholar]
- Merlin LR, Wong RK ( 1997) Role of group I metabotropic glutamate receptors in the patterning of epileptiform activities in vitro J Neurophysiol 78: 539–544. [DOI] [PubMed] [Google Scholar]
- Merlin LR, Bergold PJ, Wong RK ( 1998) Requirement of protein synthesis for group I mGluR-mediated induction of epileptiform discharges. J Neurophysiol 80: 989–993. [DOI] [PubMed] [Google Scholar]
- Miles R, Wong RK ( 1983) Single neurones can initiate synchronized population discharge in the hippocampus. Nature 306: 371–373. [DOI] [PubMed] [Google Scholar]
- Miles R, Wong RK ( 1986) Excitatory synaptic interactions between CA3 neurones in the guinea-pig hippocampus. J Physiol (Lond) 373: 397–418. [DOI] [PMC free article] [PubMed] [Google Scholar]
- Miles R, Wong RK ( 1987) Inhibitory control of local excitatory circuits in the guinea-pig hippocampus. J Physiol (Lond) 388: 611–629. [DOI] [PMC free article] [PubMed] [Google Scholar]
- Neuman R, Cherubini E, Ben-Ari Y ( 1988) Epileptiform bursts elicited in CA3 hippocampal neurons by a variety of convulsants are not blocked by N-methyl-d-aspartate antagonists. Brain Res 459: 265–274. [DOI] [PubMed] [Google Scholar]
- Ogata N ( 1977) Effects of cycloheximide on experimental epilepsy induced by daily amygdaloid stimulation in rabbits. Epilepsia 18: 101–108. [DOI] [PubMed] [Google Scholar]
- Raastad M ( 1995) Extracellular activation of unitary excitatory synapses between hippocampal CA3 and CA1 pyramidal cells. Eur J Neurosci 7: 1882–1888. [DOI] [PubMed] [Google Scholar]
- Ralston BL ( 1958) The mechanism of transition of interictal spiking foci into ictal seizure discharges. Electroencephalogr Clin Neurophysiol 10: 217–232. [DOI] [PubMed] [Google Scholar]
- Rutecki PA, Yang Y ( 1997) Metabotropic glutamate receptor activation modulates epileptiform activity in the hippocampus. Neuroscience 81: 927–935. [DOI] [PubMed] [Google Scholar]
- Schneiderman JH ( 1997) The role of long-term potentiation in persistent epileptiform burst-induced hyperexcitability following GABA(A) receptor blockade. Neuroscience 81: 1111–1122. [DOI] [PubMed] [Google Scholar]
- Shigemoto R, Kinoshita A, Wada E, Nomura S, Ohishi H, Takada M, Flor PJ, Neki A, Abe T, Nakanishi S, Mizuno N ( 1997) Differential presynaptic localization of metabotropic glutamate receptor subtypes in the rat hippocampus. J Neurosci 17: 7503–7522. [DOI] [PMC free article] [PubMed] [Google Scholar]
- Sloviter RS ( 1987) Decreased hippocampal inhibition and a selective loss of interneurons in experimental epilepsy. Science 235: 73–76. [DOI] [PubMed] [Google Scholar]
- Sloviter RS ( 1989) Calcium-binding protein (calbindin-D28k) and parvalbumin immunocytochemistry: localization in the rat hippocampus with specific reference to the selective vulnerability of hippocampal neurons to seizure activity. J Comp Neurol 280: 183–196. [DOI] [PubMed] [Google Scholar]
- Sokolov MV, Rossokhin AV, Astrelin AV, Frey JU, Voronin LL ( 2002) Quantal analysis suggests a strong involvement of presynaptic mechanisms during the initial 3 h maintenance of long-term potentiation in rat hippocampal CA1 area in vitro Brain Res 957: 61–75. [DOI] [PubMed] [Google Scholar]
- Stevens CF ( 1993) Quantal release of neurotransmitter and long-term potentiation. Cell [Suppl] 70: 55–63. [DOI] [PubMed] [Google Scholar]
- Stoop R, Pralong E ( 2000) Functional connections and epileptic spread between hippocampus, entorhinal cortex and amygdala in a modified horizontal slice preparation of the rat brain. Eur J Neurosci 12: 3651–3663. [DOI] [PubMed] [Google Scholar]
- Tancredi V, Avoli M ( 1987) Control of spontaneous epileptiform discharges by extracellular potassium: an in vitro study in the CA1 subfield of the hippocampal slice. Exp Brain Res 67: 363–372. [DOI] [PubMed] [Google Scholar]
- Traub RD, Jefferys JG ( 1994) Simulations of epileptiform activity in the hippocampal CA3 region in vitro Hippocampus 4: 281–285. [DOI] [PubMed] [Google Scholar]
- Turrigiano GG, Leslie KR, Desai NS, Rutherford LC, Nelson SB ( 1998) Activity-dependent scaling of quantal amplitude in neocortical neurons. Nature 391: 892–896. [DOI] [PubMed] [Google Scholar]
- Wigstrom H, Gustafsson B ( 1983) Facilitated induction of hippocampal long-lastin potentiation during blockade of inhibition. Nature 301: 603–604. [DOI] [PubMed] [Google Scholar]
- Van der Kloot W ( 1991) The regulation of quantal size. Prog Neurobiol 36: 93–130. [DOI] [PubMed] [Google Scholar]
- van Hooft JA, Giuffrida R, Blatow M, Monyer H ( 2000) Differential expression of group I metabotropic glutamate receptors in functionally distinct hippocampal interneurons. J Neurosci 20: 3544–3551. [DOI] [PMC free article] [PubMed] [Google Scholar]
- Voronin LL ( 1993) On the quantal analysis of hippocampal long-term potentiation and related phenomena of synaptic plasticity. Neuroscience 56: 275–304. [DOI] [PubMed] [Google Scholar]
- Zalutsky RA, Nicoll RA ( 1990) Comparison of two forms of long-term potentiation in single hippocampal neurons. Science 248: 1619–1624. [DOI] [PubMed] [Google Scholar]