

Abstract
Depolarization-induced suppression of inhibition (DSI) is a retrograde form of synaptic inhibition involving the Ca2+-dependent release of cannabinoids from the postsynaptic cell. DSI exerts multiple effects on presynaptic neurons: here, we establish the breakdown of DSI in its individual components at the synapses between basket and stellate cells and Purkinje cells. In the presence of tetrodotoxin, the change in IPSC frequency entirely accounted for the decrease of transmission during DSI; in contrast, without tetrodotoxin, the reductions of frequency and average amplitude gave equal contributions. In paired recordings, transmission displayed an irreversible rundown unless interneurons were recorded from with the perforated patch method. Under these conditions, a DSI of 68.8% was measured; the failure rate and the paired pulse ratio (at 20 msec intervals) increased from 1.2 to 20.2 and 95.6 to 132.6%, respectively, and the variance to mean ratio augmented 2.17-fold. Presynaptic dialysis with Cs+ led to a major potentiation of synaptic strength and to a marked reduction of DSI with respect to control potassium conditions; DSI recovered only partially when decreasing the extracellular Ca2+ concentration to match the control IPSC amplitudes. These results, combined with those of Kreitzer et al. (2002), indicate that three distinct presynaptic processes contribute to DSI: reductions of miniature frequency (13.4% of total DSI), of presynaptic action potential frequency (23.2%), and of the probability that presynaptic depolarizations elicit transmitter release (63.4%). The latter component involves a modulation of K+ channels and trial-to-trial modifications of the presynaptic signal.
Keywords: DSI in various components, paired recordings, perforated patch, GABAergic interneurons, retrograde communication, cerebellum
Introduction
Depolarization-induced suppression of inhibition (DSI) is a form of short-term synaptic plasticity that involves the calcium-dependent release of a retrograde messenger on postsynaptic depolarization (Llano et al., 1991; Pitler and Alger, 1992, 1994; Vincent et al., 1992). DSI is observed with similar properties in cerebellar Purkinje cells and in hippocampal CA1 pyramidal cells. In both instances, the modulated synaptic currents are IPSCs originating in interneurons (stellate and basket cells in the cerebellum). DSI does not appear to involve modifications of postsynaptic receptors (Llano et al., 1991; Pitler and Alger, 1992) but, rather, a decrease in the amount of released neurotransmitter (Vincent et al., 1992; Alger et al., 1996).
Recent results indicate that both hippocampal and cerebellar DSI are mediated by the release of endogenous cannabinoids from the postsynaptic cell and by the consequent activation of cannabinoid receptors of the cannabinoid 1 receptor (CB1R) subtype in the presynaptic terminals (Wilson and Nicoll, 2001; Kreitzer and Regehr, 2001; Diana et al., 2002; Yoshida et al., 2002). In various preparations, CB1Rs are known to modify adenylate cyclase as well as a host of K+- and Ca2+-selective channels (Ameri, 1999). However, the exact mode of action of CB1Rs during DSI remains elusive.
The results of previous studies have indicated that, during cerebellar DSI, several distinct processes contribute to reduce the release from GABAergic terminals: (1) the frequency of miniature IPSCs (mIPSCs) decreases, which indicates a direct effect on exocytosis, because an mIPSC frequency is not altered by blockers of voltage-dependent Ca2+ channels (Llano et al., 2000); (2) the rate of firing of presynaptic cells decreases, apparently because of the modulation of a K+ current (Kreitzer et al., 2002), and this could account for the lateral spread of DSI in the molecular layer (Vincent and Marty, 1993); and (3) the Ca2+ transient amplitude measured at presynaptic release sites in response to short trains of action potentials decreases during DSI (Diana et al., 2002), possibly because of a modulation of voltage-dependent Ca2+ channels (Wilson et al., 2001). All of these effects are attributable to the activation of presynaptic CB1Rs, and they occur at least approximately within the same period. However, the specific share of each of these processes in the overall inhibition is unknown.
To sort out the role of these various components, we have reinvestigated the amount and time course of cerebellar DSI in various experimental conditions. One limitation of previous DSI studies is that they dealt primarily on evoked synaptic currents resulting from extracellular stimulations. It is virtually impossible to separate processes 2 and 3 with such methods, particularly because the newly uncovered modification of presynaptic excitability (Kreitzer et al., 2002) may lead to failures to excite the presynaptic cell(s) during extracellular stimulation protocols. Hence, we have focused our work on paired recordings because this approach gives unequivocal control of presynaptic firing. Using paired recordings, we have also investigated the effects of replacing the intracellular K+ with Cs+ in the presynaptic cell to explore the possibility that DSI may involve the modulation of K+ channels.
Materials and Methods
Preparation. All experiments were performed on slices obtained from the cerebellar vermis of 11- to 15-d-old Wistar rats. After decapitation, cerebella were rapidly extracted and cooled in 3–5°C cold bicarbonate-buffered saline (BBS) for a few minutes. One hundred eighty-micrometer-thick sagittal sections were cut using a Leica (Nussloch, Germany) VT1000S Vibratome in cold BBS; they were left to recover before use for 1 hr in BBS at 34°C and, finally, at room temperature for the remaining experimental day. Once transferred into the recording chamber, the slices were continuously perfused with oxygenated BBS at a rate of 1–1.5 ml/min at room temperature. An Axioscope upright microscope (Zeiss, Oberkochen, Germany) with differential interference optics, a 63×, 0.9 numerical aperture (NA) water immersion objective, and a 0.63 NA condenser was used to identify Purkinje cells and presynaptic GABAergic interneurons.
Solutions. BBS contained (in mm): 125 NaCl, 2.5 KCl, 2 CaCl2, 1 MgCl2, 1.25 NaH2PO4, 26 NaHCO3, and 10 glucose, pH 7.4, equilibrated by continuously bubbling with 95% O2 and 5% CO2. For low calcium experiments, the concentration of CaCl2 was decreased to 1 mm, whereas that of MgCl2 was increased to 4 mm; the concentrations for the other chemicals (all from Sigma, St. Louis, MO) were not modified. In all experiments, ionotropic glutamatergic transmission was blocked by NBQX (2–10 μm; Tocris Cookson, Bristol, UK) and AP-V (50 μm; Tocris Cookson); to record mIPSCs, TTX (200–500 nm; Sigma) was used. All drugs were directly added to the bath BBS.
Electrophysiological recordings. Experiments were performed with a double EPC-9 amplifier (HEKA, Lambrecht, Germany). Recording pipettes were pulled from borosilicate glass capillaries (Purkinje cells, 2–2.8 MΩ; interneurons, 5–7 MΩ for whole-cell and 8–12 MΩ for perforated patch recordings). Purkinje cells were whole-cell voltage clamped using the following intracellular solution (in mm): 150 CsCl, 4.6 MgCl2, 0.1 CaCl2, 10 HEPES, 1 EGTA, 4 Na-ATP, and 0.4 Na-GTP. The holding potential was kept at–60 to–70 mV, giving rise to inward GABAergic currents. For paired recordings, the perforated patch configuration for presynaptic interneurons was achieved by adding amphotericin B (300 μg/ml, previously aliquoted in DMSO) to the following solutions (in mm): 150 K-gluconate, 4.6 MgCl2, 0.1 CaCl2, 10 HEPES, 1 EGTA, 4 Na-ATP, and 0.4 Na-GTP; for the cesium experiments, Cs-gluconate (150 mm) replaced K-gluconate.
Presynaptic cells were voltage clamped at–70 to–80 mV; unclamped action potentials were triggered by short (3–10 msec) depolarizations to +10 or 0 mV. In experiments with presynaptically Cs +-dialyzed interneurons, depolarizations were followed by 10–50 msec hyperpolarizing steps to–100 mV to help axonal repolarization. In a few earlier experiments, interneurons were stimulated at 0.5 or 0.33 Hz; otherwise, stimulation rate was 0.2 Hz.
In some paired recording experiments, a paired pulse protocol was applied by stimulating interneurons twice at 20 msec intervals in presynaptic potassium or at 100 msec intervals in presynaptic cesium. For these trials, paired evoked IPSCs (eIPSCs) were always elicited at 0.2 Hz.
Data were sampled at 5 kHz and filtered at 1 kHz.
Data analysis. DSI was induced by depolarizing Purkinje cells either with eight steps to 0 mV for 100 msec at 1 Hz or with a single step to 0 mV for 1 sec. Both protocols lead to the induction of maximal DSI (Glitsch et al., 2000). DSI was induced repetitively in each experiment, with a typical inter-DSI interval of 3 min.
The analysis of mIPSCs and spontaneous IPSCs (sIPSCs) was performed using homemade routines written in Igor Pro (Wavemetrics, Lake Oswego, OR) as previously described (Diana et al., 2002). After automatic event detection, time was divided into 2-sec-long bins; frequency, average amplitude, and cumulative amplitude (i.e., the sum of all the amplitudes) were calculated from the synaptic currents falling into corresponding bins. The 60 sec preceding DSIs were considered as a control period; the reduction over the first 10 sec in DSI with respect to the control was evaluated by averaging the first five bins after DSI induction. Separate DSI trials were then pooled together.
The analysis of the DSI of eIPSCs was performed as follows. For each DSI trial, the eIPSCs falling into the 60 sec time interval (for 0.5 and 0.33 Hz stimulation rates) or into the 90 sec time interval (when stimulating at 0.2 Hz) before DSI were considered control periods. Maximal DSI was calculated as the percentage of inhibition corresponding to the ratio between the average amplitude of the eIPSCs in the first 10 sec after the induction protocol (n = 3 eIPSCs at 0.2 Hz; n = 4 at 0.33 Hz; and n = 5 at 0.5 Hz) and the average amplitude in control. The DSI value for a single experiment was calculated as the average value of all the DSI trials.
The paired pulse ratio was measured as the ratio between the average amplitude of the second eIPSC over that of the first for groups of paired evoked currents. The rise time was defined as the period required for eIPSCs to increase from 20 to 80% of their maximum amplitude, whereas the time between the peak of the presynaptic action potential and the 20% point on the rising phase of the postsynaptic currents was considered the synaptic latency. The decay time constant was calculated by fitting the eIPSC with a monoexponential function starting at the point of maximal amplitude.
For rise time, latency, decay time constant, failure rate, and paired pulse ratio measurements, the average values from the eIPSCs falling in the first 35 sec after DSI (n = 8 eIPSCs at 0.2 Hz; n = 12 at 0.33 Hz; and n = 18 at 0.5 Hz) represented the test period, as opposed to the control period, which was set as for the quantification of DSI; values for a single experiment were obtained by pooling together the averages from each DSI trial in each condition. Thus, figures denoting a single experiment were averages from multiple (typically 5–10) DSI trials.
To study the behavior of the variance-to-mean ratio (v/m) for the eIPSCs during DSI, only experiments in which the presynaptic stimulation rate was 0.2 Hz were considered; shorter periods were selected so that stationarity could be assumed. On the basis of the time course of DSI represented in Figure 4C, eIPSCs were divided into groups of three. Both the control and test periods were divided into such triplets, for which average amplitudes (m), variances (v), and v/m were calculated. For each DSI trial, v/m values were normalized using the average v/m from the triplets in the control period. Finally, the values for the various DSI trials of an experiment were averaged to give a single contribution per DSI triplet and per paired recording to the final statistics.
Figure 4.

Characterization of DSIe in paired recordings. A, Peak DSIe values (calculated using the first 8 eIPSCs during DSI periods) as a function of the duration of postsynaptic whole-cell recording. Notice the reliability of DSI induction over the long postsynaptic recording times. B, Distribution of peak DSIe values for 17 paired recordings. The distribution is uniform; most values are centered around a mean of ∼70%. This is consistent with a homogeneous distribution of CB1Rs on basket and lower stellate cells, as suggested in a previous publication (Diana et al., 2002). C, Normalized time course of DSIe for 14 paired recordings in which presynaptic interneurons were stimulated every 5 sec. This time course is not significantly different from those of DSIm and of DSIs. Note the residual ∼10% DSIe at 70–90 sec after stimulation, indicating a slower secondary recovery phase.
Results are given as means ± SEM. Statistical comparisons were made using Wilcoxon's signed rank test for paired samples and the Mann–Whitney U test. Comparisons were either inside an individual experiment (in which case n designated the number of DSI trials) or between pooled experiments (in which case n represented the number of experiments in each condition). Correlation was evaluated by computing the Kendall rank correlation coefficient. Statistical significance was set at p = 0.05.
Morphological reconstruction. At the end of a perforated patch recording, the cell body of the presynaptic interneurons typically remained intact after withdrawal of the recording pipette. We took advantage of this fact, and we recovered the interneuron morphology with a fast and noninvasive technique based on the lipophilic dye DiI, which gave reliable results and allowed the visualization of the plausible contact areas with a confocal microscope (see Fig. 2C). During paired recordings, Purkinje cells were filled through the recording pipette with Lucifer yellow (0.3%; Sigma). As for basket and stellate cells, after recording, a new pipette was filled with DiI (Molecular Probes, Eugene, OR) dissolved in methylene chloride (0.5%; Sigma). A dye crystal typically formed at its tip; the pipette was then placed in contact with the cell soma and rapidly removed to permit the deposition of the crystal without damaging the cellular structure. The slices were then fixed for 48 hr at 4°C in 4% paraformaldehyde (Sigma) and 0.15 m phosphate buffered solution (PB) for fixation and left in PB for a further 48 hr at the same temperature to permit the full diffusion of the dye on the cellular membrane. Finally, the slices were mounted on glass slides in Dako (Carpinteria, CA) fluorescence mounting medium. Series of images at incremental z-axis positions were taken and superimposed using a Zeiss LSM 410 confocal microscope equipped with two different lasers at 488 and 543 nm wavelengths for Lucifer yellow and Dil, respectively.
Figure 2.
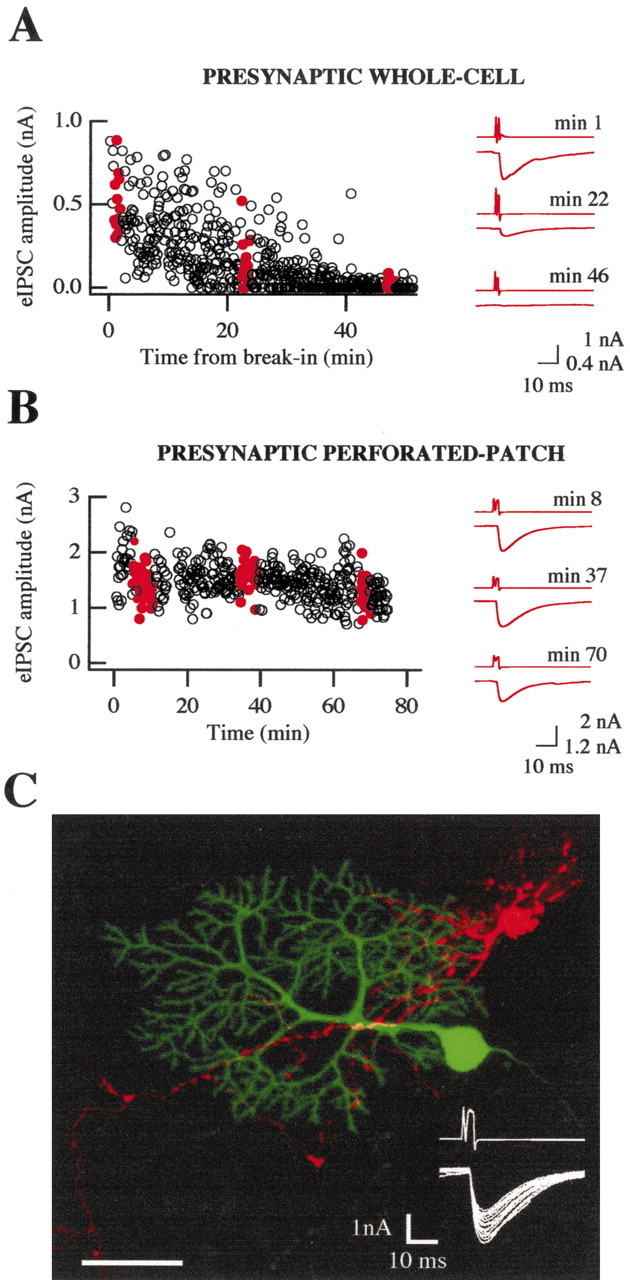
Rundown of eIPSCs is prevented by presynaptic perforated patch recording. A, Typical paired recording in which the presynaptic interneuron was whole-cell voltage-clamped with a K +-gluconate-based solution. The amplitude of eIPSCs slowly decreased with time of presynaptic dialysis. The red traces show the average presynaptic and postsynaptic currents; corresponding amplitudes are indicated by the filled red symbols in the time plot on the left. The presynaptic interneuron was stimulated at 0.2 Hz. Time 0 was set at the moment of the rupture of the presynaptic seal. B, Results obtained with presynaptic perforated patch recording. In this case, time 0 was taken when presynaptic access was sufficient to allow the triggering of an axonal action potential with a depolarizing somatic voltage pulse. C, Morphology of a connected interneuron (a low stellate cell in this case, shown in red, DiI membrane staining)–Purkinje cell (green, Lucifer yellow intracellular staining) pair. Fifty images taken at incremental z-axis coordinates have been superimposed; note that the main presynaptic axonal shaft and some collateral branches appear to contact the dendrites of the postsynaptic Purkinje cell on several distinct locations, indicated by yellow spots. The inset represents 15 superimposed eIPSCs from this paired recording, with the corresponding presynaptic currents. Scale bar, 40 μm.
Results
DSI of TTX-sensitive and -insensitive IPSCs
The form of retrograde inhibition that has been designated DSI in previous publications is actually the superimposition of multiple processes so that, as it will appear below, the quantification of the associated peak percentage reduction of synaptic strength strictly depends on the experimental conditions. In the following, we introduce different terms to define the extent of reduction for different classes of experiments. Namely, we call DSIs the maximal inhibition of the collective sIPSCs recorded in one cell, DSIm the maximal inhibition of mIPSCs, and DSIe the inhibition of eIPSCs obtained from paired recording experiments. The main goal of the present work is to measure these different forms of DSI and to understand their mutual relations, as well as their link with the reduction in presynaptic action potential frequency (DSIAP) recently described by Kreitzer et al. (2002).
We first performed a series of experiments to analyze the time course of DSI and to characterize the relative contributions of IPSC frequency and average amplitude inhibition to DSIs and DSIm. An important goal of these experiments was to allow a quantitative comparison in the same experimental conditions with the results of paired recordings to be described below. These results expand and complete previous reports on DSIs and DSIm in this preparation (Llano et al., 1991; Glitsch et al., 1996).
Figure 1A illustrates the modulation of sIPSCs in the absence of TTX; whereas the top trace displays a typical DSI protocol from one such experiment, the middle graph shows the time course of the cumulative amplitude obtained from averaging normalized results across experiments, yielding a mean peak reduction (DSIs) of 64.2 ± 8.2% (n = 14); the half-time of recovery was 37.9 ± 3.8 sec. Reductions in the frequency and in the average amplitude of sIPSCs contribute in equal proportions to the decrease of the cumulative amplitude: they amount to 39.9 ± 4.7 and 41.3 ± 4.2%, respectively. The bottom graph of Figure 1A shows that the time course of recovery of the normalized average amplitude is very similar to that of the cumulative amplitude. The same held true for the frequency (data not shown).
Figure 1.

DSIs and DSIm. Illustrated are the effects of postsynaptic depolarization on the spontaneous synaptic activity in Purkinje cells as recorded in the presence of blockers of glutamatergic synaptic currents. A, Action potential-dependent and -independent synaptic currents both contribute to the overall population of sIPSCs. The top trace shows a typical DSI protocol. After a control period, the Purkinje cell is depolarized 8 times for 100 msec to 0 mV, at 1 Hz; the trace shows the consequent dramatic inhibition of sIPSCs and, thereafter, their recovery phase over 60 sec. In this cell, four such protocols were averaged, yielding 79.6 ± 0.5% inhibition in the sIPSCs cumulative amplitude (cumul. ampl.), calculated over the first 10 sec after the end of the pulse train. Decreases in the frequency and in the average amplitude (av.ampl.) contributed in equal measure to this reduction: 53.6 ± 4.3 and 55.2 ± 4.3%, respectively. The two bottom graphs show the time course of the DSI of cumulative and average amplitudes for n = 14 experiments performed with this protocol; as for the single case depicted in A, frequency (data not shown) and average amplitude are equally inhibited during DSI and recover back to control levels with the same time course. B, DSI of mIPSCs, recorded in the presence of 200–500 nm TTX. In the experiment shown, the inhibition of the mIPSC cumulative amplitude was 64.7 ± 4.0% over four DSI trials. In contrast to the sIPSC results, the reduction of mIPSC frequency totally accounts for the DSI of the cumulative amplitude; the bottom graph shows that the average amplitude of mIPSCs remains totally unaffected by the induction protocol (average graphs from 13 cells).
Results of similar experiments performed in the presence of TTX (200–500 nm) are presented in Figure 1B. The average reduction of the cumulative amplitude (DSIm) was 43.3 ± 3.5% (n = 13); this value is significantly smaller than that obtained in the absence of TTX (p < 0.01; Mann–Whitney U test). In agreement with earlier reports (Llano et al., 1991; Glitsch et al., 1996), the entire effect could now be accounted for by a change in event frequency (amounting to 45.2 ± 3.0%; data not shown), whereas the mean amplitude was unchanged (slight increase by 5.7 ± 4.9% compared with control values; Fig. 1B, bottom graph). Here we note in addition that the half-recovery time measured in TTX was 35.1 ± 3.4 sec, not different from that observed for TTX-dependent sIPSCs (p >> 0.1; Mann–Whitney U test). Thus, even though the extent of DSIs and DSIm differed, the time course of the effect was the same in the two cases.
Rationale for studying DSI in paired recordings
The resting frequencies of sIPCSs and mIPSCs in the two separate series of experiments used for the analysis of Figure 1 were 11.1 ± 1.4 Hz (range, 3.4–20.2 Hz; n = 14) and 8.2 ± 1.4 Hz (range, 2.7–17.7 Hz; n = 15), respectively; corresponding cumulated amplitude values were 1808 and 986 pA/sec. It is most likely that sIPSCs include action potential-independent IPSCs, which have very similar properties to those of mIPSCs recorded in TTX. According to the above values, the contribution of action potential-independent IPSCs to sIPSCs was very substantial. However, the proportion that can be derived from these data is not accurate given the very large scatter of the results obtained with different cells. More reliable figures were obtained in a series of experiments performed for another study in which sIPSCs were directly compared in individual cells with and without TTX. These results indicate that action potential-independent IPSCs contribute 47% of sIPSCs and that they account for 21% of their cumulative amplitude (J. Gonzalez, A. Marty, and I. Llano, unpublished results). Thus, the share of these IPSCs in the overall inhibitory synaptic input of Purkinje cells is far from negligible.
The finding that one component of sIPSCs (the action potential-independent IPSCs) was less reduced than the overall population during DSI therefore implies that the other component (action potential-evoked IPSCs) was more strongly inhibited than the mean sIPSCs. This strong inhibition could involve a reduction of the frequency of generation of action potentials by the presynaptic cell, of the probability of action potential transmission along the axon, or of the probability of neurotransmitter release. To sort out these possibilities and to find out the exact amount of DSI applying to action potential-evoked currents, paired recordings were performed between presynaptic interneurons and postsynaptic Purkinje cells. Vincent and Marty (1996) found an inverse correlation between the strength of this synaptic connection and the depth of the location of presynaptic interneurons in the molecular layer; for this reason, our paired recording experiments were primarily performed using presynaptic cells located in the lower two-thirds of the molecular layer (basket cells and proximal stellate cells).
Rundown of eIPSCs can be prevented by using presynaptic perforated patch recording
We first performed whole-cell recordings of the presynaptic neurons to control the ionic composition and the firing rate of the presynaptic cell. Although DSI could be readily obtained under these conditions (data not shown), the analysis of the results was severely restricted by the fact that an irreversible decline (“rundown”) of the synaptic strength occurred within 10–20 min of presynaptic whole-cell recording (Fig. 2A) (presynaptic washout at this synapse was previously mentioned by Vincent and Marty, 1996). However, if the presynaptic recording was performed using the perforated patch technique, data could be recorded over ≥1 hr without any significant rundown (Fig. 2B). These results suggest that a diffusible, water-soluble substance is responsible for the washout observed with conventional presynaptic whole-cell recording. For this reason, the remaining part of this paper presents results obtained with the perforated patch technique. In a fraction of the experiments, the morphology of the presynaptic and postsynaptic cells was recovered using a combination of presynaptic staining with DiI and postsynaptic staining with Lucifer yellow (see Materials and Methods), as illustrated in Figure 2C. As exemplified in this figure, connected pairs typically displayed extensive or numerous areas of potential contacts, or both, suggesting the presence of multiple release sites.
A DSI experiment using paired recording
A typical DSI experiment performed under these conditions is illustrated in Figure 3. In the control period, voltage pulses to 0 mV were applied presynaptically at 0.2 Hz, giving rise to action currents, which reflected the onset of axonal action potentials and to eIPSCs in the Purkinje cell (Fig. 3A). The corresponding presynaptic Ca2+ transients are undistinguishible from those obtained with presynaptic current-clamp stimulations (Tan and Llano, 1999). Amplitudes of eIPSCs were large: the average was 1.00 ± 0.25 nA (n = 22 pairs with a postsynaptic chloride-based solution). To induce DSIe, the Purkinje cell was stimulated (1 sec pulse to 0 mV); when resuming presynaptic stimulations, presynaptic signals were unchanged (Fig. 3A, inset traces), but eIPSC amplitudes were markedly reduced (Fig. 3A, bottom right traces), reflecting DSIe. Figure 3A, bottom graph, depicts the time course for this DSI trial. Here, circles indicate eIPSC amplitudes during control and post-DSI periods, whereas dots show results obtained in the 90 sec period after Purkinje cell depolarization (given at t = 0).
Figure 3.
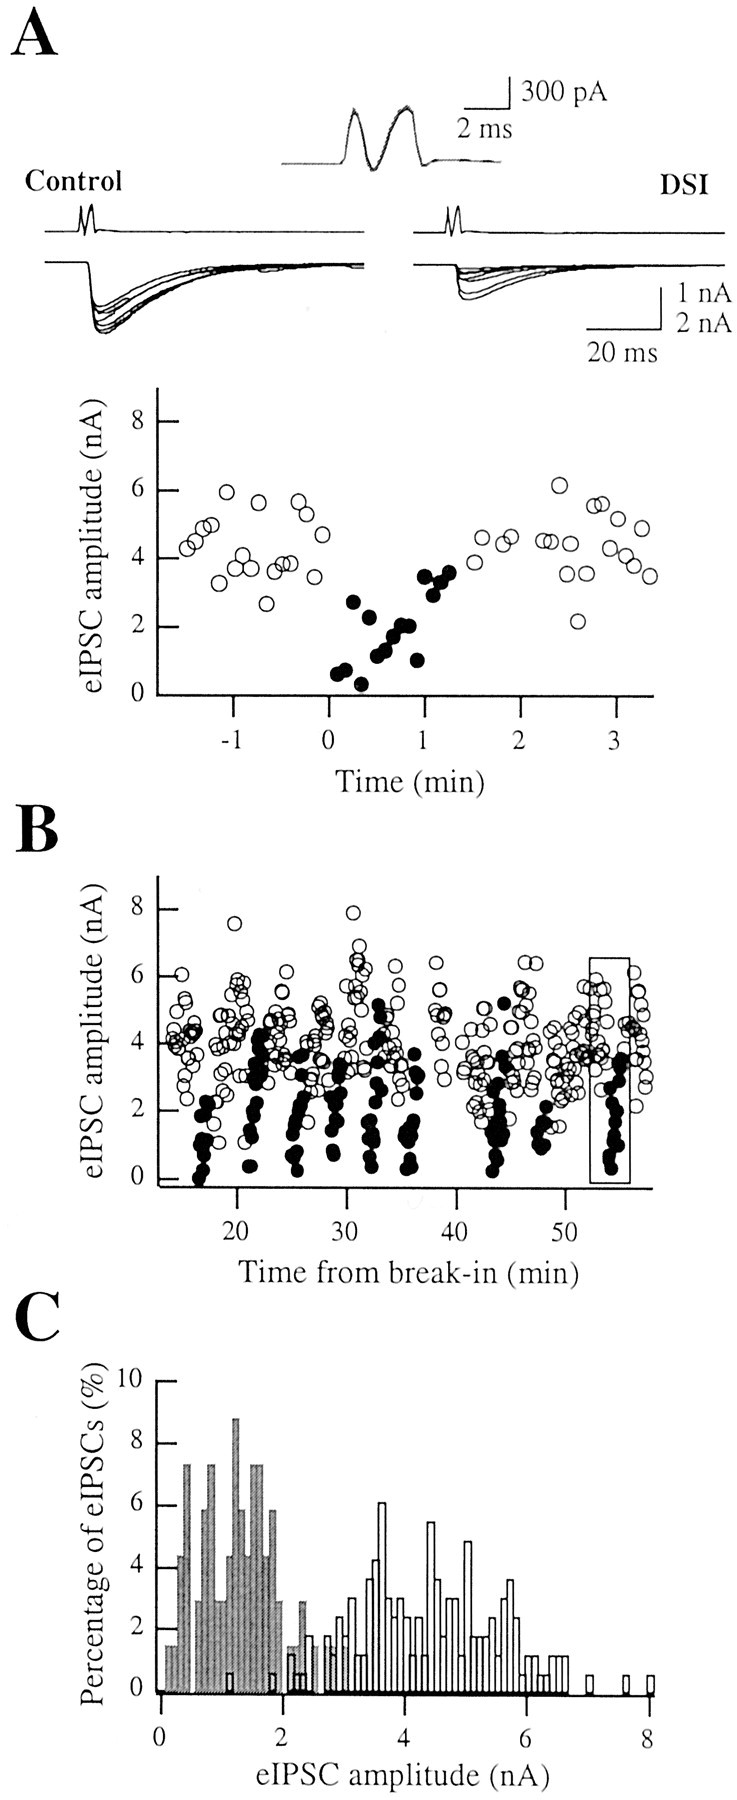
DSI experiment in paired recordings. A, DSI was induced by depolarizing the Purkinje cell once to 0 mV for 1 sec. Left, Seven superimposed presynaptic and postynaptic traces during the control period. Right, First seven eIPSCs after the induction protocol. Inset, Average presynaptic currents were identical for the control (black) and test (gray) periods. Bottom graph, Time course of eIPSC amplitudes for this DSI trial. Each symbol is the amplitude of an individual evoked response; circles represent control amplitudes, whereas dots represent the first 90 sec during DSI. The presynaptic stimulation rate was 0.2 Hz. B, Time course of the experiment. Each series of dots represents 90 sec after a DSI induction protocol. The box indicates the DSI trial illustrated in A. Note that DSI could be reliably induced over tens of minutes. C, Histograms of control eIPSC amplitudes (open bars) and test eIPSCs (gray) pooled from the DSI trials shown in B; the 90 sec preceding DSI were chosen for each depolarization as a control (corresponding to 18 eIPSCs at 0.2 Hz) and the following 40 sec as a test (8 eIPSCs); notice the clear difference between the two distributions. Using these time intervals, DSIe amounted to 69.7%. In this particular experiment, no failures were detected either in control or during DSI.
Figure 3B shows the time course of the eIPSC amplitudes for the same experiment, including nine successive DSIe trials; dot clusters represent 90 sec periods corresponding to DSIe. It is immediately apparent that DSIe could be reliably induced through-out the experiment. The box indicates the DSIe trial depicted in Figure 3A. Taking advantage of the stability of the amplitude of eIPSCs in the control and DSIe periods, pooled amplitude histograms were calculated in the control (open bars) and in the first 35 sec after DSI induction (corresponding to the first eight eIPSCs; the extent of DSIe calculated over this time window was 69.7%) for all the DSIe trials performed in this experiment. Even though both histograms are quite broad, reflecting a substantial range of amplitude fluctuations in each condition, there was very little overlap between the two distributions. This excludes the possibility that DSIe would work simply by stopping the propagation of the action potential along the main axon, because the distribution of nonfailure events would then be the same during DSIe and in the control. Nevertheless, these data would still be compatible with a blocking action in action collaterals, as discussed below.
Reliability of induction and time course of DSIe
Pooling together the results of several DSI trials, as has been done in Figure 3C, requires that the properties of DSIe remain stable during the entire duration of the recording. To test this assumption, we plotted the mean of all DSIe values obtained (n = 17 pairs) as a function of the time in the whole-cell configuration for the postsynaptic Purkinje cells (Fig. 4A). DSIe values were calculated over 35 sec periods after Purkinje cell depolarization in this analysis. The results indicate that DSIe does not decline at least up to 80 min after establishing the whole-cell configuration. As an example, the values of DSIe between 5 and 10 min (55.8 ± 7.2%; n = 11 DSI trials) and between 50 and 55 min (62.0 ± 6.2%; n = 13 DSI trials) after breaking into Purkinje cells are not statistically different (p > 0.05, Mann–Whitney U test).
In the hippocampus, DSIe results are extremely variable in paired recordings: some pairs have essentially 100% DSIe, whereas others have a negligible DSIe level (Wilson et al., 2001); this is likely to reflect the different sensitivity to cannabinoids of distinct interneurons subtypes (Katona et al., 1999; Tsou et al., 1999). In sharp contrast to this situation, we find that, in our preparation, the distribution of DSIe values is rather homogeneous, with values from most experiments centered at ∼70% (Fig. 4B).
Figure 4C shows the average time course of DSIe obtained from 14 paired recordings in which the presynaptic stimulation rate was 0.2 Hz. The maximal DSIe (calculated over the first three eIPSCs after the DSI induction protocol) was 68.8 ± 4.7%, with values ranging from 23.2 to 94.4%. It is interesting to note that a significantly higher value (88.8 ± 3.7%) was recently found in another series of experiments using paired recordings (Diana et al., 2002). The discrepancy with the present study is likely to be related to the different intracellular solutions used in the Purkinje cells (low Cl- concentration in the previous study vs isotonic Cl- in the present work).
A close examination of the time course of DSIe recovery in Figure 4 reveals three different phases. There was first an almost stable period, lasting 20 sec and corresponding to the first four trials after induction. This was followed by a rather rapid decline in the period 20–60 sec after the depolarization. The half-recovery occurred at 42.1 ± 2.8 sec (n = 11), not significantly different from the values obtained for sIPSCs (37.9 sec) and mIPSCs (35.1 sec; see above; p > 0.05 in both cases, Mann–Whitney U test). A small residual inhibition remained at 60–80 sec, indicating the presence of a secondary component with slower kinetics. A similar component is in fact apparent in Figure 1, A and B. Overall, the kinetics of DSI recovery appeared to be the same independently of whether sIPSCs, mIPSCs, or eIPSCs were measured.
The difference between DSIe (68.8%) and DSIs (64.2%) is not statistically significant (p > 0.10, Mann–Whitney U test). This may seem paradoxical because we argued earlier that the latter include mIPSCs, which are comparatively little affected. However, recent results indicate that the firing rate of interneurons decreases during DSI (Kreitzer et al., 2002). This effect does not appear in our paired recording experiments, in which the presynaptic stimulus was suprathreshold and reliably gave rise to somatically recorded action currents even during DSI periods. Therefore, whereas the actual contribution of action potential-evoked sIPSCs originating at one interneuron → Purkinje synapse is given by the product of the presynaptic firing rate and of the eIPSC amplitude, the DSIe value appearing in Figure 4 includes only the latter component. Incorporating the reduction in firing rate results in a larger DSI value, which compensates for the lower DSI of mIPSCs (see Appendix).
Increase in the failure rate during DSI
Previous experiments using extracellular stimulation suggested an increase in the failure rate during DSI (Vincent et al., 1992; Alger et al., 1996). However, a quantitative interpretation of these experiments is difficult because of uncertainties on the number of stimulated presynaptic cells and on the exact pattern of presynaptic action potentials elicited by each stimulation pulse. Also, the earlier experiments used “minimal stimulation” conditions, with mean currents on the order of ≤200 pA; although DSI seemed to eliminate well defined, presumably multiquantal components, suggesting propagation failures (Alger et al., 1996), it could not be excluded that the failures were attributable to a homogeneous reduction in release probability. We hoped to shed light on this issue by examining DSI-induced failures in our paired recordings, which started off with very large eIPSC amplitudes.
An earlier study showed that the probability of release of interneuron → Purkinje synapses is age-related and that this probability is at its maximum for this preparation at the age covered in this study (postnatal days 11–15; Pouzat and Hestrin, 1997). In agreement with these findings and with the very large control IPSC amplitude, we found a very low failure rate in control conditions, amounting to 1.2 ± 0.3% (range, 0–3.2%; n = 15 pairs). We compared next the failure rate in control and in DSI periods. To increase the number of sample data analyzed, for each DSI trial the failure rate was calculated for the first eight eIPSCs after the Purkinje cell depolarization. An increase in failure rate was readily apparent in all experiments, except for 2 pairs, which did not display any failure either in control or in DSI conditions. An example of a DSIe trial is shown in Figure 5A, left traces; three of eight presynaptic stimulations induced postsynaptic failures (postsynaptic traces indicated by an asterisk), whereas no failures were observed in the control. Interestingly, the eight presynaptic traces during DSI are exactly superimposed, and they are identical to the control traces; these results do not indicate any association of failures with modifications of presynaptic somatic signals.
Figure 5.
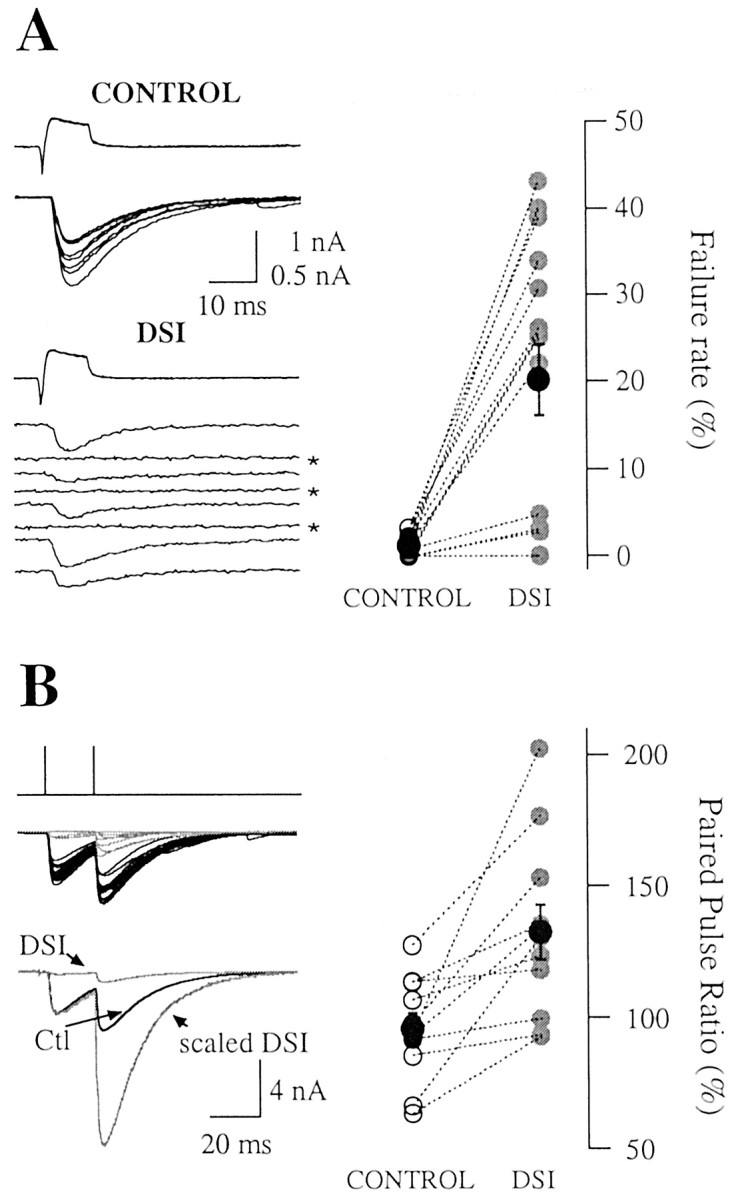
Failure rate and PPR increase during DSIe. A, Failure rate and DSI. Top left plot, Control presynaptic and postsynaptic currents (8 superimposed traces). Bottom left plot, Series of eight consecutive traces during DSI showing three transmission failures (asterisks indicate individual postsynaptic traces have been separated to better illustrate failures), whereas none occurred in the control. In this experiment, the failure rate increased from 0.4 ± 0.4 to 26.2 ± 3.6%(n=14DSI trials),where as DSIe amounted to 73.1±1.75%. Right, Dashed lines connect pairs of points representing the failure rate in the control (open symbols) and test (closed symbols) periods for individual experiments. Mean failure rates from the 15 considered pairs are shown by larger black symbols. The failure rate increased in each experiment with the exception of two, in which none was present either in control or during DSI. B, PPR and DSI. Presynaptic interneurons were stimulated twice at 20 msec intervals at 0.2 Hz. Left, Control (Ctl; black) and DSI (gray) traces (top series, superimposed individual traces; bottom series, their averages). The scaled DSI trace was calculated to match the amplitude of the first eIPSC in the control. In this experiment, the PPR increased from 97.8±3.7 to 155.8±19.8%. DSIe values were 85.1±2.1 and 78.7 ± 2.0% for the first and second eIPSCs, respectively (n = 8 DSI trials). Right, Mean PPR results from 11 experiments. The PPR increases in each case.
When averaging across experiments, the failure rate increased from 1.2 ± 0.3 to 20.2 ± 4.1% (n = 15; p << 0.05, Wilcoxon's test; Fig. 5A, right graph).
Paired pulse ratio and DSI
A classical method to investigate the participation of presynaptic mechanisms in synaptic plasticity is to analyze the paired pulse ratio (PPR) for two closely successive stimulations. In the CA1 region of the hippocampus, there are contradictory reports about the relationship between PPR and DSI. Alger et al. (1996) and Varma et al. (2002) reported that DSI was not associated with any systematic modification in the PPR. This result was interpreted as indicating that the inhibition of eIPSCs was primarily attributable to propagation failures, whereas invading action potentials would release GABA essentially as in control conditions. In contrast, another group reported an increase in the PPR during DSI, as expected for a graded modulation of the probability of transmitter release in presynaptic terminals (Wilson and Nicoll, 2001). The link between DSI and PPR has been examined in the cerebellum by studying currents evoked by extracellular stimulation protocols (Yoshida et al., 2002); given the recent report by Kreitzer et al. (2002) on the inhibition of presynaptic firing during DSI, we considered it important to readdress this question using paired recordings in which the presynaptic spike rate is under precise experimental control.
To measure the PPR, two consecutive presynaptic depolarizations were given with an interval of 20 msec at 0.2 Hz; as before, eight paired stimulations were analyzed during the DSI period. The PPR was calculated from averaged results rather than from individual sweeps to avoid introducing a statistical bias in the analysis of the results (Kim and Alger, 2001). In control conditions, the PPR was 95.6 ± 5.9% (n = 11). This is larger than the values reported earlier at this age [in rats (Pouzat and Hestrin, 1997) and in mice (Caillard et al., 2000)]. The difference could stem from the use of presynaptic perforated patch recording in the present study versus whole-cell recording in the earlier work and from the effects on transmission attributable to the dialysis of the presynaptic intracellular milieu by the latter technique.
In the present experiments, the paired pulse ratio was clearly increased during DSI (Fig. 5B). This effect was seen in 11 of 11 investigated pairs. In the example shown in Figure 5B, left, the PPR value increased from 97.8 ± 3.7 to 155.8 ± 19.8% (n = 8 DSI trials). When averaging across experiments, the paired pulse ratio grew from 95.6 ± 5.9% in the control to 132.6 ± 10.3% during DSI (p << 0.05, Wilcoxon's test; n = 11; Fig. 5B, right). These results do not exclude propagation failures, but they show that propagation failures, if present, cannot be the only mechanism underlying DSIe. Rather, cerebellar DSIe must involve a reduction of release probability once a presynaptic action potential effectively reaches synaptic terminals.
Kinetic parameters of eIPSCs
Few studies have been concerned with eIPSC kinetics during DSI, apart from early reports using extracellular stimulation, which indicated an increase in the time course of decay (Vincent et al., 1992) and no change in latency (Alger et al., 1996). Even though the above results and the existing literature clearly indicate that DSI must involve a strong presynaptic component, the possibility of additional postsynaptic components (e.g., involving changes in GABA receptor phosphorylation) cannot be excluded. Such effects could become manifest as kinetic changes of the eIPSCs. Presynaptic effects can also lead to kinetic alterations such as latency changes (for review, see Lin and Faber, 2002). Therefore, effects of DSI on eIPSC kinetics were analyzed in paired recordings. In control, the 20–80% rise time was 1.47 ± 0.20 msec (range, 0.79–2.66 msec). In the test period (eight first stimulations during each DSIe trial), the corresponding value was 1.57 ± 0.22 msec (n = 13; no significant change; p > 0.05, Wilcoxon's test). In conformity to previous findings (Vincent et al., 1992), the decay phase of the eIPSCs could be well described with a monoexponential fit; the average decay time constant was 12.1 ± 0.9 msec (range, 6.4–15.6 msec) in control conditions. However, whereas a 32% increase was associated with DSI in the previous experiments, we found a mean value of 12.7 ± 1.2 msec during DSIe (range, 8.6–19.9 msec; n = 10; p > 0.05, Wilcoxon's test), not statistically different from the control.
Although the exact reason for the discrepancy with the earlier results by Vincent et al. (1992) is unclear, we take the present results as indicating that the postsynaptic calcium rise does not lead to any significant change in the state of the postsynaptic GABA receptors.
Next we evaluated the latency by measuring the interval between the peak of the presynaptic action current and the point in time when eIPSCs reached 20% of their maximal amplitude. The latency was 1.99 ± 0.18 msec in control runs (range, 1.39–2.85 msec) and did not change significantly during DSIe, with a mean of 2.04 ± 0.17 msec (range, 1.15–2.85 msec; n = 11; p > 0.05, Wilcoxon's test). These results agree with a previous study by Alger et al. (1996) and indicate that (at least with normal presynaptic ionic conditions; see results of Fig. 8 below) DSIe does not involve any detectable change in the timing of GABA release and in the action potential propagation speed.
Figure 8.
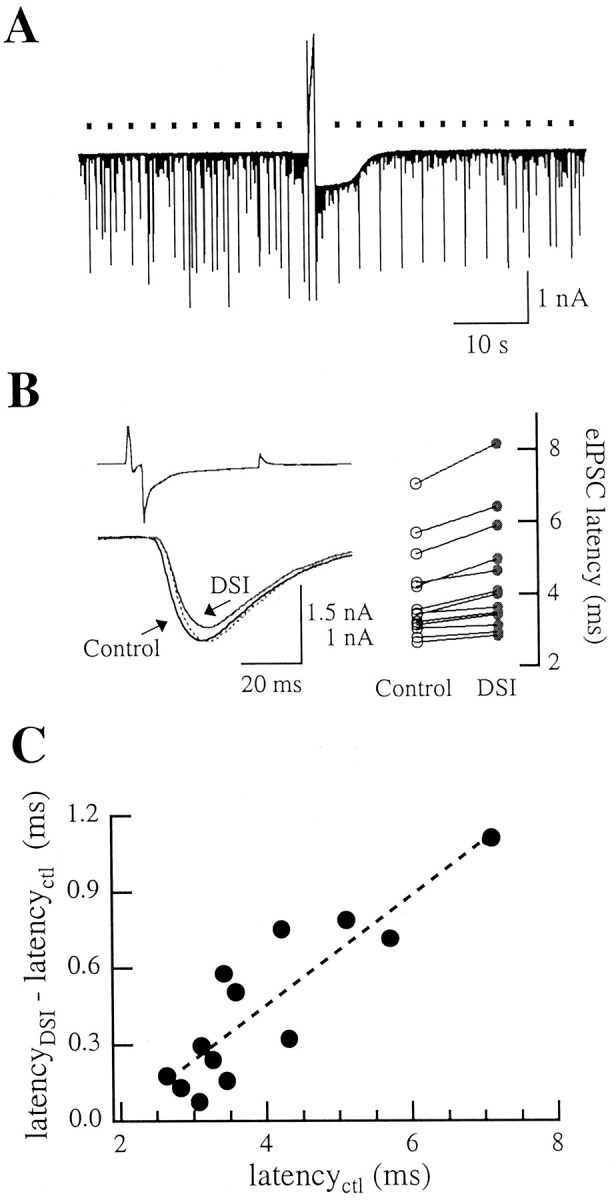
Effects of presynaptic Cs + on DSIe. A, eIPSCs elicited from a Cs +-dialyzed interneuron (times of presynaptic stimulations indicated by dots) were much less affected by DSI than sIPSCs, which mostly arose from undialyzed interneurons. For this experiment, the maximal DSIe amounted to 20.8 ± 4.1% (n = 5 trials); after excluding the eIPSCs from the analysis, the value of DSIs was 75.7 ± 1.3% (n = 4 trials). B, Left, Averaged traces in control runs (black) and during DSI (gray; recording different from that shown in A). The value of DSIe was only 13.7 ± 0.7% (n = 4 trials). The dotted gray trace illustrates the DSI average scaled to the amplitude of the control; notice the increase in synaptic latency. For this pair, the synaptic delay augmented from 7.05 ± 0.05 to 8.15 ± 0.13 msec (n = 4). Right, Summary results showing a systematic latency increase during DSIe. Each couple of connected points represents a paired recording. C, The DSI-associated latency increase is significantly correlated with the control latency value.
Variance analysis
It was reported earlier that the amplitudes of eIPSCs obtained at interneuron → Purkinje cell synapses are highly variable. Part of this variability stems from the large size of mIPSCs, but, in addition, it was proposed that the presynaptic calcium signal varies from one trial to the next (Vincent and Marty, 1996). The question therefore arises of whether trial-to-trial variations are modified during DSI.
Our results confirmed the earlier finding of very large fluctuations of eIPSC amplitudes in the control. The v/m averaged 80.2 ± 12.4 pA (n = 22). This ratio is related to the quantal size in a model-specific way. For instance, if one assumes a series of release sites with an exponential distribution of quantal sizes having a mean value q and a homogeneous release probability p, the v/m value (Vincent and Marty, 1996) is given by:
 |
1 |
To determine the variance of eIPSC amplitudes during DSI and to minimize errors linked to the evolution of the mean value with time during the DSI period, results were grouped in periods of three consecutive presynaptic stimulations, called triplets hereafter (see Materials and Methods). Variance-to-mean ratios were determined for two consecutive triplets during DSI and compared with pre-DSI periods. A representative experiment is illustrated in Figure 6A. As can be seen, there are very large variations in eIPSC amplitudes in each triplet during DSI. Figure 6B shows that, on average, for this pair, v/m increased from 98 pA in the control to 304 pA during the first triplet period (5–15 sec after the end of the DSI-inducing pulse) and to 251 pA in the second triplet period (20–30 sec after the end of the pulse). Both increases were highly significant (p < 0.05; n = 9 DSI trials).
Figure 6.

Amplitude fluctuations during DSI. A, To analyze the eIPSC amplitude fluctuations, in each DSI, episode traces were grouped in two triplets: a first triplet corresponding to the evoked currents obtained 5,10, and 15 sec after the DSI pulse and a second triplet corresponding to the currents obtained 20, 25, and 30 sec after the DSI pulse. In each triplet, the mean, the variance, and the variance-to-mean ratio of the eIPSCs were calculated; these results were compared with those obtained in control periods. Here, the raw postsynaptic traces for the two DSI triplets are depicted for two separate trials in the same experiment. Notice the extreme variability of the responses during this period of maximal DSI expression. B, Variance-to-mean ratios for the control periods (during which the mean eIPSC amplitude was 3.17 nA) and for the first and second triplets (with respective mean values of 0.35 and 0.47 nA). In this experiment, the variance-to-mean ratio increases threefold at the peak of the DSI period. Error bars indicate SEM for the various DSI trials performed in this experiment (n = 9).
Other experiments invariably displayed an increase of v/m during DSI, with a mean ratio to control values of 2.17 ± 0.39 (n = 6; range, 1.16–3.28).
Paired recordings with a Cs+-rich presynaptic intracellular solution
There are two plausible interpretations for the large enhancement of presynaptic variability during DSI, which was outlined by the results of the previous section. One explanation is that propagation failures significantly contributed to the reduced synaptic strength, as previously suggested (Alger et al., 1996). An alternative possibility is, however, suggested by examination of Equation 1. If the release probability pctl is close to 1 in control conditions Equation 1 predicts a severe reduction of the v/m by the factor 1 - pctl. During DSI, p is reduced, and the v/m would recover a much larger value. To test this latter possibility, we needed to study DSI under various basal release modes. With this purpose, we examined DSIe in pairs, in which a Cs+-rich solution was placed in the pipette contacting the presynaptic interneuron; amphotericin B channels are highly permeable to Cs+, as they are to K+, so that equilibration was expected. With intracellular Cs+, we assumed that p would be closer to 1 and that the comparison with the control situation would allow us to obtain at least an approximate estimate of pctl. Another motivation for these experiments was that in the hippocampus it was reported that 4-aminopyridine (4-AP) significantly reduced the amount of the DSI of extracellularly evoked currents, indicating that 4-AP-sensitive K+ channels could be one of the targets of DSIe (Alger et al., 1996; Varma et al., 2002). We hoped that the selective block of presynaptic K+ channels by Cs+ dialysis in paired recordings would also shed light on this issue.
Previous results using presynaptic whole-cell recording showed that dialysis of the presynaptic interneuron with Cs+ resulted in a dramatic increase of the mean eIPSC amplitude and in a marked reduction of the v/m (Vincent and Marty, 1996). We obtained similar results using perforated patch presynaptic recordings (Fig. 7). Figure 7, A and B, illustrates a case in which the access conductance improved very slowly at the start of the experiment. This resulted in a slow exchange of the pipette Cs+ for the cell K+, so that we could clearly distinguish the two conditions within the same recording. It can be seen that eIPSC amplitudes increased almost threefold on invasion of the presynaptic cell with Cs+. This was accompanied by a twofold increase in latency, an increase in rise time and decay time constants, and a considerable decrease in the coefficient of variation (CV) of the response.
Figure 7.
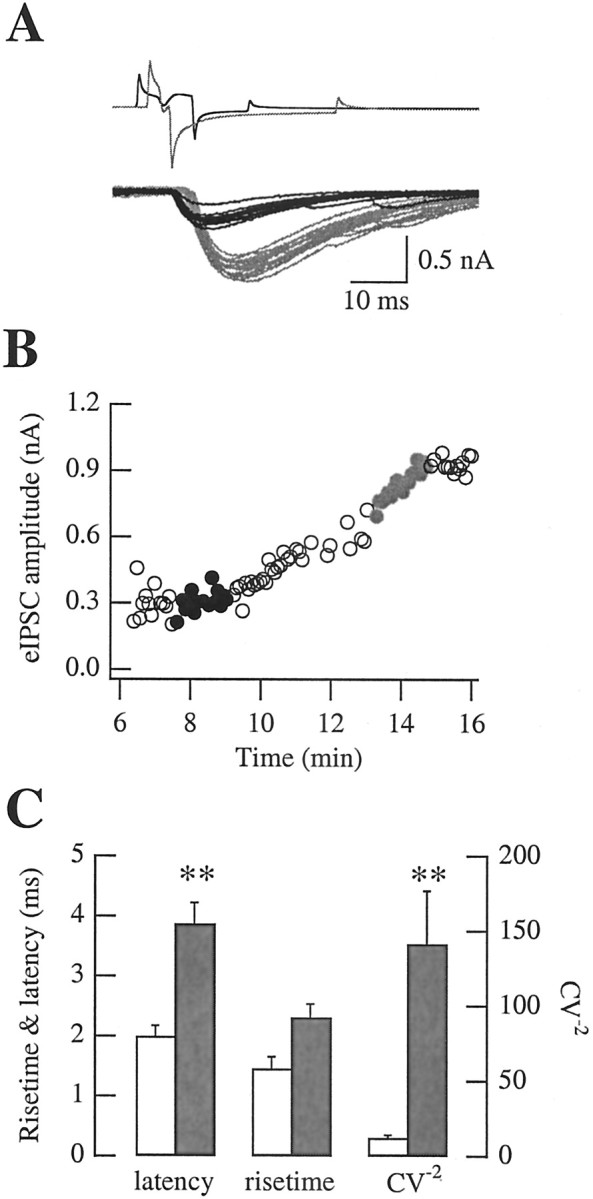
Effects of presynaptic Cs + on eIPSCs. A, In this paired recording, the access conductance through the amphotericin B channels improved slowly, so that the diffusion of Cs + in the presynaptic cell could be followed as a function of time. Black traces represent results obtained at the beginning of the experiment, when the cell still retained its normal intracellular solution. Gray traces illustrate results recorded later during the slow equilibration of Cs +. Traces have been aligned with regard to the peak of the presynaptic action current. The presynaptic voltage-clamp protocol included a sequence of depolarizing and hyperpolarizing steps to ensure reliable stimulation of axonal action potentials and to accelerate axonal repolarization. This protocol was modified during the course of the experiment; the presynaptic depolarizing step was shortened, where as the hypepolarizing one was lengthened as the access conductance improved with time. B, Time course of the eIPSC amplitude for the same experiment. Black and gray dots represent the data corresponding to the raw traces in A. C, Summary results showing rise time, latency, and CV-2 in paired recordings using presynaptic K+ (open bars; n = 16) and in paired recordings using presynaptic Cs+ (filled bars; n = 15). Differences in synaptic latency and CV-2 values are significant (indicated by asterisks), whereas the difference in rise time is not.
These general trends were confirmed when comparing average results of paired recordings using presynaptic Cs+ versus K+ (Fig. 7C): the mean eIPSC amplitude increased to 2.72 ± 0.44 nA (n = 15; compared with 1.00 ± 0.25 nA; p << 0.05); the average latency increased to 3.97 ± 0.36 msec (n = 13; compared with the above value of 1.99 ± 0.18 msec; p << 0.05); the decay time constant increased to 15.23 ± 1.11 msec (n = 10; compared with 12.1 ± 0.90 msec; p < 0.05); and the CV-2 increased to 141.5 ± 35.5 (n = 15; compared with 12.2 ± 2.0; p << 0.05). However, the augmentation of the rise time did not quite reach statistical significance (2.31 ± 0.23 compared with 1.47 ± 0.19 msec; 0.05 < p < 0.1, Mann–Whitney U test for all these parameters).
Moreover, with presynaptic Cs+, paired pulse depression developed; at a 100 msec interstimulus interval, the PPR was 63.1 ± 4.6% (n = 6). As previously reported for other synapses [in the goldfish (Waldeck et al., 2002) and in the calyx of Held (Wu and Borst, 1999)], the paired pulse protocol resulted in a significantly larger synaptic delay for the second eIPSC (4.37 ± 0.51 msec) than for the first (3.76 ± 0.49 msec; n = 5; p < 0.05, Wilcoxon's test).
DSI in experiments with a Cs+-dialyzed interneuron
DSI experiments as performed with a Cs+-dialyzed interneuron are depicted in Figure 8. Although sIPSCs, which originated primarily in synapses that were not exposed to presynaptic Cs+, underwent normal DSI, the amplitude of eIPSCs was little affected (Fig. 8A,B, traces from distinct pairs). On scaling, a clear latency increase typically appeared during DSI (Fig. 8B). On average, maximal DSIe in Cs+ amounted to 29.2 ± 1.9% (n = 15; p << 0.05 when compared with the potassium experiments, Mann–Whitney U test), whereas synaptic delay increased from 4.0 ± 0.4 to 4.4 ± 0.4 msec (n = 13; p << 0.05, Wilcoxon's test).
Figure 8C further shows that the latency increase was strongly correlated with the value pertaining to control conditions (Kendall's correlation coefficient, τ = 0.64; n = 13; p < 0.01); this suggests that a common mechanism underlies the increase in synaptic delay in presynaptic Cs+ versus presynaptic K+ and its augmentation during DSIe in Cs+ conditions. Rise time and decay time constants were also found to increase significantly during DSIe: to 2.35 ± 0.23 msec (n = 15; p < 0.05) and to 16.3 ± 1.2 msec (n = 10; p < 0.01, Wilcoxon's test), respectively.
As already mentioned, dialysis of the presynaptic neuron with Cs+ resulted in a marked increase in the mean amplitude of synaptic currents. This increase presumably originated from a widening of the presynaptic action potential and the associated increase of presynaptic calcium transients. If these transients became sufficiently large to approach saturation of the release process, the modifications induced by DSI could translate into gradually smaller inhibition. Such a mechanism has been put forward to explain the reduction of hippocampal DSI in the presence of 4-AP (Varma et al., 2002). To explore this possibility, experiments with presynaptic Cs+ were repeated after reducing the extracellular Ca2+ concentration to recover a mean eIPSC amplitude similar to that of control K+ conditions (Fig. 9A, summary results in B). Under these conditions, the v/m, which had fallen to one-third of the control in Cs+ and normal Ca2+, recovered to values indistinguishable from those in K+ and normal Ca2+ (Fig. 9B, b). Likewise, the eIPSC rise time, which had increased in Cs+ and normal Ca2+, decreased back to 2.09 ± 0.33 msec, a value similar to that observed in K+ (n = 7; p > 0.05, Mann–Whitney U test). Low extracellular calcium also reversed the depression obtained with the paired pulse protocol in normal calcium; the PPR was 104.9 ± 9.6% (n = 6; p << 0.05, Wilcoxon's test). In contrast, the synaptic latency, which had increased in Cs+ and normal Ca2+, was further increased to 4.36 ± 0.53 msec (n = 7; p = 0.05, Wilcoxon's test).
Figure 9.
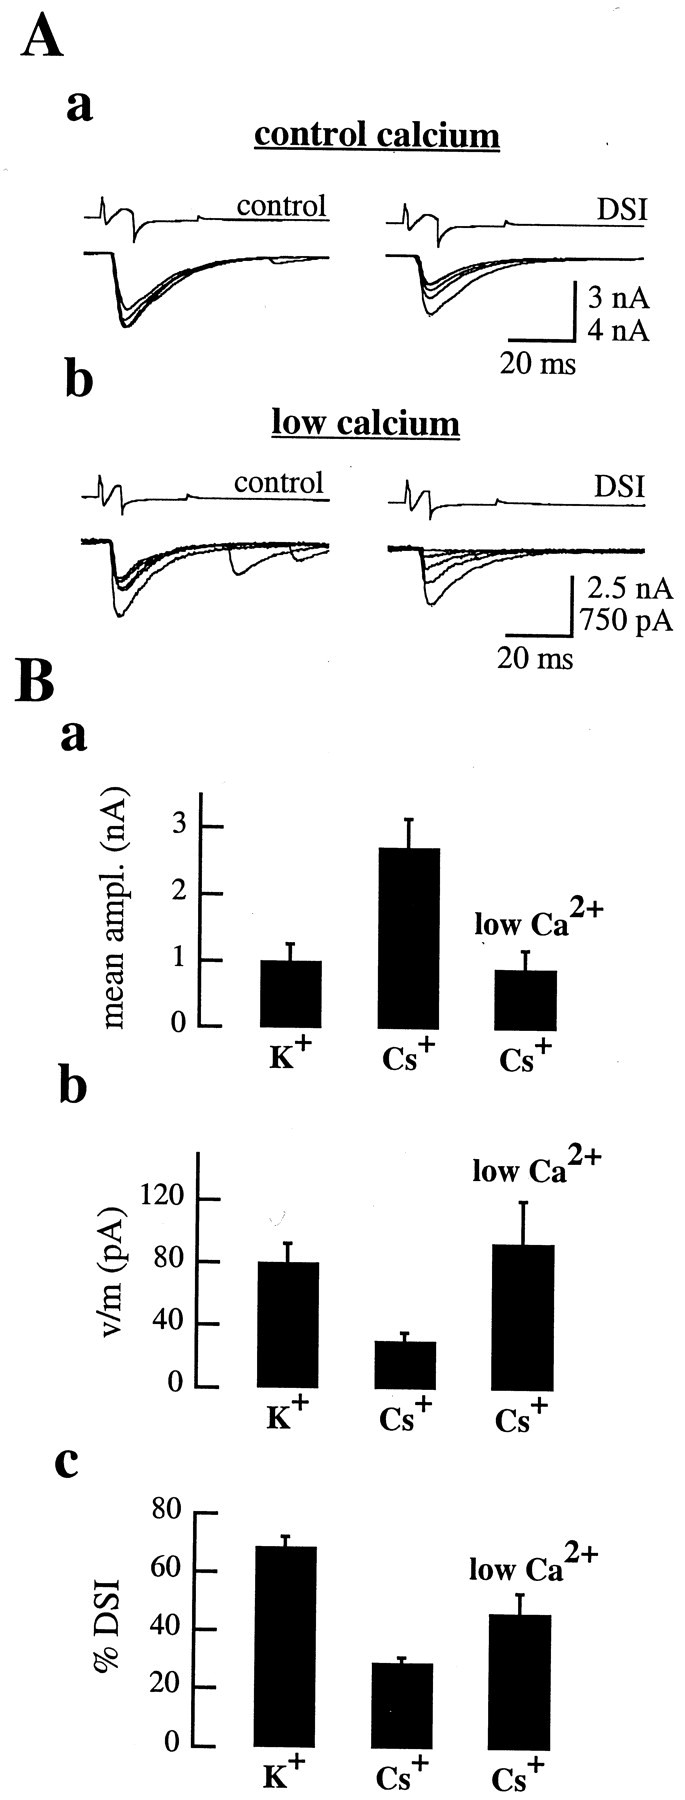
Partial DSI recovery on lowering extracellular calcium in paired recordings with intracellular Cs +. A, Traces from a single paired recording with a Cs +-dialyzed presynaptic interneuron; two DSI trials are shown in normal (2 mm; a) and low (1 mm; b) extracellular calcium. Control currents are shown on the left, and DSI traces are shown on the right. Lowering calcium induced a strong reduction in the mean eIPSC amplitude but only a partial recovery of DSIe, from 32.8±3.9% in control to 40.6±10.8% (n=4 in both conditions). The value of DSIs was monitored in the same trials (traces not shown); no statistical difference was found between control(63.3±3.4%) and low-calcium (56.2±3.2%;p>0.10)conditions,suggesting that, in both cases, the Purkinje cell depolarizations led to the synthesis of similar amounts of endogenous cannabinoids to induce DSI. B, eIPSC mean amplitudes (a), variance-to-mean ratios (b), and DSIe values (c) shown in control pairs in which the presynaptic interneuron was dialyzed with K +, in pairs with presynaptic Cs +, and in pairs where the presynaptic cell was dialyzed with Cs + and the extracellular Ca 2+ concentration was reduced to 1 mm (Cs +, low Ca 2+). a, The mean eIPSC amplitude was similar in K + (1.00 ± 0.25 nA; n = 22) and in Cs + and low Ca 2+ (0.90 ± 0.30 nA; n = 8; p > 0.05) but was strongly increased in Cs + and normal Ca 2+ (2.72 ± 0.43 nA; n = 15). b, The v/m decreased from 80.2 ± 12.4 pA (n = 22 pairs) in K + to 30.8 ± 5.3 pA in Cs + (n = 15; p < 0.05, Mann–Whitney U test); in Cs + and low Ca 2+, this parameter returned to 93.6 ± 27.1 pA, which was statistically indistinguishable from the K + conditions (n = 8; p >> 0.05). c,InCs + and low Ca 2+, DSIe was still significantly lower than in K + but significantly higher than in Cs + and normal Ca 2+.
As far as DSIe was concerned, it did increase in Cs+ and low Ca2+ compared with Cs+ and normal Ca2+ (46.6 ± 6.9%; n = 8; p = 0.02, Wilcoxon's test), but it remained significantly lower than in K+ and normal Ca2+ (Fig. 9B, c; p < 0.01, Mann–Whitney U test).
One possible shortcoming of low extracellular Ca2+ conditions is that they could lead to a decrease of Ca2+-induced endocannabinoid release. Therefore, we performed control experiments to compare DSIm in normal and low Ca2+. We found a value of 39.4 ± 8.1% in low Ca2+, not significantly different from the 47.2 ± 5.2% value obtained in normal Ca2+ in the same experiments (n = 5; p > 0.1, Wilcoxon's test). This indicates that the amount of Ca2+ entering the postsynaptic Purkinje cell in low Ca2+ was still sufficient to saturate DSI and that the reduced calcium entry could not be held responsible for the smaller DSI in Cs+ and low Ca2+ with respect to control conditions in K+.
Three conclusions can be drawn from these results. First, Cs+ interferes with the mechanisms underlying DSIe; this is consistent with the hypothesis that DSIe involves the modulation of K+ channels (Alger et al., 1996). Second, DSIe is actually reduced if the release process approaches saturation, as recently suggested on the basis of 4-AP experiments in the hippocampus (Varma et al., 2002); this is also in line with the notion that a primary target of DSIe is the amplitude of presynaptic Ca2+ transients (Wilson et al., 2001; Diana et al., 2002). Third, it appears that a residual part of DSIe is insensitive to blockage of K+ channels; this component could be linked to the modulation of voltage-dependent Ca2+ currents (Wilson et al., 2001), to the inhibition of the exocytotic step, or to the modulation of the readily releasable pool, as found in other systems (Sakaba and Neher, 2001).
Finally, as explained in Discussion, these experiments also led us to suggest some hypotheses on the sources of the increased eIPSC variability during DSI in control K+ conditions.
Discussion
The various components of DSI
This work allows a quantitative assessment of the various components of DSI. To determine the share of each component, we first note that mIPSCs amount to a surprisingly large proportion of the sIPSC frequency (47%) and cumulative amplitude (21%). These mIPSCs are, according to the results of Figure 1B, reduced by 43.3% during DSI. The frequency of presynaptic action potentials is reduced by 20% (Kreitzer et al., 2002), and, finally, paired recording experiments reveal that the amplitude of eIPSCs (including failures) decreases by 68.8% (Fig. 4). As shown in Appendix, these numbers can be combined together to predict the value of DSIs. The result is 68.4%, which is in good agreement with the experimental value (64.2%) obtained in Figure 1A.
A similar analysis can be performed on the frequency component of DSIs by taking into account the fact that, in paired recordings, the failure rate increases from 1.2 to 20.2% during DSI (Fig. 5). This allows us to predict a frequency component of 39.1% for DSIs also in very good agreement with the observed value of 39.9% (Appendix). The excellent match between predicted and calculated parameters for DSIs indicates that our analysis correctly identifies the various components of DSI and their respective weights.
An interesting outcome of this analysis is the fact that mIPSCs contribute to 42% of the residual sIPSCs at the peak of DSI compared with 21% in the control (cumulative amplitude data). Thus, the relatively low sensitivity of mIPSCs to DSI translates into an increase of their weight to very significant proportions during DSI periods.
On the basis of the above analysis it is possible to ascribe proportions to the various components of DSI identified so far, namely, the decrease in mIPSCs, the decrease in presynaptic firing frequency, and the decrease in eIPSC amplitude. As shown in Appendix, these three processes contribute respectively to 13.4, 23.2, and 63.4% of the reduction of sIPSCs during DSI.
Trial-to-trial variation of presynaptic release signal during DSI
One of the earliest proposals for the mechanism of DSI was that it involved propagation failures in the axon (Alger et al., 1996). This hypothesis is compatible with the finding that DSIs but not DSIm spreads along interneuron axons (Vincent and Marty, 1993), as well as with the demonstration that DSI inhibits presynaptic firing (Kreitzer et al., 2002). We found an increase in the failure rate during DSI, and we also found that the mean amplitude of non-failing events was reduced (Fig. 3). These results could respectively reflect a total stop of propagation in the entire axonal tree and a selective propagation block in axon collaterals. Alternatively, or additionally, they could reflect a general reduction of the release probability within the classical framework of quantal theory.
To test the latter possibility, a quantitative analysis of the v/m was performed, revealing a 2.17-fold increase in DSI compared with the control (Fig. 6). According to Equation 1, the decrease in release probability, p, which accompanies DSI, could account for at least part of the effect. If pctl and pDSI represent the release probability in the control and DSI conditions, respectively, Equation 1 predicts an increase of the v/m by the factor (1 - pDSI)/(1 - pctl). Experiments with presynaptic Cs+ have a mean eIPSC amplitude that is 2.71-fold larger than in control conditions, so that pctl < 1/2.71 = 0.37. By applying Equation 1 to the mean and v/m data in Cs+ and normal Ca2+ and in Cs+ and low Ca2+ (Fig. 9B, a, b), one can calculate that the release probability in Cs+ and low Ca2+ is 0.25. This, together with the ratio of mean currents in control and in Cs+ and low Ca2+ (1.04; Fig. 9B, a), gives an estimate of 0.26 for pctl. Because the value of DSIe is 0.688, pDSI is 0.26 * 0.312 = 0.08, so that (1 - pDSI)/(1 - pctl) = 0.92/0.74 = 1.24. Thus the increase of the v/m is too large to be simply attributable to a decrease in p. The failure of Equation 1, which is based on the analysis of quantal variance, to account for the results indicates that another source of variance participates in the fluctuations observed in DSIe. The most likely explanation is that the presynaptic Ca2+ transients display significant trial-to-trial fluctuations during DSIe. Two mechanistic interpretations can be offered. One would be that the presynaptic conductance changes responsible for the inhibition of firing (Kreitzer et al., 2002) make the invasion of presynaptic terminals unreliable, inducing trial-to-trial variations in the presynaptic depolarizing waveform. This would be in line with the propagation failure hypothesis. The second option is suggested by the recent demonstration that ryanodine-sensitive presynaptic Ca2+ transients shape mIPSCs at this synapse (Llano et al., 2000). It could be that such transients elicit fluctuations in the action potential-evoked presynaptic signals, and that these fluctuations become more prominent during DSI. Thus, a definitive conclusion on the participation of propagation failures in DSI must await experiments with more direct approaches such as simultaneous somatic and terminal recording of the presynaptic interneuron during DSI.
K+-selective conductance may be involved in DSIe
CB1Rs have been reported to upregulate different types of K+ channels (Deadwyler et al., 1993; Mackie et al., 1995; Ho et al., 1999). The paired recording experiments in which presynaptic neurons were perfused with a Cs+-rich solution can be used to sort out the possible role of K+-selective conductances in DSIe.
In experiments with presynaptic Cs+, DSIe was greatly reduced. Part of this effect could be ascribed to the fact that in Cs+, the release probability was close to 1, so that the decrease in presynaptic Ca2+ transient presumably associated with DSIe (Diana et al., 2002) was less effective than in the control. In addition, however, once the Cs+-associated amplitude increase was compensated by decreasing the extracellular Ca2+ concentration, DSIe remained significantly smaller than in the control (Fig. 9). This indicates that, as suggested earlier (Alger et al., 1996; Varma et al., 2002), K+ channels are involved in DSIe. These channels could be the same as the K+ channels implicated in the regulation of presynaptic firing, because Cs+ blocks the cannabinoid-induced outward current, which was suggested to mediate the inhibition of the interneuron spike rate (Kreitzer et al., 2002). However, the substantial amount of DSIe remaining in the Cs+ and low Ca2+ conditions also indicates that a K+ channel modulation is not the only mechanism at work under these conditions. An obvious candidate for the other component of DSI is a CB1R-mediated reduction in voltage-dependent Ca2+ currents, as suggested before (Wilson et al., 2001). Mechanisms acting on the synaptic release machinery and on the readily releasable pool of vesicles must also be considered, in view of the inhibition of the frequency of mIPSCs during cerebellar DSI, and as recently proposed also for hippocampal DSI (Varma et al., 2002). Such mechanisms have actually been suggested in other systems in which synaptic plasticity was associated with increases in latency (Wu and Borst, 1999; Vyshedskiy et al., 2000), which we also observed during DSIe in the Cs+ conditions (Fig. 8).
A strong correlation between the value of the control synaptic latency and its increase during DSI was also found (Fig. 8C). By blocking K + conductances, Cs + increases the duration of action potentials. An augmentation in synaptic delay was previously observed in systems in which presynaptic action potentials were widened pharmacologically (in the neuromuscular junction; Benoit and Mambrini, 1970; Vyshedskiy et al., 2000) or by developmental mechanisms (in the calyx of Held; Taschenberger and von Gersdorff, 2000). Because the calcium inflow primarily takes place on the repolarization phase of an action potential, a delayed and slower repolarization translates into a delayed, longer-lasting, and larger synaptic current (for review, see Lin and Faber, 2002). All results obtained with Cs + conform to these predictions (Fig. 8). At the calyx of Held, latency strictly depends on the Ca 2+ concentration increase (Bollmann et al., 2000; Schneggenburger and Neher, 2000) and on the amplitude of the Ca 2+ currents (Wu and Borst, 1999) reached during presynaptic stimulation; the latency increase that is elicited by DSI in Cs + experiments is therefore most simply explained by a decrease in the amplitude of Ca 2+ currents. The finding that, in Cs + experiments, decreasing the external Ca 2+ concentration similarly leads to a further increase of latency is fully compatible with such a mechanism.
Having established, as we have done, the relative contributions of the different forms of synaptic inhibition making up DSI, the next important step in the DSI field will be to clarify the precise cellular mechanisms underlying these multiple pathways.
Appendix
Here we justify the finding that DSIs, as measured in the experiments of Figure 1A, is accounted for by its various components as derived from mIPSC measurements and from the results of paired recordings.
Frequency analysis
The frequency of sIPSCs, fs, is the sum of the frequency of IPSCs occurring independently of presynaptic action potentials, fm, and of the frequency of events triggered by presynaptic action potentials, fAI:
 |
2 |
The former frequency is assumed to be the same as the frequency of mIPSCs measured in the presence of TTX. The latter frequency is the product of the frequency of presynaptic action potentials, fAP, with the probability of having no transmission failure. Calling FR the failure rate, we obtain:
 |
3 |
We call %fm the percentage of mIPSCs among sIPSCs:
 |
4 |
The remaining fraction of mIPSC frequency during DSI is:
 |
5 |
where fm,DSI and fm,ctl are, respectively, the values of fm during DSI and in the control.
Likewise, the remaining fraction of action potential frequency is:
 |
6 |
and the remaining fraction of sIPSC frequency is:
 |
7 |
Applying Equation 2 to both control and DSI conditions yields, in combination with Equation 7:
 |
8 |
Inserting Equations 3 and 4, we obtain:
 |
9 |
By inserting Equation 6 and applying Equation 3 to the control situation, we obtain:
 |
10 |
This can be rearranged and combined with Equations 4 and 5 to yield:
 |
11 |
Inserting in this equation the proper parameter values [%fm,ctl = 0.47 (Gonzalez, Marty, and Llano, unpublished results); DSIm = 0.433; DSIAP = 0.20 (Kreitzer et al., 2002); FRDSI = 0.202; and FRctl = 0.012] gives DSIf,s = 39.1%, very close to the experimental value given in Figure 1 (39.9%).
Cumulative amplitude analysis
Similar equations can be derived for cumulative amplitudes. However, in this case, failures do not need to be considered, because the percentage of reduction of eIPSCs, DSIe, includes failures. The calculations yield:
 |
12 |
where DSIs is the percentage of reduction of the cumulative amplitude of sIPSCs, and %cm,ctl is the proportion of mIPSCs in the control cumulative amplitude. The numerical value of %cm,ctl is 0.21, and that of DSIe is 68.8%. Entering these values in Equation 12 gives DSIs = 68.4%, close to the measured value of 64.2%.
To calculate the share of the total inhibition that is attributable to the various components of DSI, we note that, of 1 nA of cumulative amplitude of sIPSCs, mIPSC reduction amounts to 0.433 × 0.21 = 0.0909 nA. The reduction attributable to action potential suppression amounts to 0.2 × 0.79 = 0.158 nA. Finally the reduction attributable to eIPSCs after presynaptic firing is 0.684 × 0.8 × 0.79 = 0.432 nA. The proportions of the respective reductions are 13.4, 23.2, and 63.4%.
Footnotes
M.A.D. was supported by European Community Grants ERBFMRXCT980236 and QLG3-CT-2001-02430 and by the Boehringer Ingelheim Foundation. Most of this work was performed in the Department of Cellular Neurobiology, Max-Planck-Institute for Biophysical Chemistry (Goettingen, Germany). We are grateful to the Max-Planck-Society for support. We thank Dr. Christophe Pouzat for sharing analysis software.
Correspondence should be addressed to Dr. Alain Marty, Laboratoire de Physiologie Cérébrale, Université Paris 5, 45 rue des Saints Pères, 75270 Paris Cedex 06, France. E-mail: amarty@biomedicale.univ-paris5.fr.
Copyright © 2003 Society for Neuroscience 0270-6474/03/235906-13$15.00/0
References
- Alger BE, Pitler TA, Wagner JJ, Martin LA, Morishita W, Kirov SA, Lenz RA ( 1996) Retrograde signalling in depolarization-induced suppression of inhibition in rat hippocampal CA1 cells. J Physiol (Lond) 496: 197-209. [DOI] [PMC free article] [PubMed] [Google Scholar]
- Ameri A ( 1999) The effects of cannabinoids on the brain. Prog Neurobiol 58: 315-348. [DOI] [PubMed] [Google Scholar]
- Benoit PR, Mambrini J ( 1970) Modification of transmitter release by ions which prolong the presynaptic action potential. J Physiol (Lond) 210: 681-695. [DOI] [PMC free article] [PubMed] [Google Scholar]
- Bollmann JH, Sakmann B, Borst JG ( 2000) Calcium sensitivity of glutamate release in a calyx-type terminal. Science 289: 953-957. [DOI] [PubMed] [Google Scholar]
- Caillard O, Moreno H, Schwaller B, Llano I, Celio M, Marty A ( 2000) Role of the calcium-binding protein parvalbumin in short-term synaptic plasticity. Proc Natl Acad Sci USA (USA) 97: 13372-13377. [DOI] [PMC free article] [PubMed] [Google Scholar]
- Deadwyler SA, Hampson RE, Bennett BA, Edwards TA, Mu J, Pacheco MA, Ward SJ, Childers SR ( 1993) Cannabinoids modulate potassium current in cultured hippocampal neurons. Receptors Channels 1: 121-134. [PubMed] [Google Scholar]
- Diana MA, Levenes C, Mackie K, Marty A ( 2002) Short-term retrograde inhibition of GABAergic synaptic currents in rat Purkinje cells is mediated by endogenous cannabinoids. J Neurosci 22: 200-208. [DOI] [PMC free article] [PubMed] [Google Scholar]
- Glitsch M, Llano I, Marty A ( 1996) Glutamate as a candidate retrograde messenger at interneurone-Purkinje cell synapses of rat cerebellum. J Physiol (Lond) 497: 531-537. [DOI] [PMC free article] [PubMed] [Google Scholar]
- Glitsch M, Parra P, Llano I ( 2000) The retrograde inhibition of IPSCs in cerebellar Purkinje cells is highly sensitive to intracellular [Ca2 +]. Eur J Neurosci 12: 987-993. [DOI] [PubMed] [Google Scholar]
- Ho BY, Uezono Y, Takada S, Takase I, Izumi F ( 1999) Coupling of the expressed cannabinoid CB1 and CB2 receptors to phospholipase C and G protein-coupled inwardly rectifying K+ channels. Receptors Channels 6: 363-374. [PubMed] [Google Scholar]
- Katona I, Sperlagh B, Sik A, Kafalvi A, Vizi ES, Mackie K, Freund TF ( 1999) Presynaptically located CB1 cannabinoid receptors regulate GABA release from axon terminals of specific hippocampal interneurons. J Neurosci 19: 4544-4558. [DOI] [PMC free article] [PubMed] [Google Scholar]
- Kim J, Alger BE ( 2001) Random response fluctuations lead to spurious paired-pulse facilitation. J Neurosci 21: 9608-9618. [DOI] [PMC free article] [PubMed] [Google Scholar]
- Kreitzer AC, Regehr WG ( 2001) Cerebellar depolarization-induced suppression of inhibition is mediated by endogenous cannabinoids. J Neurosci 21: RC174(1-5). [DOI] [PMC free article] [PubMed] [Google Scholar]
- Kreitzer AC, Carter AG, Regehr WG ( 2002) Inhibition of interneuron firing extends the spread of endocannabinoid signaling in the cerebellum. Neuron 34: 787-796. [DOI] [PubMed] [Google Scholar]
- Lin JW, Faber DS ( 2002) Modulation of synaptic delay during synaptic plasticity. Trends Neurosci 25: 449-455. [DOI] [PubMed] [Google Scholar]
- Llano I, Leresche N, Marty A ( 1991) Calcium entry increases the sensitivity of cerebellar Purkinje cells to applied GABA and decreases inhibitory synaptic currents. Neuron 6: 565-574. [DOI] [PubMed] [Google Scholar]
- Llano I, González J, Caputo C, Lai AF, Blayney LM, Tan YP, Marty A ( 2000) Presynaptic calcium stores underlie large-amplitude miniature IPSCs and spontaneous calcium transients. Nat Neurosci 3: 1256-1265. [DOI] [PubMed] [Google Scholar]
- Mackie K, Lai Y, Westenbroek R, Mitchell R ( 1995) Cannabinoids activate an inwardly rectifying potassium conductance and inhibit Q-type calcium currents in AtT20 cells transfected with rat brain cannabinoid receptor. J Neurosci 15: 6552-6561. [DOI] [PMC free article] [PubMed] [Google Scholar]
- Pitler TA, Alger BE ( 1992) Postsynaptic spike firing reduces synaptic GABAA responses in hippocampal pyramidal cells. J Neurosci 12: 4122-4132. [DOI] [PMC free article] [PubMed] [Google Scholar]
- Pitler TA, Alger BE ( 1994) Depolarization-induced suppression of GABAergic inhibition in rat hippocampal pyramidal cells: G protein involvement in a presynaptic mechanism. Neuron 13: 1447-1455. [DOI] [PubMed] [Google Scholar]
- Pouzat C, Hestrin S ( 1997) Developmental regulation of basket/stellate cell → Purkinje cell synapses in the cerebellum. J Neurosci 17: 9104-9112. [DOI] [PMC free article] [PubMed] [Google Scholar]
- Sakaba T, Neher E ( 2001) Calmodulin mediates rapid recruitment of fast-releasing synaptic vesicles at a calyx-type synapse. Neuron 32: 1119-1131. [DOI] [PubMed] [Google Scholar]
- Schneggenburger R, Neher E ( 2000) Intracellular calcium dependence of transmitter release rates at a fast central synapse. Nature 406: 889-893. [DOI] [PubMed] [Google Scholar]
- Tan YP, Llano I ( 1999) Modulation by K + channels of action potential-evoked intracellular Ca 2+ concentrations rises in rat cerebellar basket cell axons. J Physiol (Lond) 520: 65-78. [DOI] [PMC free article] [PubMed] [Google Scholar]
- Taschenberger H, von Gersdorff H ( 2000) Fine tuning an auditory synapse for speed and fidelity: developmental changes in presynaptic waveform, EPSC kinetics, and synaptic plasticity. J Neurosci 24: 9162-9173. [DOI] [PMC free article] [PubMed] [Google Scholar]
- Tsou K, Mackie K, Sanudo-Pena MC, Walker JM ( 1999) Cannabinoid CB1 receptors are localized primarily on cholecystokinin-containing GABAergic interneurons in the rat hippocampal formation. Neuroscience 93: 969-975. [DOI] [PubMed] [Google Scholar]
- Varma N, Brager DH, Morishita W, Lenz RA, London B, Alger B ( 2002) Presynaptic factors in the regulation of DSI expression in hippocampus. Neuropharmacology 43: 550-562. [DOI] [PubMed] [Google Scholar]
- Vincent P, Marty A ( 1993) Neighboring cerebellar Purkinje cells communicate via retrograde inhibition of common presynaptic interneurons. Neuron 11: 885-893. [DOI] [PubMed] [Google Scholar]
- Vincent P, Marty A ( 1996) Fluctuations of inhibitory postsynaptic currents in Purkinje cells from rat cerebellar slices. J Physiol (Lond) 494: 183-199. [DOI] [PMC free article] [PubMed] [Google Scholar]
- Vincent P, Armstrong CM, Marty A ( 1992) Inhibitory synaptic currents in rat cerebellar Purkinje cells: modulation by postsynaptic depolarization. J Physiol (Lond) 456: 453-471. [DOI] [PMC free article] [PubMed] [Google Scholar]
- Vyshedskiy A, Allana T, Lin JW ( 2000) Analysis of presynaptic Ca 2+ influx and transmitter release kinetics during facilitation at the inhibitor of the crayfish neuromuscular junction. J Neurosci 20: 6326-6332. [DOI] [PMC free article] [PubMed] [Google Scholar]
- Waldeck RF, Pereda A, Faber DS ( 2002) Properties and plasticity of pairedpulse depression at a central synapse. J Neurosci 20: 5312-5320. [DOI] [PMC free article] [PubMed] [Google Scholar]
- Wilson RI, Nicoll RA ( 2001) Endogenous cannabinoids mediate retrograde signalling at hippocampal synapses. Nature 410: 588-592. [DOI] [PubMed] [Google Scholar]
- Wilson RI, Kunos G, Nicoll RA ( 2001) Presynaptic specificity of endocannabinoid signaling in the hippocampus. Neuron 31: 453-462. [DOI] [PubMed] [Google Scholar]
- Wu L-G, Borst JG ( 1999) The reduced release probability of releasable vesicles during recovery from short-term synaptic depression. Neuron 23: 821-832. [DOI] [PubMed] [Google Scholar]
- Yoshida T, Hashimoto K, Zimmer A, Maejima T, Araishi K, Kano M ( 2002) The cannabinoid CB1 receptor mediates retrograde signals for depolarization-induced suppression of inhibition in cerebellar Purkinje cells. J Neurosci 22: 1690-1697. [DOI] [PMC free article] [PubMed] [Google Scholar]