

Abstract
We have used time-lapse multiphoton microscopy to map the migration and settling pattern of GABAergic interneurons that originate in the ganglionic eminence of the ventral forebrain and incorporate into the neocortex of the cerebral hemispheres. Imaging of the surface of the cerebral hemispheres in both explant cultures and brains of living mouse embryos revealed that GABAergic interneurons migrating within the marginal zone originate from three different sources and migrate via distinct and independent streams. After reaching their areal destination, interneurons descend into the underlying cortex to assume positions with isochronically generated, radially derived neurons. The dynamics and pattern of cell migration in the marginal zone (see movies, available at www.jneurosci.org) suggest that the three populations of interneurons respond selectively to distinct local cues for directing their migration to the appropriate areas and layers of the neocortex. This approach opens a new avenue for study of normal and abnormal neuronal migration in their native environment and indicate that interneurons have specific programs for their areal and laminar deployment.
Keywords: neuronal migration, GABAergic interneurons, two-photon microscopy, cortical development, Cajal–Retzius cells, time-lapse microscopy
Introduction
The neurons of the cerebral cortex are generated before birth and are distributed in an inside-out manner, with early generated cells forming deeper layers and subsequently born neurons occupying successively more superficial positions (Angevine and Sidman, 1961) (for review, see Rakic, 1988). Most cortical neurons originate from the proliferative ventricular zone of the dorsal telencephalon (Sidman and Rakic, 1973; Rakic, 1974) and migrate radially to the cortical plate, forming columns of neurons that originate at the same place (Rakic, 1972). These columns are composed of a unique balance of excitatory projection neurons and inhibitory interneurons that subserve the specific areal function (Mountcastle, 1997). It has been shown that a tangential migratory stream exists between the lateral ganglionic eminence (LGE) and the cortex (de Carlos et al., 1996; Tamamaki et al., 1997), and that these streams from the ganglionic eminence (GE) give rise to most of the GABAergic interneurons in the rodent cortex (Anderson et al., 1997; Lavdas et al., 1999; Sussel et al., 1999; Wichterle et al., 2001; Jimenez et al., 2002). In addition, a number of studies also indicate a variety of sources for interneurons, such as the retrobulbar proliferative field (Meyer et al., 1998; Zecevic and Rakic, 2001), the interhemispheric plate (Rakic and Yakovlev, 1968; Monuki et al., 2001), and dorsal proliferative zones (Letinic et al., 2002). Besides being generated in different proliferative zones, cortical interneurons also travel through different telencephalic compartments such as the subventricular zone (Anderson et al., 2001), intermediate zone (IZ; Tamamaki et al., 1997), and marginal zone (MZ; Lavdas et al., 1999; Zecevic and Rakic, 2001) on their way to the dorsal cortex (Marin and Rubenstein, 2001).
After arrival within the appropriate area, interneurons must then incorporate into the proper laminar position within appropriate columns. Because each layer of the cortical plate is generated at a specific time during neurogenesis (Rakic, 1974), radially migrating cells from the dorsal telencephalic proliferative fields must meet, interdigitate, and cooperate with their ventrally originated, tangentially migrating counterparts to form the proper time-dependent inside-out laminar gradients.
How these distantly derived types of neurons integrate into proper areal and laminar positions within the cortex with previously generated radially arrived neurons is not well understood. To address this question, we have used time-lapse multiphoton microscopy in mice to examine the movement of living interneurons during the various phases of their superficial cortical migration and then followed their descent into the cortical plate.
Materials and Methods
Organotypic slices, explants, and whole-brain preparations. Coronal slices at the level of future sensorimotor cortex were obtained as described previously (Haydar et al., 1999). Briefly, freshly isolated whole brains in MEM were cut into 300 μm slices using a tissue chopper and then transferred into serum-free medium (SFM; Neurobasal A medium supplemented with N2, B27, and Glutamax) containing 0.025 nm CellTracker Green (Molecular Probes, Eugene, OR) for 1 hr. Slices were destained for 0.5 hr in fresh SFM and then embedded in growth factor-reduced (GFR) Matrigel on a 15 mm coverslip that was then hardened in a 37°C incubator for 30 min. Explant flaps of the dorsal neocortical wall of the right telencephalic hemisphere were isolated by microdissection after removal of the meninges, and the rostral and lateral edges of the flaps were then notched to enable identification of orientation. For in situ whole-brain experiments, part of the right hemispheres of whole brains were exposed by craniotomy, and the meninges were removed. The isolated head was then immersed in CellTracker Green for 1 hr and washed for 0.5 hr.
In all cases, stained tissue was placed pial surface-down on 15 mm coverslips and embedded in GFR Matrigel. In the case of whole brains, a thin ring of plastic tubing was cemented to the coverslip for support, and the head was placed within the ring and embedded in GFR Matrigel. Coverslips with embedded tissue were then mounted in an RC-25F imaging chamber and bolted into a series 20 platform heater that was stably heated to 37°C using a dual-channel heater controller (Warner Instruments, Hamden, CT). SFM was preheated using an SF-28 in-line heater (Warner) and superfused through the chamber at 0.1 ml/min using a P720 mini peristaltic pump (Instek).
In utero imaging of viable embryos. All surgeries were performed in accordance with all local and federal animal regulations using approved Yale Animal Care and Use Committee protocols. Pregnant mice in the 16th day of gestation were anesthetized using a combination of ketamine and xylazine (10 μl/gm of animal weight of 10 mg of ketamine and 0.2 mg of xylazine in sterile saline by intraperitoneal injection). After midline laparotomy, the individual uterine sacs were exposed, and the embryos were transilluminated by fiber-optic light source. The top of the head was positioned in the frame of hunt chalazion forceps (Storz; Bausch & Lomb Surgical, St. Louis, MO). The uterine musculature and amniotic sac were first fixed using a purse string suture with an 8.0 monofilament atraumatic prolene suture (Prolene Blue Monofilament; Ethicon, Inc., Johnson & Johnson Co.). Consequent incision through the middle of the tissue circle (bordered by a suture ring) exposed the embryo's head. The diameter of the purse string suture was restricted to make primary fixation of the uterus and amniotic sac around the head at the level determined by the interparietale bone and lower portions of frontal bones, preventing escape of the amniotic fluid. The connection of the head and the uterine tissue was permanently fixed with fibrin surgical glue (Tisseel; Baxter Healthcare Corp., Deerfield, IL). Therefore, the dorsal part of neurocranium was exposed for further microsurgery under a stereo microscope while the rest of the embryo remained within the amniotic fluid. This surgery maintained viability during the following procedures: i.e., atraumatic microsurgical exposure of the brain and two-photon microscopy. The approximate dimensions of the ensuing craniotomy were 3 × 3 mm, whereas dural excision and removal of the meninges were 1 × 2 mm. Thereafter, a chamber made of a silicon tube (8 mm high and 10 mm in diameter) was embedded in the fibrin glue around the edges of the uterus. The chamber was then filled with CellTracker Green dye solution for 15 min to label cells of the exposed brain for two-photon microscopy. A pediatric pulse–oximeter device monitored maternal vital signs. Monitoring uterine artery circulation assessed viability of the embryos.
Two-photon imaging and analysis. Stable tissue preparations were imaged using a Zeiss (Thornwood, NY) LSM 510 NLO system with an 8 W pumped Coherent Mira 900F laser (Coherent Laser Group) direct-coupled to an inverted Axiovert 100M microscope (Zeiss; Jena, GmBH). All time-lapse studies were conducted with an oil-immersed 25× 0.8 numerical aperture (NA) Plan-NeoFluar lens. Tissue viability was ensured by minimal laser throughput (typically <5% of 1.2 W mode-locked power) and bidirectional scanning. CellTracker Green was excited at 800 nm. For coronal slices, we routinely collected 20 × 2 μm image stacks 80–100 μm deep within the tissue. For explant flaps, stacks were taken to encompass the entire MZ from the pial surface to the midcortical plate. Time series experiments were conducted by collecting identical stacks at the same tissue position every 4–25 min (see figure legends) for up to 24 hr. The imaging preparation was stable in all planes throughout the experiments. The rate and direction of migrating cells were measured in sequential frames generated from the time series experiments and confirmed by noting the orientation of the slices. In some cases, the stacks were projected into single images to enable following the cells throughout the entire experiment as they changed z positions. For imaging of the in utero preparation, we used a two-photon microscopy system consisting of a BX50 upright confocal microscope (Olympus Optical, Tokyo, Japan), a Tsunami Ti-sapphire laser mode-locked at 800 nm (Spectra-Physics, The Solid-State Laser Co., Mountain View, CA), and a Millennia Xs diode-pumped 8.5 W laser (Spectra-Physics) coupled with Olympus Fluoview FV300 imaging–controlling software. We used an Olympus 40× 0.8 NA water immersion objective.
Immunohistochemistry and electron microscopy. Primary anti-calbindin (1:1000; Chemicon, Temecula, CA), anti-calretinin (1:1000; Chemicon), anti-reelin (1:100; a gift from Dr. M. Ogawa, Riken Brain Science Institute), anti-GABA (1:1000; Sigma, St. Louis, MO), and Dlx-2 (1:150; a gift from J. Rubenstein, University of California San Francisco, San Francisco, CA) were incubated on whole-mount explant flaps or entire telencephali overnight at 4°C followed by species-specific fluorophore-labeled secondary antibodies (see figure legends for details). Explants were mounted in Vectashield (Vector Laboratories, Burlingame, CA) and the mediolateral–rostrocaudal orientation was noted. For DAB reactions, the Vector ABC kit was used according to the manufacturer's suggestions, followed by a β-d-glucose reaction catalyzed by glucose oxidase. Tissue flaps for electron microscopy were fixed in 2% paraformaldehyde and 0.2% glutaraldehyde and then treated with 1% osmium tetroxide in phosphate buffer for 1 hr, dehydrated in ethanol and propylene oxide, and flat-embedded in Durcupan (Fluka, Buchs, Switzerland) between glass slides and coverslips coated with Liquid Release Agent (Electron Microscopy Sciences). Sixty-nanometer-thick serial ultrathin sections were cut from selected blocks on a Reichert ultramicrotome with a diamond knife and collected on Formvar-coated mesh copper grids. The ultrathin sections were stained with uranyl acetate and lead citrate and examined and photographed with a JEOL 1010 transmission electron microscope.
Quantitative analysis of double labeling: calretinin and calbindin. Embryonic day 15 (E15) cortical explant flaps were fixed with 4% paraformaldehyde and stained for both calretinin (1:1000; Swant) and calbindin (1:1000; Chemicon) as described above. The MZs of the cortical flaps were imaged using confocal microscopy. Ten to 15 optical slices at 1 μm steps were taken to include all calretinin and calbindin cells in the MZ. The orientation of processes of both calretinin- and calbindin-positive neurons were measured using the LSM 510 software. Medial was assigned 0°; rostral was assigned 90°; lateral was assigned 180°; and caudal was assigned 270°. Processes that bifurcated or trifurcated were each counted as separate processes. Calretinin counting was done separately and blind to calbindin counting. To test the hypothesis that the samples were drawn from two populations that differ in the general shape of their respective distributions (e.g., differences in dispersion and differences in skewness), we used the Wald–Wolfowitz runs test.
Bromodeoxyuridine injections. Bromodeoxyuridine (BrdU; 50 μg/gm) was injected into pregnant reeler females (Relnrl, BALB/c) at E13, E15, and E17. Wild-type pups were killed and transcardially perfused at postnatal day 7 (P7) with 4% paraformaldehyde. PCR was used to determine the genotypes of the pups. Primer sequences were given by D'Arcangelo et al. (1996). The brains were dissected out and drop-fixed for 48 hr in 4% paraformaldehyde. Three coronal slices from each of three brains were used for quantitation. One hundred-micrometer-thick sections were cut on a standard vibratome. The slices were treated with 2N HCl for 20 min at room temperature and then washed three times for 10 min with PBS. The slices were then incubated in anti-BrdU (1:100; Becton Dickinson, Mountain View, CA) for 48 hr at 4°C. They were then washed three times for 10 min each time with PBS and incubated for another 48 hr with anti-calbindin (1:1000; Chemicon). Subsequently, the slices were incubated with species-specific fluorophore-labeled secondary antibodies at room temperature, counterstained with propidium iodide, and mounted in Vectashield (Vector Laboratories).
Quantitative analysis of double labeling: BrdU and calbindin. Images were taken with a confocal Zeiss LSM 510 NLO system using a 25× 0.8 NA Plan-NeoFluar lens. Images were collected at the medial-dorsal telencephalon at the level of the hippocampus. Stacks of 10 optical slices at 1 μm steps were taken for each image. Four separate images were needed to span the full length of the cortex from the pia to the white mater. These images were made into one montage using Photoshop 6.0 (Adobe). Calbindin-positive cells and those double-labeled with BrdU were counted in Photoshop 6.0. An eight-tiered grid was overlayed on top of all 10 optical slice images, and positively labeled cells were assigned to each tier depending on their placement. Tier 1 started at the top of the pia, and tier 8 ended in the white matter. Each tier was equal in width and height. All counting was done blind.
Results
Migrating streams of GABAergic interneurons in the MZ
To determine the origin and areal distribution of GABAergic interneurons in the MZ, we imaged calbindin-stained interneurons in the MZ of whole-mounted brains at E11.5 to E14 (Fig. 1). Calbindin is a marker for migrating GABAergic interneurons from the GE during these embryonic ages (Anderson et al., 1997), and staining with this marker revealed the emergence and gradual spread of interneurons over this period (Fig. 1). At E11.5, the first generation of interneurons emerge on the dorsal surface of the cerebral vesicle (Fig. 1A). These cells originate from two distinct areas: one situated caudally (Fig. 1A, I) and the other rostrally (Fig. 1A, II). The pattern and orientation of migrating cells indicate that stream I starts from caudal portions of the cerebral vesicle and migrates in a lateral to medial direction (Fig. 1A, arrows). Over time, migrating cells from this stream become progressively distributed more rostrally; however, cells continue to migrate in a lateral to medial direction, so that the entire hemisphere eventually becomes covered by a wave of cells originating caudally and moving rostrally. Examination of the series of experiments performed at different ages suggests that stream I originates from the caudal ganglionic eminence (Anderson et al., 2001; Nery et al., 2002), whereas the medial ganglionic eminence may contribute to the middle and rostral portions of the stream.
Figure 1.
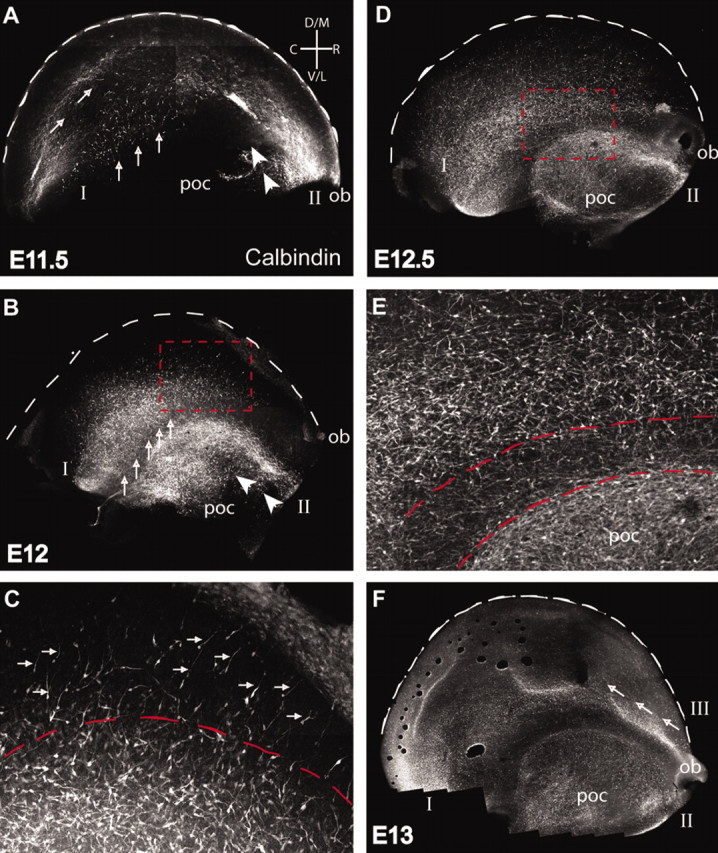
The telencephalic spread of ventrally derived interneurons occurs in three streams. Calbindin- immunopositive cells (white) in the MZ at various embryonic ages are shown in lateral views of whole-mount hemisphere preparations. ob, Position of olfactory bulb at the rostral end of the telencephalic vesicle. Theses series of images were taken from the pial surface. The brightly stained cells are at the surface of the telencephalon and are at the same depth as Cajal–Retzius cells. Similar experiments were performed with both calbindin and CR-50 to localize the relative depth of the calbindin interneurons imaged (data not shown). The less brightly stained cells are farther below the pial surface. Two streams of migrating interneurons emerge as early as E11.5 A, Stream I moves from a caudal to rostral and lateral to medial direction (arrow). Stream II moves in a rostral to caudal direction (arrowheads) and is confined to ventral cortical areas such as the poc. On E12 (B) and E12.5 (D), stream I extends over the lateral and rostral surface of the dorsal telencephalon, whereas stream II extends caudally over the ventral telencephalon. The boxed region in B is shown at a higher magnification in C. Each stream has two components (C): an initial wave of interneurons oriented toward the leading edge of the stream (small arrows) and a subsequent front of cells with multiple orientations (below dashed line). The boxed region inDis shown at a higher magnification inE. Streams I and II in E remain segregated from each other by a cell-sparse gap (between red dashed lines). A third stream (III) emerges just dorsal to the olfactory bulb at E13 (F) and moves in a rostral to caudal direction (arrows). D, Dorsal; M, medial; C, caudal; R, rostral; V, ventral; L, lateral (n = 4 brains for each age).
Cells in stream II originate from the rostral end of the brain ventral to the olfactory bulb and migrate caudally (Fig. 1A, arrowheads). This stream is present at the cortical surface simultaneously with cells of stream I, but there is no mixing between cells of streams I and II (Fig. 1B,D,E). Stream II cells are confined to a ventral area of the cortex defined as the primary olfactory cortex (poc; de Carlos et al., 1996).
By E12, the edges of stream I have expanded medially toward the midline and rostrally toward the olfactory bulb (Fig. 1B, arrows), and stream II has completely covered the area of the poc (Fig. 1B, arrowheads). Thus, although occurring simultaneously, streams I and II remain segregated. There is always a clearly defined cell-sparse region where the two streams avoid each other (Fig. 1, B, line of arrows, E, between dashed lines). Importantly, orientations of interneurons change as the stream spreads over the cortex. Most cells at the leading edge of stream I have their leading processes oriented medially toward areas not yet populated by the stream (Fig. 1C, arrows). However, in lateral areas that are already covered, the leading processes of the interneurons are oriented in various directions (Fig. 1C, underneath dashed line). The interneurons in stream I reach more medial areas of the cortical surface by E12.5 (Fig. 1D). The change in the size of stream I from E11.5 to E12.5 (Fig. 1, compare A, D) shows the massive dispersion of these neurons across the surface of the brain that is achieved in just 24 hr.
A third stream of calbindin-positive cells emerges at E13 from the rostral end of the cerebral vesicle (Fig. 1F, arrows). This wave of cells, named stream III, originates dorsal to the olfactory bulb. Although the exact source of stream III is unknown, possible sites include rostral portions of the striatal anlage and the retrobulbar proliferative field (Meyer et al., 1998; Zecevic and Rakic, 2001) as well as the interhemispheric plate (Rakic and Yakovlev, 1968; Monuki et al., 2001). Thus, cells migrate posteriorly in a well confined stream that eventually intermixes with stream I (Fig. 1F).
Areal allocation of GABAergic interneurons in the MZ
By E14 (data not shown), the MZ had thickened to an extent that calbindin-positive cells could not be observed in the whole mounts. However, cytological examination indicates that the MZ had split into two distinct strata by E14. The CR-50 monoclonal antibody-positive Cajal–Retzius cells (C–R cells) are situated most superficially, and the migrating GABAergic interneurons are located below them. To better understand this apparent architectonic change, we analyzed more closely the cellular constituents of the MZ at E15, when this bilaminar pattern becomes even more pronounced. We made both coronal slices and explant flaps of the cortex to examine the location and orientation of C–R cells. The upper stratum of the MZ at E15 was occupied by the C–R cells, consisting of large cell bodies and usually one tangentially oriented process labeled by the CR-50 antibody (Fig. 2A,B). Below these cells, but still within the MZ, were smaller tangentially oriented bipolar cells (Fig. 2B, arrowheads). Underneath these bipolar cells was situated the cell-dense cortical plate (Fig. 2B).
Figure 2.

The MZ is stratified with superficial C–R cells and deeper-migrating interneurons. A, Tangential view of the MZ after immunohistochemical staining for the CR-50 reelin antibody. Some C–R cell processes are grouped along orthogonal axes forming a distinct rectilinear pattern. A coronal semithin section of an E15 cortex stained for CR-50 reelin (brown) and counterstained with toluidine blue (B) illustrates the stratification. Red arrowheads denote the deeper tangentially oriented migrating cells. Electron micrographs from tangential sections though the MZ demonstrate the large C–R cells (C) often with processes oriented orthogonal to each other. Smaller cells with migrating morphology (D) lie deep to the C–R cells. Scale bars (C, D), 10μm.
We next performed electron microscopy on E15 cortical explant flaps to characterize the orientation of the C–R cells (Fig. 2C). A dorsal en face view shows the approximately perpendicular arrangement of neighboring C–R cell bodies and their processes. This orthogonal arrangement of some MZ cells, described previously by Ramon y Cajal (1911) and Zecevic and Rakic (2001), suggested that the orientation of some groups of C–R cells conform to a specified rectangular pattern. Other groups of C–R cells, however, did not follow this orthogonal arrangement. Smaller tangentially oriented cells (Fig. 2D) were located below the C–R cells.
We next performed immunohistochemical analysis of the MZ at E15 to understand the relationship between the C–R cells and the migrating interneurons. By this time, the MZ could be divided into superficial (1–7 μm from the pial surface) and deep (8–15 μm from the pial surface) strata (Fig. 3). The superficial stratum populated primarily by C–R cells immunolabeled with CR-50 (Fig. 3A–C) and calretinin antibodies (Fig. 3A). In addition, long axonal processes stained with GABA most likely originated from either the zona incerta of the ventral thalamus (Dammerman et al., 2000) or the underlying GABAergic interneurons (Fig. 3B). Although Dlx-2 staining did occur in this superficial stratum (Fig. 3C), this staining pattern did not colocalize with the CR-50 staining (Fig. 3C), suggesting that most of the CR-50-positive cells were derived from the dorsal telencephalon rather than the GE. In contrast, the deep stratum was sparsely populated with CR cells (Fig. 3D–F) and contained mostly migrating interneurons positively stained for calbindin (Fig. 3D), GABA (Fig. 3E), and Dlx-2 (Fig. 3F), indicating their phenotype and origin from the GE.
Figure 3.
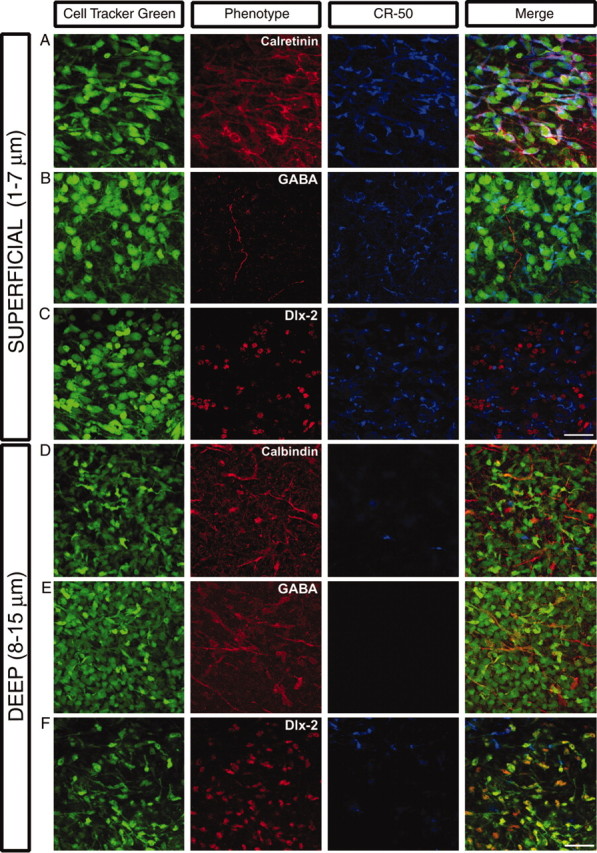
Phenotypic characterization of the superficial and deep strata of the MZ.A–F, En face confocal sections taken through superficial(1–7μm;A–C) and deep (8–15μm;D–F) levels of the E15 MZ. Cortical flaps were triple-stained for CellTracker Green (green), CR-50 (blue), and GABA, calretinin, calbindin, or Dlx-2 (red). Most of the cells in the superficial stratum of the MZ colabel for calretinin and CR-50 (A). These CR-50 cells, however, do not colabel with GABA (B) or with Dlx-2 (C). Rather, long axonal projections labeled with GABA, such as the one shown in B. Clusters of Dlx-2-labeled cells (C) did appear in this superficial stratum, but these cells did not colabel with CR-50. Tangentially oriented cells in the deep stratum of the MZ labeled with calbindin (D), GABA (E), and Dlx-2 (F). The deep stratum was relatively devoid of CR-50 labeling (D–F). Scale bars (C, F), 50 μm.
To observe the direction of migration of GABAergic interneurons through the MZ between E12 and E15, we used two-photon microscopy with three separate approaches for time-lapse experiments (Fig. 4B–D). The organotypic coronal slices showed bipolar interneurons migrating along the surface of the cortical plate (movie 1, available at www.jneurosci.org). We found that interneurons migrated not only in the expected lateral to medial direction, consistent with their ventral origin, but also in the opposite medial to lateral direction (white arrowheads in movie 1, available at www.jneurosci.org). This shows for the first time that interneurons in the MZ can migrate in several different directions that were not detected previously in static light and electron microscopic preparations.
Figure 4.

A multifaceted approach to imaging migrating cells. Four preparations constituted a multifaceted approach for imaging migrating cells: live in utero embryonic cortices (A), in situ whole brains (B), tangential cortical explants (C), and organotypic coronal slices (D). E, In utero en face view of the MZ at E16. F, Similar two-photon image of a CellTracker Green-stained MZ of an E14 in situ whole brain. G, Two-photon image of a CellTracker Green-stained MZ of an E15 in vitro tangential cortical explant. The multidirectional nature of the tangentially oriented cells found in the cortical explant (G) was confirmed in both the in situ whole brain (F) and in utero whole brain (E) preparations. Scale bars (E, G), 50 μm.
To examine cell movement in more detail and in real time, we made explant flaps of the dorsal neocortical wall from E15 mouse embryos (Fig. 4C,G). This approach allowed us to image the surface of the cortex and to follow the tangential migration of a larger population of interneurons. Not only did cells move in both medial and lateral directions, but they also moved in rostral and caudal directions (movie 2, available at www.jneurosci.org). Quantitation of the time-lapse experiments showed that interneurons migrated at a relatively slow speed (3.7 ± 0.4 μm/hr; n = 25) in multiple directions.
To ensure that the migration pattern in the explants was not an artifact attributable to disruption of the morphogen gradients that exist across the intact cerebral wall (Bishop et al., 2000; Fukuchi-Shimogori and Grove, 2001), we imaged embryonic brains in situ over time (Fig. 4B,F; movie 3, available at www.jneurosci.org). The area imaged was in the rostral and medial area of the brain at E14. Cells migrated faster than in explants (67.3 ± 7.6 μm/hr; n = 18) and predominantly medially and caudally. The fast-moving cells imaged in this experiment were part of a long-range migration at the leading edges of streams I and III (Fig. 1F, area near red arrows) that moved predominantly in the medial and caudal directions.
In contrast to the fast migration of cells engaged in the stream migration, we found that the slow multidirectional movement observed first in the explants represents a local positioning phase before these interneurons descend into the cortical plate. Two examples of this are shown in a higher magnification taken from an E12 whole-mounted brain (Fig. 1, C, cells underneath dotted line, E, area above two dashed lines) where these cells position themselves in various directions.
To determine more precisely the influence of any potential in vitro artifacts, we developed an original approach that enabled us to look at the MZ in the living mouse embryos in utero at E16 (Fig. 4A,E). These images confirmed both the multidirectional orientation of C–R cells and the similar arrangement in orientation of leading processes of interneurons located below them. This was further evidence that the multidirectional orientations found in our in vitro explant data were accurate and not attributable to disruption of morphogen gradients. These images are the first documented in utero imaging of the surface of the viable developing neocortex using multiphoton microscopy.
The multidirectionality of both the C–R cell processes and the interneuron migration pattern in the MZ as well as their close apposition to each other led us to ask two questions. First, are the orientations of these two populations of cells specific or random? Second, if there is a correlation between the orientations of these two populations, could C–R cells be providing cues to underlying migrating interneurons, or are both populations orienting to the same cues?
We performed an analysis of the directionality of C–R cell processes and leading processes of migrating interneurons in the MZ using calretinin and calbindin double labeling of E15 explant flaps (Fig. 5C). The entire dorsal telencephalic field was sampled using confocal microscopy to optically section 10–15 μm into the MZ using 1 μm steps (a total of 20 fields of view taken from four brains). Calretinin, a marker of C–R cells in the rodent cortex (del Rio et al., 1995), allowed us to visualize the direction of the long processes of the C–R cells (Fig. 3A) and thereby to measure their relative orientation using the telencephalic poles as a reference. We assumed that the direction of the long leading process of calbindin-positive interneurons in fixed tissue reflected the actual direction of migration, as suggested by our time-lapse movies (movie 3, available at www.jneurosci.org).
Figure 5.

Comparison of the orientations of calretinin- and calbindin-positive neurons in the MZ. A, Distribution of calretinin-positive cell orientation in the MZ of E15 cortices (n = 883). B, Distribution of the orientation of calbindin-positive leading processes (n = 1809). In the case in which the leading process bifurcated or trifurcated, all processes were measured. Multiple orientations were measured for each population of cells (A, B); however, there was a predominance of cells oriented in the rostral, caudal, and lateral directions (A, B, D). Both the calretinin (A) and calbindin (B) measurements were taken from double-labeling experiments and therefore are from the same fields of view (fields of view, 20; brains, 4). Fields of view were randomly sampled across the entire dorsal telencephalic field. C, Double-labeling immunohistochemistry of the MZ of an E15 tangential cortical explant. Calretinin-positive cells are in red, and calbindin-positive cells are in green. The two populations of cells do not align along each other's processes (C); however, their overall distributions of orientation (D) are similar. This conclusion was confirmed using the Wald–Wolfowitz runs test (Z = 1.4878; p = 0.1368), which compares the relative shape of two distributions. C, Caudal; L, lateral; M, medial; R, rostral. Scale bar (C), 50 μm.
As expected from our previous data (Fig. 2A,D), both the calretinin-positive (n = 883) and calbindin-positive (n = 1809) cells were oriented in many directions (Fig. 5A,B). However, χ 2 analysis showed that these two distributions were both significantly different from frequencies expected if the cells were equally distributed in all directions (χ 2 = 90.376; p < 0.001 for calretinin cells; χ 2 = 67.960; p < 0.001 for calbindin cells). Thus, these two populations of cells were not random in their orientation. In fact, many cells in both populations tended to be oriented in the rostral, caudal, or lateral direction, whereas the medial direction was least represented (Fig. 5A,B,D).
Next, we compared the distribution of orientations of calretinin cells to the distribution of orientation of calbindin cells. The reason we did this was to see whether the two distributions were similar (Fig. 5D). To test this, we used the Wald–Wolfowitz runs test, which determines whether two samples are drawn from two populations that differ in the general shape of their respective distributions (i.e., differences in dispersion and differences in skewness). The results demonstrated that the samples were drawn from the same population (Z = 1.4878; p = 0.1368), suggesting that C–R cell and interneuron orientations were similar. This evidence supports our conclusion that the overlying C–R cells could provide positional cues for the migrating interneurons below them. In fact, a recent study showed that a lack of C–R cells as well as subplate neurons in Emx 1/2 double-mutant cerebral cortex is associated with abnormal tangential migration from the GE (Shinozaki et al., 2002). However, if C–R cells do indeed provide guidance cues to the underlying interneurons, then it is not contact-mediated, because the processes of calretinin- and calbindin-positive cells were rarely demonstrated to be touching (Fig. 5C).
Descent and laminar settling of GABAergic interneurons
After the local positioning phase, interneurons in the MZ slowed down and dove into the underlying cortical plate (Fig. 6A,B; movies 4, 5, available at www.jneurosci.org). Interneuron integration began with an extension of their long leading process from the MZ into the cortical plate (CP) and culminated in somal translocation into the cortical plate (Fig. 6A, movie 4, available at www.jneurosci.org). Similar migratory behavior of interneurons in the MZ has recently been documented by Polleux et al. (2002). An en face view of the MZ shows the same process as a tangentially migrating cell dives into the cortical plate and disappears from the field of view (Fig. 6B, movie 5, available at www.jneurosci.org).
Figure 6.
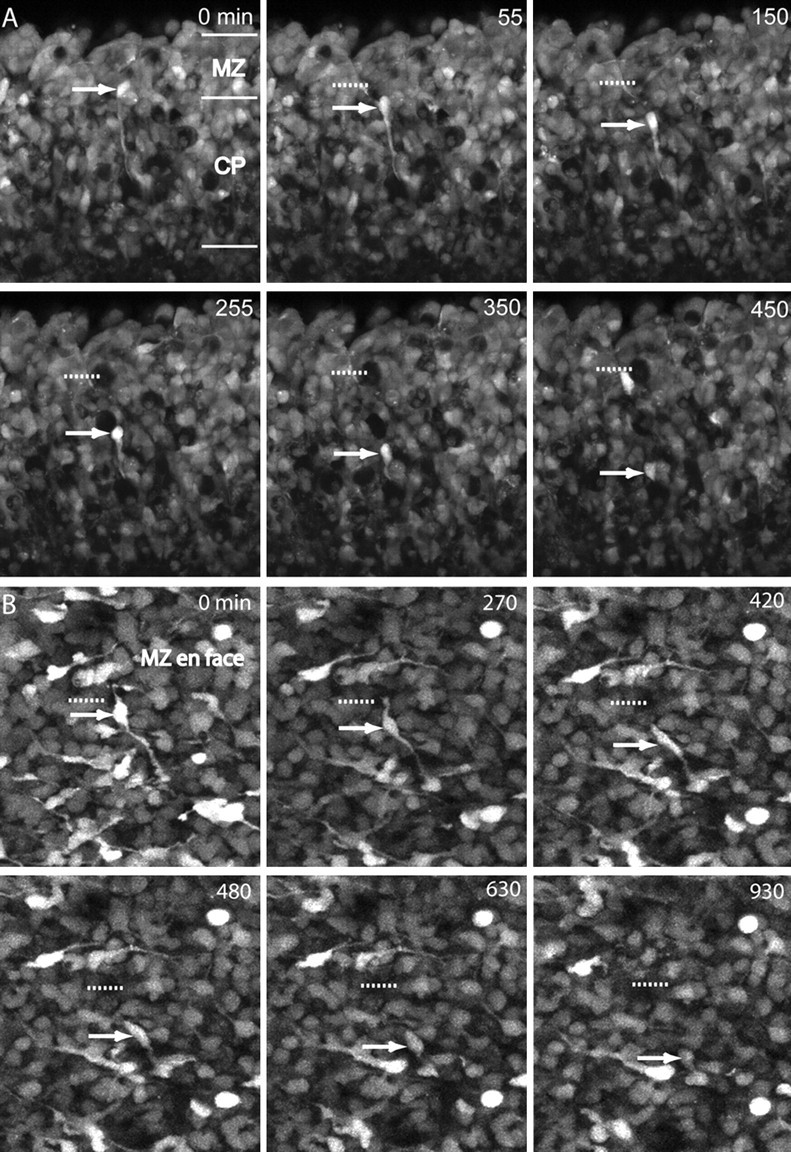
A, Time-lapse imaging of an E14 coronal slice in the MZ and CP stained with CellTracker Green. A downwardly migrating cell originating in the MZ (red arrow) moves toward its eventual position in the CP. The cell translocates its cell body toward the end of its leading process. The red dashed line shows the starting position of the cell body. The number in the top right corner is the time in minutes. B, Time lapse imaging of an E15 cortical flap stained with CellTracker Green. This series of images depicts another cell descending into the CP from the MZ from an en face view. The cell body (red arrow) follows its leading process into the depth of the explant flap, where it disappears from the field of view. The red dashed line shows the starting point of the cell body. Scale bars (A, B), 50 μm.
Time-lapse imaging of interneurons just before they descend into the cortical plate suggests that cues present in the underlying layers determine whether the interneuron will descend. Figure 7 shows a migrating interneuron in the MZ with a long leading process extending down into the full length of the cortical plate. Time-lapse analysis (movie 6, available at www.jneurosci.org) and still frames (Fig. 7) show the extension, withdrawal, extension, and finally withdrawal of the leading process before the interneuron continues to migrate tangentially. In this case, the cell does not descend into the cortical plate, even though it extensively searches the underlying layers. Contrast this migration with that of the descending interneuron to the left of this cell in movie 6 (available at www.jneurosci.org). It rapidly descends from the MZ to finally position itself in the layers of the cortical plate. (Fig. 8A). This process of cortical plate integration marks the third and final stage of interneuron migration from the MZ.
Figure 7.
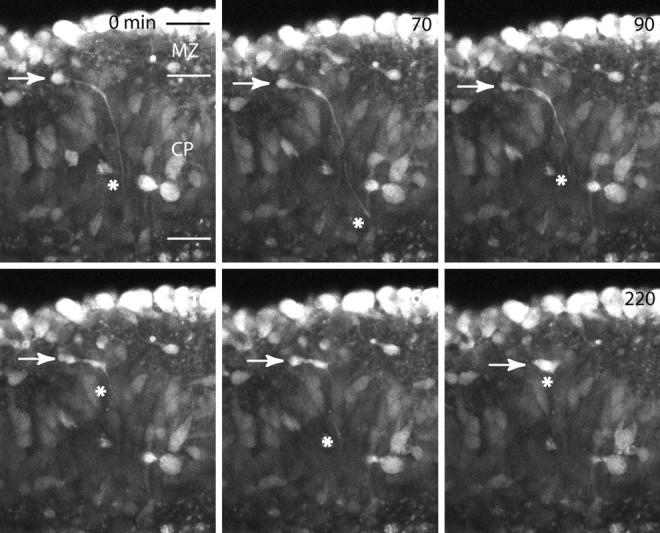
Time-lapse imaging of an E15 coronal slice stained with CellTracker Green. The cell (white arrow) migrates tangentially from left to right in the MZ. It bifurcates its leading process and sends a long process into the cortical plate (red asterisk). The leading process extends, retracts, extends, and retracts again over the course of the imaging session before it continues to migrate tangentially toward the right. The behavior noted is consistent with the hypothesis that the migrating cell uses its leading process to search the underlying CP before entering it. In this case, the cell continues to migrate tangentially without entering the CP. Scale bar, 50 μm.
Figure 8.
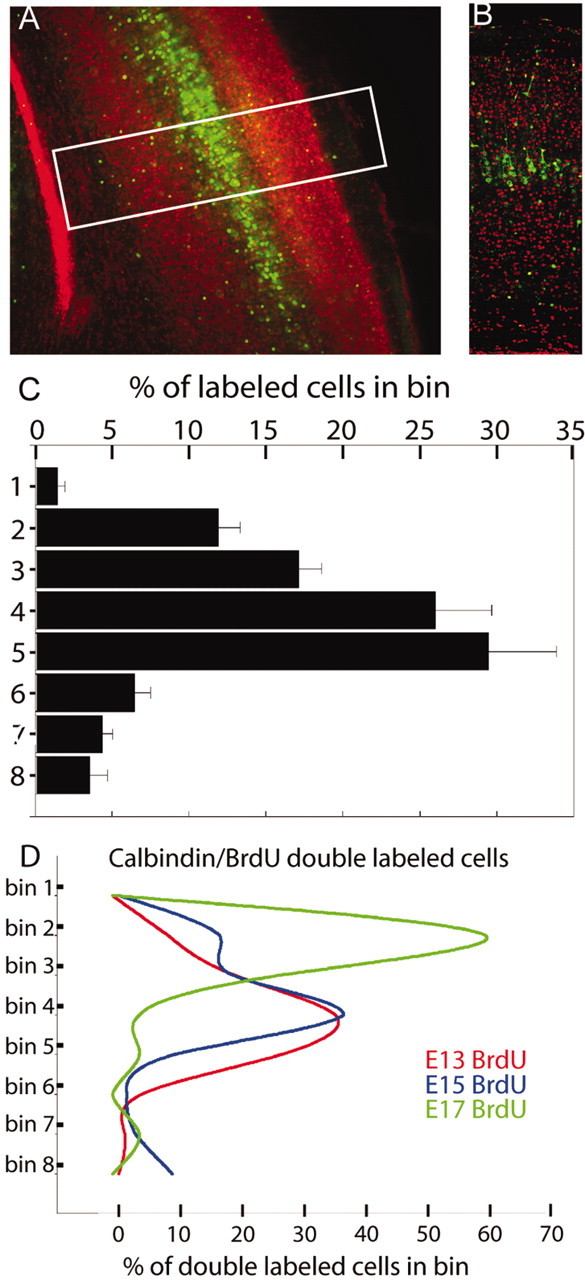
Calbindin-positive cell distribution in mouse P7 cortex. Calbindin is labeled in green, and propidium iodide labels cell nuclei in red. A, Low-power views (10×) of the cortex. A prominent band of calbindin-positive cells occurs in middle layers of the cortex. B, Corresponding montage of sections taken at higher power (25×; white rectangle in A as an example). C, To quantify the distribution of calbindin-labeled cells in the cortex, a grid made up of eight equally sized bins was overlayed on top of images such as those shown in B. The percentage of labeled cells in each bin is depicted in C. Bin 1 was positioned starting at the pia, and bin 8 fell within the white matter. D, Comparison of the distribution of double-labeled calbindin and BrdU cells in the mouse P7 cortex. The y-axis represents the eight bins of a counting grid similar to that used in B and C. An inside-out settling pattern in the cortex occurs with calbindin-positive cells injected with BrdU on E13 (red), E15 (blue), and E17 (green) (n = 3 slices for each condition). Each field of view was composed of 10 optical sections imaged 1 μm apart.
To determine with certainty the final position of these interneurons in the postnatal cortex, we injected pregnant mice at E13, E15, and E17 with BrdU (50 μg/gm of body weight) and performed immunohistochemistry on the brains of offspring aged P7. We triple labeled each brain section with propidium iodide (PI) to show cortical lamina, BrdU antibody to elucidate the time of origin, and calbindin to label the interneurons.
Our previous analysis of the embryonic cortex revealed that calbindin, one of several calcium-binding proteins expressed in the brain, preferentially labels the ventrally derived GABAergic interneurons (Fig. 3D–F). In addition, other studies have shown that calbindin is a specific marker for the double-bouquet sub-population of interneurons in the postnatal cortex (Hendry et al., 1989; Van Brederode et al., 1990; Gogelia and Hamori, 1992). We chose to specifically analyze calbindin immunoreactivity at P7 for a number of reasons. We wanted to make sure that the calbindin-positive cells we stained in embryos were part of the same cell population we analyzed postnatally. There is a documented developmental shift of some calbindin cells to parvalbumin immunoreactivity, but this occurs only after P14 in rodents (Alcantara et al., 1996). Second, some pyramidal-like cells in layers II–IV begin to express calbindin but not until after P7 (Alcantara et al., 1993; reviewed in Hof et al., 1999). These calbindin-positive pyramidal cells tend to be lightly stained and do not have processes (Sanchez et al., 1992). By restricting our analysis to P7 mice, we therefore avoided these developmental changes in calbindin immunoreactivity from obscuring our results.
Low magnification of P7 cortex stained for PI and calbindin shows the relationship between cortical lamina and calbindin staining (Fig. 8A–C). The cortex displays a regular lamination pattern with a band of calbindin-positive cells located throughout the middle of the cortical plate in presumptive layers IV and V (Fig. 8A,B). A recent paper (Magdaleno et al., 2002) also showed a regular lamination pattern for calbindin-positive cells in wild-type P26 cerebral cortex.
To quantify the distribution of calbindin-positive cells, we counted the percentage of labeled cells within a grid made up of eight equally sized bins (Magdaleno et al., 2002). The grid was overlayed on top of each image, with bin 1 starting at the pia and bin 8 ending in the white matter. The majority of calbindin-positive cells in the cortex accumulated in bins 4 and 5 (55 ± 3%) with a secondary accumulation in bins 2 and 3 (29 ± 3%; Fig. 8C).
We then quantified double-labeled cells for calbindin and BrdU injected at E13, E15, and E17 to elucidate the time of origin. Calbindin-positive cells born on E13 and analyzed at P7 settle predominantly in bins 3–5 (83 ± 2%; Fig. 8D). Calbindin-positive cells born on E15 accumulated predominanatly in bins 2–4 (74 ± 2%; Fig. 8D), whereas calbindin-positive cells born on E17 resided mostly in bins 2 and 3 (87 ± 12%; Fig. 8D). Therefore, these results revealed an inside-out pattern of laminar organization (Fig. 8D), as previously described for GABAergic cells (Miller, 1985; Cavanagh and Parnavelas, 1988).
Discussion
The phenomenon of radial neuronal migration from the ventricular zone (VZ) to the cortical plate was initially inferred from observations made on histological preparations (His, 1874; Ramon y Cajal, 1911). The basic mechanisms used in radial neuronal migration, including the role of neuron–glia interactions and differential cell surface adhesion, were elucidated by the use of a combination of [3H]thymidine labeling, Golgi impregnation, and three-dimensional reconstructions from electron microscopic serial sections (Rakic, 1972, 1988). More recently, the ventral origin of GABAergic neurons and the patterns of their tangential migration have been elaborated using class-specific immunolabeling and retroviral gene transfer methods (Anderson et al., 1997; Lavdas et al., 1999; Zhu et al., 1999; Letinic and Rakic, 2001; Wichterle et al., 2001). Here, we provide insight into how these two classes of neurons cooperate to establish brain cortical architecture.
The present study is the first documented in utero imaging of neuronal migration in the murine embryonic cortex using multiphoton microscopy. We took advantage of the reduced phototoxicity and increased tissue penetration (Denk et al., 1990; Centonze and White, 1998) inherent in multiphoton live imaging to analyze the migration patterns of GE-derived cells from global, regional, and local perspectives. This new approach enabled the observation of properties of neuronal migration that were undetectable using previously available methods. Together, our data show that areal and laminar positioning of GABAergic interneurons involve different mechanisms and are likely to be regulated by distinct molecular cues present in the dorsal neocortical wall.
Areal distribution
Previous results, primarily relying on coronal slice preparations, have illustrated predominant ventral to dorsal migratory routes for tangential migration in the MZ. This view is accurate but insufficient to explain the entire range of migration profiles and settling patterns of interneurons during cortical development. Several reviews have postulated multiple sources and migratory routes of telencephalic invasion (His, 1874; Corbin et al., 2001; Maricich et al., 2001; Marin and Rubenstein, 2001). The present multifaceted approach has uncovered three streams of tangentially migrating cells in the MZ that emerge at different times during development and move in distinct and at times opposite directions across the surface of the telencephalon (Fig. 9A, movie 2, available at www.jneurosci.org).
Figure 9.

Two models depicting the long-range migration of interneurons in the MZ and their eventual integration into the cortical plate with isochronically generated radial migrating neurons. A, Three predominant streams of migrating interneurons in the marginal zone of the developing cortex: I, a caudal to rostral and lateral to medial stream emerging from the caudal and medial ganglionic eminences (green and yellow, respectively); II, a rostral to caudal stream confined to the ventral telencephalon (orange); and III, a rostral to caudal stream emerging dorsal to the olfactory bulb (red). B, Model for local positioning of migrating interneurons. Radial glia (blue) support the radial migration of dorsally derived neurons (yellow) to the CP. In the MZ, the deep tangentially migrating interneurons (red) are located beneath the C–R cells (green). At the end of their local positioning within the MZ, migrating interneurons turn and incorporate into the CP using either radial glial cell processes or neuronal apical dendrites as guides. R, Rostral; C, caudal; V, ventral; D, dorsal; L, lateral; M, medial; RG, radial glia; SV, subventricular.
Tangential views of the cortical surface also revealed a secondary short-range positioning of cells that was much slower than the initial long-range phase. Time-lapse imaging showed that individual cells move in different directions (movie 2, available at www.jneurosci.org) before diving into the cortical plate (movies 4, 5, available at www.jneurosci.org) where they eventually reside as GABAergic interneurons. The fact that migrating cells cross each other's pathways at the intersections (movie 2, available at www.jneurosci.org) suggests that each cell class responds to different cues for their direction. The three-dimensional working model of this complex multidirectional cell migratory behavior, which occurs within the context of the previously settled dorsal VZ-derived neurons, is presented in Figure 9B.
Recent evidence suggests that interneurons migrating through the IZ use TAG-1 present on corticofugal fibers as a migration substrate (Denaxa et al., 2001). Several long-range repulsive axonal guidance cues such as Slit (Zhu et al., 1999; Wong et al., 2001), semaphorins (Marin et al., 2001), and hepatocyte growth factor/scatter factor (Powell et al., 2001) have been implicated in directing tangentially migrating cells out of the ventral telencephalon. However, the exact cues responsible for directing the local positioning of calbindin-positive interneurons as they arrive in the dorsal telencephalic field before they descend into the cortical plate have not been identified. The reflection of the multidirectional movement of the interneurons with the orientation of the superficial C–R cells (Fig. 5A,B,D) suggests that the C–R cells may either provide directional cues for this secondary migration or orient to similar cues as the migrating interneurons. Underlying diffusible morphogen gradients may be orienting both C–R cells and migrating interneurons because of the similar pattern in both populations of cells.
Despite the wealth of phenotypic information and the central role in cortical formation attributed to C–R cells, there is still some debate as to their origin. The original hypothesis states that C–R cells come from the dorsal VZ and are present in the preplate before it is split into the MZ and subplate (Marin-Padilla, 1971, 1972, 1978). The hypothesis that C–R cells are derived from the cortical progenitor zone is supported by the Tbr1 and Emx1/2 mutations, which both greatly diminish the number of C–R cells (Hevner et al., 2001, Shinozaki et al., 2002). A subsequent hypothesis suggests a second source of C–R cells that migrate tangentially to the MZ from basal forebrain areas (Meyer et al., 1998; Lavdas et al., 1999). Finally, a third type of MZ cell, termed “pioneer neuron,” is postulated to exist before the preplate is split and is derived from the dorsal VZ. These pioneer neurons are reelin-negative and send long axons that reach as far as the lateral ganglionic eminence (Meyer et al., 1998; Soria and Fairen, 2000).
Because of their time of origin and immunohistochemical identification presented here (for example CR-50-positive, Dlx-2-negative cells), the most parsimonious explanation is that the C–R cells derived from the dorsal telencephalon are the ones whose orientation is similar to that of the underlying interneurons. This unexpected finding suggests that these two drastically different cell types (in phenotype, morphology, site of origin, and migratory potential) share a fundamental similarity that directly relates to cell positioning. Thus, these data suggest that properties of the dorsal neocortical wall may influence the tangential migration and settling of ventrally derived interneurons.
The similarity in the distribution of their orientations and close proximity to each other make C–R cells likely candidates to provide positional cues for interneurons in the MZ. However, there may be other explanations. First, it is possible that the pioneer neurons may serve as this scaffold as well as an additional guide for the long-range migration because their axons actually reach basal forebrain areas such as the LGE. Alternatively, a third element, possibly the pial-basement membrane, could be independently aligning both the C–R cells and the interneurons. Interestingly, recent evidence suggests that an intact pial-basement membrane is necessary for correct localization of C–R cells (Graus-Porta et al., 2001) (for review, see Magdaleno and Curran, 2001) as well as proper neuronal migration (Michele et al., 2002; Moore et al., 2002). Nevertheless, our data suggest that superficial constituents of the dorsal neocortical wall are intricately organized and may therefore convey areal and laminar information to the incoming interneurons.
Laminar positioning
After reaching the appropriate areal position, interneurons reorient their leading processes radially in preparation for descent into the cortical plate. This realignment occurs along either the leading processes of radially arrived neurons or radial glial shafts (Hedin-Pereira et al., 2000) (Fig. 9B). In the latter possibility, the guidance cues in the leading process would likely have to change from neurophilic to gliophilic. Tangentially migrating cells in the IZ abruptly turn up into the CP and use radial glial fibers as they ascend (Polleux et al., 2002). This mechanism is most likely also used by the tangentially migrating interneurons in the MZ as they descend into the CP. Such change has been noted during transition from tangential movement to radial migration in the cerebellum (Rakic, 1971), dorsal thalamus (Letinic and Rakic, 2001), and pons (Rakic, 1990; Rodriguez and Dymecki, 2000). Nevertheless, the molecular mechanisms responsible for this transition between neurophilic to gliophilic modes of migration remain to be elucidated.
The inside-out settling pattern of tangentially migrating cells (Fig. 8D) is reminiscent of the neuronal deployment that occurs via radial migration. Even though tangentially migrating interneurons originate in such distant sources as the GE or retrobulbar proliferative fields (Meyer et al., 1998; Zecevic and Rakic, 2001), they still integrate into the cortex in an inside-out pattern. How the interneurons that migrate superficially through the MZ find their correct laminae by diving downward toward the oncoming radial migrators is unknown. Taken together, these data suggest that similar laminar cues must exist for tangentially and radially migrating cells born at the same time despite their different modes and routes of migration.
One possibility is that the laminar cues for both tangentially and radially migrating neurons are present in the dorsal VZ. A recent study suggests that tangentially migrating interneurons in the IZ may receive laminar positioning cues from the VZ because some of them first dive down to the VZ before reversing direction and migrating superficially (Nadarajah et al., 2002). This mechanism, if correct, would then be similar to the one used by radially migrating cells that are committed to their laminar destination in the VZ (McConnell and Kaznowski, 1991). Although we have live imaging evidence that tangentially migrating cells in the MZ also do this (data not shown), some MZ cells we imaged did not approximate the VZ and instead halted migration within the CP (movie 6, available at www.jneurosci.org). Another possibility supported by evidence from this present study indicates that laminar cues for tangentially migrating cells could exist on or be secreted by cells already present in the cortical plate. The leading process “searching” behavior of interneurons in the local positioning phase of their integration supports this hypothesis. This possibility would make the initial positioning of the radially migrating cells critical for subsequent interneuron integration.
The present study illustrates how ventrally and dorsally derived neurons combine together into a functioning cortex. Our data also illustrate significant interplay between diverse cell types. In particular, elements of the dorsal neocortical wall, namely, the C–R cells, possess directional information that may be used by ingrowing ventrally derived interneurons to ensure their proper integration. Moreover, interneurons settle in appropriate cortical laminae with respect to their time of origin. Thus, cells of the dorsal and ventral telencephalon are integrated together using similar temporal and spatial restraints.
The developmentally ordered facets of this integration must be highly regulated because even small mistakes could translate into subtle but functionally significant disorders attributable to inappropriate interneuron innervation (Kozloski et al., 2001). Disturbance of this migration may be involved in a variety of developmental disorders involving deficits of GABAergic cells or their misplacement, such as in cortical dysplasia causing epilepsy (Roper et al., 1999), schizophrenia (Benes et al., 1991), autism (Casanova et al., 2002), and Tourette's syndrome (Leckman and Riddle, 2000). Our results indicate that distinct molecular programs at work in the dorsal neocortical wall govern the areal distribution and laminar positioning of neocortical interneurons.
Footnotes
This work was supported by United States Public Health Service grants (P.R.). E.S.B.C.A. was supported by a National Institute of Mental Health predoctoral fellowship. T.F.H. was supported by National Institutes of Health Grant NS10729 and a bridge grant from Cure Autism Now. We thank Jue Bao for help with animal colonies, Joe Abbatematteo (Baxter Healthcare Corporation) for assistance with the Tisseel, Klara Szigeti for expert assistance with the electron microscopy, and members of the Rakic laboratory and Patricia Goldman-Rakic for helpful comments on this manuscript. We also thank Ivan Kresimir Lukic for help with statistical analysis and Zhishang Zhou, Minghong Ma, Wei R. Chen, and Gordon Shepherd for assistance with the in utero imaging of the embryonic cortices.
Correspondence should be addressed to Dr. Pasko Rakic, Department of Neurobiology, Yale University School of Medicine, 333 Cedar Street, New Haven, CT 06510. E-mail: pasko.rakic@yale.edu.
Dr. Haydar's present address: Center For Neuroscience Research, Children's Research Institute, Children's National Medical Center, Department of Pediatrics and Pharmacology, George Washington University School of Medicine, 111 Michigan Avenue, Northwest, Washington, DC 20010.
Copyright © 2003 Society for Neuroscience 0270-6474/03/235805-11$15.00/0
E.S.B.C.A. and T.F.H. contributed equally to this work and are listed alphabetically.
References
- Alcantara S, Ferrer I, Soriano E ( 1993) Postnatal development of parvalbumin and calbindin D28K immunoreactivities in the cerebral cortex of the rat. Anat Embryol (Berl) 188: 63-73. [DOI] [PubMed] [Google Scholar]
- Alcantara S, de Lecea L, Del Rio JA, Ferrer I, Soriano E ( 1996) Transient colocalization of parvalbumin and calbindin D28k in the postnatal cerebral cortex: evidence for a phenotypic shift in developing nonpyramidal neurons. Eur J Neurosci 8: 1329-1339. [DOI] [PubMed] [Google Scholar]
- Anderson SA, Eisenstat DD, Shi L, Rubenstein JL ( 1997) Interneuron migration from basal forebrain to neocortex: dependence on Dlx genes. Science 278: 474-476. [DOI] [PubMed] [Google Scholar]
- Anderson SA, Marin O, Horn C, Jennings K, Rubenstein JL ( 2001) Distinct cortical migrations from the medial and lateral ganglionic eminences. Development 128: 353-363. [DOI] [PubMed] [Google Scholar]
- Angevine Jr JB, Sidman RL ( 1961) Autoradiographic study of cell migration during histogenesis of cerebral cortex in the mouse. Nature 192: 766-768. [DOI] [PubMed] [Google Scholar]
- Benes FM, McSparren J, Bird ED, SanGiovanni JP, Vincent SL ( 1991) Deficits in small interneurons in prefrontal and cingulate cortices of schizophrenic and schizo affective patients. Arch Gen Psychiatry 48: 996-1001. [DOI] [PubMed] [Google Scholar]
- Bishop KM, Goudreau G, O'Leary DD ( 2000) Regulation of area identity in the mammalian neocortex by Emx2 and Pax6. Science 288: 344-349. [DOI] [PubMed] [Google Scholar]
- Casanova MF, Buxhoeveden DP, Switala AE, Roy E ( 2002) Minicolumnar pathology in autism. Neurology 58: 428-432. [DOI] [PubMed] [Google Scholar]
- Cavanagh ME, Parnavelas JG ( 1988) Development of somatostatin immunoreactive neurons in the rat occipital cortex: a combined immunocytochemical-autoradiographic study. J Comp Neurol 268: 1-12. [DOI] [PubMed] [Google Scholar]
- Centonze VE, White JG ( 1998) Multiphoton excitation provides optical sections from deeper within scattering specimens than confocal imaging. Biophys J 75: 2015-2024. [DOI] [PMC free article] [PubMed] [Google Scholar]
- Corbin JG, Nery S, Fishell G ( 2001) Telencephalic cells take a tangent: nonradial migration in the mammalian forebrain. Nat Neurosci [Suppl] 4: 1177-1182. [DOI] [PubMed] [Google Scholar]
- Dammerman RS, Flint AC, Noctor S, Kriegstein AR ( 2000) An excitatory GABAergic plexus in developing neocortical layer 1. J Neurophysiol 84: 428-434. [DOI] [PubMed] [Google Scholar]
- D'Arcangelo G, Miao GG, Curran T ( 1996) Detection of the reelin break-point in reeler mice. Brain Res Mol Brain Res 39: 234-236. [DOI] [PubMed] [Google Scholar]
- de Carlos JA, Lopez-Mascaraque L, Valverde F ( 1996) Dynamics of cell migration from the lateral ganglionic eminence in the rat. J Neurosci 16: 6146-6156. [DOI] [PMC free article] [PubMed] [Google Scholar]
- del Rio JA, Martinez A, Fonseca M, Auladell C, Soriano E ( 1995) Glutamate-like immunoreactivity and fate of Cajal-Retzius cells in the murine cortex as identified with calretinin antibody. Cereb Cortex 5: 13-21. [DOI] [PubMed] [Google Scholar]
- Denaxa M, Chan CH, Schachner M, Parnavelas JG, Karagogeos D ( 2001) The adhesion molecule TAG-1 mediates the migration of cortical interneurons from the ganglionic eminence along the corticofugal fiber system. Development 128: 4635-4644. [DOI] [PubMed] [Google Scholar]
- Denk W, Strickler JH, Webb WW ( 1990) Two-photon laser scanning fluorescence microscopy. Science 248: 73-76. [DOI] [PubMed] [Google Scholar]
- Fukuchi-Shimogori T, Grove EA ( 2001) Neocortex patterning by the secreted signaling molecule FGF8. Science 294: 1071-1074. [DOI] [PubMed] [Google Scholar]
- Gogelia K, Hamori J ( 1992) Differential effects of long-term transplantation on the growth of cortical neurons containing parvalbumin or calbindin. Exp Brain Res 91: 477-483. [DOI] [PubMed] [Google Scholar]
- Graus-Porta D, Blaess S, Senften M, Littlewood-Evans A, Damsky C, Huang Z, Orban P, Klein R, Schittny JC, Muller U ( 2001) Beta1-class integrins regulate the development of laminae and folia in the cerebral and cerebellar cortex. Neuron 31: 367-379. [DOI] [PubMed] [Google Scholar]
- Haydar TF, Bambrick LL, Krueger BK, Rakic P ( 1999) Organotypic slice cultures for analysis of proliferation, cell death, and migration in the embryonic neocortex. Brain Res Brain Res Protoc 4: 425-437. [DOI] [PubMed] [Google Scholar]
- Hedin-Pereira C, deMoraes EC, Santiago MF, Mendez-Otero R, Lent R ( 2000) Migrating neurons cross a reelin-rich territory to form an organized tissue out of embryonic cortical slices. Eur J Neurosci 12: 4536-4540. [DOI] [PubMed] [Google Scholar]
- Hendry SH, Jones EG, Emson PC, Lawson DE, Heizmann CW, Streit P ( 1989) Two classes of cortical GABA neurons defined by differential calcium binding protein immunoreactivities. Exp Brain Res 76: 467-472. [DOI] [PubMed] [Google Scholar]
- Hevner RF, Shi L, Justice N, Hsueh Y, Sheng M, Smiga S, Bulfone A, Goffinet AM, Campagnoni AT, Rubenstein JL ( 2001) Tbr1 regulates differentiation of the preplate and layer 6. Neuron 29: 353-366. [DOI] [PubMed] [Google Scholar]
- His W ( 1874) Unsere Körperform und das Physiologische Problem innerer Entstehung. Leipzig, Germany: Engelman.
- Hof PR, Glezer II, Conde F, Flagg RA, Rubin MB, Nimchinsky EA, Vogt Weisenhorn DM ( 1999) Cellular distribution of the calcium-binding proteins parvalbumin, calbindin, and calretinin in the neocortex of mammals: phylogenetic and developmental patterns. J Chem Neuroanat 16: 77-116. [DOI] [PubMed] [Google Scholar]
- Jimenez D, Lopez-Mascaraque LM, Valverde F, De Carlos JA ( 2002) Tangential migration in neocortical development. Dev Biol 244: 155-169. [DOI] [PubMed] [Google Scholar]
- Kozloski J, Hamzei-Sichani F, Yuste R ( 2001) Stereotyped position of local synaptic targets in neocortex. Science 293: 868-872. [DOI] [PubMed] [Google Scholar]
- Lavdas AA, Grigoriou M, Pachnis V, Parnavelas JG ( 1999). The medial ganglionic eminence gives rise to a population of early neurons in the developing cerebral cortex. J Neurosci 19: 7881-7888. [DOI] [PMC free article] [PubMed] [Google Scholar]
- Leckman JF, Riddle MA ( 2000) Tourette's syndrome: when habit-forming systems form habits of their own? Neuron 28: 349-354. [DOI] [PubMed] [Google Scholar]
- Letinic K, Rakic P ( 2001) Telencephalic origin of human thalamic GABAergic neurons. Nat Neurosci 4: 931-936. [DOI] [PubMed] [Google Scholar]
- Letinic K, Zoncu R, Rakic P ( 2002) Origin of GABAergic neurons in the human neocortex. Nature 417: 645-649. [DOI] [PubMed] [Google Scholar]
- Magdaleno SM, Curran T ( 2001) Brain development: integrins and the Reelin pathway. Curr Biol 11: R1032-R1035. [DOI] [PubMed] [Google Scholar]
- Magdaleno S, Keshvara L, Curran T ( 2002) Rescue of ataxia and preplate splitting by ectopic expression of Reelin in reeler mice. Neuron 33: 573-586. [DOI] [PubMed] [Google Scholar]
- Maricich SM, Gilmore EC, Herrup K ( 2001) The role of tangential migration in the establishment of mammalian cortex. Neuron 31: 175-178. [DOI] [PubMed] [Google Scholar]
- Marin O, Rubenstein JL ( 2001) A long, remarkable journey: tangential migration in the telencephalon. Nat Rev Neurosci 2: 780-790. [DOI] [PubMed] [Google Scholar]
- Marin O, Yaron A, Bagri A, Tessier-Lavigne M, Rubenstein JL ( 2001) Sorting of striatal and cortical interneurons regulated by semaphorinneuropilin interactions. Science 293: 872-875. [DOI] [PubMed] [Google Scholar]
- Marin-Padilla M ( 1971) Early prenatal ontogenesis of the cerebral cortex (neocortex) of the cat (Felis domestica): a Golgi study. I. The primordial neocortical organization. Z Anat Entwicklungsgesch 134: 117-145. [DOI] [PubMed] [Google Scholar]
- Marin-Padilla M ( 1972) Prenatal ontogenetic history of the principal neurons of the neocortex of the cat (Felis domestica): a Golgi study. II. Developmental differences and their significances. Z Anat Entwicklungsgesch 136: 125-142. [DOI] [PubMed] [Google Scholar]
- Marin-Padilla M ( 1978) Dual origin of the mammalian neocortex and evolution of the cortical plate. Anat Embryol (Berl) 152: 109-126. [DOI] [PubMed] [Google Scholar]
- McConnell SK, Kaznowski CE ( 1991) Cell cycle dependence of laminar determination in developing neocortex. Science 254: 282-285. [DOI] [PubMed] [Google Scholar]
- Meyer G, Soria JM, Martinez-Galan JR, Martin-Clemente B, Fairen A ( 1998) Different origins and developmental histories of transient neurons in the marginal zone of the fetal and neonatal rat cortex. J Comp Neurol 397: 493-518. [PubMed] [Google Scholar]
- Michele DE, Barresi R, Kanagawa M, Saito F, Cohn RD, Satz JS, Dollar J, Nishino I, Kelley RI, Somer H, Straub V, Mathews KD, Moore SA, Campbell KP ( 2002) Post-translational disruption of dystroglycan-ligand interactions in congenital muscular dystrophies. Nature 418: 417-422. [DOI] [PubMed] [Google Scholar]
- Miller MW ( 1985) Cogeneration of retrogradely labeled corticocortical projection and GABA-immunoreactive local circuit neurons in cerebral cortex. Brain Res 355: 187-192. [DOI] [PubMed] [Google Scholar]
- Monuki ES, Porter FD, Walsh CA ( 2001) Patterning of the dorsal telencephalon and cerebral cortex by a roof plate-Lhx2 pathway. Neuron 32: 591-604. [DOI] [PubMed] [Google Scholar]
- Moore SA, Saito F, Chen J, Michele DE, Henry MD, Messing A, Cohn RD, Ross-Barta SE, Westra S, Williamson RA, Hoshi T, Campbell KP ( 2002) Deletion of brain dystroglycan recapitulates aspects of congenital muscular dystrophy. Nature 418: 422-425. [DOI] [PubMed] [Google Scholar]
- Mountcastle VB ( 1997) The columnar organization of the neocortex. Brain 120: 701-722. [DOI] [PubMed] [Google Scholar]
- Nadarajah B, Alifragis P, Wong RO, Parnavelas JG ( 2002) Ventricle-directed migration in the developing cerebral cortex. Nat Neurosci 5: 218-224. [DOI] [PubMed] [Google Scholar]
- Nery S, Fishell G, Corbin JG ( 2002) The caudal ganglionic eminence is a source of distinct cortical and subcortical cell populations. Nat Neurosci 2002: 1279-1287. [DOI] [PubMed] [Google Scholar]
- Polleux F, Whitford KL, Dijkhuizen PA, Vitalis T, Ghosh A ( 2002) Control of cortical interneuron migration by neurotrophins and PI3-kinase signaling. Development 129: 3147-3160. [DOI] [PubMed] [Google Scholar]
- Powell EM, Mars WM, Levitt P ( 2001) Hepatocyte growth factor/scatter factor is a motogen for interneurons migrating from the ventral to dorsal telencephalon. Neuron 30: 79-89. [DOI] [PubMed] [Google Scholar]
- Rakic P ( 1971) Neuron-glia relationship during granule cell migration in developing cerebellar cortex: A Golgi and electronmicroscopic study in Macacus rhesus J Comp Neurol 141: 283-312. [DOI] [PubMed] [Google Scholar]
- Rakic P ( 1972) Mode of cell migration to the superficial layers of fetal monkey neocortex. J Comp Neurol 145: 61-83. [DOI] [PubMed] [Google Scholar]
- Rakic P ( 1974) Neurons in rhesus monkey visual cortex: systematic relation between time of origin and eventual disposition. Science 183: 425-427. [DOI] [PubMed] [Google Scholar]
- Rakic P ( 1988) Specification of cerebral cortical areas. Science 241: 170-176. [DOI] [PubMed] [Google Scholar]
- Rakic P ( 1990) Principles of neural cell migration. Experientia 46: 882-891. [DOI] [PubMed] [Google Scholar]
- Rakic P, Yakovlev PI ( 1968) Development of the corpus callosum and cavum septi in man. J Comp Neurol 132: 45-72. [DOI] [PubMed] [Google Scholar]
- Ramon y Cajal S ( 1911) Histologie du systéme nerveux de l'homme et des vertébrés, Vol II. Paris: Maloine. [Google Scholar]
- Rodriguez CI, Dymecki SM ( 2000) Origin of the precerebellar system. Neuron 27: 475-486. [DOI] [PubMed] [Google Scholar]
- Roper SN, Eisenschenk S, King MA ( 1999) Reduced density of parvalbumin- and calbindin D28-immunoreactive neurons in experimental cortical dysplasia. Epilepsy Res 37: 63-71. [DOI] [PubMed] [Google Scholar]
- Sanchez MP, Frassoni C, Alvarez-Bolado G, Spreafico R, Fairen A ( 1992) Distribution of calbindin and parvalbumin in the developing somatosensory cortex and its primordium in the rat: an immunocytochemical study. J Neurocytol 21: 717-736. [DOI] [PubMed] [Google Scholar]
- Shinozaki K, Miyagi T, Yoshida M, Miyata T, Ogawa M, Aizawa S, Suda Y ( 2002) Absence of Cajal–Retzius cells and subplate neurons associated with defects of tangential migration from ganglionic eminence in Emx 1/2 double mutant cerebral cortex. Development 129: 3479-3492. [DOI] [PubMed] [Google Scholar]
- Sidman RL, Rakic P ( 1973) Neuronal migration, with special reference to developing human brain: a review. Brain Res 62: 1-35. [DOI] [PubMed] [Google Scholar]
- Soria JM, Fairen A ( 2000) Cellular mosaics in the rat marginal zone define an early neocortical territorialization. Cereb Cortex 10: 400-412. [DOI] [PubMed] [Google Scholar]
- Sussel L, Marin O, Kimura S, Rubenstein JL ( 1999) Loss of Nkx2.1 homeobox gene function results in a ventral to dorsal molecular respecification within the basal telencephalon: evidence for a transformation of the pallidum into the striatum. Development 126: 3359-3370. [DOI] [PubMed] [Google Scholar]
- Tamamaki N, Fujimori KE, Takauji R ( 1997) Origin and route of tangentially migrating neurons in the developing neocortical intermediate zone. J Neurosci 17: 8313-8323. [DOI] [PMC free article] [PubMed] [Google Scholar]
- Van Brederode JF, Mulligan KA, Hendrickson AE ( 1990) Calcium-binding proteins as markers for subpopulations of GABAergic neurons in monkey striate cortex. J Comp Neurol 298: 1-22. [DOI] [PubMed] [Google Scholar]
- Wichterle H, Turnbull DH, Nery S, Fishell G, Alvarez-Buylla A ( 2001) In utero fate mapping reveals distinct migratory pathways and fates of neurons born in the mammalian basal forebrain. Development 128: 3759-3771. [DOI] [PubMed] [Google Scholar]
- Wong K, Ren XR, Huang YZ, Xie Y, Liu G, Saito H, Tang H, Wen L, Brady-Kalnay SM, Mei L, Wu JY, Xiong WC, Rao Y ( 2001) Signal transduction in neuronal migration: roles of GTPase activating proteins and the small GTPase Cdc42 in the Slit-Robo pathway. Cell 107: 209-221. [DOI] [PubMed] [Google Scholar]
- Zecevic N, Rakic P ( 2001) Development of layer I neurons in the primate cerebral cortex. J Neurosci 21: 5607-5619. [DOI] [PMC free article] [PubMed] [Google Scholar]
- Zhu Y, Li H, Zhou L, Wu JY, Rao Y ( 1999) Cellular and molecular guidance of GABAergic neuronal migration from an extracortical origin to the neocortex. Neuron 23: 473-485. [DOI] [PubMed] [Google Scholar]