

Abstract
The timing of spikes can carry information, for instance, when the temporal pattern of firing across neurons results in correlated activity. However, in part because central synapses are unreliable, correlated activity has not been observed to propagate through multiple subsequent stages in neural circuits, although such propagation has frequently been used in theoretical models. Using simultaneous single-unit and multiunit recordings from two or three vocal control nuclei of songbirds, measurement of coherency and time delays, and manipulation of neural activity, we provide evidence here for preserved correlation of activity through multiple steps of the neural circuit for song, including a basal ganglia circuit and its target vocal motor pathway. This suggests that these pathways contain highly functionally interconnected neurons and represent a neural architecture that can preserve information about the timing of firing of groups of neurons. Because the interaction of these song pathways is critical to vocal learning, the preserved correlation of activity may be important to the learning and production of sequenced motor acts and could be a general feature of basal ganglia–cortical interaction.
Keywords: basal ganglia, birdsong, coherency, cross-correlation, functional connectivity, neuronal interaction, LMAN, RA, zebra finch
Introduction
Neuronal circuits transmit information using action potentials, but it remains controversial whether neural coding in the CNS involves only the rate of spike firing or, additionally, the timing of spikes (Singer and Gray, 1995; Theunissen and Miller, 1995; Shadlen and Newsome, 1998). One way in which the timing of neuronal firing can carry information is in the temporal relationship of spiking across individual neurons, resulting in correlated activity (Abeles, 1991; Murthy and Fetz, 1996; Riehle et al., 1997; Dan et al., 1998). Such activity can be more effective at driving neurons downstream (Usrey et al., 2000).
A limitation of correlated activity as a longer-range signaling mechanism is that correlation has only been observed within single brain areas or between areas that are monosynaptically (or at most disynaptically) connected or that receive direct input from a common source (Frostig et al., 1983; Tarnecki and Zurawska, 1989; Gochin et al., 1991; Mason et al., 1991; Eggermont, 1992; Bi and Poo, 1999). For instance, there are clear correlations between retina and thalamus and between thalamus and primary visual cortex (V1) but not between retina and V1 (Usrey et al., 1998, 2000). The absence of correlation between more widely separated stages of circuits is thought to reflect the weakness and unreliability of most cortical synapses (Shadlen and Newsome, 1998; Stevens and Zador, 1998), leading to rapid dissipation of correlation after more than one or two steps in a chain (Fig. 1a). In addition, the combination of sparse connectivity between cortical neurons and inadequate sampling of these neurons may prevent the detection of long-range correlations in cortical areas. This lack of experimental evidence contrasts with the use of propagating correlations in network models. Theoretical investigations of the transmission of synchronized firing in cortical networks have shown that correlation can travel through a network if synapses are very strong (Abeles, 1982, 1991); correlations can persist if the temporal dispersion of synaptic firing is low, the pool of synchronized neurons is large, or both (Diesmann et al., 1999; Stroeve and Gielen, 2001).
Figure 1.

Simultaneous recording of LMAN and RA activity. a, Schematic of a serial chain of individual neurons in the CNS, with uniform probability of the presynaptic neuron eliciting a response in the postsynaptic neuron (p). Because individual spikes only successfully cause downstream neurons to fire a small fraction of the time, the response probability decreases exponentially as activity travels downstream; i.e., p(A – D) is very small. b, Schematic of the anatomy of the song system showing the descending motor pathway for song and the AFP. The diagram on the right is a simplified representation of the song system that emphasizes the anatomical connections between nuclei investigated in this study. c–e, Raster plots of trials of LMAN (trial numbers in gray) and RA (bold) activity that showed two well separated peaks in their LMAN–RA coherency function. Trials with the same number were recorded simultaneously. Below each raster plot in cand eis an amplitude-versus-time representation of the bird's own song stimulus. c, Single-unit spike rasters. Each vertical tick represents an action potential corresponding to the isolated single-unit waveforms shown (n = 100 each, randomly selected; vertical bar represents 1 msec, and horizontal bar represents 100 μV). d, Raw multiunit waveform activity. The horizontal lines in trials marked 1 indicate a representative window discriminator level used to collect spike activity from small clusters (2–5 units) of neurons. Trials 1 and 2 are during spontaneous activity, and trials 3 and 4 are during evoked activity. Boxed sections highlight instances in which RA activity increased before and after an LMAN spike. e, Multiunit (2–5 units) spike rasters derived from small clusters of units like those in d. Calibrations: c, 500 msec; d, 100 msec; e, 1 sec.
Here we provide a direct experimental demonstration of significant correlated activity across multiple areas of a neural network, suggesting a propagating correlation as proposed in models. This occurs in the songbird vocal control system, which mediates learning and production of the bird's complex vocal behavior. The “direct motor” pathway for song is required for singing throughout life (Nottebohm et al., 1976; Vu et al., 1994), whereas a basal ganglia feedforward loop, the anterior forebrain pathway (AFP), is critical for song learning and modification (Fig. 1b) (Bottjer et al., 1984; Sohrabji et al., 1990; Scharff and Nottebohm, 1991; Williams and Mehta, 1999; Brainard and Doupe, 2000). By recording simultaneously from two to three nuclei in this neural circuit and measuring and manipulating the association of activity between neurons, we reveal correlated activity that propagates over multiple synapses throughout the circuit, particularly the basal ganglia loop. These results suggest that this circuit contains large pools of highly functionally interconnected neurons, whose joint firing enables correlation of activity to persist through many levels. Such propagating correlations could convey timing information relevant to the learning and production of temporal sequences. Moreover, because an intricately interconnected network of neurons is a property of cortical–basal ganglia circuitry in many animals (Graybiel, 1998; Kincaid et al., 1998; Bolam et al., 2000; Parent et al., 2000; Bar-Gad and Bergman, 2001), the capacity to preserve neuronal correlation across multiple steps may be a general feature of information transmission in basal ganglia–cortical networks.
Materials and Methods
Electrophysiology. Experiments were conducted on 21 adult male zebra finches (>120 d after hatching) raised in our breeding colony (Solis and Doupe, 1999). Their songs were recorded before the experiment, and the birds were prepared for electrophysiological recording, as described by Solis and Doupe (1999). Birds were anesthetized with 20% urethane (50–75 μl, i.m.; Sigma, St. Louis, MO), and body temperature was maintained at 38°C. Stereotaxic coordinates for the robust nucleus of the archistriatum (RA) were chosen such that the electrode path avoided HVc. Extracellular activity was recorded using tungsten (0.7–3 MΩ) electrodes.
Extracellular activity of the lateral magnocellular nucleus of the anterior neostriatum (LMAN) and RA was recorded simultaneously (40–350 trials per site); in some experiments, HVc activity was also recorded simultaneously with LMAN and RA activity. In the first of four three-nucleus experiments, for technical reasons, we consecutively recorded the activity of two nuclei at a time from a set of HVc, LMAN, and RA sites, whereas in subsequent experiments, all sites were recorded simultaneously. In a subset of experiments in which all three nuclei were recorded, HVc activity at and around the recording site was silenced when the correlated activity between LMAN and RA showed two well separated peaks and when all sites were auditory (see below). HVc activity was disrupted by injecting 2 mm kynurenate (180 nl to 5 μl, pH 7.4 in 0.1 m phosphate buffer), a broad-spectrum glutamate receptor antagonist (Collingridge and Lester, 1989), with 10% biotin dextran amine (BDA) and Pontamine sky blue for evaluation of drug location and spread; kynurenate has the advantage over other short-acting drugs, such as lidocaine, of blocking synaptic activity but sparing fibers of passage. The tips of the injection and recording electrodes were 5–40 μm apart in depth and 10–150 μm apart in the horizontal axis.
In all experiments, neuronal signals were amplified and filtered between 300 Hz and 10 kHz. Using a window discriminator, single units (Fig. 1c) or small clusters of the largest units (2–5 units; see Fig. 1d,e) were isolated. Single units were judged to be adequately isolated on the basis of uniformity of waveforms and the presence of a refractory period in the distribution of interspike intervals (ISIs), although a small number of ISI violations (range, 0.001–2%) indicated that a low percentage of other units were sometimes included. Spike arrival times and waveform data were collected using a data collection program developed by Michael Lewicki and Larry Proctor (California Institute of Technology, Pasadena, CA), Frederic Theunissen (University of California, Berkeley, CA), and Cooper Roddey (University of California, San Francisco, CA). Electrolytic lesions were made at some recording sites, and verified by Nissl staining of brain sections, silver staining of brain sections, or both. Brain sections were processed for BDA to visualize the approximate spread of kynurenate.
Auditory stimulation. The bird was placed in a double-walled anechoic sound-attenuated chamber with stimuli presented from a speaker calibrated to broadcast sound with a mean peak intensity level of 75 dB, positioned 23 cm away from the bird. The frequency response in the chamber was flat (±6 dB) within the range of 500 Hz–10.5 kHz. Search stimuli included the bird's own song (BOS), tutor song (typically the father's song), and a broadband white noise burst (100 or 300 msec duration). Stimulus types included songs of other zebra finches, white-crowned sparrow songs, and 300 msec pure tone bursts (1–4 kHz). Versions of the BOS and tutor song whose temporal order had been manipulated were included (Solis and Doupe, 1997). The duration of song stimuli varied from 1.2 to 2.6 sec. Multiple and single units were defined to be auditory when the average firing rate during at least one stimulus type was significantly different (p < 0.05, paired t test) from the spontaneous firing rate collected for 4 sec occurring immediately before stimulus onset. Stimuli were interleaved with 6–8 sec of interstimulus interval.
Data analysis. Data analyzed for correlation were from pairs or triplets of recording sites that were auditory and confirmed to be in the desired song nucleus. To quantify correlated activity, we calculated the coherency function (Rosenberg et al., 1989). The coherency of two sets of spikes was calculated during spontaneous activity (a 2 sec period immediately before stimulus presentation) from all trials and during evoked activity in response to the BOS (Fig. 2e,f). To calculate the coherency, we first calculated the cross-correlation (Fig. 2a–d) (Perkel et al., 1967) and cross-covariance functions (Fig. 2c,d) (Perkel et al., 1967; Aertsen et al., 1989). We used a time bin size of 10 msec and looked at time delay values of up to 1 sec. Full details of the data analysis are outlined in the Appendix.
Figure 2.

Calculation of coherency function. All functions are from the activity of one pair of LMAN–RA sites during presentation of BOS (Evoked; a, c, e, g) and spontaneous (b, d, f, h) activity. a, b, Raw cross-correlograms of RA activity around an LMAN spike at time delay of 0, normalized by the mean firing rate of RA. c, d, Cross-correlation (thick line) and cross-covariance (thin line) of RA activity relative to LMAN spikes. Note that during evoked activity, presentation of the BOS stimulus contributes to the correlation of activity between LMAN and RA; i.e., there is a significant “shuffle corrector” (dashed line), which represents correlations attributable to responses to the BOS (or any event that occurs identically across trials). e, f, Coherency of RA activity relative to LMAN spikes. Insets show the autocovariance of LMAN and RA activity. Note that during both evoked and especially spontaneous activity, the temporal structure of firing within LMAN and RA causes LMAN and RA activity to be correlated over hundreds of milliseconds (wide peaks), which can be observed in the cross-correlation and cross-covariance functions c and d. This correlation can also be seen as wide pedestals in the LMAN and RA autocovariance functions and is removed by normalization in the coherency function. g, h, Scattergrams of strength of association between LMAN and RA activity quantified using coherency and cross-covariance measures. Both strengths were calculated in the same manner (see Materials and Methods), and wide peaks were excluded from calculations. Open symbols represent peaks with a negative time delay, and closed symbols represent peaks with a positive time delay. Dashed lines represent unity lines. R2, Coefficient of determination. The scattergrams show that the cross-covariance function can overestimate the degree of correlated activity between LMAN and RA.
In brief, the coherency function is calculated by normalizing the cross-covariance of two spike trains by the autocovariance of both spike trains. The coherency is a unit-less number and is bounded by –1 (perfect linear anticorrelation) and 1 (perfect linear correlation); 0 indicates independence. The coherency function offers two advantages over the cross-correlation function as a measure of correlated activity. First, because we derive it from the cross-covariance function, the coherency function corrects for correlated firing that is attributable to correlated changes in the mean firing rate, such as those during evoked activity. The cross-covariance measures only the correlation between deviations from the time-varying mean firing rates; it is calculated by subtracting the shuffle corrector from the cross-correlation (Fig. 2c,d). The importance of using the cross-covariance when analyzing stimulus-driven activity, such as that driven by the BOS in our experiments, is clearly illustrated by how large the shuffle corrector function is in Figure 2c.
The second advantage is that the coherency normalizes for the temporal structure of firing within each neuron (given by the autocovariance), which could contribute to correlation of activity that does not reflect true synaptic interaction between the two neurons. For example, this normalization removes additional or artificially wide peaks in the cross-covariance functions that are likely attributable to bursting or other temporally structured firing within each neuron. The comparison of the cross-covariance functions (Fig. 2c,d) with the coherency functions (Fig. 2e,f) illustrates the importance of correcting for the autocovariance functions, both for assessing the true magnitude of association (Fig. 2g,h) and for removing correlation peaks attributable solely to the temporal structure of firing within each recording site.
For all the cross-covariance and coherency measures, the sampling error was estimated using the jackknife resampling technique (Thomson and Chave, 1991). In brief, for experimental data based on n trials, one estimates n values of the cross-covariance measures, each based on n – 1 trials, with a different trial deleted each time. The variance in the estimate is then obtained. Pairs of cells are considered to be significantly correlated if peaks in the coherency exceed three times the SD, which corresponds to a 99% confidence level.
We fit the coherency function within the –100 to +100 msec time delay window with a sum of 2 Gaussians. Goodness of fit was estimated by calculating the regression between the fit and actual data points (an R2 value) but was also assessed by visual inspection. Fits that had R2 < 0.7 were excluded. However, when it was clear that the coherency function only had one peak (“single-peak” coherency functions), that is, when the amplitude of one of the Gaussians was very close to zero (mean amplitude ± SD for multiunit activity: spontaneous, –0.001 ± 0.004; n = 5 of 9; evoked, –0.001 ± 0.001; n = 2 of 3) or when the constraint to fit with two Gaussians resulted in one Gaussian fitting nonexistent data (n = 4of 9 for spontaneous; n = 1 of 3 for evoked), we refit the coherency function with only one Gaussian. The peak amplitude of each Gaussian “amplitude,” the time delay at this peak “time delay,” and half-width at 1 SD (“width”) were measured. These parameters were measured directly from the data in cases in which the width of a peak was <10 msec. We quantified strength of correlation as average coherency strength, calculated as the square root of the area under the coherency square normalized by the bin size. The details of the calculation of strength are described in the Appendix.
There were several broad types of LMAN–RA coherency functions that were classified as follows (although these types might actually form a continuum). Coherency functions with two peaks were defined as “well separated” when the absolute value of the difference between the time delays of the two peaks was larger than the sum of their widths (e.g., Figs. 3a,b, 4b). Cases in which the coherency function clearly only had one peak (described above) were defined as a single peak; an example is shown in Figure 7b. On the basis of the criterion of good fit (see above), there were two other types of “two-peaked” functions. Functions with two peaks that were both significant but did not meet our criterion for being well separated in time were called not well separated or “two nonseparable” peaks (Fig. 7a). There were also functions in which two peaks were well fit, and one was significant, but the other, although clearly nonzero, was below our conservative significance threshold; we called these “single peak with shoulder.” Because these two-peaked functions looked very different (in shape and peak timing) from the functions with a single peak, we classified them separately from the rest of the coherency function types. In addition, because these functions appeared similar to each other and were in the minority, we grouped them together and called them “two nonseparable/single peak with shoulder” functions for data presentation.
Figure 3.

Coherency of RA activity relative to LMAN spikes indicates robust correlated activity at the multiunit (a) and single-unit (b) levels, and during spontaneous (c) and evoked (d) activity. In a and b, the LMAN–RA coherency function shows two significant peaks (amplitude > significance level of +3 × jackknife SD): LMAN-leading-RA (thick dashed line) and RA-leading-LMAN (thin dashed line). td, w, Time delay and width, respectively, of each peak. The horizontal line within each peak in a and b represents the width of each peak. c, d, Mean of all LMAN–RA coherency functions with two well separated peaks (see Materials and Methods), derived from multiunit activity. LMAN→ RA, LMAN-leading-RA; RA→ LMAN, RA-leading-LMAN.
Figure 4.

Coherency among LMAN, RA, and HVc activity. a, Hypothesis: the RA-leading-LMAN peak is caused by common input from HVc. A presynaptic spike from HVc (gray) arrives in RA earlier at a shorter time delay T(HR) than in LMAN at time delay T(HL). The equation on the right describes our prediction of the time delay of the RA-leading-LMAN peak, T(LR–), derived from T(HR) and T(HL). T(LR+), Time delay between LMAN and LMAN-driven RA spikes; T(LR–), time delay between LMAN spikes (at time delay of 0) and HVc-driven RA spikes. Note the similarity of the right plot to the highlighted sections of Figure 1d. b–e, Coherency functions from simultaneously recorded LMAN, RA, and HVc multiunit spontaneous activity. Conventions are as in Figure 3. b, LMAN–RA coherency function with two well separated peaks. c, Coherency function of RA activity relative to HVc spikes (at time delay of 0) shows a peak with a time delay of >0, indicating increased RA firing probability after HVc spikes. d, Coherency function of LMAN activity relative to HVc spikes (at time delay of 0) exhibits two peaks, one with a negative and the other a positive time delay, indicating increased LMAN firing probability before and after HVc spikes, respectively. e, Regression plot of predicted and measured time delays of the RA-leading-LMAN peaks, T(LR–), when all three correlations were measured. R, Correlation coefficient.
Figure 7.
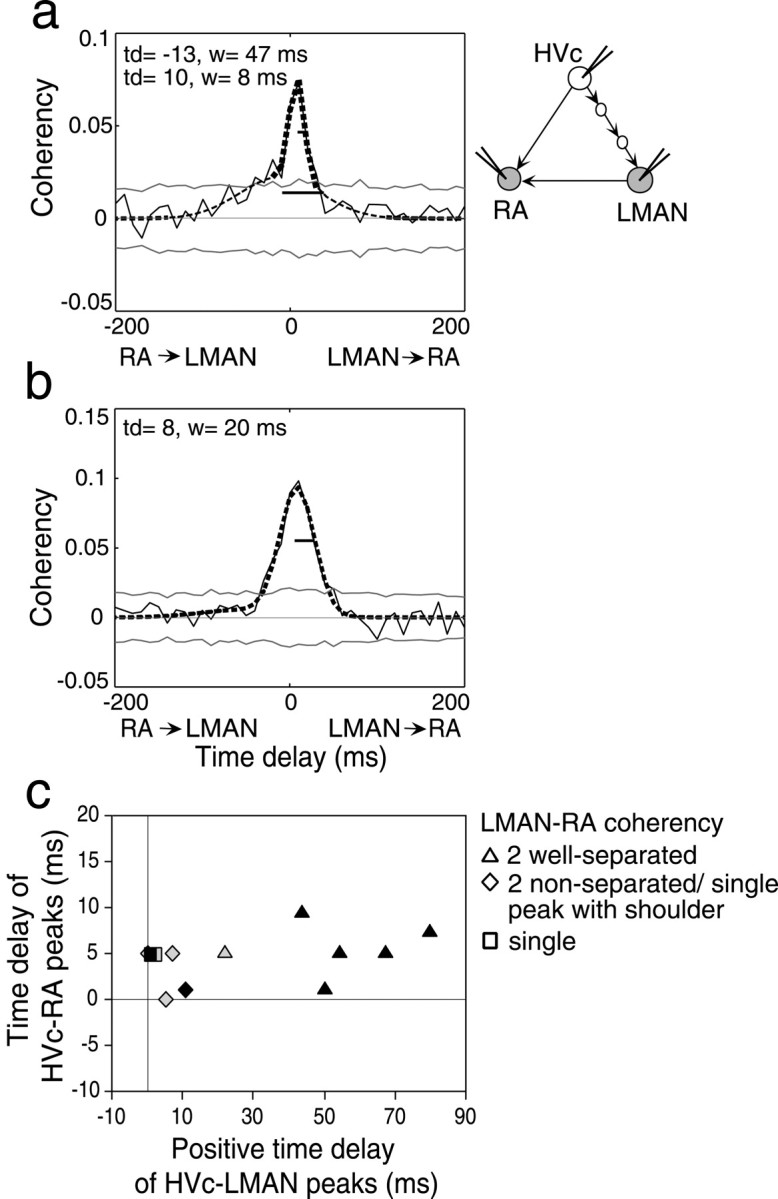
HVc–LMAN coherency functions vary in parallel with the types of LMAN–RA functions, whereas HVc–RA coherency functions do not. Conventions are as in Figure 3. Examples of LMAN–RA coherency function with two peaks that are not well separated in time (a, thick and thin dashed lines) and a single peak (b) are shown. c, Time delays of co-occurring HVc–LMAN and HVc–RA peaks, grouped according to their co-occurring type of LMAN–RA peaks (see Materials and Methods). Data from spontaneous (black) and evoked activity (gray) are shown. The mean time delays of the HVc–LMAN peaks are as follows: triangles, 52.8 ± 19.9 msec (n = 6); diamonds, 5.8 ± 4.5 msec (n = 4); squares, 1.4 ± 0.8 msec (n = 2). Those of HVc–RA peaks are as follows: triangles, 5.4 ± 2.8 msec; diamonds, 2.8 ± 2.6 msec; squares, 5.0 ± 0 msec.
Topographical alignment of LMAN and RA recording sites. The LMAN–RA coherency functions with two well separated peaks were grouped into five categories according to the topographical alignment of the corresponding LMAN–RA sites as described by Johnson et al. (1995), with category values that ranged from 1 to 3, indicating poor to perfect topographical matches. The groups were as follows: (1) the LMAN recording site was within a compartment that was not adjacent to the LMAN compartment that sends projections to the RA recording site (n = 2 pairs of sites); (2) the LMAN recording site was within the compartment adjacent to the LMAN compartment that projects to the RA recording site (n = 14); and (3) the LMAN recording site was within the compartment that sends projections to the RA recording site (n = 4). The two intervening categories (1.5; n = 2; and 2.5; n = 6) corresponded to cases in which the LMAN site straddled the two compartments used to define the lower and higher categories. Our recorded sites sampled from all five categories.
Results
LMAN and RA activity are robustly correlated and show two correlation peaks
We recorded simultaneously from LMAN and RA of 21 anesthetized adult zebra finches (Fig. 1b), collecting spontaneous and song-evoked extracellular activity from 20 single-unit pairs of LMAN and RA song-selective auditory neurons (Fig. 1c) and from 40 pairs of small clusters of neurons (2–5 units; Fig. 1d,e). We then analyzed the relationship of RA firing relative to LMAN spikes. First, to increase the likelihood that our analysis reflected functional synaptic connectivity rather than simply shared responsiveness, we calculated the cross-covariance of RA and LMAN activity by subtracting the shuffled cross-correlation from the raw cross-correlation (Fig. 2c,d). This corrects for correlated activity attributable to events occurring identically across all trials (in particular, the stimulus) and normalizes for mean firing rate (Perkel et al., 1967; Aertsen et al., 1989) (see Materials and Methods). We then calculated the coherency function of LMAN and RA activity. Coherency is a measure of neuronal interaction in which the cross-covariance function of two sets of spikes is normalized by the autocorrelation of each spike train (Rosenberg et al., 1989) (see Materials and Methods). Normalization removes the influence of the temporal structure of firing within each individual spike train (Fig. 2c–f) and is especially important for song neurons, which burst both spontaneously and in response to a temporally complex and repeating sequence of sounds (Fig. 1c–e). The strength and timing of neuronal interaction were quantified from Gaussian fits of the coherency function (see Materials and Methods).
Coherency analysis revealed correlated activity between LMAN and RA, as indicated by a significant positive peak in the coherency function in more than half of the LMAN–RA single-unit (su) and multiunit (mu) pairs, both during spontaneous activity (12 of 20 su pairs and 29 of 40 mu pairs) and during presentation of the bird's own song (“evoked activity”;6of20su pairs and 22 of 40 mu pairs). Figure 3, a and b, illustrates the similarity between the significant positive peaks in single-unit and multiunit data, differing only in strength (for other types of functions, see below and Fig. 7). The types and basic features of the coherency functions derived from spontaneous and evoked multiunit activity were also similar (Fig. 3c,d); we will therefore primarily present data derived from spontaneous activity. Significant peaks with features (described below) similar to those of coherency peaks were also observed in cross-covariance and cross-correlation functions (for an example, see Fig. 2).
Of the LMAN–RA mu and su pairs that exhibited significant correlated activity, the majority (20 of 29 for mu and 10 of 12 for su) were well fit by two Gaussian functions (R2 = 0.93 ± 0.05 for mu and 0.90 ± 0.08 for su) and therefore had not one but two peaks in their coherency functions (Figs. 3a,b,4b,7a). Both peaks were highly significant (more than three times jackknife SD; see Materials and Methods) for 18 of 20 mu pairs and 7 of 10 su pairs. The two peaks had distinct time delays: one peak had a positive time delay, indicating an increase in RA firing probability after LMAN spikes (LMAN-leading-RA peak; thick dashed line), whereas the other had a negative time delay, indicating an increase in RA firing probability before LMAN spikes (RA-leading-LMAN peak; thin dashed line). Most of the mu and su pairs of significant peaks were well separated in time (15 of 18 for mu and 6 of 7 for su). That is, the distance between the LMAN-leading-RA and RA-leading-LMAN peaks (the absolute value of the difference in time delays) was greater than the sum of the half-widths of the two peaks (also see Materials and Methods, Figs. 3, 7). The timing of each kind of well separated peak was similar for mu and su pairs, and the two peaks differed significantly from each other in their time delay in both su and mu recordings (mu, 8.2 ± 3.2 vs –52.6 ± 11.7 msec; p < 0.001; su, 10.2 ± 2.6 vs –47.8 ± 10.1 msec; p < 0.05, Wilcoxon signed rank test).
In addition to the similarity in time delays of mu and su coherency peaks, the mean widths of the LMAN-leading-RA peaks (mu, 11.8 ± 3.3 msec; su, 15.0 ± 7.5 msec) and RA-leading-LMAN peaks (mu, 24.0 ± 10.2 msec; su, 19.0 ± 13.3 msec) were not significantly different between mu and su coherency functions. However, the strength of the coherency between LMAN and RA activity of the small multiunit clusters was significantly higher than that of su pairs both for LMAN-leading-RA peaks (mu, 0.14 ± 0.05; su, 0.08 ± 0.02; p < 0.01, Mann–Whitney U test) and for RA-leading-LMAN peaks (mu, 0.10 ± 0.04; su, 0.06 ± 0.02; p < 0.05, Mann–Whitney U test). Because the mu correlation functions were strikingly similar to su coherencies but were overall stronger, in most experiments we recorded and analyzed both small multiunit clusters of neurons and single units.
The topographical organization of the LMAN projection to RA (Johnson et al., 1995) did not appear to influence the coherency; there was no correlation between the degree of topographical match between recording sites and the strength of either LMAN–RA coherency peak (range of R values for both mu and su, –0.236 to +0.274; p > 0.2; see Materials and Methods).
The LMAN-leading-RA correlation peak is consistent with the known excitatory connection from LMAN to RA (Okuhata and Saito, 1987; Bottjer et al., 1989; Mooney, 1992) (Fig. 1b). In contrast, the RA-leading-LMAN correlation peak was unexpected. This increase in RA firing probability before LMAN spikes could reflect RA driving LMAN activity via the dorsolateral nucleus of the medial thalamus (DLM) (Vates et al., 1997). However, the projection from RA to DLM is very weak in zebra finches (Vates et al., 1997) and seems unlikely to explain the very long time delay of the RA-leading-LMAN peak (40–50 msec). We hypothesize that the correlation represents common excitatory input to both areas from HVc, with RA receiving the input earlier than LMAN. Such a source of strong common input could result in an increase in RA firing probability before an LMAN spike (Fig. 4a).
Correlation of activity among LMAN, RA, and HVc
If the RA-leading-LMAN correlation peak reflects common input to LMAN and RA from HVc, activity should also be correlated not only between HVc and RA but also between HVc and LMAN, two areas separated by a minimum of three synapses (Fig. 4a). A significant correlation of activity between such widely separated brain areas would be unusual, so we tested this directly by recording simultaneous activity from small clusters in all three nuclei. We found that in all experiments in which the LMAN–RA coherency function had two well separated peaks (Fig. 4b; n = 5), there was indeed significant coherency of activity between HVc and LMAN (Fig. 4d; n = 5 of 5) as well as between HVc and RA (Fig. 4c). [HVc–RA cross-correlation was also noted by Dave et al. (1998) and observed between HVc and RA bursts by Hahnloser et al. (2002).] The short positive time delay of the HVc–RA peak (5.5 ± 3.1 msec) is as expected from the direct excitatory projection from HVc to RA, whereas the long positive time delay of the HVc–LMAN peak in these recordings (59.0 ± 14.6 msec) is consistent with the indirect connection, across many synapses, from HVc to LMAN.
If the RA-leading-LMAN peak is attributable to common input to LMAN and RA from HVc, the time delay of this peak should be predictable from the difference in time delays of the simultaneous HVc–RA and HVc–LMAN coherency peaks (Fig. 4a). Despite the variability of the time delays of each peak between recording sites, within each set of recording sites, the timing of the RA-leading-LMAN peak was strikingly well matched to the time difference between the co-occurring peaks (Fig. 4e). Moreover, the mean timing of well separated RA-leading-LMAN peaks from all experiments (–52.6 ± 11.7 msec; n = 15) is well predicted by the mean time delays of the HVc–LMAN and HVc–RA peaks described above.
The correlation of HVc with Area X provides further support for transmission of neural correlation through the AFP: in seven of eight HVc–Area X spontaneous multiunit activity pairs, we found a significant increase in Area X firing probability after spikes in HVc. The shorter time delay and higher strength of these HVc–Area X coherency peaks (8.0 ± 6.0 msec and 0.19 ± 0.06, respectively) compared with all HVc-leading-LMAN peaks (42.6 ± 25.7 msec and 0.11 ± 0.04, respectively; n = 10; p < 0.05, Mann–Whitney U test) are consistent with the propagation of correlated activity from HVc first to Area X and eventually to LMAN.
Figure 5 compares the time delays and strengths of coherency between directly and indirectly connected song nuclei. The mean time delays of these peaks (Fig. 5a) are consistent with the anatomical connections, with much longer time delays for indirectly than directly connected nuclei. However, despite the fact that the HVc-leading-LMAN and RA-leading-LMAN coherency peaks reflect correlated activity across multiple stages of the song circuit, their strength of association (Fig. 5b) is not markedly less than the association between directly connected areas (0.11 ± 0.04 and 0.10 ± 0.04 vs 0.27 ± 0.04 for HVc–RA, 0.19 ± 0.02 for HVc–area X, and 0.14 ± 0.05 for LMAN–RA). Thus, the strength of these multistage correlations does not show the exponential falloff of correlations expected across a serial chain of individual neurons (Fig. 1a).
Figure 5.

Distribution and mean of time delays (a) and average strengths (b) of coherency peaks in the song system. Data shown for the LMAN-leading-RA, HVc-leading-LMAN, and RA-leading-LMAN peaks are those that correspond to LMAN–RA coherency functions with well separated peaks. All peaks were derived from spontaneous activity. Each symbol represents data from one pair of sites; bars indicate the mean for each type of coherency peak, and error bars indicate SE.
In 6 of 10 HVc–LMAN pairs analyzed, a coherency peak with a short negative time delay was also observed (Fig. 4d; –5.4 ± 4.0 msec). This peak could result from common input to both nuclei or from a direct excitatory connection from LMAN to HVc. Although a connection from LMAN to HVc would provide an intriguing source of additional feedback to the motor pathway, no such direct anatomical projection has been observed thus far in the zebra finch, although it has been suggested in canaries (Nottebohm et al., 1982).
A second peak with a long positive time delay in the HVc–RA coherency function, which would indicate an HVc-locked increase in RA firing probability attributable to LMAN activity, might have been expected but was not observed. The lack of this peak presumably reflects the large temporal jitter between LMAN and HVc spikes (Fig. 4, compare c, d), as well as the slightly lower magnitude of the HVc–LMAN and LMAN-leading-RA correlations compared with HVc–RA coherency (Fig. 5b). Both of these effects would weaken such a second peak and spread it out over many time delays so that a much larger number of trials would be required to detect it.
Correlation of LMAN and RA activity attributable to common input: effect of disrupting HVc activity
As a direct experimental test of our hypothesis, we examined the effect of disrupting HVc activity on the correlation of LMAN and RA activity. If the RA-leading-LMAN peak is attributable to shared input from HVc, it should be greatly decreased by this manipulation, whereas the direct LMAN-leading-RA correlation should persist (as long as some spontaneous activity remains in LMAN). We recorded simultaneous multiunit activity from HVc, LMAN, and RA of anesthetized adult zebra finches before and during silencing of HVc activity at and around the recording site with a broad-spectrum glutamate receptor antagonist, kynurenate (Collingridge and Lester, 1989) (n = 3; see Materials and Methods). This agent should broadly inactivate the many glutamate receptors in HVc (Dutar et al., 1998) but should spare fibers of passage.
During HVc inactivation, the RA-leading-LMAN coherency peak decreased markedly, whereas the LMAN-leading-RA peak was only slightly diminished. Figure 6a shows an example from one experiment. To quantify the total change in LMAN–RA coherency attributable to HVc inactivation, we calculated the change in area under the coherency; group data are shown in Figure 6b. In all cases, the LMAN-leading-RA peaks remained significant, whereas none of the RA-leading-LMAN peaks were significant during disruption of HVc activity. HVc inactivation was always accompanied by loss of HVc spontaneous activity recorded at the HVc electrode (88% decrease in firing rate; range, 69–98%). The changes in coherency occurred despite a 52% decrease in spontaneous activity of LMAN (range, 14–74%) and relatively little change in spontaneous activity in RA (15% decrease; range, 12–17%), presumably reflecting the high intrinsic firing rates of RA neurons (Dave et al., 1998; Spiro et al., 1999). Because the level of RA activity remained high after HVc inactivation, the RA-leading-LMAN correlation peak should have persisted if it depended primarily on connections from RA to LMAN via DLM, but it did not. These inactivation results thus provide strong direct evidence that the RA-leading-LMAN peak is primarily caused by the common input from HVc directly to RA and indirectly to LMAN via the AFP.
Figure 6.

The RA-leading-LMAN peak is greatly decreased when HVc activity is disrupted. a, LMAN–RA coherency function before and during disruption of HVc activity. The shaded area represents the extent of decrease in coherency as a result of HVc inactivation. Note that there is not a significant RA-leading-LMAN peak during HVc disruption. b, Average percentage of area under coherency curve retained during disruption of HVc activity. Error bars indicate SE.
LMAN–RA and HVc–LMAN correlations vary in parallel and are labile
Although most correlation functions showed two well separated and significant peaks, occasional LMAN–RA coherency functions were well fit by two peaks, but these peaks were not well separated in time (Fig. 7a), one of them was not significant, or both. When there was only one significant peak, the nonsignificant “peak” fit was always a shoulder to the left of the significant peak. Because these coherency functions appeared similar to each other and were few in number, we grouped them as “two nonseparable peaks/single peak with shoulder” (mu, n = 5; su, n = 4). In some cases, coherency functions were well fit by only one Gaussian, indicating that the function exhibited only a single peak (mu, n = 9; su, n = 2; Fig. 7b; for definitions of the different types of functions, see Materials and Methods).
Among the two nonseparable/single peak with shoulder functions, it was the timing and strength of the RA-leading-LMAN peak that appeared to vary and to give rise to the different types of coherency functions. When the two peaks were not well separated in time, the time delay of the RA-leading-LMAN peak was shifted closer to zero (mu, –20.9 ± 23.5 msec; n = 4 of 5; su, –36.4 ± 10.2 msec; n = 2 of 4) than when the two peaks were well separated; when there was only one significant peak (mu, n = 1 of 5; su, n = 2 of 4), it was always the RA-leading-LMAN peak that was not significant. In contrast, the LMAN-leading-RA peak in two nonseparable/single peak with shoulder functions was always significant, and had a time delay (mu, 7.1 ± 7.5; n = 5 of 5; su, 10.9 ± 6.2 msec; n = 4 of 4) similar to that in well separated functions.
The timing and strength of the RA-leading-LMAN peak also varied in parallel with the correlation of activity in the AFP. In experiments in which we simultaneously recorded the activity of small clusters of neurons from LMAN, RA, and HVc, the timing of the RA-leading-LMAN peak covaried with that of the HVc-leading-LMAN coherency peaks but not with the timing of the HVc-leading-RA peaks (Fig. 7c). Single LMAN–RA peaks are associated with HVc–LMAN peaks with short time delays; two nonseparable/single peak with shoulder LMAN–RA peaks are associated with HVc–LMAN peaks with intermediate delays; and two well separated LMAN–RA peaks are associated with HVc–LMAN peaks with long time delays. In addition, when there were no significant LMAN–RA peaks, the HVc–LMAN coherency function also lacked significant peaks, whereas the HVc–RA coherency function consistently exhibited a significant peak. Thus the multistage correlation through the AFP appears to be the more labile of the two correlations that generate the RA-leading-LMAN correlation.
Discussion
Preservation of correlated activity across several song nuclei
The results of this study show that correlation of activity is well preserved across multiple synapses in the song system, particularly through the entire basal ganglia–dorsal forebrain circuit. The strength of association between directly connected song nuclei was in the same range as those of direct cortical and subcortical connections (0.02–0.20; Abeles et al., 1993; Vaadia et al., 1995; Eggermont and Smith, 1996; Alonso and Martinez, 1998). Strikingly, the coherency strength between song nuclei separated by three or more synapses was also of the same order of magnitude as that of the direct connections. This is surprising because experimentally, correlation of activity between neurons that are not directly connected or do not share direct common inputs is usually weak (Frostig et al., 1983; Gochin et al., 1991; Mason et al., 1991; Eggermont, 1992). Similarly, theoretical discussions have predicted correlations to be negligible across more than one or two central synapses (Perkel et al., 1967; Fetz and Cheney, 1980; Abeles, 1982). However, these studies examined brain areas and model networks that are predominantly connected in series. The probability of detecting correlated activity between indirectly connected neurons in a serial and sparsely distributed functional connectivity (Fig. 8a) would be low. The robust correlations across multiple synapses observed here speak strongly against such a sparse, parallel model. Rather, the functional connectivity of the song circuit is more likely to resemble models with convergence and divergence of connections as well as extensive intrinsic connectivity (Figs. 8b,c; Abeles, 1991; Diesmann et al., 1999; Stroeve and Gielen, 2001). Such an architecture, in which each cell has numerous chances to drive target neurons as well as to receive inputs, compensates for the unreliability of individual connections, and can preserve or restore a degree of correlation within each downstream nucleus. Our data thus suggest that information in the song system is processed by a highly functionally interconnected network of neurons, which could preserve the temporal relationship of firing of neuronal assemblies across multiple synaptic steps.
Figure 8.

Examples of possible patterns of functional connectivity in the song system. Each row of circles denotes neurons within a song nucleus, and each row represents a different song nucleus. The models in a and c are extreme possibilities, whereas that in b is one of a number of possible intermediate patterns. a, Functional connectivity organized in a parallel manner with sparse connections between neurons. b, Convergence and divergence of inputs from the first to the second step and subsequent sparse connections and a varying degree of short- and long-range intrinsic connectivity within nuclei (which could be direct or via interneurons). c, Extensive convergence and divergence of functional connections between nuclei and short- and long-range intrinsic connections within each nucleus. The activity in neurons 1 and 2 is more likely to be correlated in b or c than in a. Convergence and divergence only at some of the levels, as in b, would still increase the likelihood of observing correlations across a network.
Anatomical and electrophysiological data support such an architecture for the song system. The temporal profile of auditory responses to the bird's own song in anesthetized animals appears to be similar across large areas within HVc (Sutter and Margoliash, 1994) and within LMAN (Doupe, 1997) and thus may be synchronized. Synchronization has been directly observed between the bursting spikes (spike rates >100 Hz) of RA-projecting HVc neurons and HVc interneurons (Hahnloser et al., 2002). HVc has broad intrinsic connectivity, and its projections to RA and Area X are widely divergent (Fortune and Margoliash, 1995; Vates and Nottebohm, 1995; Foster and Bottjer, 1998). Within the AFP, however, projections are topographically organized, including the LMAN projection to RA (Johnson et al., 1995; Luo et al., 2001). We found nonetheless that the topographical alignment of the LMAN and RA recording sites did not affect the strength of LMAN–RA correlation. This suggests that additional connections between topographical compartments, such as the horizontal connections within LMAN (Boettiger and Doupe, 2001) or interneurons within RA that synchronize the activity of RA neurons (Spiro et al., 1999), act to preserve the correlation of activity.
The correlation studies here provide new experimental evidence for functional connectivity that can preserve correlated firing across many stages of a processing network. One model for such connectivity, the “synfire chain model” proposed by Abeles (1991), postulates that faithful transmission of synchronized firing requires strong, reliable synapses with a very small temporal jitter at each synapse. More recent feedforward models using assemblies of interconnected “integrate-and-fire” neurons also predict propagation of correlated activity but with less dependence on spike precision and synaptic strength and, rather, on numbers of shared inputs and lateral interconnections (Diesmann et al., 1999; Stroeve and Gielen, 2001). Our results support the idea of propagating correlations as in these models but also reveal gradual weakening and widening of the correlation peaks as we record from increasingly separated stages, consistent with the many sources of noise and variability in real biological synaptic networks (Shadlen and Newsome, 1998). Despite the jitter of spike timing we observed in parts of the song circuit, especially the AFP, the degree of functional interconnectivity must be extensive enough for a significant correlation of activity to persist across song nuclei even as its timing broadens.
Possible functions of preservation of spike timing
The AFP is a basal ganglia–dorsal forebrain circuit that forms an indirect connection between a song premotor area (HVc), and a primary motor area (RA) connecting directly to vocal motor neurons (Fig. 1b). Activity in the AFP, which includes both singing-related activity and sensory responses to the bird's own song (Hessler and Doupe, 1999; Solis and Doupe, 1999), is critical for learning and plasticity of song output, especially in juvenile birds (Bottjer et al., 1984; Scharff and Nottebohm, 1991; Williams and Mehta, 1999; Brainard and Doupe, 2000). One model of AFP function is that it modulates the strength of synapses in the motor pathway, via a reinforcement or error signal to RA that may reflect how well the bird's vocalizations match a previously memorized song template (Doya and Sejnowski, 1998; Brainard and Doupe, 2000; Dave and Margoliash, 2000; Troyer and Doupe, 2000). Our results showing a significant direct LMAN-leading-RA correlation suggest that the AFP interacts functionally with the motor pathway even in adult birds. Moreover, the RA-leading-LMAN correlation, which implies extensive interconnectivity within the AFP, raises the possibility that AFP teaching signals are encoded in the correlated firing of ensembles of AFP neurons. The degree of correlated activity in the AFP may influence the extent to which the AFP can modulate RA activity.
These results also suggest that information about the overall temporal pattern of song-related activity is preserved in the form of correlated activity as it moves across processing steps; that is, waves of broadly correlated activity appear to propagate through the two song pathways, converging at RA with a time difference of ∼60 msec. Such temporally offset waves of correlated activity could be critical for learning and generation of motor sequences or for a delayed reinforcement signal.
The striking propagation of correlated activity across the song circuit may reflect a type of neural information processing particularly relevant to consolidation of learned patterns of activity. Our recordings were performed in anesthetized birds, but evidence suggests that activity in such animals is similar to that in sleeping birds (Dave et al., 1998). During sleep, the pattern of spontaneous firing of some song neurons has been reported to show similarities to their pattern of activity during singing (Dave and Margoliash, 2000). Similarly, hippocampal neurons show evidence of increased neuronal correlation and replay of temporal sequences of activity from behavioral episodes during sleep (Sutherland and McNaughton, 2000; Louie and Wilson, 2001). These studies in both rodents and songbirds raise the possibility that activity during the sleep state is involved in consolidation of what was learned or experienced during waking.
Parallels to mammalian basal ganglia
Our results suggest further strong parallels between the songbird circuitry and the mammalian cortical–basal ganglia circuits with which it shares homology (Bottjer, 1993; Bottjer and Johnson, 1997; Luo and Perkel, 1999; Perkel and Farries, 2000). In mammals, too, there are widely divergent and convergent connections from cortical regions onto their targets in the striatum (Graybiel et al., 1994; Kincaid and Wilson, 1996; Graybiel, 1998; Kincaid et al., 1998; Stern et al., 1998; Parent et al., 2000). Although striatal projections are organized in segregated channels (Middleton and Strick, 2000), some striatal interneurons show synchronized firing that could act to link output channels (Raz et al., 1996). It has been proposed that the anatomical connectivity of these pathways allows broad information sharing between subcircuits, but the extent to which subcircuits fire independently is functionally modulated, especially in learning or disease (Bergman et al., 1998; Bar-Gad and Bergman, 2001; Bevan et al., 2002). The strong correlated activity through the AFP provides direct evidence for an information-sharing model of connectivity within a basal ganglia circuit for song and suggests that temporally correlated patterns of activity may be important more generally for behaviors mediated by cortical–basal ganglia circuits.
In addition, our data show that the coherency between RA and LMAN can vary in parallel with the correlation within the AFP and in response to alterations of HVc activity. Although some of this variation may reflect random sampling of different preexisting types of connectivity, it could also reflect active modulation of the state of connectivity within the AFP. Marked changes in functional connectivity have been observed in the mammalian basal ganglia as a result of alterations in the level of dopamine (Raz et al., 1996, 2001; Bergman et al., 1998; Ruskin et al., 1999). HVc, LMAN, and Area X receive extensive dopaminergic projections from the midbrain (Lewis et al., 1981; Bottjer, 1993; Soha et al., 1996; Appeltants et al., 2000), and dopamine could therefore modulate AFP correlations. The likely importance of horizontal interconnectivity in propagation of correlations (Stroeve and Gielen, 2001) suggests that acute or long-lasting changes in the strength of this connectivity could dramatically affect information transmission in such correlated circuits. Because the AFP represents a basal ganglia–forebrain circuit specialized for one discrete motor behavior, it may present a particularly tractable system for assessing what function the propagation of correlated activity plays in motor learning and behavior, as well as whether factors such as dopamine modulate such correlation and to what effect.
Appendix: Details of Data Analysis
Coherency function
To calculate the coherency, we first calculated the cross-correlation (Perkel et al., 1967) and cross-covariance functions (Perkel et al., 1967; Aertsen et al., 1989). The cross-correlation of a spike train rB(t) relative to a second spike train rA(t) as a function of τ [time delay relative to spikes in rA(t); we examined τ values of up to 1 sec] is given by:
 |
(1) |
where T is the duration of the signal being analyzed, and 〈〉 indicates that the measure is averaged across all trials.
The cross-covariance corrects for mean firing rates in each neuron, effectively measuring how deviations in firing rate from the expected mean in one recording site are correlated with deviations in firing rate from the expected mean in another recording site. The cross-covariance between neurons A and B is given by:
 |
(2) |
where r̄A(t) and r̄B(t) are the time-varying mean firing rates of the neurons. Both the cross-correlation and the cross-covariance are in units of spikes per second squared, and their absolute values depend on the firing rates of each cell (in the case of the cross-covariance, the mean firing rates). To obtain a normalized measure, the cross-covariance (or the cross-correlation) can be divided by the variance in the firing rates of each cell, effectively obtaining a cross-correlation coefficient measure. The cross-correlation coefficient is given by:
 |
(3) |
where
 |
and similarly for
 . Such cross-correlation coefficients represent a probability of firing in one cell (the “target” neuron) relative to the firing in the “reference” cell and vary between –1 and 1, with 1 reflecting perfect correlation (and –1, anticorrelation) and zero reflecting independence between the two trains of spikes.
When using cross-correlations to assess functional connectivity, it is critical to correct for correlated firing that simply results from direct stimulus effects causing correlated fluctuations in time-varying mean firing rates (i.e., neurons in two entirely unconnected brain areas might show correlation if they both fired to BOS). The cross-covariance corrects for these fluctuations because it measures only how trial-to-trial deviations from the time-varying mean rates of each cell are correlated with each other. It can be estimated by calculating the shuffle-corrected cross-correlogram. We calculated the shuffle corrector for our data by correlating the response from A during the ith trial (of n trials total) with the response from B during the i + 1 trial (Fig. 2c,d). For i = n, i + 1 is set to be 1. We also calculated the average of all permutations of the shuffled corrector and found that the resulting distribution of the types of LMAN–RA coherency peaks, as well as their time delays, widths, and average strengths, was very similar to that observed when we used only one shuffle permutation. We therefore used the single permutation of shuffle cross-correlation for the data here. This shuffle corrector is an estimate of how the mean time-varying rate in neuron A covaries with the mean time-varying rate in neuron B across trials. In other words, it estimates the second term on the right side of Equation 2:
 |
Given the spike arrival bin window of dt (in our case, 10 msec), the number of trials n, and Tn, the length of the signal in integer units of dt, the shuffle-corrected cross-correlogram is then calculated by:
 |
(4) |
where
 (j) is the number of spikes recorded from neuron A during trial i in the jth time bin and, similarly,
 (j + k)inthe j + kth time bin for neuron B.
The shuffled cross-correlogram can then be normalized by the variance of spike firing rates as described in Equation 3 to provide a measure between –1 and 1. Note the magnitude of the shuffle corrector function in Figure 2c, illustrating the importance of this correction for stimulus-driven activity in particular.
Another possible source of cross-covariance between two neurons that does not reflect true neuronal interaction between these cells is the temporal structure of firing with each neuron. For instance, assume that a spike in neuron A triggers a spike in neuron B; however, neuron A is a bursting neuron and has a high probability of firing again after it has fired once. Hence, the second spike in the burst of A will also be correlated to the spike in B, although the spike was actually triggered by the first spike in A. To correct for this type of correlation, we calculated the coherency function (Rosenberg et al., 1989) (Fig. 2e,f). The coherency function extends the normalization by replacing the variance in the denominator of Equation 3 by the autocovariance function of each of the two spike trains. This additional normalization takes into account bursting or other temporally structured behavior in either neuron A or B (or both) that would result in additional or artificially large and wide peaks in the cross-covariance function (see Fig. 2c–f). In practice, the coherency is calculated in the frequency domain. The coherency is given by:
 |
(5) |
where CA – B(ω) is the Fourier transform of the cross-covariance between the responses from A and B, and CA – A(ω) and CB – B(ω) are the Fourier transforms of the autocovariance of activity from neurons A and B, respectively. For plotting purposes, the coherency in the time-domain is then calculated by taking the inverse Fourier transform of Equation 5.
Strength of correlated activity
The peak amplitude or the area underneath the peak of cross-correlation functions is often used to estimate the strength of the correlation (Abeles et al., 1993; Cardoso de Oliveira et al., 1997; Brecht et al., 1998; Bair et al., 2001). However, a better estimate of the degree of association is to calculate the average strength across all time delays within the peak. Because correlations at different time delays are not independent in the time domain, this is a complicated calculation but is relatively simple in the frequency domain. To do this for the coherency, one must calculate the square root of the average coherency square in the frequency domain for frequencies below the Nyquist limit given by dt (the time bin window). From Parseval's theorem, however, the average coherency square can also be obtained in the time domain by integrating the square of the coherency over time bins. To estimate the average coherency square for each peak, the area under the square of the coherency for that peak was divided by the time bin dt. The area under the coherency squared was estimated from the amplitude square of the peak multiplied by 2.5 times the width of the peak (the factor 2.5 is required to estimate the area under a Gaussian curve). Thus, the average coherency strength represented by a peak is:
 |
The average coherency square as a measure of the association between two time series is essentially equivalent to the correlation coefficient between two variables and indicates the degree of linear relationship between the variability of two firing rates. Like correlation coefficients, this measure is unitless. It should be noted that, in general, measures of correlation strength are strongly dependent on the size of the time bin, and this must taken into account when comparing such values across different studies.
Figure 2, g and h, compares the average strength of coherency and of the normalized cross-covariance of LMAN and RA activity (calculated as above) for two well separated peaks. It is clear that the cross-covariance measure can overestimate the strength of association between LMAN and RA activity, validating our use of the coherency as a measure of correlated activity.
Footnotes
This work was supported by National Institutes of Health (NIH) Grants MH55987, NS34835, and DC04975 (A.J.D.), NIH Grants MH11209 and MH59189 (F.E.T.), a National Institute of General Medical Sciences training grant (R.R.K.), and grants from the Sloan–Swartz Centers for Theoretical Neurobiology, the EJLB Foundation, and the National Alliance for Research on Schizophrenia and Depression. We thank Adria Arteseros, Robin Booth, Laszlo Bocskai, Cooper Roddey, David Schleef, and Brian Wright for excellent technical assistance and Dean Buonomano, Steve Lisberger, Michael Stryker, Kamal Sen, and Todd Troyer for comments on earlier versions of this manuscript.
Correspondence should be addressed to Allison J. Doupe, Department of Physiology, University of California, 513 Parnassus Avenue, Box 0444, San Francisco, CA 94143-0444. E-mail: ajd@phy.ucsf.edu.
Dr. Kimpo's present address: Department of Neurobiology, Stanford University, Stanford, CA 94305-5125.
Copyright © 2003 Society for Neuroscience 0270-6474/03/235750-12$15.00/0
References
- Abeles M ( 1982) Local cortical circuits: an electrophysiological study. Berlin: Springer.
- Abeles M ( 1991) Corticonics: neural circuits of the cerebral cortex. Cambridge, UK: Cambridge UP.
- Abeles M, Vaadia E, Bergman H, Prut Y, Haalman I, Slovin H ( 1993) Dynamics of neuronal interaction in the frontal cortex of behaving monkeys. In: Concepts in Neuroscience, Vol 4, pp 131–158. Singapore: World Scientific. [Google Scholar]
- Aertsen AMHJ, Gerstein GL, Habib MK, Palm G ( 1989) Dynamics of neuronal firing correlation: modulation of “effective connectivity.” J Neurophysiol 61: 900–917. [DOI] [PubMed] [Google Scholar]
- Alonso J, Martinez LM ( 1998) Functional connectivity between simple cells and complex cells in cat striate cortex. Nat Neurosci 1: 395–403. [DOI] [PubMed] [Google Scholar]
- Appeltants D, Absil P, Balthazart J, Ball GF ( 2000) Identification of the origin of catecholaminergic inputs to HVc in canaries by retrograde tract tracing combined with tyrosine hydroxylase immunocytochemistry. J Chem Neuroanat 18: 117–133. [DOI] [PubMed] [Google Scholar]
- Bair W, Zohary E, Newsome WT ( 2001) Correlated firing in macaque visual area MT: time scales and relationship to behavior. J Neurosci 21: 1676–1697. [DOI] [PMC free article] [PubMed] [Google Scholar]
- Bar-Gad I, Bergman H ( 2001) Stepping out of the box: information processing in the neuronal networks of the basal ganglia. Curr Opin Neurobiol 11: 689–695. [DOI] [PubMed] [Google Scholar]
- Bergman H, Feingold A, Nini A, Raz A, Slovin H, Abeles M, Vaadia E ( 1998) Physiological aspects of information processing in the basal ganglia of normal and parkinsonian primates. Trends Neurosci 21: 32–38. [DOI] [PubMed] [Google Scholar]
- Bevan MD, Magill PJ, Terman D, Bolam JP, Wilson CJ ( 2002) Move to the rhythm: oscillations in the subthalamic nucleus-external globus pallidus network. Trends Neurosci 25: 525–531. [DOI] [PubMed] [Google Scholar]
- Bi G, Poo M ( 1999) Distributed synaptic modification in neural networks induced by patterned stimulation. Nature 401: 792–796. [DOI] [PubMed] [Google Scholar]
- Boettiger CA, Doupe AJ ( 2001) Developmentally restricted synaptic plasticity in a songbird nucleus required for song learning. Neuron 31: 809–818. [DOI] [PubMed] [Google Scholar]
- Bolam JP, Hanley JJ, Booth PA, Bevan MD ( 2000) Synaptic organisation of the basal ganglia. J Anat 196: 527–542. [DOI] [PMC free article] [PubMed] [Google Scholar]
- Bottjer SW ( 1993) The distribution of tyrosine hydroxylase immunoreactivity in the brains of male and female zebra finches. J Neurobiol 24: 51–69. [DOI] [PubMed] [Google Scholar]
- Bottjer SW, Johnson F ( 1997) Circuits, hormones, and learning: vocal behavior in songbirds. J Neurobiol 33: 602–618. [DOI] [PubMed] [Google Scholar]
- Bottjer SW, Miesner EA, Arnold AP ( 1984) Forebrain lesions disrupt development but not maintenance of song in passerine birds. Science 224: 901–903. [DOI] [PubMed] [Google Scholar]
- Bottjer SW, Haselma KA, Brown SA, Miesner EA ( 1989) Axonal connections of a forebrain nucleus involved with vocal learning in zebra finches. J Comp Neurol 279: 312–326. [DOI] [PubMed] [Google Scholar]
- Brainard MS, Doupe AJ ( 2000) Interruption of a basal ganglia-forebrain circuit prevents plasticity of learned vocalizations. Nature 404: 762–766. [DOI] [PubMed] [Google Scholar]
- Brecht M, Singer W, Engel AK ( 1998) Correlation analysis of corticotectal interactions in the cat visual system. J Neurophysiol 79: 2394–2407. [DOI] [PubMed] [Google Scholar]
- Cardoso de Oliveira S, Thiele A, Hofmann K ( 1997) Synchronization of neuronal activity during stimulus expectation in a direction discrimination task. J Neurosci 17: 9248–9260. [DOI] [PMC free article] [PubMed] [Google Scholar]
- Collingridge GL, Lester RA ( 1989) Excitatory amino acid receptors in the vertebrate central nervous system. Pharmacol Rev 41: 143–210. [PubMed] [Google Scholar]
- Dan Y, Alonso JM, Usrey WM, Reid RC ( 1998) Coding of visual information by precisely correlated spikes in the lateral geniculate nucleus. Nat Neurosci 1: 501–507. [DOI] [PubMed] [Google Scholar]
- Dave AS, Margoliash D ( 2000) Song replay during sleep and computational rules for sensorimotor vocal learning. Science 290: 812–816. [DOI] [PubMed] [Google Scholar]
- Dave AS, Yu AC, Margoliash D ( 1998) Behavioral state modulation of auditory activity in a vocal motor system. Science 282: 2250–2254. [DOI] [PubMed] [Google Scholar]
- Diesmann M, Gewaltig M, Aertsen A ( 1999) Stable propagation of synchronous spiking in cortical neural networks. Nature 402: 529–533. [DOI] [PubMed] [Google Scholar]
- Doupe AJ ( 1997) Song- and order-selective neurons in the songbird anterior forebrain and their emergence during vocal development. J Neurosci 17: 1147–1167. [DOI] [PMC free article] [PubMed] [Google Scholar]
- Doya K, Sejnowski TJ ( 1998) A computational model of birdsong learning by auditory experience and auditory feedback. In: Central auditory processing and neural modeling (Poon PWF, Brugge JF, eds), pp 77–88. New York: Plenum.
- Dutar P, Vu HM, Perkel DJ ( 1998) Multiple cell types distinguished by physiological, pharmacological, and anatomic properties in nucleus HVc of the adult zebra finch. J Neurophysiol 80: 1828–1838. [DOI] [PubMed] [Google Scholar]
- Eggermont JJ ( 1992) Neural interaction in cat primary auditory cortex: dependence on recording depth, electrode separation, and age. J Neurophysiol 68: 1216–1228. [DOI] [PubMed] [Google Scholar]
- Eggermont JJ, Smith GM ( 1996) Neural connectivity only accounts for a small part of neural correlation in auditory cortex. Exp Brain Res 110: 379–391. [DOI] [PubMed] [Google Scholar]
- Fetz EE, Cheney PD ( 1980) Postspike facilitation of forelimb muscle activity by primate corticomotoneuronal cells. J Neurophysiol 44: 751–772. [DOI] [PubMed] [Google Scholar]
- Fortune ES, Margoliash D ( 1995) Parallel pathways and convergence onto HVc and adjacent neostriatum of adult zebra finches (Taeniopygia guttata). J Comp Neurol 360: 413–441. [DOI] [PubMed] [Google Scholar]
- Foster EF, Bottjer SW ( 1998) Axonal connections of the high vocal center and surrounding cortical regions in juvenile and adult male zebra finches. J Comp Neurol 397: 118–138. [PubMed] [Google Scholar]
- Frostig RD, Gottlieb Y, Vaadia E, Abeles M ( 1983) The effects of stimuli on the activity and functional connectivity of local neuronal groups in cat auditory cortex. Brain Res 272: 211–221. [DOI] [PubMed] [Google Scholar]
- Gochin PM, Miller EK, Gross CG, Gerstein GL ( 1991) Functional interactions among neurons in inferior temporal cortex of the awake macaque. Exp Brain Res 84: 505–516. [DOI] [PubMed] [Google Scholar]
- Graybiel AM ( 1998) The basal ganglia and chunking of action repertoires. Neurobiol Learn Mem 70: 119–136. [DOI] [PubMed] [Google Scholar]
- Graybiel AM, Aosaki T, Flaherty AW, Kimura M ( 1994) The basal ganglia and adaptive motor control. Science 265: 1826–1831. [DOI] [PubMed] [Google Scholar]
- Hahnloser RHR, Kozhevnikov AA, Fee MS ( 2002) An ultra-sparse code underlies the generation of neural sequences in a songbird. Nature 419: 65–70. [DOI] [PubMed] [Google Scholar]
- Hessler NA, Doupe AJ ( 1999) Singing-related neural activity in a dorsal forebrain-basal ganglia circuit of adult zebra finches. J Neurosci 19: 10461–10481. [DOI] [PMC free article] [PubMed] [Google Scholar]
- Johnson F, Sablan MM, Bottjer SW ( 1995) Topographic organization of a forebrain pathway involved with vocal learning in zebra finches. J Comp Neurol 358: 260–278. [DOI] [PubMed] [Google Scholar]
- Kincaid AE, Wilson CJ ( 1996) Corticostriatal innervation of the patch and matrix in the rat neostriatum. J Comp Neurol 374: 578–592. [DOI] [PubMed] [Google Scholar]
- Kincaid AE, Zheng T, Wilson CJ ( 1998) Connectivity and convergence of single corticostriatal neurons. J Neurosci 18: 4722–4731. [DOI] [PMC free article] [PubMed] [Google Scholar]
- Lewis JW, Ryan SM, Arnold AP, Butcher LL ( 1981) Evidence for a catecholaminergic projection to area X in the zebra finch. J Comp Neurol 196: 347–354. [DOI] [PubMed] [Google Scholar]
- Louie K, Wilson MA ( 2001) Temporally structured replay of awake hippocampal ensemble activity during rapid eye movement sleep. Neuron 29: 145–156. [DOI] [PubMed] [Google Scholar]
- Luo M, Perkel DJ ( 1999) A GABAergic, strongly inhibitory projection to a thalamic nucleus in the zebra finch song system. J Neurosci 19: 6700–6711. [DOI] [PMC free article] [PubMed] [Google Scholar]
- Luo M, Ding L, Perkel DJ ( 2001) An avian basal ganglia pathway essential for vocal learning forms a closed topographic loop. J Neurosci 21: 6836–6845. [DOI] [PMC free article] [PubMed] [Google Scholar]
- Mason A, Nicoll A, Stratford K ( 1991) Synaptic transmission between individual pyramidal neurons of the rat visual cortex in vitro J Neurosci 11: 72–84. [DOI] [PMC free article] [PubMed] [Google Scholar]
- Middleton FA, Strick PL ( 2000) Basal ganglia output and cognition: evidence from anatomical, behavioral, and clinical studies. Brain Cogn 42: 183–200. [DOI] [PubMed] [Google Scholar]
- Mooney R ( 1992) Synaptic basis for developmental plasticity in a birdsong nucleus. J Neurosci 12: 2464–2477. [DOI] [PMC free article] [PubMed] [Google Scholar]
- Murthy VN, Fetz EE ( 1996) Oscillatory activity in sensorimotor cortex of awake monkeys: synchronization of local field potentials and relation to behavior. J Neurophysiol 76: 3949–3967. [DOI] [PubMed] [Google Scholar]
- Nottebohm F, Stokes TM, Leonard CM ( 1976) Central control of song in the canary, Serinus canarius. J Comp Neurol 165: 457–486. [DOI] [PubMed] [Google Scholar]
- Nottebohm F, Kelley DB, Paton JA ( 1982) Connections of vocal control nuclei in the canary telencephalon. J Comp Neurol 207: 344–357. [DOI] [PubMed] [Google Scholar]
- Okuhata S, Saito N ( 1987) Synaptic connections of thalamo-cerebral vocal control nuclei of the canary. Brain Res Bull 18: 35–44. [DOI] [PubMed] [Google Scholar]
- Parent A, Sato F, Wu Y, Gauthier J, Levesque M, Parent M ( 2000) Organization of the basal ganglia: the importance of axonal collateralization. Trends Neurosci 23: S20–S27. [DOI] [PubMed] [Google Scholar]
- Perkel DH, Gerstein GL, Moore GP ( 1967) Neuronal spike trains and stochastic point processes II. Simultaneous spike trains. Biophys J 7: 419–440. [DOI] [PMC free article] [PubMed] [Google Scholar]
- Perkel DJ, Farries MA ( 2000) Complementary “bottom-up” and “top-down” approaches to basal ganglia function. Curr Opin Neurobiol 10: 725–731. [DOI] [PubMed] [Google Scholar]
- Raz A, Feingold A, Zelanskaya V, Vaadia E, Bergman H ( 1996) Neuronal synchronization of tonically active neurons in the striatum of normal and parkinsonian primates. J Neurophysiol 76: 2083–2088. [DOI] [PubMed] [Google Scholar]
- Raz A, Frechter-Mazar V, Feingold A, Abeles M, Vaadia E, Bergman H ( 2001) Activity of pallidal and striatal tonically active neuron is correlated in MPTP-treated monkeys but not in normal monkeys. J Neurosci 21: 1–5. [DOI] [PMC free article] [PubMed] [Google Scholar]
- Riehle A, Grun S, Diesmann M, Aertsen A ( 1997) Spike synchronization and rate modulation differentially involved in motor cortical function. Science 278: 1950–1953. [DOI] [PubMed] [Google Scholar]
- Rosenberg JR, Amjad AM, Breeze P, Brillinger DR, Halliday DM ( 1989) The Fourier approach to the identification of functional coupling between neuronal spike trains. Prog Biophys Mol Biol 53: 1–31. [DOI] [PubMed] [Google Scholar]
- Ruskin DN, Bergstrom DA, Kaneoke Y, Patel BN, Twery MJ, Walters JR ( 1999) Multisecond oscillations in firing rate in the basal ganglia: robust modulation by dopamine receptor activation and anesthesia. J Neurophysiol 81: 2046–2055. [DOI] [PubMed] [Google Scholar]
- Scharff C, Nottebohm F ( 1991) A comparative study of the behavioral deficits following lesions of the various parts of the zebra finch song system: Implications for vocal learning. J Neurosci 11: 2896–2913. [DOI] [PMC free article] [PubMed] [Google Scholar]
- Shadlen MN, Newsome WT ( 1998) The variable discharge of cortical neurons: implications for connectivity, computation, and information coding. J Neurosci 18: 3870–3896. [DOI] [PMC free article] [PubMed] [Google Scholar]
- Singer W, Gray CM ( 1995) Visual feature integration and the temporal correlation hypothesis. Annu Rev Neurosci 18: 555–586. [DOI] [PubMed] [Google Scholar]
- Soha JA, Shimizu T, Doupe AJ ( 1996) Development of the catecholaminergic innervation of the song system of the male zebra finch. J Neurobiol 29: 473–489. [DOI] [PubMed] [Google Scholar]
- Sohrabji F, Nordeen EJ, Nordeen KW ( 1990) Selective impairment of song learning following lesions of a forebrain nucleus in the juvenile zebra finch. Behav Neural Biol 53: 51–63. [DOI] [PubMed] [Google Scholar]
- Solis MM, Doupe AJ ( 1997) Anterior forebrain neurons develop selectivity by an intermediate stage of birdsong learning. J Neurosci 17: 6447–6462. [DOI] [PMC free article] [PubMed] [Google Scholar]
- Solis MM, Doupe AJ ( 1999) Contribution of tutor and bird's own song experience to neural selectivity in the songbird anterior forebrain. J Neurosci 19: 4559–4584. [DOI] [PMC free article] [PubMed] [Google Scholar]
- Spiro JE, Dalva MB, Mooney R ( 1999) Long-range inhibition within the zebra finch song nucleus RA can coordinate the firing of multiple projection neurons. J Neurophysiol 18: 3007–3020. [DOI] [PubMed] [Google Scholar]
- Stern EA, Jaeger D, Wilson CJ ( 1998) Membrane potential synchrony of simultaneously recorded striatal spiny neurons in vivo Nature 394: 475–478. [DOI] [PubMed] [Google Scholar]
- Stevens CF, Zador AM ( 1998) Input synchrony and the irregular firing of cortical neurons. Nat Neurosci 1: 210–217. [DOI] [PubMed] [Google Scholar]
- Stroeve S, Gielen S ( 2001) Correlation between uncoupled conductance-based integrate-and-fire neurons due to common and synchronous presynaptic firing. Neural Comput 13: 2005–2029. [DOI] [PubMed] [Google Scholar]
- Sutherland GR, McNaughton B ( 2000) Memory trace reactivation in hippocampal and neocortical neuronal ensembles. Curr Opin Neurobiol 10: 180–186. [DOI] [PubMed] [Google Scholar]
- Sutter ML, Margoliash D ( 1994) Global synchronous response to autogenous song in zebra finch HVc. J Neurophysiol 72: 2105–2123. [DOI] [PubMed] [Google Scholar]
- Tarnecki R, Zurawska I ( 1989) Functional relations between neighboring neurons of nucleus interpositus of the cat cerebellum. Acta Physiol Pol 40: 456–472. [PubMed] [Google Scholar]
- Theunissen F, Miller JP ( 1995) Temporal encoding in nervous systems: a rigorous definition. J Comput Neurosci 2: 149–162. [DOI] [PubMed] [Google Scholar]
- Thomson DJ, Chave AD ( 1991) Jackknifed error estimates for spectra, coherences, and transfer functions. In: Advances in spectrum analysis and array processing (Haykin S, ed), pp 58–113. Englewood Cliffs, NJ: Prentice Hall.
- Troyer TW, Doupe AJ ( 2000) An associational model of birdsong sensorimotor learning I. Efference copy and the learning of song syllables. J Neurophysiol 84: 1204–1223. [DOI] [PubMed] [Google Scholar]
- Usrey WM, Reppas JB, Reid RC ( 1998) Paired-spike interactions and the synaptic efficacy of retinal inputs to the thalamus. Nature 395: 384–387. [DOI] [PubMed] [Google Scholar]
- Usrey WM, Alonso J, Reid RC ( 2000) Synaptic interactions between thalamic inputs to simple cells in cat visual cortex. J Neurosci 20: 5461–5467. [DOI] [PMC free article] [PubMed] [Google Scholar]
- Vaadia E, Haalman I, Abeles M, Bergman H, Prut Y, Slovin H, Aertsen A ( 1995) Dynamics of neuronal interactions in monkey cortex in relation to behavioural events. Nature 373: 515–518. [DOI] [PubMed] [Google Scholar]
- Vates GE, Nottebohm F ( 1995) Feedback circuitry within a song-learning pathway. Proc Natl Acad Sci USA 92: 5139–5143. [DOI] [PMC free article] [PubMed] [Google Scholar]
- Vates GE, Vicario DS, Nottebohm F ( 1997) Reafferent thalamo-“cortical” loops in the song system of oscine songbirds. J Comp Neurol 380: 275–290. [PubMed] [Google Scholar]
- Vu ET, Mazurek ME, Kuo Y ( 1994) Identification of a forebrain motor programming network for the learned song of zebra finches. J Neurosci 14: 6924–6934. [DOI] [PMC free article] [PubMed] [Google Scholar]
- Williams H, Mehta N ( 1999) Changes in adult zebra finch song require a forebrain nucleus that is not necessary for song production. J Neurobiol 39: 14–28. [PubMed] [Google Scholar]