

Abstract
Two-dimensional reversed-phase capillary liquid chromatography (2D RPLC) separations have enabled comprehensive proteome profiling of biological systems. However, milligram sample quantities of proteins are typically required due to significant losses during offline fractionation. Such a large sample requirement generally precludes the application samples in the nanogram to low-microgram range. To achieve in-depth proteomic analysis of such small-sized samples, we have developed the nanoFAC (nanoflow Fractionation and Automated Concatenation) 2D RPLC platform, in which the first dimension high-pH fractionation was performed on a 75-μm i.d. capillary column at a 300 nL/min flow rate with automated fraction concatenation, instead of on a typically used 2.1 mm column at a 200 μL/min flow rate with manual concatenation. Each fraction was then fully transferred to the second-dimension low-pH nanoLC separation using an autosampler equipped with a custom-machined syringe. We have found that using a polypropylene 96-well plate as collection device as well as the addition of n-Dodecyl β-D-maltoside (0.01%) in the collection buffer can significantly improve sample recovery. We have demonstrated the nanoFAC 2D RPLC platform can achieve confident identifications of ~49,000–94,000 unique peptides, corresponding to ~6,700–8,300 protein groups using only 100–1000 ng of HeLa tryptic digest (equivalent to ~500–5,000 cells). Furthermore, by integrating with phosphopeptide enrichment, the nanoFAC 2D RPLC platform can identify ~20,000 phosphopeptides from 100 μg of MCF-7 cell lysate.
Graphical abstract

Many functional significant proteins altered in different human diseases are often expressed at low-abundance.1,2 Unfortunately, low-abundance proteins are often not detectable in mass spectrometry (MS)-based proteomic analysis due to insufficient detection sensitivity and limited MS sequencing speed. While one-dimensional liquid chromatography (LC)-MS/MS analyses exhibit a high degree of reproducibility, short analysis times, and low sample requirements,3–5 the proteome coverage is usually below 3000–4000 proteins due to limited peak capacities even with increased column lengths and gradient times.6–9 Using the latest-generation MS instrumentation, such as Bruker timsTOF Pro and Thermo-Fisher FAIMS-Lumos, proteome coverage could increase to 6000–7000 proteins10,11 by injecting microgram-scale protein digest. However, these advanced mass spectrometers are not always available in the majority of proteomics laboratories. Thus, there is a great need to develop high-resolution separation systems to improve proteome coverage and to enable the detection of low-abundance proteins.12
Multidimensional LC separations provide increased overall peak capacity that results in decreased sample complexity in each fraction, thus enabling dramatically increased proteome coverage.12,13 The combination of the first-dimension strong cation exchange (SCX) or high-pH reversed-phase (RP)LC fractionation followed by the second-dimension nanoRPLC separation are the most commonly used multidimensional separation modes for in-depth proteomics.14,15 Compared to SCX fractionation, high-pH RPLC provides broader peptide applicability as well as greater peak capacities and resolving power.15–18 The integration of high-pH RPLC with fraction concatenation techniques has further improved the orthogonality and reduced the analysis time with two-dimensional (2D) LC-MS.19 Because of these advantages, 2D separation methods with high-pH RPLC fractionation have been extensively adopted by the proteomics community, such as large-scale proteomic analyses, bottom-up global profiling, analysis of protein post-translational modifications (phosphoproteomics and glycoproteomics), and top-down proteomics.12,17 In addition, the incorporation of 2D-RPLC with an isobaric labeling (tandem mass tags, TMT)-based quantification method significantly improved the quantification accuracy by minimizing the ratio compression effect.20
However, these 2D RPLC-MS approaches have typically required milligrams of protein samples, precluding their application to studies involving low microgram down to nanogram samples. Such minute samples include clinical specimens obtained via fine needle aspiration biopsy, tissue substructures, miniorgans, or specific cell populations isolated by laser capture microdissections and rare cells isolated by fluorescence-activated cell sorting.21 The large sample requirements are of consequence to compensate significant sample losses during offline fractionation procedures, where high-pH separation is typically performed at high flow rates (~1 mL/min for 4.6 mm columns and ~200 μL/min for 2.1 mm columns) and collected fractions have milliliter scale volumes. Nonspecific adsorption of peptides to, for example, vessel surfaces is a significant component of such sample losses, and these losses are further exacerbated by cleanup or buffer exchange, for example, SpeedVac concentration. To improve the sample recovery, Mann and co-workers22 demonstrated a microflow fractionation system in which a 250-μm-i.d. column operating at 2 μL/min was used for high-pH separation and fractions were collected into the bottom of 200-μL PCR tube strips. The low-flow fractionation reduced interactive surface losses and enabled deep proteomic profiling of ~20,000 peptides using 500 ng of HeLa digest. To further reduce sample loss and improve the proteome coverage of low-nanogram samples, we recently developed a nanowell-mediated 2D nanoLC platform, in which the high-pH RPLC was performed at 300 nL/min and the fractions were collected in microfabricated nanowells.23 Using only 50 ng of HeLa digest, ~50,000 peptides corresponding to ~6,000 proteins could be confidently identified from 12 fractions. In combination with a nanowell-based proteomic sample processing method,24 >6,000 proteins were identified from both 650 cultured HeLa cells and islet sections equivalent to <1 pancreatic islet (equivalent to ~1,000 cells) isolated by laser microdissection. However, despite such a significant advance, the nanowell-mediated 2D LC platform required in-house-developed nanowell devices and robotic nanoliter sample handling systems, as well as tedious manual fraction transfer to the second-dimension LC separation, which inhibits the broader use of this technology.
To address these challenges, herein we describe a fully automated and highly sensitive 2D RPLC separation system based on the nanoFAC (nanoflow Fractionation and Automated Concatenation) strategy. Inspired by previous studies,22,23 we performed high-pH fractionation at 300 nL/min using a 75-μm i.d. LC column and then collected fractions into 96-well plates in which each well was preloaded with 25 μL of collection buffer. We performed comprehensive optimization of collection devices and buffer systems to reduce peptide losses. To maximize protein identifications, each fraction was fully transferred to the second-dimension nanoLC separation using a modified sample injection system. This provides deep proteomic coverage of ~49,000 unique peptides corresponding to ~6,700 protein groups from only 100 ng of HeLa tryptic digest (equivalent to ~500 cells). To further evaluate its performance for phosphoproteomics analysis, we demonstrated phosphopeptide enrichment using immobilized metal affinity chromatography (IMAC) from 100 μg of MCF-7 digest (equivalent to 0.5 million cells) and enabling the confident identification of ~20,000 phosphopeptides.
EXPERIMENTAL SECTION
Reagents and Chemicals.
Pierce HeLa Protein Digest Standard was purchased from ThermoFisher Scientific (Waltham, MA). N-Dodecyl-β-D-maltoside (DDM) and Mastoparan peptide (CAS 72093–21-1, a cell-permeable synthetic peptide with a sequence identical to Vespula lewisii), were purchased from Sigma-Aldrich (St. Louis, MO). Dithiothreitol (DTT) and iodoacetamide (IAA) were purchased from ThermoFisher Scientific and were freshly prepared in 50 mM ammonium bicarbonate buffer before use. MS-grade trypsin was purchased from Promega (Madison, WI). All aqueous solutions were prepared using 18.2 MΩ deionized water produced from a Barnstead Nanopure Infinity system (Los Angeles, CA). Unless otherwise noted, all other unmentioned reagents were obtained from Sigma-Aldrich (St. Louis, MO).
Cell Culture and Proteomic Sample Preparation.
Culture of the bacterium Shewanella oneidensis MR-1 was under fed-batch mode using a Bioflow 3000 fermentor (New Brunswick Scientific, Enfield, NC). Culture media contained HBa MR-1 with 0.5 mL/L of 100 mM ferric NTA, 1 mL/L of 1 mM Na2SeO4, and 1 mL/L of 3 M MgCl2∙6H2O as well as vitamins and amino acids. Bacterial cells were lysed by homogenization with 0.1 mm zirconia/silica beads in the Bullet Blender (Next Advance, Averill Park, NY) at speed 8,000 rpm for 3 min. Protein was extracted using 8 M urea, and the concentration was measured by BCA assay.
Breast cancer cell line MCF-7 was obtained from ATCC (Manassas, VA) and was grown as previously described.25 In brief, MCF-7 cells were maintained in Dulbecco’s Modified Eagle Medium supplemented with 10% heat-inactivated fetal bovine serum, 100 U/mL penicillin, and 100 μg/mL streptomycin, all of which were obtained from ThermoFisher Scientific. Cells were seeded into 15 cm culture plates and grown until near confluence at 37 °C with 5% CO2. MCF-7 cells were harvested and washed three times with ice-cold phosphate-buffered saline (PBS), lysed in lysis buffer (100 mM NH4HCO3, pH 8.0, 8 M urea, and 1% phosphatase inhibitor), and then sonicated in an ice bath for 3 min. The protein concentrations were determined via BCA protein assay.
Following protein extraction and denaturation, 500 mM of DTT solution was added to obtain a 10 mM concentration, and the sample was incubated at 37 °C for 1 h. After that, 400 mM of IAA solution was added to obtain a concentration of 40 mM in the sample, and the sample was incubated at 37 °C for 1 h in the dark. The sample was diluted 10-fold with 50 mM ammonium bicarbonate to reduce the salt concentration. Then 1 M of CaCl2 solution was added to obtain a final concentration of 1 mM. Trypsin at a concentration of 1 μg trypsin/50 μg protein was added, and the sample was incubated at 37 °C for 3 h for digestion. After trypsin incubation, we performed C18 solid-phase extraction cleanup to desalt the sample and the sample was aliquoted for long-term storage at −80 °C.
Phosphopeptide Enrichment.
Phosphopeptide enrichment was performed as previously described.25 In brief, peptide samples were incubated with 10 μL Fe3+NTA agarose beads at room temperature for 30 min with shaking and the supernatant was discarded. The beads were resuspended in 80% acetonitrile/0.1% trifluoroacetic acid and loaded on Empore C18 silica-packed Stage Tips (already activated by methanol, 50% acetonitrile/0.1% formic acid, and 1% formic acid). After washing the beads with 80% acetonitrile/0.1% trifluoroacetic acid and 1% formic acid, the phosphopeptides were eluted from the IMAC beads to the C18 membrane with 500 mM phosphate buffer (pH 7.0). The phosphopeptides were then washed with 1% formic acid and eluted into sample vials with or without the addition of DDM. Eluted phosphopeptides were dried down and stored at −80 °C until LC-MS/MS analysis.
Optimization of Offline Fractionation Conditions.
Shewanella oneidensis MR-1 digest was used for optimizing fractionation conditions by comparing the identifications of unique peptides and proteins under different conditions using a single-shot nanoLC-MS/MS system. The optimizations include collection buffer additives (DDM vs Mastoparan peptide), additive concentrations (0.005–0.1%), collection devices (glass vials vs 96-well PCR plate), and collection buffers (LC mobile phase A vs Tris). The glass vial (1 mL, Total Recovery Vial) was purchased from Waters (Milford, MA), and the 96-well plate (twin.tec PCR Plate 96, skirted, 150 μL) was purchased from Eppendorf (Hauppauge, NY).
A 50 cm-long, 50-μm-i.d. PicoFrit column was packed in-house using 3 μm C18 media (300-Å pore size, Phenomenex, Terrence, CA) and was used for peptide separation as described previously.26,27 Mobile phase (Buffer A: 0.1% formic acid in water; Buffer B: 0.1% formic acid in acetonitrile) was delivered by a nanoUPLC pump (Dionex UltiMate NCP-3200RS, Thermo Scientific, Waltham, MI) at a flow rate of 150 nL/min. The LC column was heated to 50 °C using a flexible column heater (AgileSleeve Plus, Analytical Sales and Services, Inc., Flanders, NJ). The LC method was programmed as a 100 min linear gradient from 8% to 22% Buffer B followed by a 15 min linear gradient to 45% Buffer B. The column was then washed with 90% Buffer B for 5 min and re-equilibrated with 2% Buffer B for 20 min.
An LTQ Orbitrap XL mass spectrometer (ThermoFisher) was employed to optimize buffer additives (DDM and Mastoparan peptide) and DDM concentrations (0.005–0.1%). Briefly, a potential of 2.2 kV was applied at the ionization source and the ion collection capillary was heated to 250 °C for desolvation. The orbitrap was employed for MS1 at a resolution of 60,000 (m/z 200), an MS range of 375–1575, an AGC level of 1 × 10⁶, and a maximum ion injection time of 50 ms. Precursors with intensities >500 and charge states of 2 or greater were isolated at a 2-Da window for MS/MS sequencing in the ion trap. An AGC target of 3 × 10⁴ and an ion injection time of 100 ms were used. For CID fragmentation, the collision energy was set at 35% and the activation time was 30 ms. Precursors with m/z tolerance of ±50 ppm were excluded for sequencing during 90 s.
An Q Exactive hybrid quadrupole-Orbitrap mass spectrometer (ThermoFisher) was used to optimize collection devices (glass vial and 96-well plate) and collection buffers (Buffer A and Tris). Data-dependent acquisition mode was used to trigger precursor isolation and sequencing. The precursor was scanned at a resolution of 35,000, a scan range of 300–1800, an AGC level of 3 × 10⁶, and a maximum ion accumulation time of 50 ms. The top 12 precursor ions having intensities >4 × 10⁴ and charges between +2 and +8 were selected with an isolation window of 2 Da for MS/MS sequencing at an HCD energy of 30%. The AGC target was 2 × 10⁵, and the maximum ion accumulation time was 120 ms. A dynamic exclusion with duration of 30 s was used to reduce repeated sequencing.
Nanoflow High-pH LC Fractionation.
LC columns (75 μm i.d., 360 o.d., 50 cm long) for first dimension high-pH nanoLC fractionation were packed in house with 3-μm C18 packing material (300-Å pore size, Phenomenex, Terrence, CA).26,27 A nanoACQUITY UPLC pump (Waters, Milford, MA) was used to deliver gradient flow to the LC column at a flow rate of 300 nL/min. Ten mM ammonium formate (pH 9.5) in water was used as Buffer A and 10 mM ammonium formate in 90% acetonitrile (pH 9.5) as Buffer B. The peptides were eluted using a gradient with a linear increase from 1% to 12% Buffer B in 20 min, followed by an increase to 30% Buffer B in 55 min, to 45% Buffer B in 22 min, and to 95% Buffer B in 3 min. The column was then washed with 95% Buffer B for 10 min and re-equilibrated with 1% Buffer B for 20 min.
Peptides eluted from the high-pH nanoLC separation were fractionated into a 96-well plate using a PAL autosampler (CTC Analytics AG, Switzerland).16 The 96-well plate was preloaded with 25 μL of Buffer A (0.1% formic acid in water) containing 0.01% (m/v) DDM. To obtain 12 or 6 fractions, peptide fractions were concatenated into each of the 12 or 6 wells at an interval of 1 min and then repeated 8 or 16 times during the 96 min LC separation (See Table S1 for concatenation detail). The PAL autosampler allowed us to automatically perform the concatenation by robotically moving the dispensing capillary among the collection wells. The 96-well plate with collected fractions was sealed with PCR sealing membrane and stored at −20 °C until the following low-pH nanoLC-MS/MS analysis.
Low-pH NanoLC-MS/MS Analysis.
A PAL autosampler (CTC Analytics AG, Switzerland) equipped with two six-port valves (Valco Instruments Co. Inc., Houston, TX) was used for sample injection. A Slimline model 1702 25 μL syringe (Hamilton Company, Reno, NV) was notched on the needle end with a depth of 200 um using a Mitsubishi Model FA10S Submerged Machining High-Speed Wire EDM (Chiyoda, Tokyo, Japan) equipped with a 200-μm electrode. The notched needle allowed it to contact the bottom of each well without creating a seal and draw all that fraction into the syringe. After being injected into a 25-μL loop, the sample was concentrated into an SPE column (150 μm i.d., 360 μm o.d., 4 cm long) at a flow rate of 5 μL/min and separated by low-PH nanoLC. The nanoLC column (50 μm i.d., 360 μm o.d., 50 cm length) was packed with 3-μm C18 packing material (300-Å pore size, Phenomenex, Terrence, CA).26 Mobile phases (Buffer A: 0.1% formic acid in water; Buffer B: 0.1% formic acid in acetonitrile) were delivered by a nanoUPLC pump (Dionex UltiMate NCP-3200RS, Thermo Scientific, Waltham, MA) at a flow rate of 150 nL/min. The LC method was programmed as a 100 min linear gradient from 8% to 22% Buffer B followed by a 15 min linear gradient to 45% Buffer B, after which the column was washed with 90% Buffer B for 5 min and re-equilibrated with 2% Buffer B for 20 min.
The separated peptides were analyzed using a Q Exactive plus hybrid quadrupole-Orbitrap mass spectrometer. The MS settings for HeLa digest were the same as those described above in Optimization of Offline Fractionation Conditions. For phosphopeptides, we raised the HCD level to 32% for efficient fragmentation and increased maximum ion accumulation time to 200 ms for improved sensitivity in MS/MS sequencing.
Data Analysis.
Raw data were analyzed using MS-GF plus and MaxQuant (software version 1.5.3.30)28 for database searching and protein/peptide quantification. For Shewanella oneidensis MR-1 samples, the UniProtKB database (Downloaded in 2/23/2017 and containing 645 reviewed and 3426 unreviewed sequences) was used. The UniProtKB/Swiss-Prot human database containing 20,129 reviewed sequences (downloaded in 12/29/2016) was used for HeLa and MCF-7 samples. In the data analysis with MaxQuant, “match between runs” was disabled to show the absolute sensitivity of the present platform. For MSGF search, peptide length was limited to 6 to 50, and partially tryptic peptides were considered for identification. Both MaxQuant and MSGF plus were used for phosphopeptide search. For phosphopeptide identification, acetylation (protein N-terminus), oxidation (M), and phospho (STY) were set as variable modifications, and carbamidomethylation (C) was set as fixed modification. The false discovery rate (FDR) was set to 1% at the level of proteins, peptides, and modifications. Potential contaminants and reverse sequences were filtered out. Proteins identified by site only were filtered out. The evidence files and Phospho (STY) Site were used for identification of phosphopeptides and phosphorylation sites. Other unmentioned parameters were the same as our previous study.23 Data was analyzed by R studio environment and visualized by Microsoft Excel.
RESULTS AND DISCUSSION
Design of the nanoFAC 2D RPLC Platform.
The system design and workflow for the nanoFAC 2D RPLC platform are illustrated in Figure 1. Two commercially available PAL autosampler systems were employed to perform the first-dimension high-pH RPLC fractionation and the second-dimension low-pH RPLC separation, respectively. To greatly reduce sample losses with conventional offline fractionation systems, the high-pH RPLC separation was run at 300 nL/min on a 75-μm i.d. column. The 75-μm i.d. LC column typically has a loading capacity of ~2 μg, which is suitable for most small samples with the cell numbers below ~10,000. The PAL system provided automated fraction concatenation into either 6 or 12 wells at 1 min intervals during a 96 min LC separation (Figure 1a). Each fraction had a volume of 300 nL, and thus, the total concatenated volume was only 4.8 μL for 6 fractions and 2.4 μL for 12 fractions. To increase the reliability of nanoliter-scale fraction collection, we preloaded each well of the 96-well plate with 25 μL Buffer A (0.1% formic acid in water) as the collection buffer. When compared to a high-flow fractionation system with the fraction volumes over 1 mL,20 the surface exposure area was reduced by >90%, greatly minimizing the peptide loss from surface absorption. More importantly, the surface losses can be further reduced by addition of additives into the collection buffer as described below, and the aqueous collection buffer reduced the acetonitrile content to <5% and acidified the fractions, enabling direct sample injection into the low-pH RPLC system without buffer exchange.
Figure 1.
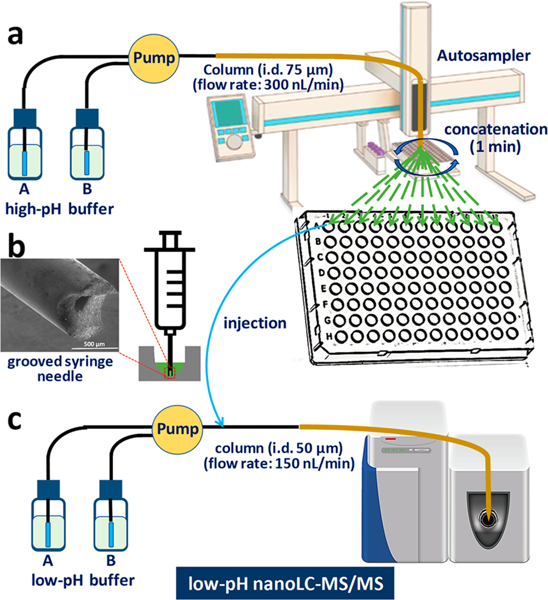
Schematic diagram of the nanoFAC 2D RPLC separation platform. (a) Nanogram amounts of protein digest were first separated using nanoflow high-pH LC and then automatedly concatenated into multiple wells in a 96-well plate. Twenty-five μL of collection buffer was preloaded into each well. (b) Each fraction was fully injected into an online trapping system using an autosampler with a grooved syringe needle, (c) followed by low-pH nanoLC separation and MS/MS analysis.
We have developed a lossless sample injection system by fabricating a line groove on the tip end of the syringe needle29 (Figure 1b). The grooved needle can be pressed down to the bottom of fraction wells without creating a seal that prevents sample withdrawal. Thus, all fractions can be fully transferred into the low-pH nanoLC-MS/MS system for proteomic analysis. To increase throughput and robustness, an online SPE trapping system was installed to enable high-flow (3–5 μL/min) sample loading and concentration. To maximize sensitivity, the low-pH nanoLC separation was performed at a lower flow rate of 150 nL/min using a 50-μm-i.d. LC column with an integrated emitter.26
Optimization of Collection Devices and Buffers.
In offline fractionation systems, peptide losses during fraction collection limit in-depth proteome profiling of low nanogram samples. To address this issue, we optimized the fractionation conditions for proteome coverage using 10 ng of protein digests from Shewanella oneidensis MR-1. Specifically, we evaluated the impact of collection devices (glass vials and 96-well plates), types and concentrations of additives, and buffers (Buffer A and Tris buffer) for fraction collection to reduce adsorptive surface losses.
We first tested the performance of two additives, DDM (0.01%) and Mastoparan peptide (1 ng/μL), by spiking them into collection buffer. The surfactant DDM has been used for solubilizing membrane proteins and protein extraction,30,31 and Mastoparan peptide is a cell-permeable and hydrophobic peptide.32 Additives could potentially block active surfaces in collection devices so as to improve peptide recovery. Both additives were eluted at a high percentage of Buffer B (>50%) during LC separations, and thus they would not impact proteomic analysis (Figure 2a). We found that the addition of surfactant DDM can greatly increase the proteome coverage (Figure 2b and Figure S1a), while no significant difference was observed with the addition of Mastoparan peptide (Figure S1a), when compared with control samples without additives. We next optimized the concentrations of DDM from 0.005% to 0.1% and found that 0.01% DDM provided the best performance in terms of proteome coverage and system robustness, as shown in Figure S1b. Higher concentrations of DDM (e.g., 0.1%) can saturate the LC column and degrade subsequent LC separations.
Figure 2.

Optimization of nanoflow offline fractionation conditions. (a) Base-peak chromatogram of a typical fraction from 1 μg of HeLa digest. DDM (0.01%, w/v) was added in collection buffer as additive and eluted at the end of LC gradient. The right panel shows the mass spectrum of DDM. (b) Peptide and protein identifications with and without the addition of DDM (collection device: glass vial; collection buffer: Buffer A). (c) Comparison of peptide and protein identifications between the use of glass vials and 96-well plate as collection devices (additive: 0.01% DDM; collection buffer: Buffer A). (d) Comparison of peptide and protein identifications between the use of Buffer A and Tris as collection buffers (additive: 0.01% DDM; collection device: 96-well plate). Ten ng of protein digests from Shewanella oneidensis MR-1 was used for condition optimization from (b) to (d). Error bars indicate standard deviations (SDs) from 3 replicates.
The surface properties of collection devices can significantly impact peptide recovery. Two commonly used autosampler vials were evaluated including glass vials and polypropylene 96-well PCR plates. Surprisingly, the identified unique peptides and proteins using the 96-well plates are 370% and 110% more than those using glass vials (Figure 2c), demonstrating that 96-well plates have much less surface adsorption than glass vials. Besides exceptional performance in sample recovery, the polypropylene 96-well plates are much less expensive than glass vials, making them the most suitable devices for fraction collection.
We also investigated the performance of two buffer systems including Buffer A (0.1% formic acid in water, pH 3) and Tris buffer (50 mM Tris-Cl, pH 8), each with the addition of 0.01% DDM. As shown in Figure 2d, greater proteome coverage was obtained when low-pH Buffer A was used. The number of peptide and protein identifications increased by 36% and 28%, respectively, when compared to those with high-pH Tris buffer.
Based on the above systematic evaluation, we have concluded that the optimal fractionation conditions include the use of Buffer A (0.1% formic acid in water) as collection buffer, 0.01% DDM as additive, and polypropylene 96-well plate as collection device.
Proteome Profiling of 100–1,000 ng of HeLa Digest.
Under optimized fractionation conditions, we evaluated the performance of the nanoFAC 2D RPLC platform for in-depth, low-input proteomic profiling with the use of 100 ng, 500 ng, and 1 μg of HeLa tryptic digest as model samples.
The nanoFAC strategy produced nearly uniform distribution of identified peptides and proteins across the pooled fractions (Figure S2). As shown in Figure 3a and 3b, the total identified unique peptides from 100 ng, 500 ng, and 1 μg of HeLa digest were 49,590, 85,230, and 94,458, corresponding to 6,653, 7,980, and 8,260 protein groups, respectively, demonstrating decent proteome coverage for nanogram samples. Compared to single-shot nanoLC separation, the 12-fraction approach increased the identifications of peptides by 324.8%–358.0% and proteins by 120.3%–141.9% for 100 to 1 μg of HeLa digests, demonstrating superior performance of the 2D RPLC platform. The slight improvement in peptide/protein identifications when the sample inputs increased from 500 ng to 1 μg indicates that MS/MS sequencing speed rather than sensitivity began to limit proteome coverage.33 More fractions could be generated to further improve proteome coverage. To the best of our knowledge, these results represented one of the highest proteome coverages using nanogram samples.22,23 Furthermore, the performance was also comparable to conventional multidimensional separation systems using much larger milligram-scale samples.12,15,18,34
Figure 3.

In-depth proteome analysis of 100 ng, 500 ng, and 1 μg HeLa digest samples using the nanoFAC 2D RPLC platform. In the first dimension, samples were separated by high-pH RPLC and concatenated into 12 fractions. Each fraction was transferred to the second dimension low-pH RPLC separation followed by MS/MS analysis. For comparison, the same set of samples were also directly analyzed by single-shot nanoLC MS without fractionation. (a) Comparison of peptide identifications and (b) protein identifications between 12-fractions and no fractionation. (c) Sequence coverages at different sample loadings. (d) Protein rank according to peptide spectral counts. Data were analyzed using MS-GF+.
As shown in Figure S3, the commonly identified proteins from 100 ng, 500 ng, and 1 μg of HeLa digests were 6233, accounting for 93.7% of the total proteins from 100 ng of HeLa digest. The common proteins from 500 ng and 1 μg of HeLa digests were 7,444, accounting for 93.3% and 90.1% of their respective total proteins. The large proportions of common proteins from varying amounts of starting material indicate a high degree of reproducibility for the present platform.
Figure 3c shows protein ranking according to their logarithmic-scale peptide spectral counts, which demonstrates broad dynamic ranges of the identified proteins for all three sample loadings. Over 5,210 proteins had ≥2 peptide spectra for 100 ng HeLa digest, indicating high confidence in protein identifications. The median sequence coverages for identified proteins were as high as 11.3%, 17.5%, and 19.7% for 100 ng, 500 ng, and 1 μg of HeLa digests (Figure 3d), standing for the increases of 64.9%, 52.7%, and 77.8%, respectively, compared to single-shot nanoLC analysis.
Taken together, these results demonstrate that the nanoFAC 2D RPLC platform provided high sensitivity, high reproducibility, and deep proteome coverage for automated analysis of trace samples.
Phosphoproteome Profiling of 100 μg MCF-7 Digest.
Protein phosphorylation plays an important role in understanding biological regulation and activities.35 However, the phosphoproteomic analysis often suffers from low phosphorylation stoichiometry, inefficient ionization, and poor signal response when compared with their nonphosphopeptide counterparts, particularly for small biological samples.36 As a result, efficient phosphopeptide enrichment is typically required for phosphoproteomic analysis.37
Given that the protein phosphorylation presents at substoichiometric levels of the whole proteome in contrast to unmodified peptides, we also used DDM to prevent surface adsorption during phosphopeptide collection, which effectively increased peptide recovery. The number of identified phosphopeptides enriched from 20 μg of tryptic peptides of MCF-7 was increased from 1,746 to 2,528 after using 0.01% DDM to reduce sample losses in a single-shot analysis (Figure S4).
Next, the phosphopeptides purified by IMAC from 100 μg of MCF-7 digest were further fractionated by using the nanoflow high-pH separation and automated concatenation strategy. Based on the previous results, the fractionated phosphopeptides were directly eluted into collection buffer containing 0.01% DDM solution in 0.1% FA to reduce sample losses. After fractionation, the number of identified phosphor-peptides was uniformly distributed in each fraction (Figure 4a). We identified on average ~ 5,050 phosphopeptides in each fraction. The selectivity for phosphopeptides after IMAC enrichment was >90%. The specificity of purified phosphopeptides after fractionation (93%) was slightly lower than single-shot analysis (95%) probably due to the increased number of low-abundance nonphosphopeptides after fractionation.
Figure 4.

Performance of nanoflow 2D RPLC approach for the enriched phosphopeptides. (a) Number of identified phosphopeptides in each fraction by MaxQuant. (b) Numbers, (c) distribution of peak areas, and (d) overlaps of identified phosphopeptides with or without nanoflow fractionation by MaxQuant. (e) Numbers and (f) overlap of identified phosphopeptides by MaxQuant and MS-GF+.
Compared to single-shot nanoLC analysis, the nanoflow fractionation approach (6 fractions) increased the number of identified unique phosphopeptides from 7,865 to 19,204 (Figure 4b). Furthermore, the nanoflow fractionation results in detection of phosphopeptides at a much wider dynamic range. This can be reflected by observation of more low-abundance phosphopeptides when compared to single-shot analysis (Figure 4c). As shown in Figure 4d, most identified phosphopeptides in single-shot analysis can also be observed in the nanoFAC 2D RPLC platform, but the new platform enables identification of an additional 62.8% of the total of 21,156 phosphopeptides.
In previous studies, robust approaches for single LC-MS/MS analysis such as using benzonase to digest DNA and RNA before IMAC enrichment or optimized IMAC protocol have enabled the identification of around 17,000 and more than 10,000 unique phosphopeptides from 2-mg HEK 293 and 1-mg HeLa cell digests, respectively.38,39 Coverage of the phosphoproteome can be increased to over 20,000 phospho-peptides by intergration of high-pH RP with TiO213 or IMAC.20 For submilligram samples, Chen et al.40 combined optimized high-pH RP fractionation with Ti4+-IMAC enrichment strategy, which achieved the identification of 15,260 and 8,936 unique phosphopeptides from 500 μg and 250 μg HEK 293T cell digests, respectively. Here, the optimized IMAC-nano2D-LC approach was able to identify 19,204 phospho-peptides including 10,222 class 1 phosphorylation sites (local probability >0.75) by using only 100 μg MCF tryptic peptides, representing a >5-fold improvement in sensitivity.
Previous studies have shown that different search engines may not identify the same peptides, especially when the PSM scores were close to the identification threshold.41,42 The combination of the results from different search engines can often increase the identification coverage of peptides or proteins.41,43 To identify more phosphopeptides, besides MaxQuant, MS-GF+ was also tested. As shown in Figure 4e and 4f, ~21% more phosphopeptides can be identified by using MS-GF+ than MaxQuant, and ~42% of the phosphopeptides were identified by both search engines. In combination, the coverage of identified phosphopeptides in the MCF-7 phosphoproteome was increased to 31,434.
CONCLUSION
We have developed a nanoFAC 2D RPLC platform for indepth proteome and phosphoproteome profiling of nanoscale samples. We introduced multiple strategies to improve sample recovery in the intermediate interface of offline 2D RPLC separations, including the use of a nanoflow LC column (75-μm i.d. at 300 nL/min) for the first-dimension separation, polypropylene 96-well plates for fraction collection, the addition of 0.01% DDM in the collection buffer, and the full sample injection for the second-dimension RPLC separation. The nanoFAC 2D RPLC platform has enabled comprehensive proteome characterization of >6,600 proteins with only 100-ng HeLa digest, equivalent to ~500 HeLa cells. It also can identify ~20,000 phosphopeptides using a starting material of 100-μg MCF-7 digest. Recently, the proteome coverage of single-shot LC-MS analysis was greatly improved with the introduction of state-of-the-art MS instrumentation having enhanced sensitivity and scan speed, including FAIMS-Lumos,44 QE-HF-X,45 and PASEF-TIMS-TOF.11 We anticipate the proteome coverage of the nanoFAC platform can be further improved when the latest-generation mass spectrometers are used.
Another significant advantage is that the nanoFAC 2D RPLC platform can be easily implemented in any standard proteomics laboratories because all the instrument components are commercially available. The notched syringe needle can be easily fabricated in a machine shop. In this paper, we mainly focused on improving the sensitivity of 2D RPLC for proteomics analysis. The analysis throughput can be readily increased by labeling each sample with an isobaric mass tag (TMT or iTRAQ). In addition to throughput, the nanoFAC 2D RPLC platform is naturally fit to isobaric labeling-based quantitative proteomics.20 The 2-dimensional RPLC separation can efficiently reduce peptide co-isolation and mitigate ratio compression problem.
Besides bottom-up proteomics and phosphoproteomics analysis, the platform can be readily applied to other LC-MS-based omics studies, such as top-down proteomics, metabolomics, and lipidomics. We envision that it will have broad utilities in current biomedical and biological research including but not limited to the characterization of rare cell populations, the study of embryonic development, and spatial mapping of tissue microstructures.
Supplementary Material
ACKNOWLEDGMENTS
Portions of this research were supported by a Laboratory Directed Research and Development award from Pacific Northwest National Laboratory (PNNL) to YZ, a R21CA223715 grant from National Cancer Institute (NCI) to TS, a R33 CA225248 grant from NCI to RTK, a DP3 DK110844 to WJQ, a U24CA210955 grant from the NCI Clinical Proteomic Tumor Analysis Consortium (CPTAC) to TL and RDS, and a P41GM103493 grant from the National Institutes of General Medical Sciences (NIGMS) to RDS. The experimental work was performed in the Environmental Molecular Sciences Laboratory (EMSL), a national scientific user facility sponsored by the Department of Energy (DOE) and located at PNNL, which is operated by Battelle Memorial Institute for the DOE under Contract DE-AC05–76RL0 1830.
Footnotes
ASSOCIATED CONTENT
Supporting Information
The Supporting Information is available free of charge on the ACS Publications website at DOI: 10.1021/acs.anal-chem.9b01248.
Optimization of nanoflow offline fractionation conditions, automated concatenation process of the nanoflow 2D RPLC platform, identification of unique peptides and proteins with concatenation into 12 fractions, overlap of protein identifications using the nanoflow 2D RPLC platform, and number of identified phosphopeptides eluted into the sample vial (PDF)
Notes
The authors declare no competing financial interest.
REFERENCES
- (1).Boschetti E; Righetti PG Low-abundance proteome discovery: state of the art and protocols; Newnes, 2013. [Google Scholar]
- (2).Ahmed N; Rice GE J. Chromatogr. B: Anal. Technol. Biomed. Life Sci. 2005, 815, 39–50. [DOI] [PubMed] [Google Scholar]
- (3).Angel TE; Aryal UK; Hengel SM; Baker ES; Kelly RT; Robinson EW; Smith RD Chem. Soc. Rev. 2012, 41, 3912–3928. [DOI] [PMC free article] [PubMed] [Google Scholar]
- (4).Zhu Y; Dou M; Piehowski PD; Liang Y; Wang F; Chu RK; Chrisler W; Smith JN; Schwarz KC; Shen Y; Shukla AK; Moore RJ; Smith RD; Qian W-J; Kelly RT Mol. Cell. Proteomics 2018, 17, 1864–1874. [DOI] [PMC free article] [PubMed] [Google Scholar]
- (5).Liang Y; Zhu Y; Dou M; Xu K; Chu RK; Chrisler WB; Zhao R; Hixson KK; Kelly RT Anal. Chem. 2018, 90, 11106–11114. [DOI] [PubMed] [Google Scholar]
- (6).Zhou F; Lu Y; Ficarro SB; Webber JT; Marto JA Anal. Chem. 2012, 84, 5133–5139. [DOI] [PMC free article] [PubMed] [Google Scholar]
- (7).Shen Y; Zhang R; Moore RJ; Kim J; Metz TO; Hixson KK; Zhao R; Livesay EA; Udseth HR; Smith RD Anal. Chem. 2005, 77, 3090–3100. [DOI] [PubMed] [Google Scholar]
- (8).Köcher T; Swart R; Mechtler K Anal. Chem. 2011, 83, 2699–2704. [DOI] [PubMed] [Google Scholar]
- (9).Dou M; Chouinard CD; Zhu Y; Nagy G; Liyu AV; Ibrahim YM; Smith RD; Kelly RT Anal. Bioanal. Chem. 2018, DOI: 10.1007/s00216-018-1452-5. [DOI] [PMC free article] [PubMed] [Google Scholar]
- (10).Hebert AS; Prasad S; Belford MW; Bailey DJ; McAlister GC; Abbatiello SE; Huguet R; Wouters ER; Dunyach J-J; Brademan DR Anal. Chem. 2018, 90, 9529–9537. [DOI] [PMC free article] [PubMed] [Google Scholar]
- (11).Meier F; Brunner A-D; Koch S; Koch H; Lubeck M; Krause M; Goedecke N; Decker J; Kosinski T; Park MA; Mann M Mol. Cell. Proteomics 2018, 17, 2534–2545. [DOI] [PMC free article] [PubMed] [Google Scholar]
- (12).Yuan H; Jiang B; Zhao B; Zhang L; Zhang Y Anal. Chem. 2019, 91, 264–276. [DOI] [PubMed] [Google Scholar]
- (13).Bekker-Jensen DB; Kelstrup CD; Batth TS; Larsen SC; Haldrup C; Bramsen JB; Sorensen KD; Høyer S; Ørntoft TF; Andersen CL Cell Systems 2017, 4, 587–599. [DOI] [PMC free article] [PubMed] [Google Scholar]
- (14).Zhu M-Z; Li N; Wang Y-T; Liu N; Guo M-Q; Sun B.-q.; Zhou H; Liu L; Wu J-L J. Proteome Res. 2017, 16, 3470–3475. [DOI] [PubMed] [Google Scholar]
- (15).Yang F; Shen Y; Camp DG; Smith RD Expert Rev. Proteomics 2012, 9, 129–134. [DOI] [PMC free article] [PubMed] [Google Scholar]
- (16).Shi T; Fillmore TL; Sun X; Zhao R; Schepmoes AA; Hossain M; Xie F; Wu S; Kim J-S; Jones N; Smith RD; Qian W-J Proc. Natl. Acad. Sci. U. S. A. 2012, 109, 15395–15400. [DOI] [PMC free article] [PubMed] [Google Scholar]
- (17).Batth TS; Francavilla C; Olsen JV J. Proteome Res. 2014, 13, 6176–6186. [DOI] [PubMed] [Google Scholar]
- (18).Wang H; Sun S; Zhang Y; Chen S; Liu P; Liu B J. Chromatogr. B: Anal. Technol. Biomed. Life Sci. 2015, 974, 90–95. [DOI] [PubMed] [Google Scholar]
- (19).Song C; Ye M; Han G; Jiang X; Wang F; Yu Z; Chen R; Zou H Anal. Chem. 2010, 82, 53–56. [DOI] [PubMed] [Google Scholar]
- (20).Mertins P; Tang LC; Krug K; Clark DJ; Gritsenko MA; Chen L; Clauser KR; Clauss TR; Shah P; Gillette MA; Smith RD; Zhang H; Liu T; Carr SA Nat. Protoc. 2018, 13, 1632–1661. [DOI] [PMC free article] [PubMed] [Google Scholar]
- (21).Zhu Y; Piehowski PD; Kelly RT; Qian W-J Expert Rev. Proteomics 2018, 15, 865–871. [DOI] [PMC free article] [PubMed] [Google Scholar]
- (22).Kulak NA; Geyer PE; Mann M Mol. Cell. Proteomics 2017, 16, 694–705. [DOI] [PMC free article] [PubMed] [Google Scholar]
- (23).Dou M; Zhu Y; Liyu A; Liang Y; Chen J; Piehowski P; Xu K; Zhao R; Moore RJ; Atkinson MA; Mathews CE; Qian W-J; Kelly RT Chemical Science 2018, 9, 6944–6951. [DOI] [PMC free article] [PubMed] [Google Scholar]
- (24).Zhu Y; Piehowski PD; Zhao R; Chen J; Shen Y; Moore RJ; Shukla AK; Petyuk VA; Campbell-Thompson M; Mathews CE; Smith RD; Qian W-J; Kelly RT Nat. Commun. 2018, 9, 882. [DOI] [PMC free article] [PubMed] [Google Scholar]
- (25).Yi L; Shi T; Gritsenko MA; X’avia Chan C-Y; Fillmore TL; Hess BM; Swensen AC; Liu T; Smith RD; Wiley HS Anal. Chem. 2018, 90, 5256–5263. [DOI] [PMC free article] [PubMed] [Google Scholar]
- (26).Shen Y; Moore RJ; Zhao R; Blonder J; Auberry DL; Masselon C; Paša-Tolić L; Hixson KK; Auberry KJ; Smith RD Anal. Chem. 2003, 75, 3596–3605. [DOI] [PubMed] [Google Scholar]
- (27).Huang EL; Piehowski PD; Orton DJ; Moore RJ; Qian W-J; Casey CP; Sun X; Dey SK; Burnum-Johnson KE; Smith RD Endocrinology 2016, 157, 1307–1314. [DOI] [PMC free article] [PubMed] [Google Scholar]
- (28).Tyanova S; Temu T; Cox J Nat. Protoc. 2016, 11, 2301–2319. [DOI] [PubMed] [Google Scholar]
- (29).Piehowski PD; Zhu Y; Bramer LM; Stratton KG; Zhao R; Orton DJ; Moore RJ; Yuan J; Mitchell HD; Gao Y; Webb-Robertson B-JM; Dey SK; Kelly RT; Burnum-Johnson KE Unpublished. [Google Scholar]
- (30).Meng Q; Rao L; Xiang X; Zhou C; Zhang X; Pan Y Biosci., Biotechnol., Biochem. 2011, 75, 2194–2199. [DOI] [PubMed] [Google Scholar]
- (31).Liu J; Wang F; Mao J; Zhang Z; Liu Z; Huang G; Cheng K; Zou H Anal. Chem. 2015, 87, 2054–2057. [DOI] [PubMed] [Google Scholar]
- (32).Palma MS Handbook of Biologically Active Peptides, 2nd ed; Elsevier, 2013; pp 416–422. [Google Scholar]
- (33).Zhu Y; Zhao R; Piehowski PD; Moore RJ; Lim S; Orphan VJ; Paša-Tolić L; Qian W-J; Smith RD; Kelly RT Int. J. Mass Spectrom. 2018, 427, 4–10. [DOI] [PMC free article] [PubMed] [Google Scholar]
- (34).Wu Q; Yuan H; Zhang L; Zhang Y Anal. Chim. Acta 2012, 731, 1–10. [DOI] [PubMed] [Google Scholar]
- (35).Delom F; Chevet E Proteome Sci. 2006, 4, 15. [DOI] [PMC free article] [PubMed] [Google Scholar]
- (36).Iliuk AB; Arrington JV; Tao WA Electrophoresis 2014, 35, 3430–3440. [DOI] [PMC free article] [PubMed] [Google Scholar]
- (37).Hogrebe A; von Stechow L; Bekker-Jensen DB; Weinert BT; Kelstrup CD; Olsen JV Nat. Commun. 2018, 9, 1045. [DOI] [PMC free article] [PubMed] [Google Scholar]
- (38).Potel CM; Lin M-H; Heck AJR; Lemeer S Mol. Cell. Proteomics 2018, 17, 1028–1034. [DOI] [PMC free article] [PubMed] [Google Scholar]
- (39).Ruprecht B; Koch H; Domasinska P; Frejno M; Kuster B; Lemeer S Methods Mol. Biol. 2017, 1550, 47–60. [DOI] [PubMed] [Google Scholar]
- (40).Chen W; Chen L; Tian R Analyst 2018, 143, 3693–3701. [DOI] [PubMed] [Google Scholar]
- (41).Jones AR; Siepen JA; Hubbard SJ; Paton NW Proteomics 2009, 9, 1220–1229. [DOI] [PMC free article] [PubMed] [Google Scholar]
- (42).Balgley BM; Laudeman T; Yang L; Song T; Lee CS Mol. Cell. Proteomics 2007, 6, 1599–1608. [DOI] [PubMed] [Google Scholar]
- (43).Ma Z-Q; Dasari S; Chambers MC; Litton MD; Sobecki SM; Zimmerman LJ; Halvey PJ; Schilling B; Drake PM; Gibson BW J. Proteome Res. 2009, 8, 3872–3881. [DOI] [PMC free article] [PubMed] [Google Scholar]
- (44).Hebert AS; Prasad S; Belford MW; Bailey DJ; McAlister GC; Abbatiello SE; Huguet R; Wouters ER; Dunyach J-J; Brademan DR; Westphall MS; Coon JJ Anal. Chem. 2018, 90, 9529–9537. [DOI] [PMC free article] [PubMed] [Google Scholar]
- (45).Kelstrup CD; Bekker-Jensen DB; Arrey TN; Hogrebe A; Harder A; Olsen JV J. Proteome Res. 2018, 17, 727–738. [DOI] [PubMed] [Google Scholar]
Associated Data
This section collects any data citations, data availability statements, or supplementary materials included in this article.