

Abstract
This study employed an intersectional approach (operationalized as the combination of more than one social identity) to examine the relationship between aspects of social identity (i.e., race, gender, age, SES), self-reported level of mistreatment, and attributions for discrimination. Self-reported discrimination has been researched extensively and there is substantial evidence of its association with adverse physical and psychological health outcomes. Few studies, however, have examined the relationship of multiple demographic variables (including social identities) to overall levels self-reported mistreatment as well the selection of attributions for discrimination. A diverse community sample (N = 292; 42.12% Black; 47.26% male) reported on experiences of discrimination using the Everyday Discrimination Scale. General linear models were used to test the effect of sociodemographic characteristics (i.e., race, gender, age, SES) on total discrimination score and on attributions for discrimination. To test for intersectional relationships, we tested the effect of two-way interactions of sociodemographic characteristics on total discrimination score and attributions for discrimination. We found preliminary support for intersectional effects, as indicated by a significant race by age interaction on the selection of the race attribution for discrimination; gender by SES on the age attribution; age by gender on the education attribution; and race by SES on the economic situation attribution. Our study extends prior work by highlighting the importance of testing more than one factor as contributing to discrimination, particularly when examining to what sources individuals attribute discrimination.
Keywords: discrimination, mistreatment, attributions, intersectionality
Discrimination is “the process by which a member, or members of a socially defined group is, or are, treated differently (especially unfairly) because of his/her/their membership of that group,” (Bastos, Celeste, Faerstein, & Barros, 2010) or because of some characteristic or mark that is perceived as undesirable according to social norms or context (Link & Phelan, 2001). Discrimination occurs across a range of settings such as in educational, employment, and health care settings, in the housing market, financial industry, and in the police force (Kessler, Mickelson, & Williams, 1999). Discrimination is a stressor that can impact mental and physical health (Williams, Neighbors, & Jackson, 2003), social identity, and well-being (Brenick, Titzmann, Michel, & Silbereisen, 2012). Indeed, a large literature has linked the experience of discrimination to a wide array of negative outcomes (see Kessler et al., 1999; Paradies, 2006; Pascoe & Smart Richman, 2009 for general reviews). The characteristics or “attributes” for which one is considered undesirable, such as race/ethnicity, behavior, appearance, or sexual orientation (Major & O’Brien, 2005), may lead to the devaluation, rejection, and exclusion placed upon stigmatized individuals (Link & Phelan, 2001). Together, general mistreatment of individuals, along with attributing mistreatment to a characteristic a person possesses or group membership, result in attributions to discrimination (Major, Quinton, & Schmader, 2003).
Many individuals possess multiple characteristics for which they may be disadvantaged (e.g., race, gender, age, socioeconomic status) and these identities often interact in ways that govern the type of experiences an individual has (Lewis, Cogburn, & Williams, 2015). Work in the field of intersectionality, or the study of interconnected identities that may define and determine social status and power, as well prior work on “double jeopardy” (Ferraro, 1987) suggests that the specific combination of multiple social identities shape experiences, particularly those related to disparities (Parent, DeBlaere, & Moradi, 2013; Shields, 2008). This important work has also noted how multiple stigmatized identities may shape experiences related to discrimination (Grollman, 2014; Pak, Dion, & Dion, 1991). Further, prior work has noted that attributions to discrimination (i.e., cause or source) may have important implications for health above and beyond the effect of level of mistreatment experienced (Potter et al., 2015). In particular, attributing discrimination to weight was related to worse diabetes outcomes, above and beyond the effect of amount of discrimination experienced and BMI. Yet relatively little work has examined how intersecting identities may influence the endorsement of specific attributions of discrimination. As such, our work is unique in that we explored how intersecting sociodemographic identities may influence not only levels of mistreatment but also specific attributions of discrimination. Given the paucity of prior research in this area, our approach was largely one of discovery and exploration rather than hypothesis testing (beyond the general hypothesis that intersectionality is a relevant dimension on which to investigate attributions for discrimination).
Evidence in the field of intersectionality suggests that we cannot characterize the experiences of individuals or groups by prioritizing one aspect of their identity. For example, describing “men’s health” and “women’s health” without regard to other characteristics, such as sexual orientation or race, ignores important within-group variability in experiences and inequalities (Hankivsky, 2012). Rather, intersectionality posits that the multiple social categories by which individuals are characterized are interdependent, and interact within contexts to influence social and health inequities (Else-Quest & Hyde, 2016; Hankivsky, 2012). Intersectionality also rejects the notion that social inequalities experienced by those with multiple stigmatized identities (e.g., Black lesbian women) can be characterized by their collective impact. Inequalities are not additive such that discrimination associated with multiple identities is summed (e.g., Black + lesbian + woman ≠ Black lesbian woman; Bowleg, 2008), and experiences are not “divisible into their component identities” (Parent et al., 2013). Rather, multiple factors at the social and cultural levels interact in a fluid manner, such that one aspect of identity (e.g., gender) may intensify the inequalities faced because of another aspect of identity (e.g., race), thus their interaction contributes to the complex inequalities experienced (Hankivsky, 2012; Parent et al., 2013). Intersectionality research has also suggested that some individuals with multiple identities may experience both advantage and disadvantage depending on reference group. For example, White lesbian women may experience oppression in comparison to those who are heterosexual, yet may be privileged relative to lesbian women of other racial groups (Shields, 2008). Many studies of intersectionality have used simple interactions to examine the effect of identities on outcomes (see Parent et al., 2013). However growing emphasis on intersectionality calls for the examination of more complex relationships between factors that may influence the experiences of multiple minorities. Given the limited research on the effects of multiple attributions for discrimination on health (see Troxel, Matthews, Bromberger, & Sutton-Tyrrell, 2003), it is important to establish some empirical evidence regarding the intersection of multiple statuses that may create unique experiences for those who are vulnerable to mistreatment.
Level of mistreatment and attributions to certain characteristics may have differential influence on negative outcomes associated with discrimination (Chae, Lincoln, & Jackson, 2011). Much of the existing literature on discrimination focuses on perceptions of mistreatment rather than on objective experiences (Dion, Dion, & Banerjee, 2009) because perceptions are particularly potent (Bastos et al., 2010) and may capture subtle experiences that could be missed by outside individuals (Borders & Liang, 2011). Yet, recent work suggests that attributions for discrimination (e.g., due to weight) may be unique predictors above and beyond the total amount of mistreatment reported (Potter et al., 2015). Therefore, in this paper we examine the prevalence of self-reported discrimination using a scale that allows participants to report both on the amount of mistreatment and to separately report on the self-reported attributions for discrimination. Our goal was to explore how social identities relate to perceived level of mistreatment, and reported attributions for discrimination. We first examined the relationship between social identity categories that are often the basis for discrimination (i.e., race, gender, age, SES) and level of reported mistreatment. Next, we examined their relationship with attributions for discrimination. Because there is limited work in the field of intersectionality, we also examined the intersectional relationship (i.e., statistical interactions) between sociodemographic predictors and their effects on levels of mistreatment and attributions for discrimination in an exploratory fashion.
Attributions for perceived discrimination are meaningful, as stigmatized individuals may mentally assign some source of mistreatment, such as their race, gender, or sexual orientation (Link & Phelan, 2001). Importantly, the specific group membership to which a stigmatized individual attributes mistreatment may have differential implications for health. For instance, attributing discrimination to weight has been linked to poor self-care behaviors, psychological distress, and an objective marker of disease status in patients with type 2 diabetes (Potter et al., 2015). Although members of stigmatized groups are likely to attribute discrimination to their group membership (Crocker, Voelkl, Testa, & Major, 1991; O’Brien, Major, & Simon, 2012), even a seemingly objective event such as a homophobic remark does not necessarily guarantee that an individual will attribute discrimination solely to the relevant group membership (i.e., sexual orientation; Kessler et al., 1999). Yet, many surveys intended to measure perceived discrimination contain items with attributions attached to the question, which may result in inflated agreement with an attribution that resides within the question. For example, study participants may be asked to report on a Likert-scale “to what extent have you been treated unfairly because of your race?” which may call to mind past experiences of racial discrimination, and possibly result in endorsement of racial discrimination when in fact participants intended to report mistreatment for another reason (i.e., not due to race; Gomez & Trierweiler, 2001). Indeed, recent evidence suggests that even individuals who do not objectively fit into one stigmatized demographic group may attribute mistreatment to reasons commonly endorsed by that group (i.e., normal weight individuals who perceive weight discrimination; Tomiyama, 2014). Attaching attributions for discrimination to survey questions may falsely presume that individuals have mentally assigned a single attribute to mistreatment (Bastos et al., 2010), when in fact individuals may assign mistreatment to more than one equally salient attribution, to several attributions of varying importance (Sechrist, Swim, & Stangor, 2004), or the rationale for mistreatment may be altogether ambiguous (Williams & Mohammed, 2009).
Assessing attributions for mistreatment may also help to identify understudied individuals or groups who experience mistreatment for reasons that are unexpected, or reveal intersectional relationships between demographic factors and mistreatment or attributions. For example, the social status of men is higher than that of women in the United States, thus the assumption may be that men are not as subject to mistreatment. Yet, men may be evaluated stringently on certain characteristics (e.g., masculinity) and abilities (e.g., problem solving; Phelan, Lucas, Ridgeway, & Taylor, 2014); indeed, White men, who are not outwardly a member of a stigmatized group, may still perceive gender discrimination if they attribute discrimination to their masculinity (Hatzenbuehler & Link, 2014). This highlights the importance of exploring the prevalence of mistreatment among stigmatized groups and (presumably) less stigmatized groups and, importantly, the intersection of certain aspects of identity on self-reported mistreatment and various attributions for discrimination.
The literature examining discrimination has grown dramatically over the past thirty years, yet important limitations have restricted the ability to fully understand the extent to which various groups experience mistreatment and attribute it to discrimination. One important limitation is that the prevalence of perceived discrimination (in either specific populations or in a between-group design) is measured in samples that are homogeneous, often limiting the generalizability of study results. Further, such study designs limit the ability to make sub-comparisons across groups. For example, studies may be diverse regarding race (i.e. include African Americans, Whites, and Latino Americans), but limited on age (Carlisle, 2015), leading to potential errors in generalizations regarding racial groups across the life span. Other samples are diverse in age cohorts, gender, and racial groups, yet not equally distributed across groups (Kessler et al., 1999). Multiple studies have focused on diverse youth (Rivera et al., 2011) or elderly populations (Luo, Xu, Granberg, & Wentworth, 2012) but do not include both in one overall sample. Similarly, other studies have a primary interest in studying perceived discrimination in individuals with single group membership, such as those examining only one gender (Watson, Scarinci, Klesges, Slawson, & Beech, 2002), religious group (Awad, 2010), or sexual orientation (Herek, 2009). Yet, we do not understand, for example, how the racial and gender discrimination that Black women face makes their experience different from Black men or White women. Although prior work on relationships between discrimination and single identities is critically important in understanding the effect of perceived discrimination on specific population groups, this specificity limits the ability to better understand the differential perception of discrimination as a function of various characteristics of diverse populations.
Current Study
Both the amount of mistreatment and attributions for discrimination may have implications for interventions targeting specific sociodemographic groups vulnerable to mistreatment. Additionally, the intersection of multiple dimensions of identity (e.g., race, age, gender, and socioeconomic status) may have distinct effects on discrimination. This, in turn, highlights the importance of exploring multiple factors that may contribute to level of mistreatment and/or attributions for discrimination (e.g., race and sexuality may both uniquely and in conjunction predict level of mistreatment and attributions for discrimination; Malcom, Hall, & Brown, 1975). Thus the goal of the present study is to examine self-reported level of mistreatment, to separately examine attributed sources of discrimination (i.e., attributed discrimination), and to more broadly explore the intersection of multiple demographic characteristics and their effect on level of mistreatment and endorsement of specific attributions in a diverse community sample. To address issues with homogeneous sample populations, a large diverse community-based sample was recruited (i.e. stratified by age, gender, and race). Perceived discrimination was measured using an approach that allowed participants to report on both level of mistreatment and attributions for discrimination.
The study of intersectionality has garnered considerable attention, notably in the field of health disparities, and the amount of conceptual work on the topic has grown in recent years. Empirical work examining intersectionality, however, is fairly scarce, and methodological approaches to studying intersectionality have been inconsistent and not well-validated in the literature (McCall, 2005). Thus, as researchers attempt to explore and describe the interdependent nature of social identities, techniques to do so have become markedly varied (Bowleg, 2008). Prior work on intersectionality notes that, although a simple additive approach may be suboptimal for making conclusions about the effect of multiple stigmatized identities, an important initial step in intersectionality research is to independently isolate the meaning of social identities by exploring individual contributions to perceived discrimination (Bowleg, 2008). Therefore, our first aim was to describe the level of mistreatment reported by individuals with demographic characteristics for which they may be commonly mistreated (i.e., race, age, gender, SES; Kessler et al., 1999). We took an initial step towards using inferential statistics to better describe discrimination in our sample by examining the main effects and the intersection of demographic variables on self-reported level of mistreatment. Although conceptually intriguing, higher order interactions were not tested due to lack of power, such that in three- and four-way interactions, the sample size in each cell would not be large enough to reliably detect expected effect sizes. In this way, higher-order interactions are beyond the scope and capacity of this study. In aim two we move beyond amount of reported mistreatment to explore attributions for self-reported discrimination. As with aim one, we first described the proportion of our sample who endorsed the attributions for discrimination used in this study (race, age, gender, SES), then subsequently explored the potential main effects and lower order interactions of demographic variables on selection of the attributions.
Method
Participants
Three hundred forty-six adults were recruited using advertisements in local newspapers, flyers in community centers and other public venues (e.g., libraries, senior centers), and through referrals from community leaders (e.g., local church). This report is part of a larger project that assessed a wide array of cognitive, health, and psychological well-being indicators; this report focuses solely on the social identify and discrimination/attribution measures. Each participant was compensated for participation, with a maximum of $75 for compliance with all protocol procedures. The resulting sample was 51.96% (n = 172) non-Hispanic White, 38.07% (n = 126) Black, 1.51% (n = 5) Hispanic White, 1.81% (n = 6) Hispanic Black, 4.23% (n = 14) Asian, 2.42% (n = 8) other; unfortunately, our sample did not provide sufficient sample sizes to provide reliable estimates of study measures within each racial group. Although we recognize the importance of including and examining a wide range of racial/ethnic groups, especially in light of an intersectional framework, the proposed analyses require a sufficient sample of each racial category that also is distributed across age, gender, and SES characteristics. Sufficient numbers of study participants to permit analyses were only achieved for White and Black participants, and thus our results are limited in scope to those racial categories. Consequently, all analyses are limited to those who identified as Black or White. Six participants had complete missing data on the Everyday Discrimination Scale, thus were omitted from analyses (N = 292). This study was approved by the university’s ethics committee.
Measures
As part of a larger survey, participants completed a measure assessing general demographic characteristics including age, gender, and ethnicity. Socioeconomic status (SES) was calculated as a composite of standardized income and education and was used as a continuous variable. The income variable asked participants to report their income on a 9-point scale from 1 (<$10,000) to 8 ($100,000 and up) and the education variable asked participants chose one of 6 categories describing their education (0 = none, 1 = high school, 2 = other/associates/GED, 3 = bachelor’s, 4 = master’s, and 5 = PhD/MD). Although used continuously in analyses, SES was dichotomized when creating descriptive tables for ease of reporting. Similarly, age was entered in all models as a continuous variable, but was categorized in figures for ease of interpretation.
Participants then completed the Everyday Discrimination Scale (Williams, Yu, Jackson, & Anderson, 1997) to assess perceived discrimination in everyday life. Participants rated how often they experienced any of eight different types of mistreatment in their daily experiences (e.g., “Are you treated with less courtesy than other people?”; “Are you called names or insulted?”). Event frequency was rated on a 4-point scale from 1 (never) to 4 (often). Ratings were summed order to calculate a “total discrimination score” (i.e., level of mistreatment); higher scores show more mistreatment (α = .87). Participants with a total score greater than or equal to 9 (i.e., rated any item on the first portion of the scale as two or higher; 84.6%) completed the second portion of the scale indicating the main reason(s) for these experiences (i.e., attributed reason for discrimination). Participants responded “Yes” or “No” to 15 attribution items that included race, gender, age, education level, economic/financial situation, job/occupation, height/weight, skin color, appearance, medical condition, physical health/disability, mental health/disability, sexual orientation, religion, language/accent. (A sixteenth item allowed participants to enter an “other” reason.)
Procedure
The present study utilized data from a larger research study examining the relationships among health, cognition, and personality throughout the lifespan. Participants were given a brief introduction to the study and informed consent was obtained (using procedures approved by all relevant Institutional Review Boards). For the larger study, participants also completed cognitive tasks, a variety of health measures, and a paper booklet of questionnaires assessing a range of personality, health behaviors, and life experiences.
Analytic Plan
All analyses were conducted using SAS Version 9.4. We first obtained descriptive statistics for the entire study sample. For aim one, we used PROC GLM to test the main effects and all two-way interactions of race, age, gender, and SES on total discrimination score. The binary variable race was coded as 1 (Black) and 0 (White). Similarly, the binary variable gender was coded as 1 (female) and 0 (male). Models were tested using an explicitly hierarchical approach. We began by separately testing the main effects of race, age, gender, and SES in four analytic models. In each of the four models, the sociodemographic variable (e.g., race) was entered as the single independent variable and total discrimination score was entered as the dependent variable. We then tested a model with race, age, gender, and SES together as a block to determine whether any of the effects were significant while controlling for the other sociodemographic variables in the model. In the absence of specific theory or evidence based predictions in the literature, we chose to test all possible two-way interactions of the sociodemographic variables in order to discern whether there was an intersectional relationship between the sociodemographic predictors in our study and their possible effect on amount of mistreatment experienced. Each two-way interaction was tested in a model that contained the two-way interaction and the four main effects of sociodemographic characteristics. Although there are limitations to our approach (i.e., the high number of models tested; increased Type 1 error rate), given that there is limited work in this area we felt it important to build upon basic models as we began to explore intersectional effects. We also recognize the value of examining more complex intersectional identities (e.g., three-way interactions). Therefore, we explored results broken down by race and gender and largely found no significant effects (results available upon request). Importantly, the small cell size and rate of Type 1 error make the results very difficult to confidently interpret.
For aim two, we mirrored the steps taken in part one in order to test whether there were main effects and interactions of sociodemographic characteristics on attributions for mistreatment. We first used PROC LOGISTIC to test the main effects of sociodemographic characteristics on the attributions for discrimination. This procedure was used because the attribution variable is dichotomous, such that participants who reported any amount of mistreatment indicated whether or not they attributed the experience to each of the attributions by answering ‘Yes’ or ‘No.’ As we did in part one, we took a hierarchical approach, first testing the main effects by running four separate models, each of which contained only the sociodemographic characteristic as the independent variable and the attribution for discrimination as the dependent variable. We then tested a main effects model which contained all sociodemographic variables as independent variables. Next, we tested all possible two-way interactions of the sociodemographic variables following a strategy similar to that used prior. As in aim one, our interaction models contained main effects and two-way interactions, yet we presented a table containing only the interaction results.
Because there were 16 possible attributions for discrimination in the scale used in this study, the main analyses in part two are limited to only the attributions that most closely matched the sociodemographic variables used as predictors in our model (Race/Ethnicity, Gender/Sex, Age, Education Level, and Economic/Financial Situation). Of note, the SES variable in our data consisted of a z-score composite of income and education; the Everyday Discrimination Scale, however, does not contain an SES attribution. Therefore, we took several steps to identify which of the available attributions most closely matched SES as a predictor. Under the assumption that individuals of low SES likely attribute some discrimination to their SES status (Crocker et al., 1991), we first identified attribution(s) that could possibly reflect discrimination attributed to SES – these were economic/financial situation and education. Second, we tested whether SES predicted these two attributions (i.e., to determine whether SES was a significant predictor of the selection of economic/financial situation and/or education attributions of discrimination). SES predicted both attributions; thus in our main analyses we tested the effect of sociodemographic predictors on both the Economic/Financial Situation and Education attributions in order to sufficiently represent potential attributions for discrimination related to SES.
Results
Sample Characteristics
A complete description of demographic information can be seen in Table 1. The sample was between 20 and 83 years old (M = 51.50, SD = 16.29), 52.74% (n = 154) female, and 57.88% (n = 169) White. About a third (32.19%, n = 94) of participants indicated they were currently married; more than one-third had a high school degree (39.18%, n = 114), 13.06% (n = 38) had a bachelor’s degree, 6.53% (n = 19) had a master’s degree, 1.03% (n = 3) had a Phd/MD, 27.84% (n = 81) had an associate’s degree, GED, or ‘other’, and 12.37% (n = 36) reported they had no degree. About two thirds of participants reported an annual income of less than $40,000 (67.7%, n = 197), 17.53% (n = 51) made between $40,000-74,999, and 7.91% (n = 23) made more than $75,000. Twenty-one participants did not report their income.
Table 1.
Descriptives
| Variable | Mean (SD) or N (%) |
|---|---|
| Age | 51.50 (16.29) |
| Gender | |
| Male | 138 (47.26) |
| Female | 154 (52.74) |
| Race/ethnicity | |
| Black | 123 (42.12) |
| White | 169 (57.88) |
| Educational Degree | |
| None | 36 (12.37) |
| High school | 114 (39.18) |
| Other/Assoc/GED | 81 (27.84) |
| Bachelor’s | 38 (13.06) |
| Master’s | 19 (6.53) |
| PhD/MD | 3 (1.03) |
| Marital Status | |
| Currently Married | 94 (32.19) |
| Was married, but not currently | 89 (30.48) |
| Never Married | 109 (37.33) |
| Annual Income | |
| <$15,000 | 133 (45.55) |
| $15,000–24,999 | 51 (17.47) |
| $25,000–34,999 | 30 (10.27) |
| $35,000–49,999 | 51 (17.47) |
| $50,000–74,999 | 21 (7.19) |
| $75,000–99,999 | 2 (0.68) |
| $100,000 + | 4 (1.37) |
Perceived Discrimination
In aim one we tested the effect of sociodemographic factors (i.e., race, gender, age, and SES) on total discrimination score by using PROC GLM. We first ran four separate models to test the independent effects of each sociodemographic factor without the possibility for shared variance between predictor variables. We found that age [b = −0.07, SE = 0.02, p <.001], race [b = 1.84, SE = 0.53, p < .001] and SES [b = −.60, SE = 0.29, p = .04] were significant predictors of total discrimination score, such that being older, White, and higher in SES were each associated with lower levels of self-reported discrimination. Gender was marginally significant [b = −0.96, SE = 0.53, p = .07] such that men reported more discrimination on average than women (Figure 1). Subsequently, we entered all predictors in the same model as covariates. We found that age [b = −0.05, SE = 0.02, p = .001], gender [β = −1.00, SE = 0.52, p = .05] and race [b = 1.24, SE = 0.57, p = .03] were significant predictors of total discrimination score, however SES was no longer significant when all variables were entered in the model [b = −0.12, SE = 0.31, p = .71]. We then tested all possible two-way interactions of sociodemographic variables. Because our previous models showed that each of the sociodemographic factors were significant or marginally significant independent predictors of total discrimination score, they were included in each of the interaction models as lower order terms, along with the two-way interaction of interest. There were no significant two-way interactions between sociodemographic characteristics (Table 2). Means for main effects and interactions are presented in Tables 3 and 4.
Figure 1.
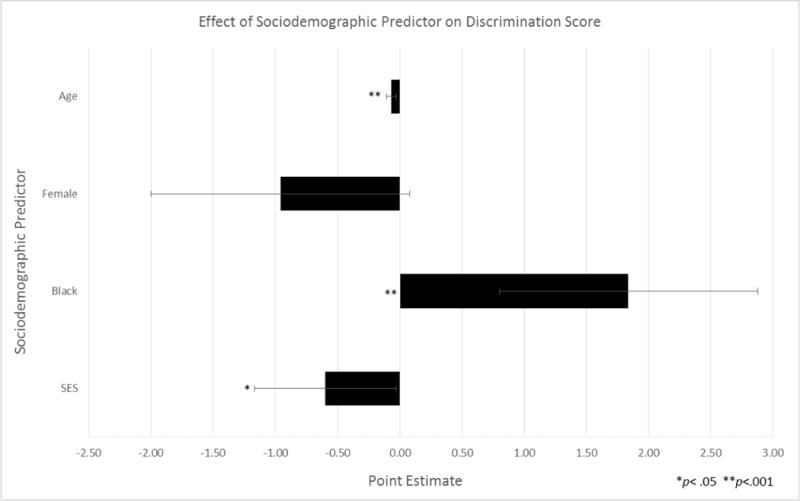
Effect of demographic group on total discrimination score.
Table 2.
Effect of demographic group and interactions on total discrimination score
| Main Effect | b | SE | p |
|---|---|---|---|
| Age | −0.07 | 0.02 | <.001 |
| Female | −0.96 | 0.53 | .07 |
| Black | 1.84 | 0.53 | <.001 |
| SES | −0.60 | 0.29 | .04 |
|
| |||
| Main Effect |
|||
| Age | −0.05 | 0.02 | .001 |
| Female | −1.00 | 0.52 | .05 |
| Black | 1.24 | 0.57 | .03 |
| SES | −0.12 | 0.31 | .71 |
|
| |||
| Rage*Age Interaction |
|||
| Age | −0.07 | 0.02 | <.001 |
| Female | −1.01 | 0.51 | .05 |
| Black | −1.58 | 1.87 | .40 |
| SES | −0.07 | 0.31 | .83 |
| Black*Age | 0.06 | 0.04 | .11 |
|
| |||
| Race*Gender Interaction |
|||
| Age | −0.06 | 0.02 | .001 |
| Female | −1.39 | 0.68 | .04 |
| Black | 0.74 | 0.80 | .36 |
| SES | −0.13 | 0.31 | .67 |
| Black*Female | 0.92 | 1.05 | .38 |
|
| |||
| Race*SES Interaction |
|||
| Age | −0.05 | 0.02 | .002 |
| Female | −1.04 | 0.52 | .04 |
| Black | 1.35 | 0.57 | .02 |
| SES | −0.42 | 0.39 | .29 |
| Black*SES | 0.80 | 0.64 | .22 |
|
| |||
| Age*Gender Interaction |
|||
| Age | −0.08 | 0.02 | .001 |
| Female | −3.18 | 1.71 | .06 |
| Black | 1.27 | 0.57 | .03 |
| SES | −0.08 | 0.31 | .80 |
| Age*Female | 0.04 | 0.03 | .18 |
|
| |||
| Age*SES Interaction |
|||
| Age | −0.05 | 0.02 | .002 |
| Female | −1.06 | 0.52 | .04 |
| Black | 1.23 | 0.57 | .03 |
| SES | 1.04 | 1.05 | .33 |
| Age*SES | −0.02 | 0.02 | .25 |
|
| |||
| Gender*SES Interaction |
|||
| Age | −0.05 | 0.02 | .002 |
| Female | −1.00 | 0.52 | .05 |
| Black | 1.23 | 0.57 | .03 |
| SES | −0.32 | 0.44 | .47 |
| Female*SES | 0.38 | 0.58 | .52 |
Note. SES = Z-score composite of income and education. R2 = .09
Table 3.
Mean Discrimination Score for sample and by gender, race, age, SES
| N | Mean (SD) | |
|---|---|---|
| Overall sample | 292 | 14.70 (4.57) |
| Age | ||
| ≥ 60 years | 101 | 13.22 (4.25) |
| < 60 years | 191 | 15.49 (4.56) |
| Gender | ||
| Male | 138 | 15.21 (4.73) |
| Female | 154 | 14.25 (4.40) |
| Race | ||
| White | 169 | 13.93 (4.47) |
| Black | 123 | 15.76 (4.52) |
| SES | ||
| Low | 165 | 15.51 (4.74) |
| High | 127 | 14.39 (4.48) |
Note. SES was dichotomized into two groups (those above and below the mean) for the purposes of displaying frequencies.
Table 4.
Discrimination score cell means
| N | Mean (SD) | ||
|---|---|---|---|
| Gender | Race | ||
|
|
|||
| Male | White | 81 | 14.63 (4.68) |
| Black | 57 | 16.04 (4.72) | |
| Female | White | 88 | 13.28 (4.20) |
| Black | 66 | 15.53 (4.36) | |
| Gender | Age | ||
|
|
|||
| Male | ≥ 60 years | 46 | 13.22 (4.37) |
| < 60 years | 92 | 16.21 (4.61) | |
| Female | ≥ 60 years | 55 | 13.22 (4.19) |
| < 60 years | 99 | 14.82 (4.43) | |
| Gender | SES | ||
|
|
|||
| Male | Low | 39 | 16.21 (5.14) |
| High | 99 | 14.82 (4.53) | |
| Female | Low | 42 | 14.86 (4.30) |
| High | 112 | 14.02 (4.43) | |
| Race | Age | ||
|
|
|||
| White | ≥ 60 years | 80 | 12.48 (3.46) |
| < 60 years | 89 | 15.24 (4.88) | |
| Black | ≥ 60 years | 21 | 16.05 (5.69) |
| < 60 years | 102 | 15.71 (4.27) | |
| Race | SES | ||
|
|
|||
| White | Low | 65 | 15.65 (4.57) |
| High | 104 | 12.86 (4.07) | |
| Black | Low | 51 | 15.31 (4.81) |
| High | 72 | 16.08 (4.31) | |
| Age | SES | ||
|
|
|||
| ≥ 60 years | Low | 15 | 15.47 (6.01) |
| High | 86 | 12.83 (3.77) | |
| < 60 years | Low | 66 | 15.52 (4.46) |
| High | 125 | 15.47 (4.63) | |
Note. SES was dichotomized into two groups for the purposes of displaying frequencies.
Attributions for Discrimination
In aim two we tested the effect of sociodemographic factors on selection of attributions for perceived discrimination by using PROC LOGISTIC. As previously noted, however, we tested the main effects of the four sociodemographic factors against only those attributions which mirrored the demographic factors (i.e., Race/Ethnicity, Gender/Sex, Age, Education Level, and Economic/Financial Situation attributions). As in part one, we then tested all possible two-way interactions of sociodemographic variables by including each of the four main effects in the model with the two-way interaction of interest. We found that age was a significant predictor of the selection of the race attribution [b = −0.03, SE = 0.0009, p < .001], such that the odds of selecting the race attribution decreased with age. Race was also a significant predictor of the selection of the race attribution [b = 1.34, SE = 0.17, p < .001] such that Black participants were more likely than White participants to endorse the race attribution. SES was also a significant predictor of the race attribution [b = −0.50, SE = 0.17, p = .003] such that the odds of endorsing the race attribution decreased as SES increased (Figure 2). When all main effects were entered in the same model we found that only race remained a significant predictor of the selection of the race attribution for perceived discrimination [b = 1.29, SE = 0.18, p < .001]. Tests of interaction effects showed that there was a significant race by age interaction [b = 0.02, SE = 0.01, p = .04]; unlike Black participants, White participants were less likely to endorse the race attribution as age increased (Table 5; Figure 3).
Figure 2.
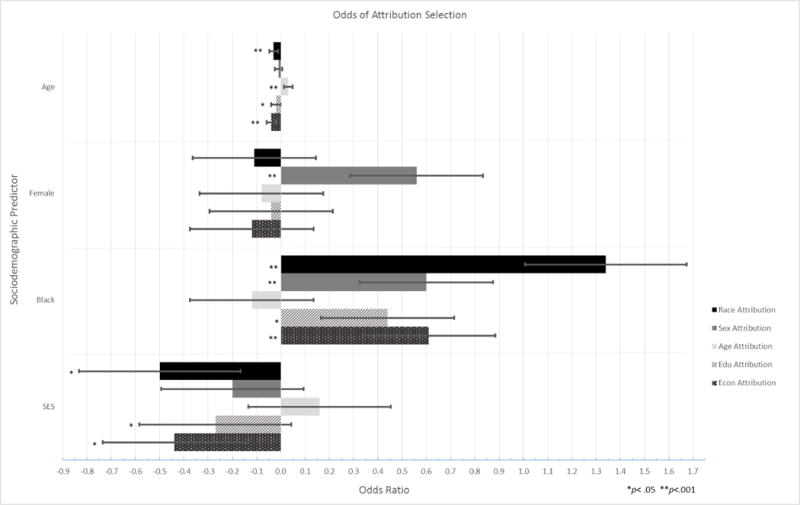
Effect of sociodemographic predictor on selection of attributions for discrimination.
Table 5.
Effect of demographic group and interactions on selection of race attribution
| 95% CI of
b
|
||||||
|---|---|---|---|---|---|---|
| Main Effects | b (SE) | Lower | Upper | X2 | p | OR |
| Age | −0.03 (0.009) | −0.05 | −0.02 | 13.13 | < .001 | 0.97 |
| Female | −0.11 (0.13) | −0.37 | 0.15 | 0.66 | .42 | 0.90 |
| Black | 1.34 (0.17) | 1.01 | 1.67 | 62.24 | <.001 | 3.81 |
| SES | −0.50 (0.17) | −0.83 | −0.18 | 9.16 | .003 | 0.61 |
|
| ||||||
| Main Effects |
||||||
| Age | −0.02 (0.01) | −0.04 | 0.007 | 1.76 | .18 | 0.99 |
| Female | −0.20 (0.16) | −0.52 | 0.13 | 1.38 | .24 | 0.82 |
| Black | 1.29 (0.18) | 0.93 | 1.64 | 50.88 | <.001 | 3.62 |
| SES | −0.04 (0.20) | −0.44 | 0.36 | 0.04 | .84 | 0.96 |
|
| ||||||
| Race*Age Interaction |
||||||
| Age | −0.02 (0.01) | −0.04 | 0.007 | 1.94 | .16 | 0.98 |
| Female | −0.20 (0.17) | −0.53 | 0.12 | 1.47 | .22 | 0.82 |
| Black | 0.17 (0.56) | −0.92 | 1.25 | 0.09 | .77 | 1.19 |
| SES | −0.005 (0.21) | −0.41 | 0.40 | .001 | .98 | 1.00 |
| Black*Age | 0.02 (0.01) | 0.001 | 0.05 | 4.26 | .04 | 1.02 |
|
| ||||||
| Race*Gender Interaction |
||||||
| Age | −0.02 (0.01) | −0.04 | 0.007 | 1.76 | .18 | 0.989 |
| Female | −0.20 (0.17) | −0.54 | 0.14 | 1.32 | .25 | 0.82 |
| Black | 1.29 (0.18) | 0.93 | 1.64 | 50.66 | <.001 | 3.62 |
| SES | −0.04 (0.20) | −0.44 | 0.36 | 0.04 | .83 | 0.96 |
| Black*Female | 0.02 (0.17) | −0.32 | 0.36 | 0.01 | .92 | 1.02 |
|
| ||||||
| Race*SES Interaction |
||||||
| Age | −0.01 (0.01) | −0.04 | 0.009 | 1.34 | .25 | 0.99 |
| Female | −0.20 (0.17) | −0.53 | 0.12 | 1.53 | .22 | 0.82 |
| Black | 1.32 (0.18) | 0.96 | 1.67 | 52.83 | <.001 | 3.73 |
| SES | −0.10 (0.21) | −0.52 | 0.32 | 0.21 | .65 | 0.91 |
| Black*SES | 0.29 (0.21) | −0.13 | 0.70 | 1.87 | .17 | 1.34 |
|
| ||||||
| Age*Gender Interaction |
||||||
| Age | −0.02 (0.01) | −0.04 | 0.007 | 1.74 | .19 | 0.99 |
| Female | −0.51 (0.56) | −1.62 | 0.59 | 0.83 | .36 | 0.60 |
| Black | 1.29 (0.18) | 0.94 | 1.64 | 51.15 | <.001 | 3.63 |
| SES | −0.0. (0.20) | −0.43 | 0.36 | 0.03 | .86 | 0.97 |
| Age*Female | 0.007 (0.01) | −0.02 | 0.03 | 0.35 | .55 | 1.01 |
|
| ||||||
| Age*SES Interaction |
||||||
| Age | −0.02 (0.01) | −0.04 | 0.007 | 1.89 | .17 | 0.98 |
| Female | −0.20 (0.17) | −0.52 | 0.12 | 1.48 | .22 | 0.82 |
| Black | 1.28 (0.18) | 0.93 | 1.63 | 50.41 | <.001 | 3.60 |
| SES | 0.40 (0.67) | −0.91 | 1.71 | 0.36 | .55 | 1.50 |
| Age*SES | −0.009 (0.01) | −0.03 | 0.02 | 0.48 | .49 | 0.99 |
|
| ||||||
| Gender*SES Interaction |
||||||
| Age | −0.02 (0.01) | −0.04 | 0.006 | 1.97 | .16 | 0.98 |
| Female | −0.22 (0.17) | −0.55 | 0.11 | 1.78 | .18 | 0.80 |
| Black | 1.30 (0.18) | 0.94 | 1.66 | 50.43 | <.001 | 3.68 |
| SES | −0.04 (0.20) | −0.44 | 0.36 | 0.03 | .86 | 0.96 |
| Female*SES | −0.22 (0.20) | −0.60 | 0.17 | 1.23 | .27 | 0.81 |
Note. SES = Z-score composite of income and education.
Figure 3.
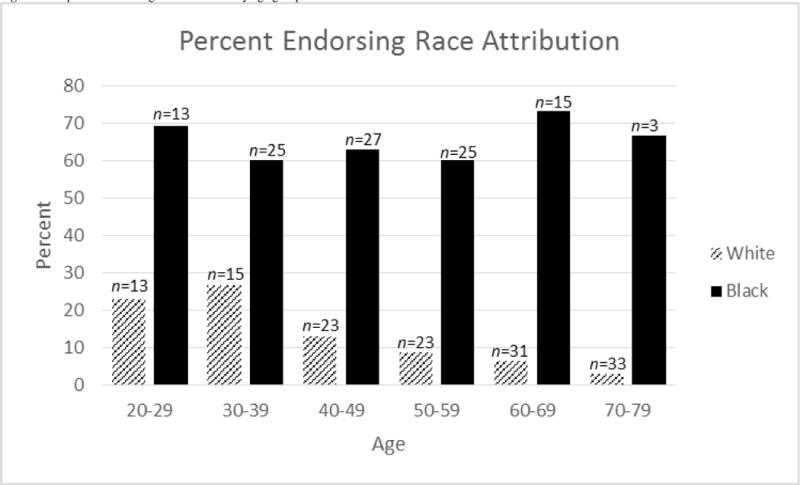
Proportion endorsing race attribution by age group and race.
Note: n = sample size
Figure 2 shows tests for the effect of sociodemographic factors and their interactions on selection of the gender/sex attribution for perceived discrimination. Pure main effects analyses showed that gender was a significant predictor of the gender/sex attribution [b = 0.56, SE = 0.14, p < .001], such that female participants were more likely to endorse the gender attribution for discrimination. There was also a significant effect of race on the gender/sex attribution [b = 0.60, SE = 0.14, p < .001], such that Black participants were more likely to endorse the gender/sex attribution for discrimination compared to White participants in the sample. There was no significant effect of age [b = −0.006, SE = 0.008, p = .46] or SES [b = −0.20, SE = 0.15, p = .21] (Figure 2). When all main effects were entered into the same model we again found that only gender and race were significant predictors of the gender/sex attribution for perceived discrimination. There were no significant interactions between predictor variables on the effect of gender/sex attribution (Table 6).
Table 6.
Effect of demographic group and interactions on selection of gender/sex attribution
| 95% CI of
b
|
||||||
|---|---|---|---|---|---|---|
| Main Effects | b (SE) | Lower | Upper | X2 | p | OR |
| Age | −0.006 (0.008) | −0.02 | 0.01 | 0.54 | .46 | 0.99 |
| Female | 0.56 (0.14) | 0.28 | 0.84 | 15.65 | <.001 | 1.76 |
| Black | 0.60 (0.14) | 0.33 | 0.88 | 18.36 | <.001 | 1.82 |
| SES | −0.20 (0.15) | −0.50 | 0.11 | 1.59 | .21 | 0.82 |
|
| ||||||
| Main Effects |
||||||
| Age | 0.005 (0.01) | −0.01 | 0.02 | 0.26 | .61 | 1.01 |
| Female | 0.59 (0.15) | 0.30 | 0.89 | 15.73 | <.001 | 1.81 |
| Black | 0.65 (0.16) | 0.33 | 0.96 | 16.27 | <.001 | 1.91 |
| SES | −0.04 (0.18) | −0.39 | 0.31 | 0.04 | .84 | 0.96 |
|
| ||||||
| Rage*Age Interaction |
||||||
| Age | 0.007 (0.01) | −0.01 | 0.03 | 0.50 | .48 | 1.01 |
| Female | 0.59 (0.15) | 0.30 | 0.89 | 15.59 | <.001 | 1.81 |
| Black | 0.13 (0.52) | −0.90 | 1.15 | 0.06 | .81 | 1.13 |
| SES | −0.02 (0.18) | −0.38 | 0.33 | 0.02 | .89 | 0.98 |
| Black*Age | 0.01 (0.01) | −0.009 | 0.03 | 1.08 | .30 | 1.01 |
|
| ||||||
| Race*Gender Interaction |
||||||
| Age | 0.005 (0.01) | −0.01 | 0.03 | 0.27 | .61 | 1.01 |
| Female | 0.63 (0.16) | 0.32 | 0.94 | 16.03 | <.001 | 1.89 |
| Black | 0.72 (0.17) | 0.38 | 1.06 | 17.51 | <.001 | 2.05 |
| SES | −0.02 (0.18) | −0.37 | 0.33 | 0.02 | .90 | 0.98 |
| Black*Female | −0.26 (0.16) | −0.57 | 0.05 | 2.65 | .10 | 0.77 |
|
| ||||||
| Race*SES Interaction |
||||||
| Age | 0.005 (0.01) | −0.01 | 0.02 | 0.24 | .63 | 1.01 |
| Female | 0.60 (0.15) | 0.30 | 0.89 | 15.76 | <.001 | 1.82 |
| Black | 0.64 (0.16) | 0.33 | 0.96 | 15.97 | <.001 | 1.90 |
| SES | −0.04 (0.18) | −0.39 | 0.31 | 0.05 | .82 | 0.96 |
| Black*SES | −0.04 (0.18) | −0.39 | 0.31 | 0.05 | .82 | 0.96 |
|
| ||||||
| Age*Gender Interaction |
||||||
| Age | 0.004 (0.01) | −0.02 | 0.02 | 0.18 | .67 | 1.00 |
| Female | 0.40 (0.50) | −0.58 | 1.38 | 0.65 | .42 | 1.50 |
| Black | 0.65 (0.16) | 0.33 | 0.96 | 16.33 | <.001 | 1.91 |
| SES | −0.03 (0.18) | −0.38 | 0.32 | 0.03 | .86 | 0.97 |
| Age*Female | 0.004 (0.01) | −0.02 | 0.02 | 0.16 | .69 | 1.00 |
|
| ||||||
| Age*SES Interaction |
||||||
| Age | 0.005 (0.01) | −0.01 | 0.03 | 0.28 | .60 | 1.01 |
| Female | 0.61 (0.15) | 0.31 | 0.91 | 16.30 | <.001 | 1.84 |
| Black | 0.65 (0.16) | 0.34 | 0.97 | 16.42 | <.001 | 1.92 |
| SES | −0.64 (0.62) | −1.86 | 0.58 | 1.05 | .30 | 0.53 |
| Age*SES | 0.01 (0.01) | −0.01 | 0.03 | 1.03 | .31 | 1.01 |
|
| ||||||
| Gender*SES Interaction |
||||||
| Age | 0.006 (0.01) | −0.01 | 0.03 | 0.30 | .58 | 1.01 |
| Female | 0.61 (0.15) | 0.31 | 0.90 | 15.88 | <.001 | 1.83 |
| Black | 0.64 (0.16) | 0.33 | 0.96 | 16.10 | <.001 | 1.90 |
| SES | −0.07 (0.19) | −0.44 | 0.29 | 0.16 | .69 | 0.93 |
| Female*SES | 0.13 (0.18) | −0.21 | 0.48 | 0.58 | .45 | 1.14 |
Note. SES = Z-score composite of income and education.
Figure 2 shows tests for the effect of predictor variables and their interactions on selection of the age attribution for perceived discrimination. Pure main effects analyses showed that only age was a significant predictor of the age attribution [b = 0.03, SE = 0.009, p < .001], such that the odds of endorsing the age attribution for perceived discrimination increased with age. There was no effect of gender [b = −0.08, SE = 0.13, p = .55], race [b = −0.12, SE = 0.13, p = .36], or SES [b = 0.16, SE = 0.15, p = .27] (Figure 2). When all main effects were entered into the same model, only age remained a significant predictor of selection of the age attribution. There was a significant gender by SES interaction [b = −0.29, SE = 0.15, p = .05] that showed a crossover pattern; females were more likely than males to attribute discrimination to age at lower SES, but males were more likely to endorse age at higher SES (Table 7; Figure 4).
Table 7.
Effect of demographic group and interactions on selection of age attribution
| 95% CI of
b
|
||||||
|---|---|---|---|---|---|---|
| Main Effects | b (SE) | Lower | Upper | X2 | p | OR |
| Age | 0.03 (0.009) | 0.01 | 0.05 | 11.85 | < .001 | 1.03 |
| Female | −0.08 (0.13) | −0.33 | 0.18 | 0.35 | .55 | 0.93 |
| Black | −0.12 (0.13) | −0.37 | 0.14 | 0.84 | .36 | 0.89 |
| SES | 0.16 (0.15) | −0.13 | 0.45 | 1.20 | .27 | 1.17 |
|
| ||||||
| Main Effects |
||||||
| Age | 0.03 (0.01) | 0.01 | 0.05 | 10.56 | .001 | 1.03 |
| Female | −0.10 (0.13) | −0.36 | 0.16 | 0.54 | .46 | 0.91 |
| Black | 0.04 (0.14) | −0.25 | 0.32 | 0.06 | .81 | 1.04 |
| SES | 0.03 (0.16) | −0.28 | 0.34 | 0.04 | .85 | 1.03 |
|
| ||||||
| Race*Age Interaction |
||||||
| Age | 0.03 (0.01) | 0.02 | 0.05 | 11.95 | < .001 | 1.04 |
| Female | −0.10 (0.13) | −0.36 | 0.16 | 0.59 | .44 | 0.90 |
| Black | −0.60 (0.51) | −1.60 | 0.40 | 1.37 | .24 | 0.55 |
| SES | 0.05 (0.16) | −0.27 | 0.36 | 0.09 | .76 | 1.05 |
| Black*Age | 0.01 (0.01) | −0.007 | 0.03 | 1.67 | .20 | 1.01 |
|
| ||||||
| Race*Gender Interaction |
||||||
| Age | 0.03 (0.01) | 0.01 | 0.05 | 10.60 | .001 | 1.03 |
| Female | −0.08 (0.13) | −0.34 | 0.19 | 0.33 | .56 | 0.93 |
| Black | 0.03 (0.15) | −0.26 | 0.31 | 0.04 | .84 | 1.03 |
| SES | 0.02 (0.16) | −0.29 | 0.34 | 0.02 | .89 | 1.02 |
| Black*Female | 0.15 (0.13) | −0.11 | 0.42 | 1.33 | .25 | 1.17 |
|
| ||||||
| Race*SES Interaction |
||||||
| Age | 0.03 (0.01) | 0.01 | 0.05 | 9.83 | .002 | 1.03 |
| Female | −0.09 (0.13) | −0.35 | 0.17 | 0.43 | .51 | 0.92 |
| Black | 0.01 (0.15) | −0.28 | 0.30 | 0.005 | .94 | 1.01 |
| SES | −0.2 (0.17) | −0.35 | 0.31 | 0.02 | .90 | 0.98 |
| Black*SES | −0.20 (0.17) | −0.52 | 0.12 | 1.48 | .22 | 0.82 |
|
| ||||||
| Age*Gender Interaction |
||||||
| Age | 0.03 (0.01) | 0.01 | 0.05 | 10.45 | .001 | 1.03 |
| Female | 0.63 (0.47) | −0.29 | 1.55 | 1.78 | .18 | 1.87 |
| Black | 0.03 (0.15) | −0.26 | 0.31 | 0.04 | .85 | 1.03 |
| SES | −0.01 (0.16) | −0.30 | 0.33 | 0.004 | .95 | 1.01 |
| Age*Female | −0.01 (0.01) | −0.03 | 0.003 | 2.57 | .11 | 0.99 |
|
| ||||||
| Age*SES Interaction |
||||||
| Age | 0.03 (0.01) | 0.01 | 0.05 | 10.76 | .001 | 1.03 |
| Female | −0.11 (0.13) | −0.37 | 0.15 | 0.64 | .43 | 0.90 |
| Black | 0.03 (0.15) | −0.25 | 0.32 | 0.05 | .82 | 1.03 |
| SES | 0.44 (0.58) | −0.70 | 1.57 | 0.57 | .45 | 1.55 |
| Age*SES | −0.007 (0.01) | −0.03 | 0.01 | 0.53 | .47 | 0.99 |
|
| ||||||
| Gender*SES Interaction |
||||||
| Age | 0.03 (0.01) | 0.01 | 0.05 | 9.66 | .001 | 1.03 |
| Female | −0.09 (0.13) | −0.36 | 0.17 | 0.49 | .48 | 0.91 |
| Black | 0.04 (0.15) | −0.24 | 0.33 | 0.09 | .76 | 1.05 |
| SES | 0.05 (0.16) | −0.27 | 0.37 | 0.10 | .75 | 1.05 |
| Female*SES | −0.29 (0.15) | −0.59 | 0.006 | 3.69 | .05 | 0.75 |
Note. SES = Z-score composite of income and education.
Figure 4.
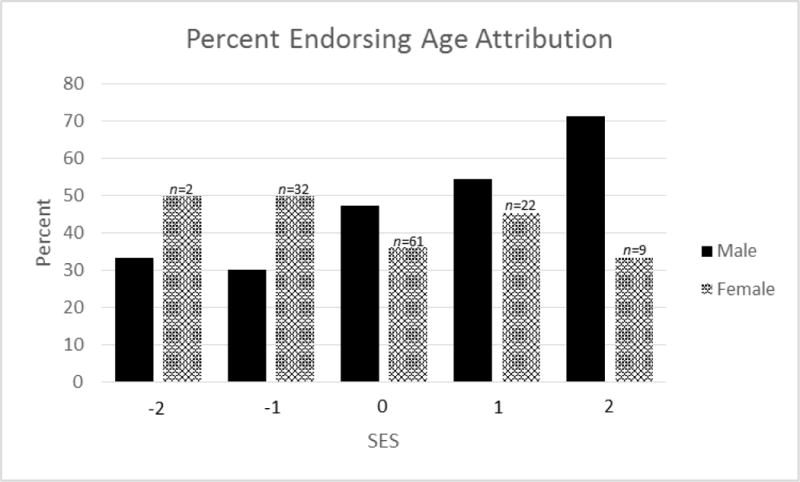
Proportion endorsing age attribution by gender and SES.
Note: n = sample size
Figure 2 shows tests for the effect of predictor variables and their interactions on selection of the education attribution for perceived discrimination. Pure main effects models showed that there was a significant effect of age [b = −0.02, SE = 0.01, p = .02], such that the odds of endorsing the education attribution decreased with age, and a significant effect of race [b = 0.44, SE = 0.14, p = .001], such that Black participants were more likely to endorse the education attribution. There was a marginally significant effect of SES [b = −0.27, SE = 0.16, p = .09] such that the odds of endorsing the education attribution decreased as SES increased (Figure 2). When all main effects were entered in the same model, we found that only race remained a significant predictor of the education attribution. Interaction analyses showed a significant interaction between age and gender [b = −0.02, SE = 0.01, p = .02] such that young females were more likely than young males to attribute discrimination to education, but older males were more likely to endorse education than older females (Table 8; Figure 5).
Table 8.
Effect of demographic group and interactions on selection of education attribution
| 95% CI of
b
|
||||||
|---|---|---|---|---|---|---|
| Main Effects | b (SE) | Lower | Upper | X2 | p | OR |
| Age | −0.02 (0.01) | −0.04 | −0.004 | 5.87 | .02 | 0.98 |
| Female | −0.04 (0.13) | −0.30 | 0.23 | 0.08 | .78 | 0.96 |
| Black | 0.44 (0.14) | 0.18 | 0.72 | 10.56 | .001 | 1.56 |
| SES | −0.27 (0.16) | −0.58 | 0.04 | 2.93 | .09 | 0.77 |
|
| ||||||
| Main Effects |
||||||
| Age | −0.01 (0.01) | −0.03 | 0.004 | 2.12 | .15 | 0.99 |
| Female | −0.04 (0.14) | −0.31 | 0.23 | 0.08 | .78 | 0.96 |
| Black | 0.37 (0.15) | 0.08 | 0.66 | 6.20 | .01 | 1.44 |
| SES | −0.08 (0.17) | −0.41 | 0.26 | 0.21 | .64 | 0.92 |
|
| ||||||
| Race*Age Interaction |
||||||
| Age | −0.01 (0.01) | −0.03 | 0.01 | 1.44 | .23 | 0.99 |
| Female | −0.04 (0.14) | −0.31 | 0.22 | 0.09 | .77 | 0.96 |
| Black | −0.03 (0.48) | −0.97 | 0.91 | 0.004 | .95 | 0.97 |
| SES | −0.07 (0.17) | −0.40 | 0.27 | 0.15 | .70 | 0.94 |
| Black*Age | 0.008 (0.01) | −0.01 | 0.03 | 0.75 | .38 | 1.01 |
|
| ||||||
| Race*Gender Interaction |
||||||
| Age | −0.01 (0.01) | −0.03 | 0.05 | 2.11 | .15 | 0.99 |
| Female | −0.04 (0.14) | −0.31 | 0.23 | 0.08 | .78 | 0.96 |
| Black | 0.37 (0.15) | 0.08 | 0.66 | 6.14 | .01 | 1.44 |
| SES | −0.08 (0.17) | −0.42 | 0.25 | 0.23 | .63 | 0.92 |
| Black*Female | 0.07 (0.14) | −0.20 | 0.34 | 0.24 | .62 | 1.07 |
|
| ||||||
| Race*SES Interaction |
||||||
| Age | −0.01 (0.01) | −0.03 | 0.01 | 2.04 | .15 | 0.99 |
| Female | −0.04 (0.14) | −0.31 | 0.23 | 0.08 | .78 | 0.96 |
| Black | 0.37 (0.15) | 0.08 | 0.66 | 6.23 | .01 | 1.45 |
| SES | −0.07 (0.17) | −0.41 | 0.26 | 0.19 | .66 | 0.93 |
| Black*SES | 0.03 (0.17) | −0.30 | 0.37 | 0.04 | .85 | 1.03 |
|
| ||||||
| Age*Gender Interaction |
||||||
| Age | −0.02 (0.01) | −0.03 | 0.004 | 2.48 | .12 | 0.99 |
| Female | 1.01 (0.47) | 0.09 | 1.94 | 4.58 | .03 | 2.75 |
| Black | 0.74 (0.30) | 0.15 | 1.32 | 6.00 | .01 | 2.09 |
| SES | −0.12 (0.18) | −0.46 | 0.23 | 0.43 | .51 | 0.89 |
| Age*Female | −0.02 (0.01) | −0.04 | −0.003 | 5.38 | .02 | 0.98 |
|
| ||||||
| Age*SES Interaction |
||||||
| Age | −0.01 (0.01) | −0.03 | 0.004 | 2.18 | .14 | 0.99 |
| Female | −0.05 (0.14) | −0.33 | 0.22 | 0.14 | .71 | 0.95 |
| Black | 0.36 (0.15) | 0.07 | 0.658 | 6.02 | .01 | 1.44 |
| SES | 0.49 (0.57) | −0.63 | 1.61 | 0.75 | .39 | 1.64 |
| Age*SES | −0.01 (0.01) | −0.03 | 0.01 | 1.09 | .30 | 0.99 |
|
| ||||||
| Gender*SES Interaction |
||||||
| Age | −0.02 (0.01) | −0.03 | 0.004 | 2.49 | .11 | 0.99 |
| Female | −0.05 (0.14) | −0.33 | 0.22 | 0.15 | .70 | 0.95 |
| Black | 0.37 (0.15) | −0.08 | 0.67 | 3.32 | .01 | 1.45 |
| SES | −0.08 (0.17) | −0.42 | 0.26 | 0.21 | .65 | 0.92 |
| Female*SES | −0.23 (0.16) | −0.56 | 0.09 | 2.04 | .15 | 0.79 |
Note. SES = Z-score composite of income and education.
Figure 5.
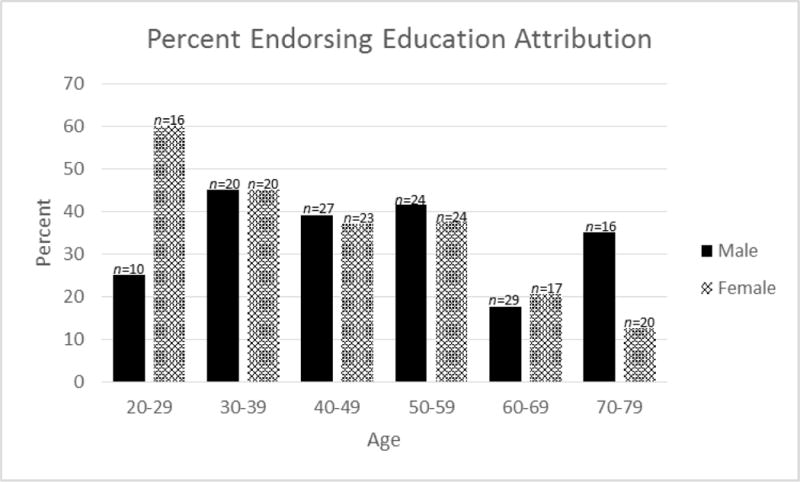
Proportion endorsing education attribution by age group and gender.
Note: n = sample size
Figure 2 shows tests for the effect of predictor variables and their interactions on selection of the economic/financial situation attribution for perceived discrimination. Pure main effects models showed that there was a significant effect of age [b = −0.04, SE = 0.01, p < .001] such that the odds or endorsing the economic/financial situation attribution decreased with age. There was a significant effect of race [b = 0.61, SE = 0.14, p < .001] such that Black participants were more likely than White participants to endorse the economic/financial situation attribution. There was also a significant main effect of SES [b = −0.44, SE = 0.15, p = .003] on the selection of economic/financial situation attribution for perceived discrimination such that the odds of endorsing the economic/financial situation attribution decreased as SES increased (Figure 2). When all main effects were entered into the same model, age and race remained significant predictors of the economic/financial situation attribution. There was a significant race by SES interaction [b = 0.35, SE = 0.18, p = .05], such that for White participants the odds of endorsing the economic/financial attribution decreased as SES increased, whereas for Black participants the odds remained relatively constant (Table 9; Figure 6). Frequency of selection of attributions by sociodemographic groups, as well as the mean number of attributes endorsed by participants in each sociodemographic group, are presented in Tables 10, 11, and 12.
Table 9.
Effect of demographic group and interactions on selection of economic/financial situation attribution
| 95% CI of
b
|
||||||
|---|---|---|---|---|---|---|
| Main Effect | b (SE) | Lower | Upper | X2 | p | OR |
| Age | −0.04 (0.01) | −0.06 | −0.02 | 19.20 | < .001 | 0.96 |
| Female | −0.12 (0.13) | −0.37 | 0.13 | 0.89 | .34 | 0.89 |
| Black | 0.61 (0.14) | 0.34 | 0.88 | 19.61 | < .001 | 1.84 |
| SES | −0.44 (0.15) | −0.74 | −0.15 | 8.58 | .003 | .64 |
|
| ||||||
| Main Effects |
||||||
| Age | −0.03 (0.01) | −0.05 | −0.01 | 9.34 | .002 | 0.97 |
| Female | −0.13 (0.14) | −0.41 | 0.14 | 0.92 | .34 | 0.88 |
| Black | 0.46 (0.15) | 0.16 | 0.75 | 9.36 | .002 | 1.58 |
| SES | −0.17 (0.17) | −0.50 | 0.16 | 1.04 | .31 | 0.84 |
|
| ||||||
| Race*Age Interaction |
||||||
| Age | −0.02 (0.01) | −0.04 | −0.001 | 4.38 | .04 | 0.98 |
| Female | −0.14 (0.14) | −0.42 | 0.13 | 1.01 | .32 | 0.87 |
| Black | −0.41 (0.51) | −1.41 | 0.60 | 0.63 | .43 | 0.67 |
| SES | −0.15 (0.17) | −0.48 | 0.18 | 0.78 | .38 | 0.86 |
| Black*Age | 0.02 (0.01) | −0.002 | 0.04 | 3.04 | .08 | 1.02 |
|
| ||||||
| Race*Gender Interaction |
||||||
| Age | −0.03 (0.01) | −0.05 | −0.01 | 9.39 | .002 | 0.97 |
| Female | −0.11 (0.14) | −0.38 | 0.17 | 0.56 | .45 | 0.90 |
| Black | 0.45 (0.15) | 0.15 | 0.74 | 5.97 | .003 | 1.56 |
| SES | −0.18 (0.17) | −0.51 | 0.15 | 1.13 | .29 | 0.84 |
| Black*Female | 0.13 (0.14) | −0.15 | 0.41 | 0.86 | .35 | 1.11 |
|
| ||||||
| Race*SES Interaction |
||||||
| Age | −0.02 (0.01) | −0.05 | −0.009 | 8.34 | .004 | 0.97 |
| Female | −0.15 (0.14) | −0.43 | 0.12 | 1.17 | .28 | 0.86 |
| Black | 0.51 (0.16) | 0.20 | 0.81 | 10.62 | .001 | 1.66 |
| SES | −0.07 (0.18) | −0.42 | 028 | 0.14 | .71 | 0.94 |
| Black*SES | 0.35 (0.18) | 0.0002 | 0.70 | 3.85 | .05 | 1.42 |
|
| ||||||
| Age*Gender Interaction |
||||||
| Age | −0.03 (0.01) | −0.05 | −0.01 | 9.47 | .002 | 0.97 |
| Female | 0.25 (0.49) | −0.70 | 1.21 | 0.27 | .60 | 1.29 |
| Black | 0.45 (0.15) | 0.16 | 0.75 | 9.25 | .02 | 1.57 |
| SES | −0.18 (0.17) | −0.51 | 0.15 | 1.17 | .28 | 0.84 |
| Age*Female | −0.007 (0.01) | −0.03 | 0.01 | 0.69 | .41 | 0.99 |
|
| ||||||
| Age*SES Interaction |
||||||
| Age | −0.03 (0.01) | −0.05 | −0.01 | 9.05 | .003 | 0.97 |
| Female | −0.14 (0.14) | −0.42 | 0.13 | 1.06 | .30 | 0.87 |
| Black | 0.45 (0.15) | 0.16 | 0.75 | 9.27 | .002 | 1.57 |
| SES | 0.30 (0.60) | −0.89 | 1.48 | 0.24 | .62 | 1.34 |
| Age*SES | −0.009 (0.01) | −0.03 | 0.01 | 0.64 | .42 | 0.99 |
|
| ||||||
| Gender*SES Interaction |
||||||
| Age | −0.03 (0.01) | −0.05 | −0.01 | 9.14 | .003 | 0.97 |
| Female | −0.13 (0.14) | −0.41 | 0.14 | 0.93 | .33 | 0.88 |
| Black | 0.45 (0.15) | 0.16 | 0.75 | 9.30 | .002 | 1.58 |
| SES | −0.17 (0.17) | −0.50 | 0.15 | 1.06 | .30 | 0.84 |
| Female*SES | 0.04 (0.16) | −0.27 | 0.35 | 0.07 | .79 | 1.04 |
Note. SES = Z-score composite of income and education.
Figure 6.
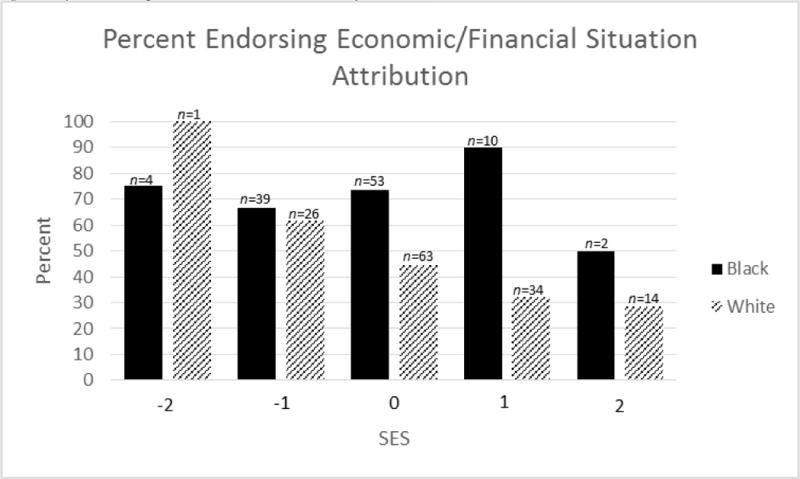
Proportion endorsing economic/financial situation attribution by race and SES.
Note: n = sample size
Table 10.
Frequency of selection of attributions for perceived discrimination
| Attribution | n | % |
|---|---|---|
| Race/Ethnicity | 84 | 34.15 |
| Gender/Sex | 84 | 34.15 |
| Age | 106 | 43.09 |
| Educational Level | 84 | 34.15 |
| Economic of Financial Situation | 138 | 56.10 |
Table 11.
Frequency of selection of attributions by demographic factors
| Race n (%) | Gender n (%) | Age n (%) | Education n (%) | Economic n (%) | Mean # attrib. selected | |
|---|---|---|---|---|---|---|
|
|
||||||
| Age | ||||||
| ≥ 60 years | 16 (19.61) | 56 (31.71) | 45 (54.88) | 18 (21.95) | 37 (32.3) | 1.61 |
| < 60 years | 68 (41.46) | 58 (35.37) | 61 (37.20) | 66 (40.24) | 111 (67.68) | 2.22 |
| Gender | ||||||
| Male | 44 (36.67) | 26 (21.67) | 54 (45.00) | 42 (35.00) | 71 (59.17) | 1.98 |
| Female | 40 (31.75) | 58 (46.03) | 52 (41.27) | 42 (33.33) | 67 (53.17) | 2.06 |
| Race | ||||||
| White | 15 (10.87) | 31 (22.46) | 63 (45.65) | 35 (25.36) | 60 (43.48) | 1.48 |
| Black | 69 (63.89) | 53 (49.07) | 43 (39.8) | 49 (46.37) | 78 (72.22) | 2.70 |
| SES | ||||||
| Low | 31 (44.28) | 27 (38.57) | 28 (40.00) | 24 (34.29) | 46 (65.71) | 2.23 |
| High | 53 (30.11) | 57 (32.39) | 78 (44.32) | 60 (34.09) | 92 (52.27) | 1.93 |
Note. SES was dichotomized into two groups for the purposes of displaying frequencies.
Table 12.
Frequency of selection of attributions by demographic factors
| Race n (%) | Gender n (%) | Age n (%) | Education n (%) | Economic n (%) | Mean # attrib selected | ||
|---|---|---|---|---|---|---|---|
| Gender | Race | ||||||
|
|
|||||||
| Male | White | 9 (13.04) | 6 (8.70) | 35 (50.72) | 19 (27.54) | 34 (49.28) | 1.49 |
| Black | 35 (68.63) | 20 (39.22) | 19 (37.25) | 10 (45.10) | 37 (72.55) | 2.63 | |
| Female | White | 6 (8.70) | 25 (36.23) | 28 (40.58) | 16 (23.19) | 26 (37.68) | 1.46 |
| Black | 34 (59.65) | 33 (57.89) | 24 (42.11) | 26 (45.61) | 41 (71.93) | 2.77 | |
| Gender | Age | ||||||
|
|
|||||||
| Male | ≥ 60 years | 6 (16.22) | 6 (16.22) | 23 (62.16) | 10 (27.03) | 12 (32.43) | 1.54 |
| < 60 years | 38 (45.78) | 20 (24.10) | 31 (37.35) | 32 (38.55) | 59 (71.08) | 2.17 | |
| Female | ≥ 60 years | 10 (22.22) | 20 (44.44) | 22 (48.89) | 8 (17.78) | 15 (33.33) | 1.67 |
| < 60 years | 30 (37.04) | 38 (46.91) | 30 (37.04) | 34 (41.98) | 52 (64.20) | 2.27 | |
| Gender | SES | ||||||
|
|
|||||||
| Male | Low | 15 (41.67) | 10 (27.78) | 11 (30.56) | 11 (30.56) | 24 (66.67) | 1.97 |
| High | 29 (34.52) | 16 (19.05) | 43 (51.19) | 31 (36.90) | 47 (55.95) | 1.98 | |
| Female | Low | 16 (47.06) | 17 (50.00) | 17 (50.00) | 13 (38.24) | 22 (64.71) | 2.50 |
| High | 24 (26.09) | 41 (44.57) | 35 (38.04) | 29 (31.52) | 45 (48.91) | 1.89 | |
| Race | Age | ||||||
|
|
|||||||
| White | ≥ 60 years | 3 (4.69) | 15 (23.44) | 36 (56.25) | 9 (14.06) | 15 (23.44) | 1.22 |
| < 60 years | 12 (16.22 | 16 (21.62) | 27 (36.49) | 26 (35.14) | 45 (60.81) | 1.70 | |
| Black | ≥ 60 years | 13 (72.22) | 11 (61.11) | 9 (50.00) | 9 (50.00) | 12 (66.67) | 3.00 |
| < 60 years | 56 (62.22) | 42 (46.67) | 34 (37.78) | 40 (44.44) | 66 (73.33) | 2.64 | |
| Race | SES | ||||||
|
|
|||||||
| White | Low | 5 (18.52) | 5 (18.52) | 7 (25.93() | 5 (18.52) | 17 (62.96) | 1.44 |
| High | 10 (9.01) | 26 (23.42) | 56 (50.45) | 30 (27.03) | 43 (38.74) | 1.49 | |
| Black | Low | 26 (60.47) | 22 (51.16) | 21 (48.84) | 19 (44.19) | 29 (67.44) | 2.72 |
| High | 43 (66.15) | 31 (47.69) | 22 (33.85) | 30 (46.15) | 49 (75.38) | 2.69 | |
| Age | SES | ||||||
|
|
|||||||
| ≥ 60 years | Low | (5) 41.67 | 4 (33.33) | 7 (58.33) | 3 (25.00) | 7 (58.33) | 2.17 |
| High | (11) 15.71 | 22 (31.43) | 38 (54.29) | 15 (21.43) | 20 (28.57) | 1.51 | |
| < 60 years | Low | 26 (44.83) | 23 (39.66) | 21 (36.21) | 21 (36.21) | 39 (67.24) | 2.24 |
| High | 42 (39.62) | 35 (33.02) | 40 (37.74) | 45 (42.45) | 72 (67.92) | 2.21 | |
Note. SES was dichotomized into two groups for the purposes of displaying frequencies.
Discussion
Prior work shows that individuals may experience mistreatment because of sociodemographic factors including age, race, gender, and SES. Importantly, work on intersectionality posits that these factors may interact in a fluid manner to influence inequalities (Hankivsky, 2012). Therefore, the goal of this paper was to test the effect of these factors on both amount of mistreatment reported and attributions for discrimination, as well as to advance the literature on taking an intersectional approach in exploring the interactions of sociodemographic factors on both the level of mistreatment and discrimination attributions.
In part one we described the effect of age, race, gender, and socioeconomic status, and their interactions, on level of self-reported mistreatment. Largely consistent with prior work, we found that overall level of mistreatment reported was lower in older age cohorts and among those with higher socioeconomic status (SES was not significant with all main effects entered in the same model). We also found that Black participants reported more mistreatment than White participants and men reported marginally more mistreatment than women. However, we found no significant interactions between sociodemographic characteristics and overall reported levels mistreatment. In this sample, then, there was evidence that reports of discrimination were related to individual sociodemographic indicators, but that such processes appeared to operate largely independently. In other words, there was not strong evidence in this sample for intersectional effects on reports of overall mistreatment.
In aim two we described the effect of sociodemographic factors and their interactions on attributions for discrimination. Regarding main effects, we found that older participants and those with higher socioeconomic status were less likely to select the race attribution for discrimination. As expected, more Black than White participants selected the race attribution for discrimination. There was a race by age interaction, which revealed that White participants were less likely to select the race attribution with increasing age, whereas for Black participants the probability of race attribution remained consistent across age groups. Although we found no interaction between race and age on amount of mistreatment reported, the intersection between race and age on selection of the race attribution suggests that for Black individuals, race may remain a salient attribution for perceived discrimination regardless of age. Research taking a stress approach suggests that older minorities may report more racial discrimination than their younger counterparts because racial discrimination is a chronic stressor that may result in the accumulation of allostatic load in older individuals (Szanton, Gill, & Allen, 2005). In contrast, others have shown that in racial minorities, the perception of racial discrimination may decrease with age (see Yip, Gee, & Takeuchi, 2009). It is possible that African Americans in our sample, having repeatedly experienced racial discrimination across the lifespan, were more likely to attribute discrimination to race (Himmelstein, Young, Sanchez, & Jackson, 2015). More generally, the approach of examining the racial attribution separately from amount of mistreatment may help disentangle inconsistencies in the literature. For example, it may help clarify to what extent the amount of mistreatment versus attributions to racial discrimination may have differential impact on minority populations. Future work should also examine whether factors such as vigilance influence the perception of racial discrimination.
Analyses to assess the influence of sociodemographic factors and their interactions on the selection of the gender attribution revealed no significant interactions. We found that female participants were more likely to select the gender attribution for discrimination than males. Although men reported marginally more overall perceptions of mistreatment than women, our results concerning the selection of the gender attribution is consistent with prior work showing that sexist hassles are common among women (Brinkman, Garcia, & Rickard, 2011) and that women are more likely than men to report gender-related discriminatory events (Swim, Hyers, Cohen, & Ferguson, 2001). This may be explained by the perception among some men that this type of behavior is acceptable or not threatening. In turn, among some men, gender-related events may be less salient, thus less likely to be attributed to gender (Brinkman & Rickard, 2009; Swim et al., 2001). We also found a main effect of race such that Black participants were more likely than White participants to select the gender attribution for discrimination. Although the interaction between race and gender only approached significance (see Table 5), it suggested that Black females were more likely than White females to select the gender attribution for discrimination. Taken together, these results are broadly consistent with evidence on the pervasive nature of gendered racism. This phenomenon posits that sexism and racism intersect and simultaneously effect oppression experienced by minorities, which may be different than the effects of racism or sexism alone (Malcom et al., 1975). For example, African American men being stereotyped as criminals or athletes, or African American women as promiscuous or emasculating, are common stereotypes that reflect the interaction of gender and race on experience (Schwing, Wong, & Fann, 2013; Thomas, Witherspoon, & Speight, 2008). There may also be unmeasured contextual (e.g., professional setting/workplace dynamics) and psychological (e.g., endorsement of gender and racial stereotypes) factors that could reflect gendered racism and influence the endorsement of these attributions in our sample (Settles, 2006; Wingfield & Wingfield, 2014).
There was a significant interaction of gender and socioeconomic status on the selection of the age attribution for discrimination. For men, as socioeconomic status increased, the likelihood of endorsing the age attribution increased. However this was the not the case for women, who were more likely than males to attribute discrimination to age at lower SES. Prior work on age discrimination has shown that older, more highly educated men were more likely to report age discrimination, yet wealth was inversely related to age discrimination; being employed was related to less age discrimination (Rippon, Kneale, Oliveira, Demakakos, & Steptoe, 2014). Our results show a crossover effect, suggesting that this work may have different implications for men and women depending on the context in which feel their SES may be contributing to age-related discrimination. For example, perhaps “ageism” is a more salient experience for men in certain sectors of the job force, such as higher-level white collar jobs, whereas for women, discrimination due to age is more salient for those whose socioeconomic position is not as well-established. In this way, there may also be important personal and contextual factors contributing to our results, such as chronological age, setting of discrimination, and saliency of ageism in the contextual environment that should be examined in future work. This work may also have implications for interventions aimed at reducing ageism in certain contexts. Future studies that have the capacity to gather more information about contextual and personal factors may better elucidate where and for whom such interventions may be most beneficial.
As previously noted, we found that SES, a composite of income and education, predicted two attributions, economic/financial situation and education, thus we tested all predictor variables against both attributions for discrimination. For both the economic/financial situation and education attributions for discrimination, we found that the probability of selecting these attributions decreased with age and with increasing SES. Additionally, we found that Black participants were more likely than White participants to select these attributions, suggesting that economic factors may contribute to some Black individuals’ understanding of reasons for mistreatment. When we tested interaction models, we found there was a significant age by gender interaction for the selection of the education attribution. Specifically, we found that for females, the odds of endorsing the education attribution sharply decreased in older cohorts, but for males it remained relatively constant, decreasing only slightly in older cohorts. This intersection suggests that unlike females, males may attribute discrimination due to their socioeconomic status throughout their life. Indeed, recent work has shown that masculinity is often measured in terms of toughness, social status, and monetary achievement or being the “breadwinner” (Thompson & Bennett, 2015). There was also a significant race by socioeconomic status interaction for the economic/financial situation attribution such that, for White participants, the likelihood of endorsing the attribution decreased as socioeconomic status increased, yet for Black participants, endorsement remained consistent. The difficulty in disentangling race and socioeconomic status may be reflected in our results. Indeed, prior work has consistently highlighted the confounding of race and SES (LaVeist, 2005), such that SES may be one mechanism through which race and racism impact disparities faced by minorities (e.g., differential access to educational, housing, and employment opportunities; Malcom et al., 1975; Williams, 1999). Our results likely reflect that experiences of discrimination may be unique for Black participants due to oppression related to both their race and SES. These results highlight the need to explore factors that potentially contribute to racial disparities at the societal and/or structural level. In addition, intersectional effects of sociodemographic identities on discrimination due to education and economic factors may be particularly relevant for public health efforts to reduce discrimination at the structural and/or institutional levels. In particular, our results have implications for understanding how different groups may be influenced by experiences related to SES discrimination (e.g., inequality in access to services, housing, etc.).
The use of the Everyday Discrimination Scale allowed us to examine both the amount of self-reported discrimination and the reasons (attributions) for discrimination; together, these start to reveal some interesting patterns. For instance, we showed that the amount of self-reported discrimination decreased across age cohorts, as did the selection of the race and SES attributions for discrimination, yet the selection of the age attribution increased across age cohorts. Perhaps older individuals become less cognizant of discrimination due to their skin color, education, and financial situation, yet become more aware of ageism due to traditional aging stereotypes (e.g., “to be old is to be sick; the elderly don’t pull their own weight,” etc.; Ory, Hoffman, Hawkins, Sanner, & Mockenhaupt, 2003). We found that Black participants reported more mistreatment overall than White participants (Barnes et al., 2004). Yet, our study also revealed that Black participants were more likely to attribute mistreatment to a cluster of dimensions of identity, including race, gender, education, and economic/financial situation. These results are not surprising given the close relationship between race and discrimination in employment and educational sectors, banking and real estate policies, and other forms of discrimination at the structural level, as well as the close relationship between gender and racism (see Malcom et al., 1975; Williams, 1999). Unlike previous research, however, our study shows that Black individuals may experience not only more mistreatment, but attribute discrimination to a greater variety of sources/reasons. This may help continue to inform the well-established link between discrimination and stress and significant health disparities in racial minorities (Williams, 1999). Similarly, participants in younger age cohorts were more likely than those in older cohorts to experience more mistreatment overall, as well as attribute discrimination to a greater variety of sources/reasons such as race, education, and economic/financial situation; older participants were more likely to attribute discrimination to age. These results may reflect the dynamic nature of social categorization as a function of age, such that younger individuals may achieve higher social status as they get older. This may help explain why older participants in our study were less likely to attribute discrimination to sources/reasons related to SES. Additionally, prior work has noted that sense of group identification in older individuals may be protective against the effects of perceived discrimination (Garstka, Schmitt, Branscombe, & Hummert, 2004). As such, sense of group identification may be an unexamined factor in our study that influenced the likelihood of participants attributing discrimination to various reasons. This also highlights the importance of examining aspects of identity that may contribute to perceived discrimination other than just being ‘young’ or ‘old.’ Our results showing frequency of selection of attributions to discrimination revealed that within all sociodemographic groups, the mean number of attributions selected was greater than one and as high as three. Although we were not able to determine which attributions were weighted as the most important (or salient) to participants, our results suggest that individuals with multiple stigmatized identities may attribute discrimination to several characteristics beyond only the group to which they belong (i.e., black individuals are attributing discrimination to more factors than just their race). The results of this study may outline the origin of strategies for more ideographically tailored interventions to aid in coping with discrimination; that is, such approaches could be tailored to the specific domains of an individual’s identity, as experiences of mistreatment and attributions as to the source of discrimination may vary between demographic groups (overall and in an intersectional sense).
Mounting evidence suggests that the degree to which an individual’s stigmatized identity is visible to others may have particular relevance for health. For example, individuals with potentially concealable stigmatized identities (e.g., LGB status) may be protected from certain stressors due to their ability to “hide” their stigmatized identity (Newheiser & Barreto, 2014). Other groups, such as those who are overweight or obese, may be more vulnerable to overt social stressors such as threat or exclusion because their stigmatized status is visible to others (Vartanian & Smyth, 2013). In our study, socioeconomic status could potentially be concealed from others, whereas race, gender, and age may be more visible. We found no main effect of SES on level of mistreatment or attributions to discrimination. However, we did find intersectional effects of SES on attributions. Specifically, at lower SES, females more so than males attributed discrimination to age. Blacks more so than Whites attributed discrimination to economic/financial situation at higher SES. These results suggest that SES, a potentially “concealed” identity, interacts with other more visible identities to influence perceptions of discrimination. As reflected by the lack of main effect of SES on discrimination or attributions, the SES of individuals in our sample does not appear to have functioned independently to influence perceptions of discrimination. Our significant interactions, are in line with prior work on intersectionality that that rejects the notion of single dimensions of identity functioning separately within individuals. Indeed, in our sample, multiple factors were perhaps at play within individuals to determine experiences (Hankivsky, 2012). The nature of our discrimination scale also allowed us to examine potentially visible (i.e., race) versus concealable (i.e., education) attributions for discrimination. In our sample, participants with a visible stigmatized identity attributed discrimination to characteristics that were both visible and invisible. In particular, Black participants were more likely than Whites to attribute discrimination to race, gender, education status, and economic status. Importantly, we do not have information about individuals’ perceptions of concealability of SES, which limits our ability to make concrete conclusions about how perceived “out-ness” of SES contributed to discrimination and attributions. However this work has implications for futures studies that consider how concealable identities may function to influence perceptions of discrimination in particular contexts.
Limitations
Our study has several noteworthy limitations. First, our data were cross-sectional, which prevented us from making conclusions about time-varying (e.g., developmental) processes within individuals. Newer research is calling for a within-person approach that would answer questions about not only who reports discrimination and attributions for discrimination, but also when these reports may be most salient across settings and the lifespan. Newer data collection methods such as ecological momentary assessment would allow for examination of these processes in ‘real time’, as well as linking data about self-reported discrimination to indicators of health in a causal way. Second, although the link between discrimination and health is well documented, examining these factors was beyond the scope of this paper. Future work should examine the effect of discrimination and attributions for discrimination on health, and could also examine important moderators (e.g., perceived control, racial identity) in this relationship. Third, as noted, our sample did not allow us to examine the experiences of racial groups beyond White and Black. The experiences of other racial minorities such as Latino and Asian-Americans may be dissimilar than that of Blacks, and it is essential for future work to examine these racial groups and others in more depth. Finally, although our measure of discrimination did allow us to examine amount of discrimination experienced separately from attributions for discrimination, it was limited in that we could not disentangle the amount of perceived discrimination that was due to each attribution. For example, if discrimination was attributed to race and gender, they were considered equally important, yet this may limit our understanding of the extent to which different aspects of identity may be the source of discrimination. Similarly, it was beyond the scope of this paper to examine the intersection of attributions. The nature of the EDS measure we used (with ‘independent’ ratings of attributions for mistreatment) does not allow us to discern the meaning behind multiple endorsements. That is, if a participant endorsed attributing mistreatment to gender and race, we cannot determine if those reflect independent attributions (e.g., female, Black) to different experiences or contexts, or if it refers to attributing discrimination to the specific intersection (e.g., being a Black female; see Bowleg, 2008).
Conclusion
Overall, our study extends prior evidence showing the effect of stigmatized demographic characteristics (e.g., race, age, gender, SES) on level of mistreatment. Our approach and results also point to the importance of examining not only the factors contributing to amount of mistreatment, but also to what sources individuals attribute discrimination (cf. Dion et al., 2009). Additionally, our results provide some initial empirical support for the value of taking an intersectional approach; namely, that the complexity of discrimination (and attributions for such) may be better explained by examining the multiple disadvantaged statuses that many individuals possess (Lewis et al., 2015). In fact, many of our intersectional results were related to the effect of demographic factors on attributions for discrimination as opposed to overall reports of the level of mistreatment. These findings suggest that research seeking to understand health disparities related to discrimination may benefit from examining the multiple social identities contributing to discrimination. In this way, the consequences of belonging to multiple stigmatized groups, and contexts where discrimination is attributed to multiple sources, may have particular relevance for health and well-being (e.g., for tailoring interventions to reduce health disparities). As such, future work might more carefully examine contexts where discrimination is attributed to multiple sources, and such circumstances may have particularly relevance for health and well-being (Dion et al., 2009). Considering that much of the research on discrimination has been done with limited samples, our work is unique in that we had a well-stratified community sample, which allowed us to compare across groups to determine not only how much mistreatment may be experienced, but also, importantly, the effect of sociodemographic characteristics on attributions for discrimination. Further, taking an intersectional approach allowed us to fully examine the dynamic effects of various characteristics of the population on experiences of mistreatment and attributions to discrimination. Given that the field of intersectionality is growing, this work may serve as an example of empirically testing intersectional relationships, and will inform future studies linking level of mistreatment, as well as attributions for discrimination, to negative health outcomes.
Acknowledgments
This work was supported by NIH grant R01-039409.
Footnotes
The authors declare that they have no conflict of interest.
References
- Awad GH. The impact of acculturation and religious identification on perceived discrimination for Arab/Middle Eastern Americans. Cultural Diversity and Ethnic Minority Psychology. 2010;16(1):59–67. doi: 10.1037/a0016675. [DOI] [PubMed] [Google Scholar]
- Barnes LL, Leon CFMD, Wilson RS, Bienias JL, Bennett DA, Evans DA. Racial differences in perceived discrimination in a community population of older blacks and whites. Journal of Aging and Health. 2004;16(3):315–337. doi: 10.1177/0898264304264202. [DOI] [PubMed] [Google Scholar]
- Bastos JL, Celeste RK, Faerstein E, Barros AJD. Racial discrimination and health: A systematic review of scales with a focus on their psychometric properties. Social Science & Medicine. 2010;70(7):1091–1099. doi: 10.1016/j.socscimed.2009.12.020. [DOI] [PubMed] [Google Scholar]
- Borders A, Liang CTH. Rumination partially mediates the associations between perceived ethnic discrimination, emotional distress, and aggression. Cultural Diversity and Ethnic Minority Psychology. 2011;17(2):125–133. doi: 10.1037/a0023357. [DOI] [PubMed] [Google Scholar]
- Bowleg L. When black + lesbian + woman ≠ Black Lesbian Woman: The methodological challenges of qualitative and quantitative intersectionality research. Sex Roles. 2008;59(5–6):312–325. doi: 10.1007/s11199-008-9400-z. [DOI] [Google Scholar]
- Brenick A, Titzmann PF, Michel A, Silbereisen RK. Perceptions of discrimination by young Diaspora migrants: Individual- and school-level associations among adolescent ethnic German immigrants. European Psychologist. 2012;17(2):105–119. doi: 10.1027/1016-9040/a000118. [DOI] [Google Scholar]
- Brinkman BG, Garcia K, Rickard KM. “What I wanted to do was…” Discrepancies between college women’s desired and reported responses to gender prejudice. Sex Roles. 2011;65(5):344–355. doi: 10.1007/s11199-011-0020-7. [DOI] [Google Scholar]
- Brinkman BG, Rickard KM. College students’ descriptions of everyday gender prejudice. Sex Roles. 2009;61(7–8):461–475. doi: 10.1007/s11199-009-9643-3. [DOI] [Google Scholar]
- Carlisle SK. Perceived discrimination and chronic health in adults from nine ethnic subgroups in the USA. Ethnicity & Health. 2015;20(3):309–326. doi: 10.1080/13557858.2014.921891. [DOI] [PMC free article] [PubMed] [Google Scholar]
- Chae DH, Lincoln KD, Jackson JS. Discrimination, attribution, and racial group identification: Implications for psychological distress among Black Americans in the National Survey of American Life (2001–2003) American Journal of Orthopsychiatry. 2011;81(4):498–506. doi: 10.1111/j.1939-0025.2011.01122.x. [DOI] [PubMed] [Google Scholar]
- Crocker J, Voelkl K, Testa M, Major B. Social stigma – the affective consequences of attributional ambiguity. Journal of Personality and Social Psychology. 1991;60(2):218–228. doi: 10.1037/0022-3514.60.2.218. [DOI] [PubMed] [Google Scholar]
- Dion KL, Dion KK, Banerjee R. Multiculturalism and Social Cohesion. Springer; Netherlands: 2009. Discrimination, ethnic group belonging, and well-being; pp. 69–87. Retrieved from http://link.springer.com/chapter/10.1007/978-1-4020-9958-8_3. [Google Scholar]
- Else-Quest NM, Hyde JS. Intersectionality in quantitative psychological research: II. Methods and techniques. Psychology of Women Quarterly. 2016;40(3):319–336. [Google Scholar]
- Ferraro KF. Double jeopardy to health for Black older adults. Journal of Gerontology. 1987;42(5):528–533. doi: 10.1093/geronj/42.5.528. [DOI] [PubMed] [Google Scholar]
- Garstka TA, Schmitt MT, Branscombe NR, Hummert ML. How young and older adults differ in their responses to perceived age discrimination. Psychology and Aging. 2004;19(2):326–335. doi: 10.1037/0882-7974.19.2.326. [DOI] [PubMed] [Google Scholar]
- Gomez JP, Trierweiler SJ. Does discrimination terminology create response bias in questionnaire studies of discrimination? Personality and Social Psychology Bulletin. 2001;27(5):630–638. doi: 10.1177/0146167201275011. [DOI] [Google Scholar]
- Grollman EA. Multiple disadvantaged statuses and health: The role of multiple forms of discrimination. Journal of Health and Social behavior. 2014;S5(1):3–19. doi: 10.1177/0022146514521215. [DOI] [PubMed] [Google Scholar]
- Hankivsky O. Women’s health, men’s health, and gender and health: Implications of intersectionality. Social Science & Medicine. 2012;74(11):1712–1720. doi: 10.1016/j.socscimed.2011.11.029. [DOI] [PubMed] [Google Scholar]
- Hatzenbuehler ML, Link BG. Introduction to the special issue on structural stigma and health introduction. Social Science & Medicine. 2014;103(SI 1):1–6. doi: 10.1016/j.socscimed.2013.12.017. [DOI] [PubMed] [Google Scholar]
- Herek GM. Hate crimes and stigma-related experiences among sexual minority adults in the United States: Prevalence estimates from a national probability sample. Journal of Interpersonal Violence. 2009;24(1):54–74. doi: 10.1177/0886260508316477. [DOI] [PubMed] [Google Scholar]
- Himmelstein MS, Young DM, Sanchez DT, Jackson JS. Vigilance in the discrimination-stress model for Black Americans. Psychology & Health. 2015;30(3):253–267. doi: 10.1080/08870446.2014.966104. [DOI] [PMC free article] [PubMed] [Google Scholar]
- Kessler RC, Mickelson KD, Williams DR. The prevalence, distribution, and mental health correlates of perceived discrimination in the United States. Journal of Health and Social Behavior. 1999;40(3):208–230. doi: 10.2307/2676349. [DOI] [PubMed] [Google Scholar]
- LaVeist TA. Disentangling race and socioeconomic status: A key to understanding health inequalities. Journal of Urban Health-Bulletin of the New York Academy of Medicine. 2005;82(2):III26–III34. doi: 10.1093/jurban/jti061. [DOI] [PMC free article] [PubMed] [Google Scholar]
- Lewis TT, Cogburn CD, Williams DR. Self-reported experiences of discrimination and health: Scientific advances, ongoing controversies, and emerging issues. Annual Review of Clinical Psychology. 2015;11:407–440. doi: 10.1146/annurevclinpsy-032814-112728. [DOI] [PMC free article] [PubMed] [Google Scholar]
- Link BH, Phelan JC. Conceptualizing stigma. Annual Review of Sociology. 2001;27:363–385. doi: 10.1146/annurev.soc.27.1.363. [DOI] [Google Scholar]
- Luo Y, Xu J, Granberg E, Wentworth WM. A longitudinal study of social status, perceived discrimination, and physical and emotional health among older adults. Research on Aging. 2012;34(3):275–301. doi: 10.1177/0164027511426151. [DOI] [Google Scholar]
- Major B, O’Brien LT. The social psychology of stigma. Annual Review of Psychology. 2005;56:393–421. doi: 10.1146/annurev.psych.56.091103.070137. [DOI] [PubMed] [Google Scholar]
- Major B, Quinton WJ, Schmader T. Attributions to discrimination and self-esteem: Impact of group identification and situational ambiguity. Journal of Experimental Social Psychology. 2003;39(3):220–231. doi: 10.1016/S0022-1031(02)00547-4. [DOI] [Google Scholar]
- Malcom SM, Hall PQ, Brown JW. The double bind: The price of being a minority woman in science: Report of a Conference of Minority Women Scientists. Warrenton, VA: American Association for the Advancement of Science; 1975. [Google Scholar]
- McCall L. The complexity of intersectionality. Signs. 2005;30(3):1771–1800. doi: 10.1086/426800. [DOI] [Google Scholar]
- Newheiser AK, Barreto M. Hidden costs of hiding stigma: Ironic interpersonal consequences of concealing a stigmatized identity in social interactions. Journal of Experimental Social Psychology. 2014;52:58–70. doi: 10.1016/j.jesp.2014.01.002. [DOI] [Google Scholar]
- O’Brien LT, Major B, Simon S. Why did you choose that person over me? Ingroup rejection and attributions to discrimination. Journal of Experimental Social Psychology. 2012;48(6):1225–1233. doi: 10.1016/j.jesp.2012.04.007. [DOI] [Google Scholar]
- Ory M, Hoffman MK, Hawkins M, Sanner B, Mockenhaupt R. Challenging aging stereotypes: Strategies for creating a more active society. American Journal of Preventive Medicine. 2003;25(3):164–171. doi: 10.1016/S0749-3797(03)00181-8. [DOI] [PubMed] [Google Scholar]
- Pak AWP, Dion KL, Dion KK. Social-psychological correlates of experienced discrimination: Test of the double jeopardy hypothesis. International Journal of Intercultural Relations. 1991;15(2):243–254. doi: 10.1016/0147-1767(91)90032-C. [DOI] [Google Scholar]
- Paradies Y. A systematic review of empirical research on self-reported racism and health. International Journal of Epidemiology. 2006;35(4):888–901. doi: 10.1093/ije/dyl056. [DOI] [PubMed] [Google Scholar]
- Parent MC, DeBlaere C, Moradi B. Approaches to research on intersectionality: Perspectives on gender, LGBT, and racial/ethnic identities. Sex Roles. 2013;68(11–12):639–645. doi: 10.1007/s11199-013-0283-2. [DOI] [Google Scholar]
- Pascoe EA, Smart Richman L. Perceived discrimination and health: A meta-analytic review. Psychological Bulletin. 2009;135(4):531–554. doi: 10.1037/a0016059. [DOI] [PMC free article] [PubMed] [Google Scholar]
- Phelan JC, Lucas JW, Ridgeway CL, Taylor CJ. Sigma, status, and population health. Social Science & Medicine. 2014;102(S11):15–23. doi: 10.1016/j.socscimed.2013.10.004. [DOI] [PMC free article] [PubMed] [Google Scholar]
- Potter L, Wallston K, Trief P, Ulbrecht J, Juth V, Smyth J. Attributing discrimination to weight: Associations with well-being, self-care, and disease status in patients with type 2 diabetes. Journal of Behavioral Medicine. 2015;38(6):863–875. doi: 10.1007/s10865-015-9655-0. Advanced online publication. [DOI] [PMC free article] [PubMed] [Google Scholar]
- Rippon I, Kneale D, Oliveira C, Demakakos P, Steptoe A. Perceived age discrimination in older adults. Age and Ageing. 2014;43(3):379–386. doi: 10.1093/ageing/aft146. [DOI] [PMC free article] [PubMed] [Google Scholar]
- Rivera F, López I, Guarnaccia P, Ramirez R, Canino G, Bird H. Perceived discrimination and antisocial behaviors in Puerto Rican children. Journal of Immigrant and Minority Health. 2011;13(3):453–461. doi: 10.1007/s10903-010-9421-x. [DOI] [PMC free article] [PubMed] [Google Scholar]
- Schwing AE, Wong YJ, Fann MD. Development and validation of the African American Men’s Gendered Racism Stress Inventory. Psychology of Men & Masculinity. 2013;14(1):16–24. doi: 10.1037/a0028272. [DOI] [Google Scholar]
- Sechrist GB, Swim JK, Stangor C. When do the stigmatized make attributions to discrimination occurring to the self and others? The roles of self-presentation and need for control. Journal of Personality and Social Psychology. 2004;87(1):111–122. doi: 10.1037/0022-3514.87.1.111. [DOI] [PubMed] [Google Scholar]
- Settles IH. Use of an intersectional framework to understand black women’s racial and gender identities. Sex Roles. 2006;54(9–10):589–601. doi: 10.1007/s11199-006-9029-8. [DOI] [Google Scholar]
- Shields SA. Gender: An intersectionality perspective. Sex Roles. 2008;59(5–6):301–311. doi: 10.1007/s11199-008-9501-8. [DOI] [Google Scholar]
- Swim JK, Hyers LL, Cohen LL, Ferguson MJ. Everyday sexism: Evidence for its incidence, nature, and psychological impact from three daily diary studies. Journal of Social Issues. 2001;57(1):31–53. doi: 10.1111/0022-4537.00200. [DOI] [Google Scholar]
- Szanton SL, Gill JM, Allen JK. Allostatic load: A mechanism of socioecomonic health disparities? Biological Research for Nursing. 2005;7(1):7–15. doi: 10.1177/1099800405278216. [DOI] [PMC free article] [PubMed] [Google Scholar]
- Thomas AJ, Witherspoon KM, Speight SL. Gendered racism, psychological distress, and coping styles of African American women. Cultural Diversity and Ethnic Minority Psychology. 2008;14(4):307–314. doi: 10.1037/1099-9809.14.4.307. [DOI] [PubMed] [Google Scholar]
- Thompson EH, Bennett KM. Measurement of masculinity ideologies: A (critical) review. Psychology of Men & Masculinity. 2015;16(2):115–133. doi: 10.1037/a0038609. [DOI] [Google Scholar]
- Tomiyama AJ. Weight stigma is stressful. A review of evidence for the Cyclic Obesity/Weight-Based Stigma model. Appetite. 2014;82:8–15. doi: 10.1016/j.appet.2014.06.108. [DOI] [PubMed] [Google Scholar]
- Troxel WM, Matthews KA, Bromberger JT, Sutton-Tyrrell K. Chronic stress burden, discrimination, and subclinical carotid artery disease in African American and Caucasian women. Health Psychology. 2003;22(3):300–309. doi: 10.1037/0278-6133.22.3.300. [DOI] [PubMed] [Google Scholar]
- Vartanian LR, Smyth JM. Primum non nocere: Obesity stigma and public health. Bioethical Inquiry. 2013;10(1):49–57. doi: 10.1007/s11673-012-9412-9. [DOI] [PubMed] [Google Scholar]
- Watson JM, Scarinci IC, Klesges RC, Slawson D, Beech BM. Race, socioeconomic status, and perceived discrimination among healthy women. Journal of Women’s Health & Gender-Based Medicine. 2002;11(5):441–451. doi: 10.1089/15246090260137617. [DOI] [PubMed] [Google Scholar]
- Williams DR. Race, socioeconomic status, and health – the added effects of racism and discrimination. Annals of the New York Academy of Sciences. 1999;896:173–188. doi: 10.1111/j.1749-6632.1999.tb08114.x. [DOI] [PubMed] [Google Scholar]
- Williams DR, Mohammed SA. Discrimination and racial disparities in health: evidence and needed research. Journal of Behavioral Medicine. 2009;32(1):20–47. doi: 10.1007/s10865-008-9185-0. [DOI] [PMC free article] [PubMed] [Google Scholar]
- Williams DR, Neighbors HW, Jackson JS. Racial/ethnic discrimination and health: Findings from community studies. American Journal of Public Health. 2003;93(2):200–208. doi: 10.2105/AJPH.93.2.200. [DOI] [PMC free article] [PubMed] [Google Scholar]
- Williams DR, Yu Y, Jackson JS, Anderson NB. Racial differences in physical and mental health: Socioeconomic status, stress, and discrimination. Journal of Health Psychology. 1997;2(3):335–351. doi: 10.1177/135910539700200305. [DOI] [PubMed] [Google Scholar]
- Wingfield AH, Wingfield JH. When visibility hurts and helps: How intersections of race and gender shape black professional men’s experience with tokenization. Cultural Diversity and Ethnic Minority Psychology. 2014;20(4):483–490. doi: 10.1037/a0035761. [DOI] [PubMed] [Google Scholar]
- Yip T, Gee GC, Takeuchi DT. Racial discrimination and psychological distress: The impact of ethnic identity and age among immigrant and United States-Born Asian Adults. Developmental Psychology. 2009;44(3):787–800. doi: 10.1037/0012-1649.44.3.787. [DOI] [PMC free article] [PubMed] [Google Scholar]