

Abstract
We examine inferences about old age mortality that arise when researchers use survey data matched to death records. We show that even small rates of failure to match respondents can lead to substantial bias in the measurement of mortality rates at older ages. This type of measurement error is consequential for three strands in the demographic literature: (1) the deceleration in mortality rates at old ages, (2) the black-white mortality crossover, and (3) the relatively low rate of old age mortality among Hispanics—often called the “Hispanic paradox.” Using the National Longitudinal Survey of Older Men (NLS-OM) matched to death records in both the U.S. Vital Statistics system and the Social Security Death Index, we demonstrate that even small rates of missing mortality matching plausibly lead to an appearance of mortality deceleration when none exists, and can generate a spurious black-white mortality crossover. We confirm these findings using data from the National Health Interview Survey (NHIS) matched to the U.S. Vital Statistics system, a dataset known as the “gold standard” (Cowper et al., 2002) for estimating age-specific mortality. Moreover, with these data we show that the Hispanic paradox is also plausibly explained by a similar undercount.
Introduction
Both the scientific community and the general public have a deep interest in the processes that shape old age mortality. Many facets of old age mortality have elicited intense evaluation by scholars, including the following three topics:
The first issue is perhaps the most compelling topic in the study of mortality—the plasticity of longevity. Life expectancy has increased in a remarkably linear manner since the 1840s (Oeppen and Vaupel, 2002), naturally giving rise to a debate about the question: “Is there some built-in age limit to human life?” Relevant to this debate are studies that indicate a late-life mortality deceleration law—the empirical generalization that death rates level off at advanced ages, forming a late life mortality plateau.1
A second widely studied phenomenon is the “black-white mortality crossover.” At younger ages, blacks have higher mortality rates than corresponding whites—a result that is unsurprising given racial differences in socioeconomic factors. But it appears that black mortality rates become lower than white mortality rates at older ages (Manton et al. 1979; Berkman et al. 1989; Dupre et al. 2006; Kestenbaum 1992; Lynch et al. 2003; Masters 2012).
Third, there is substantial interest in the empirical generalization that Hispanic and Latino Americans have mortality rates that are similar to, or lower than, their non-Hispanic white counterparts. This finding has been entitled the “Hispanic paradox” (Markides and Coreil, 1986)—paradoxical given the socioeconomic differences between the two groups.
Findings about racial and ethnic differences in mortality are so anomalous that some scholars have explored the possibility that the results are due primarily to “bad data” (e.g., Coale and Kisker, 1986; Preston et al., 1996; Preston et al., 1999; Preston and Elo, 2006; Lynch et al., 2003, Swallen and Guend, 2003; Rosenberg et al., 1999). Despite decades of work to identify and correct data issues, demographers have largely concluded that careful data correction mitigates, but does not eliminate, the black-white crossover and Hispanic paradox. These findings have motivated a host of theories on why Hispanic Americans generally, and older blacks specifically, appear to die at lower rates than corresponding non-Hispanic whites (e.g., Vaupel et al., 1979; Manton and Stallard, 1984; and Manton, et al., 1979; Wrigley-Field, 2014; Abraido-Lanza et al., 1999; Shai and Rosenwaike, 1987).
Our contribution to the study of old age mortality falls squarely in the “bad data” domain. We show that even a small amount of a particular data problem—which we denote the “Methuselah effect”—biases inferences about old age mortality in predictable ways. Our theoretical analysis shows that the Methuselah effect can create the appearance of the three phenomena we have just mentioned—mortality deceleration, the black-white crossover, and the Hispanic paradox—even when none exist. Empirical evaluation, using data from the National Longitudinal Survey of Older Men (NLS-OM) and National Health Interview Survey (NHIS), demonstrates that the Methuselah effect indeed operates as predicted by theory.
To see the issue at hand, consider a research design that relies on data structure such as the “gold standard” (Cowper et al., 2002) NHIS data matched to National Death Index (NDI). It is easy to see why these data earned the “gold standard” imprimatur. After all, the NHIS dataset is large and population-representative; it includes multiple birth cohorts; and it is constructed using administrative records, which are generally viewed as accurate. Even so, it is inevitable that for at least a few individuals who appear the base sample, there will be a failure to match the death to administrative death records. This form of measurement error creates the Methuselah effect, so named because it produces a set of respondents who appear to live forever. The Methuselah effect will typically create small biases to the measurement of mortality at relatively young ages, but the bias grows precipitously as the population ages.
The intuition of the Methuselah effect is straightforward. Suppose that a respondent dies at age a, but the death is not matched to the base-sample respondent. This causes us to underestimate the numerator in our age a death rate—an inconsequential problem if such an occurrence is relatively rare. But then we will overestimate the denominator of the age specific mortality rate for all ages greater than a. As a cohort ages, the fraction of missing deaths rises relative to individuals who actually remain alive, and the Methuselah respondents inexorably come to dominate.2 Mortality estimates thus become progressively more downward-biased, leading mechanically to an inference of mortality rate deceleration. Moreover, if the failure-to-match rate varies by some group characteristic, this form of measurement error will affect group comparisons of mortality. Methuselah error is thus potentially salient for studies of the black-white mortality crossover and the Hispanic paradox, because of racial and ethnic differences in failure-to-match rates (Lariscy, 2011; Hsu, 2012).
Our paper proceeds as follows: First, we briefly review relevant literature. To provide motivation, we note several theories of aging and race-based differences in mortality selection (e.g., physiological degeneration, vitality loss, and frailty). We also provide a brief overview of previous work on measurement error as it pertains to the study of old age mortality.
Second, we provide a theoretical investigation of the biases introduced by the Methuselah effect—demonstrating how the Methuselah effect generates spurious mortality rate deceleration, and showing that even when mortality rates are higher for one sub-population (e.g., black men) than a second sub-population (e.g., white men) at all ages, a mortality crossover can spuriously appear if the failure-to-match rate is higher for the first group than for the second.
Finally, we explore the empirical relevance of our argument using two data sources. The first is the National Longitudinal Survey of Older Men (NLS-OM), a nationally representative survey of men born in the U.S., 1906–1921, which has recently been matched to death records in the U.S. Vital Statistics system and the Social Security Death Index. This is a remarkable dataset in that the matched dataset gives us three potentially useful death reports—two administrative reports on the date of death, and also the date of death reported in the survey (for the more than half of respondents who died during survey years). The survey occurred long enough ago that the sample can now be considered nearly an “extinct generation.” Our second data source is the NHIS, match to administrative death records, primarily to the National Death Index (NDI), but also to Social Security and Medicaid and Medicare records.
Our empirical work shows that the Methuselah effect falsely creates the inference of mortality rate deceleration. Also, in both data sets we find that deaths are matched at higher rates for non-Hispanic whites than for blacks or non-black Hispanics. Failure to account for the resulting measurement error leads us to estimate a black-white mortality crossover at approximately age 85, whereas once we account for measurement error we find little evidence of a black-white crossover. Similarly, any evidence of a Hispanic mortality advantage disappears once we account for the Methuselah effect.
The Current Literature on Old-age Mortality
Mortality Deceleration
Late-life mortality deceleration—a phenomenon in which mortality hazard rates tend to stabilize at advanced ages—is an empirical prospect that stands in contrast to a hazard that increases exponentially, as characterized by the Gompertz law. Mortality deceleration has been observed in insects, but is controversial in mammals (Gavrilov and Gavrilova, 2011). Gompertz (1825) first proposed late-life mortality deceleration in human aging and Greenwood and Irwin (1939) observed it in humans. Others disagree. For instance, Gavrilov and Gavrilova (2011) conclude that mortality deceleration is negligible up to the age of 106, and suggest that the Gompertz law provides a good fit.
Gavrilov and Gavrilova (2011) suggest several factors that might contribute to a spurious finding of mortality deceleration, and in each instance when they adjust for the factor, the fit with the Gompertz law improves. First, old individuals may exaggerate their ages, which reduces apparent mortality. Second, the use of discrete-time hazard estimation methods, rather than instantaneous hazard rate analysis, can be a problem. Third, issues arise when multiple birth cohorts are combined if those cohorts have differing age-specific mortality rates. Finally, the use of cross-sectional data, rather than cohort data, can lead to estimated deceleration. Gavrilov and Gavrilova (2011) show that there is no evidence of mortality deceleration in analyses that follow individual birth-year cohorts through extinction.
Race-Based Mortality Crossovers
In the United States, a black-white mortality crossover has been found for both men and women in a number of studies (Arias, 2006; Johnson, 2000; Kestenbaum 1992; Lynch et al., 2003; Parnell and Owens, 1999). In this crossover literature, mortality rates are found to be higher for blacks than for whites at younger ages, but are lower for blacks than whites at older ages. The crossover appeared, for instance, in the 1910 United States Life Tables, with the crossover occurring at age 79 for men and age 78 for women (Department of Commerce, 1921). The age of the mortality crossover now appears to be closer to age 85, and evidence suggests that the age of the crossover has been increasing across birth cohorts (Lynch, et al., 2003; Masters, 2012). As we have noted, there is disagreement among demographers on whether the crossover is the result of selection or bad data.
Beginning with the pioneering work of Vaupel et al. (1979), there has been widespread appreciation that population heterogeneity in the susceptibility to mortality (i.e., “frailty”) can lead to a surviving population being positively selected for survival (Manton and Stallard, 1981; Manton et al., 1984; Vaupel and Yashin, 1985; Nam, 1995; Lynch et al. 2003). Under this theory, individuals who survive to older ages are especially robust, as higher mortality across the life course has culled those who are relatively frail. In the study of black-white differences, this theory postulates that since blacks have higher mortality rates than whites earlier in life, older blacks are more robust on average, potentially explaining why blacks have lower mortality rates than whites at old ages.
An alternative explanation emphasizes how poor data quality biases estimates of older age mortality rates (Coale and Kisker 1986; Preston and Elo, 2006; Preston et al., 1996; Preston et al., 1999). To date, the principal data quality issue investigated has been the tendency for individuals to overstate their age, especially at older ages. This phenomenon appears especially pervasive among black Americans (Preston and Elo, 2006). For example, Preston et al. (2003) match 2,990 death certificates for blacks aged 60+ in 1980–85 to corresponding census records from childhood, finding that only 45 percent of women and 51 percent of men had an age at death reported on the death certificate consistent with the recorded census age. An incomplete Vital Statistics system, especially in the South in the early 20th century, left many older black Americans without a birth certificate and hence a known age, likely contributing to the high levels of age misreporting among older black Americans.
Proponents of the frailty view point to several findings. First, some studies find that correcting for age misreporting changes the age of the mortality crossover but does not eliminate it (Preston and Elo, 2006; Lynch et. al 2003). Second, scholars who use survey data, like the NHIS matched to the NDI, argue that this mitigates the issue of age misreporting at old ages, as age is taken from a survey administered years before death (Eberstein, Nam and Heyman, 2008; Lynch et al. 2003). Third, there is evidence that the mortality crossover occurs in some causes of death, but not others. For example, Eberstein, et al. (2008) report a notable crossover for deaths by heart disease but no evidence of a crossover for deaths by malignant neoplasms or by diabetes. This leads these authors to conclude, “Although age misreporting probably contributes to some of the discrepancy in age trends of mortality rates for whites and blacks (less so based on the NHIS-NDI dataset), it seems unlikely that it can be a major contributor to mortality crossovers. That would necessitate an age-misreporting pattern that varied by cause of death in a peculiar manner.” Finally, Masters (2012) suggests that adjusting for cohort of birth can eliminate the mortality crossover. This is consistent with the frailty point of view if differential mortality selection for blacks versus whites has been declining over the course of the 20th century (perhaps because of declining racial economic inequality).
General Empirical Approaches to Estimating Mortality
There is a vast literature on the estimation of mortality. The classic approach to the estimation of period age-specific mortality rates (ASMRs) entails estimation of two objects—target population cell estimates (for the denominator) and corresponding estimates of deaths (for the numerator)—from two different data sources. This procedure is used, for example, in the construction of the United States Life Tables released by the National Vital Statistics Reports (e.g., Arias 2006). At most ages, population estimates are formed using census data, and mortality is estimated using data from the National Vital Statistics System, though at older ages (ages 85 to 99) estimation relies also on data from the insured Medicare population.
There are well known concerns about the “two sample issue,” some of which are relevant to the black-white crossover and the Hispanic paradox. For example, in the study of mortality in the Hispanic population, a central concern is that individuals in household surveys record their own ethnicity, while in Vital Statistics data a proxy reports ethnicity (Swallen and Guend, 2003). If Hispanics are occasionally misreported as non-Hispanic white in Vital Statistics data, this would elevate estimated ASMR for non-Hispanic whites while depressing them for Hispanics. As for the black-white crossover, the reporting of age at death by a proxy, combined with mortality rates that rise with age, can lead to an overstatement of age at death in Vital Statistics records (Coale and Kisker, 1986; Myers, 1978). For example, Preston, Elo, and Stewart (1999) show that even if age misreporting is symmetric, because mortality rises with age, a relatively larger fraction of individuals recorded in any 5-year age interval in the Vital Statistics will generally be younger than they appear.3
A potential solution to the “two sample issue” is to estimate mortality rates from a single prospective study in which age is recorded when respondents are young, and respondents are followed until death. If race and ethnicity are reported in the prospective study, no reassessment is needed at death. A further potential advantage of prospective studies is that the documentation of date of death can often be directly established from respondents’ “contacts,” typically family members who help data collection agencies track the respondents’ whereabouts.4
More generally, deaths of respondents in the base study are often recorded by linking prospective survey data to subsequent mortality records, e.g., records in the National Death Index (NDI), which are thought to be highly accurate. The NHIS-NDI data are an example. As we have noted, researchers such as Cowper, et al. (2002) have highlighted the high quality of these data. Even so, concerns have been raised about the extent to which mortality estimates might be affected by the match quality between the data sources (Patel, et al., 2004). Matching is done on the basis of multiple factors, including Social Security number, first and last name, middle initial, date of birth, and other factors. The best match is determined by a probabilistic “match score” which sums a set of weights assigned to each of the items on which records are matched; there is no guarantee of complete match accuracy.
Lariscy (2011) investigates how match quality between the NDI and the 1989–2006 NHIS affects inference about mortality differences between Hispanics and non-Hispanic whites. He has two central findings: First, the quality of matches is poorer for Hispanic Americans than for non-Hispanic white Americans. Second, inferences about the Hispanic paradox depend on the cut-off criteria used in the “match score” when determining the acceptability of a data match. For example, for foreign-born Hispanics, relaxing and tightening the NCHS-recommended cut-point for match acceptance results in substantial changes to mortality risk relative to U.S.-born non-Hispanic whites. Lariscy (2011) also finds that among the oldest individuals, foreign-born Hispanics are less likely to die during follow-up than U.S.-born non-Hispanic whites, regardless of the matching standard he applies.
Our work is very much in the spirit of Lariscy (2011). We proceed, first of all, with a theoretical investigation of measurement error induced by the failure to match death records. We then turn to an empirical evaluation using NLS-OM data and NHIS data, in both cases matched to administrative death records.
Estimation of Mortality in Longitudinal Studies—A Theoretical Analysis
A Single Population
Suppose we have an initial sample of N0 individuals. At any subsequent time t, the sample is divided into the stock of survivors, Nt, and the stock of accumulated deaths, Dt,
| (1) |
The stock of accumulated deaths evolves by
| (2) |
where dt denotes time t deaths. The stock of survivors declines by
| (3) |
Researchers often wish to estimate the hazard rate, which is simply
| (4) |
Assume that difficulties in matching sample respondents to administrative data result in a probability α of missing a death. We divide deaths into two groups, those that are observed, , and those that are unobserved, , while assuming that all matched deaths are indeed deaths:
| (5) |
The realized proportion of unobserved deaths is , with . We can similarly divide the stock of accumulated deaths between observed deaths, , and unobserved deaths, , where of course
| (6) |
The realized proportion of unobserved accumulated deaths is , again with .
The observed hazard , the ratio of time t deaths and time t − 1 observed survivors, can be written
| (7) |
The first term of the far right-hand side of equation (7) is smaller than ht if there have been any missing deaths matches prior to time t. The second term further reduces the observed hazard rate if there is at least one missing death in the current period. Hence, as argued in Hsu (2012), this type of measurement error results in an underestimation of the hazard rate, and it does so in a way that grows over time. In particular, as a cohort becomes aged, the stock of accumulated deaths, Dt−1, grows, which means that the denominator in (7) increasingly diverges from the true number of survivors, Nt−1. As a mechanical matter, then, the observed hazard shows spurious deceleration.
We have a final observation: The measurement error results in an underestimation of the standard error. Because the hazard rate is the result of Nt−1 Bernoulli trials—the survivors either die or they do not—the standard error of the hazard rate is
| (8) |
This standard error is increasing in the hazard rate up to ht = 0.5, and is decreasing in Nt−1. Thus, as long as the hazard rate is below 0.5, the measurement error will incorrectly reduce our estimate of the standard error of the hazard rate, because and . Our measurement error, therefore, typically leads to an overstatement of the precision of our hazard rate.
Comparing Mortality across Populations
Now suppose we have two populations, and we want to compare the probability of death between these groups. Equation (7) helps us examine how our measurement error affects inferences about differences in the probability of death. Below, we present evidence that the rate of missing matches for black Americans, αb, is greater than for white Americans, αw, i.e., αb > αw. Researchers wish to estimate the difference in the hazard rates, ht,b − ht,w, but instead typically estimate the difference in observed rates, , which, using (7), is
| (9) |
The observed difference understates the true difference when and , which is likely, given αb > αw. Also, using logic from (8), the estimated standard error of the differences will typically be understated.
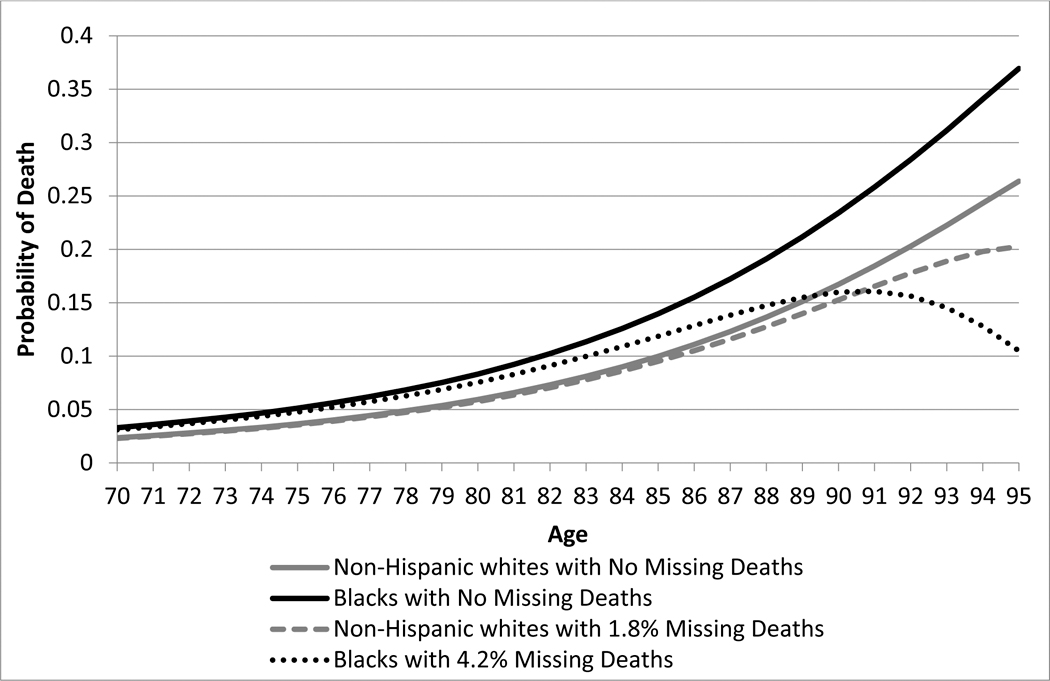
Figure 1 illustrates via simulation. In Panel A we have two populations—one with a 40% higher mortality rate at every age. We introduce Methuselah error to the high-mortality group, at rates of 1%, 5%, 10%, and 15%, in each case generating a spurious crossover. The age of the crossover is decreasing in the error rate. In Panel B we introduce a 4.2% match error rate in the higher-mortality group and a 1.8% error rate in the low mortality group, choosing these rates because they correspond to the lowest error rates we find, respectively, for blacks and whites in the NLS-OM data discussed below. Again, we observe a spurious crossover.
Figure 1.
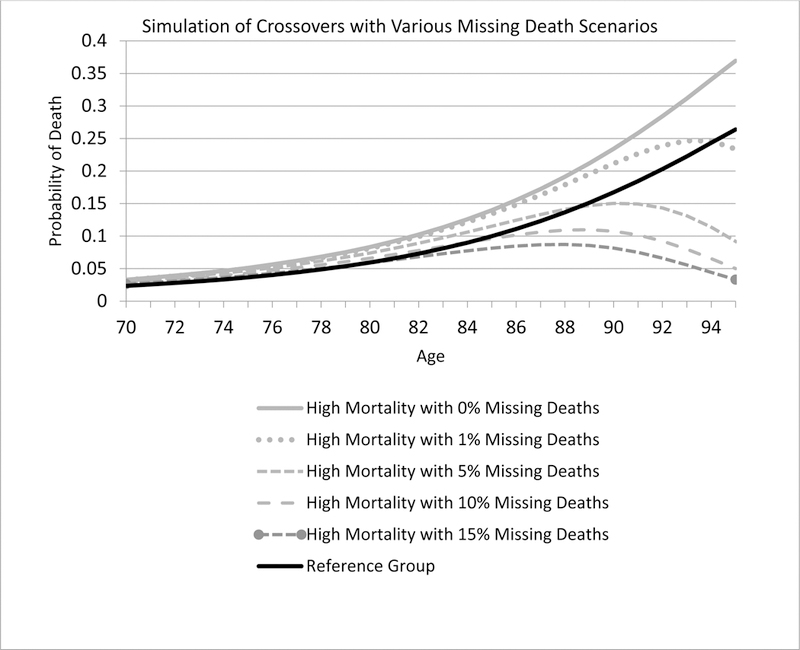
Simulations of spurious mortality crossovers
Panel A Consequences of varying rates of Methuselah error
Note: The reference group is from the SSA Life Tables. The “high mortality” group has a 40% higher mortality than the reference group. We then simulated missing deaths for the high mortality group, with error rates of 0%, 1%, 5%, 10% and 15%.
Panel B Simulation of a black-white mortality crossover with small rates of missing deaths
Note: The gray curve shows the probability of death for non-Hispanic whites, from the 2013 SSA Period Life Tables, and the black curve shows a population with 40% higher mortality. We then simulate missing deaths for the non-Hispanic whites at 1.8% and for blacks at 4.2%.
Our results are potentially germane to both the black-white mortality crossover and to the Hispanic paradox, given that death matching accuracy rates are higher for non-Hispanic whites than Hispanics and blacks, as we show below.
Measuring Death in Two Datasets
Missing Deaths in the National Longitudinal Survey – Older Men Cohort
Our empirical analysis proceeds with the Older Men Cohort of the National Longitudinal Survey (NLS-OM) data. This is a nationally representative survey of men, initiated in 1966, largely of men in the 1906 to 1921 birth cohorts. As of 1990, the Census Bureau, which conducted the interview for the Older Men’s Cohort, reported that 2,660 of the 5,020 men were deceased, which we refer to as the “survey” report. Given concerns some deaths may have been missed in the data collection process, in 1990 the Census attempted to match respondents to their Vital Statistics death certificate records. The match was possible because the Bureau had respondents’ names, date of birth, and Social Security numbers. This was a painstaking undertaking; given resources available at the time, there was a “hand-match” in which Bureau employees attempted to directly match respondents to their death records. This gives researchers two possible reports of a death by 1990. As we discuss below, the Vital Statistics 1990 match (the “VS90 match”) matched only 2,083 of the 2,660 deaths.
Our research team was interested in updating the mortality records in this cohort, and so we contracted with the Census Bureau to match the respondents with their death certificates through 2008, using Vital Statistics records, giving us deaths through the age of 102 years for the 1906 birth cohort (the oldest cohort) and through the age of 87 for the 1921 birth cohort (the youngest cohort). This new match was done electronically, and we expect computers to be better at matching than humans. Our match, the “VS08 match,” yielded 2,749 deaths as of 1990—666 more than the VS90 match and 89 more than the survey report.
In addition, the Census Bureau matched the Older Men cohort to the Social Security Administration (SSA) Death Index file, which recorded deaths through the end of 2012.5 Through 1990, the SSA report (“the SSA12 match”) produced 2,407 deaths. The SSA12 match has 324 more deaths than the VS90 match, but it is 253 short of the survey report and 342 short of the VS08 match. These reports are broken out by the race and ethnicity of the respondents in Table 1. We believe that this table represents compelling evidence that the VS08 match and the survey report are the highest quality. The VS90 match clearly failed to identify numerous deaths that appear in the other three sources, which is hardly surprising given it was a hand match. The SSA12 match also caught fewer deaths than either the survey report or VS08 match. As we wish to measure deaths up to 90 years of age, we focus on the VS08 match.
Table 1.
Distribution of deaths as of 1990, by source of report, NLS-OM data
| Survey | VS90 Match | VS08 Match | SSA12 Match | N | |
|---|---|---|---|---|---|
| Black | 874 | 634 | 893 | 734 | 1,420 |
| Non-black Hispanic | 20 | 14 | 21 | 17 | 82 |
| Non-Hispanic white | 1,730 | 1,405 | 1,797 | 1,625 | 3,467 |
| Other race | 36 | 30 | 38 | 31 | 51 |
| Total | 2,660 | 2,083 | 2,749 | 2,407 | 5,020 |
Source: Authors’ calculations, National Longitudinal Survey, Old Men Cohort.
Because survey houses are reluctant to accept a report of a death without documentation,6 it is reasonable to believe that there is a very low rate of “false positives.” This suggests we may evaluate the quality of the administrative data matches by comparing rates of missing matches when there are death reports in the survey. We pursue this strategy in Table 2. Here we see high rates of likely “false negatives”—a failure to match when in all likelihood a death has occurred—for both the VS90 and SSA12 matches. The error rate for the VS08 match is an order of magnitude smaller, but is still non-negligible, in the 2 to 4 percent range. Moreover, there are racial and ethnic differential in errors from all matches. It appears that black respondents are harder to match to death records than are non-black respondents in the NLS-OM.
Table 2.
Measurement error by race and ethnicity: Respondents reported dead in the survey, with a missing match to administrative records, NLS-OM data
| Black | Non-black Hispanic |
Non-Hispanic white |
|
|---|---|---|---|
| VS90 Match | |||
| Fraction missing when survey reports a | 0.280 | 0.300 | 0.193 |
| death | |||
| Number missing | 245 | 6 | 333 |
| SSA12 Match | |||
| Fraction missing when survey reports a | 0.206 | 0.150 | 0.110 |
| death | |||
| Number missing | 180 | 3 | 191 |
| VS08 Match | |||
| Fraction missing when survey reports a | 0.042 | 0.000 | 0.018 |
| death | |||
| Number missing | 37 | 0 | 31 |
| N | 1,420 | 82 | 3,467 |
Source: Authors’ calculations, National Longitudinal Survey, Old Men Cohort. There are 2,660 respondents reported as deceased by the survey by 1990: 874 blacks, 20 non-black Hispanics, 1,730 non-Hispanic whites (and 36 other race not included in the above analysis). If we test the null hypothesis that the rates of error are the same for blacks and non-Hispanic whites, we reject the hypothesis at the 0.001 percent confidence level for the VS90 Match, the SSA12 Match, and the VS08 Match.
Finally, we are interested in understanding who is failing to be matched in each of the respective reports. We examine the age of death as recorded in the survey. If there was no death recorded in the VS08 match, individuals were on average 59.3 years of age at death, but if there was a death recorded in the VS08 match, individuals were instead 67.3 years of age (t-test p-value < 0.01). We find similar results for the SSA12 matches: Those who were not matched were on average 63.9 years old at death, but those who were matched averaged 67.7 years old at death (t-test p-value < 0.01). These results suggest that failures to match are occurring disproportionately at earlier ages. Such failures to match make particular sense for the SSA12 match, as most individuals did not start to receive Social Security benefits until age 65 (unless they take early retirement at 62).
Black-White Mortality Crossovers in the NLS-OM
Using our matched NLS data, we can compare age-specific hazard curves for blacks and non-Hispanic whites for ages 60 and above. Because our NLS sample has few individuals who identify as non-black Hispanic, for the remainder of our analysis of NLS data, we focus only on blacks and non-Hispanic whites. We thus begin our analysis by eliminating all cases of individuals who do not fall into these demographic groups. We next eliminate the 326 individuals who died before reaching the age of 59 (the oldest cohort in 1966). We also drop three individuals who have a missing age of death in the VS08. We then estimate separate hazard rates for non-blacks and blacks. We estimate the nonparametric probability of dying in age (a) and race (r):
| (10) |
where τa,r is the age/race specific hazard rate.
In the top panel of Figure 2 we plot the hazard curves using the SSA12 match. We provide nonparametric estimates of the black-white gap in hazard rates in Panel A of Table 3. Consistent with numerous previous studies, we find a black-white mortality crossover; it occurs at age 76 and becomes statistically significantly at age 80. Of course, from our analysis above we know the SSA12 match misses a substantial fraction of death reports, and we know also that the fraction missed is relatively higher for black respondents. Given our theoretical arguments, we have concerns that the observed crossover could be a consequence of measurement error.
Figure 2. Nonparametric estimated hazard curves for NLS-OM data matches.
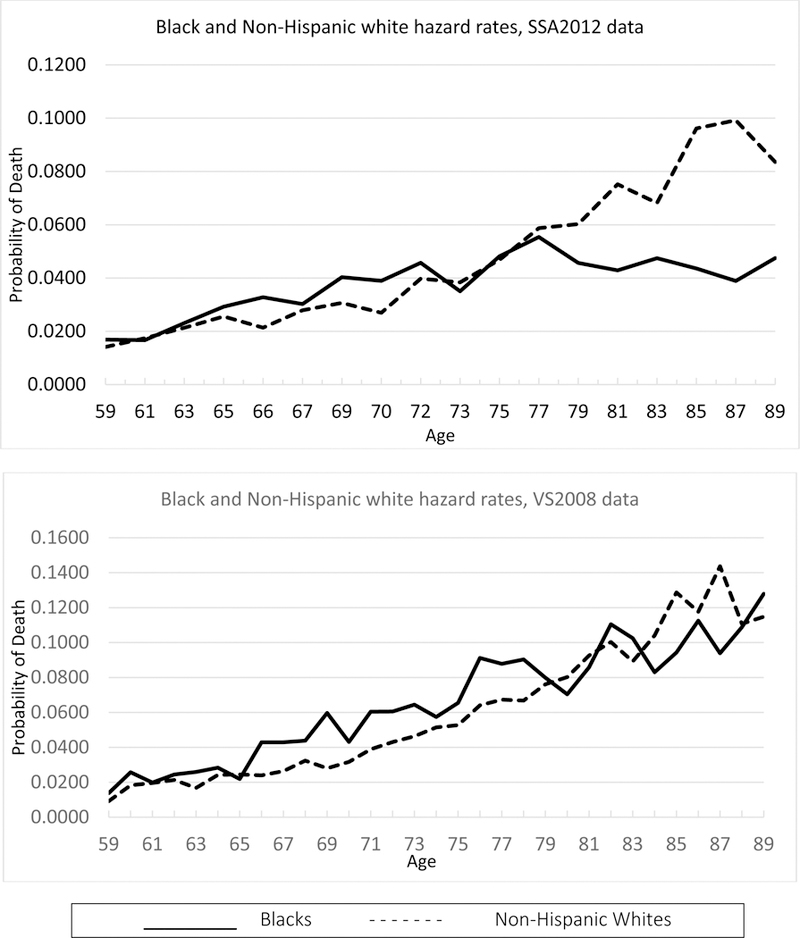
Note: The top panel uses SSA12 data and the lower panel VS08 data. Solid black lines indicate blacks. Dotted black lines indicate non-Hispanic whites.
Table 3.
Nonparametric estimates of hazard rate gap between blacks and non-Hispanic whites
| A. Social Security Administration 2012 Match | |||||
| Age | Black-White Gap | P-value | Age | Black-White Gap | P-value |
| 59 | 0.0027 | 0.500 | 75 | 0.0013 | 0.922 |
| 60 | 0.0013 | 0.803 | 76 | 0.0076 | 0.462 |
| 61 | −0.0007 | 1.000 | 77 | −0.0033 | 0.778 |
| 62 | 0.0028 | 0.531 | 78 | −0.0112 | 0.313 |
| 63 | 0.0018 | 0.728 | 79 | −0.0146 | 0.191 |
| 64 | 0.0006 | 0.895 | 80 | −0.0262 | 0.018 |
| 65 | 0.0036 | 0.519 | 81 | −0.0323 | 0.008 |
| 66 | 0.0114 | 0.041 | 82 | −0.0265 | 0.045 |
| 67 | 0.0023 | 0.670 | 83 | −0.0207 | 0.108 |
| 68 | 0.0124 | 0.058 | 84 | −0.0417 | 0.002 |
| 69 | 0.0097 | 0.151 | 85 | −0.0526 | 0.000 |
| 70 | 0.0120 | 0.078 | 86 | −0.0290 | 0.049 |
| 71 | 0.0128 | 0.074 | 87 | −0.0603 | 0.000 |
| 72 | 0.0060 | 0.434 | 88 | −0.0295 | 0.055 |
| 73 | −0.0033 | 0.752 | 89 | −0.0361 | 0.022 |
| 74 | 0.0026 | 0.763 | |||
| B. Vital Statistics 2008 Match | |||||
| Age | Black-White Gap | P-value | Age | Black-White Gap | P-value |
| 59 | 0.0046 | 0.198 | 75 | 0.0127 | 0.240 |
| 60 | 0.0075 | 0.124 | 76 | 0.0271 | 0.029 |
| 61 | 0.0002 | 1.000 | 77 | 0.0205 | 0.111 |
| 62 | 0.0031 | 0.562 | 78 | 0.0236 | 0.078 |
| 63 | 0.0092 | 0.059 | 79 | 0.0038 | 0.766 |
| 64 | 0.0042 | 0.437 | 80 | −0.0098 | 0.539 |
| 65 | −0.0025 | 0.727 | 81 | −0.0067 | 0.765 |
| 66 | 0.0190 | 0.003 | 82 | 0.0102 | 0.555 |
| 67 | 0.0165 | 0.011 | 83 | 0.0133 | 0.510 |
| 68 | 0.0114 | 0.106 | 84 | −0.0210 | 0.316 |
| 69 | 0.0317 | 0.000 | 85 | −0.0344 | 0.161 |
| 70 | 0.0114 | 0.133 | 86 | −0.0051 | 0.908 |
| 71 | 0.0215 | 0.011 | 87 | −0.0498 | 0.064 |
| 72 | 0.0175 | 0.053 | 88 | −0.0019 | 1.000 |
| 73 | 0.0181 | 0.054 | 89 | 0.0131 | 0.682 |
| 74 | 0.0059 | 0.559 | |||
Source: Authors’ calculations, National Longitudinal Survey, Old Men Cohort. P-values reported are based on a two-tailed Fisher’s Exact Test of the hypothesis that blacks and non-Hispanic whites have the same mortality rate at a given age.
In the bottom panel of Figure 2 we instead use the VS08 death reports to estimate the hazard curves, and we again show the corresponding nonparametric estimates in Table 3. With these data, which have fewer false negatives, the estimated black-white crossover occurs at age 83, and this gap is not statistically significant at any age above 83. The improvement in the data quality has a significant effect not only on the absolute levels of estimated mortality, but also on inferences about the black-white gap. As we have already seen (Figure 1), though, even the low error rates of the VS08 matching (which are correlated with race/ethnicity) can generate a spurious mortality crossover. We return to this issue in our model-based analysis below.
Missing Deaths in the National Health Interview Survey (NHIS)
We next study mortality using the National Health Interview Survey (NHIS), accessed through the Integrated Heath Interview Series at the University of Minnesota (MPC, 2016). We have noted that these data have been referenced as the “gold standard” for the study of mortality rates (Cowper et al., 2002). We select respondents from the 1986 to 1989 surveys who were at least 85 years old at the time of the interview. As a part of the NHIS, the National Center for Health Statistics matched participants who were at least 18 years old at the time of the interview to death records, primarily to the National Death Index but also to the Social Security and Medicaid and Medicare records. See NCHS (2013) for a description. The NCHS matched respondents to their death records through 2011.
Our sample is comprised of 3,736 individuals. As expected from this sample of older individuals, it is mostly female, nearly 68 percent. There are 80 Hispanics and 420 blacks. We begin our analysis by estimating the nonparametric probability of death by age group for non-Hispanic whites and blacks. Because there are only 80 Hispanics, we do not attempt to estimate the probability of death for this group. In the 1980s the public use files of the NHIS top code age at 99 so we drop the 44 cases with a reported age of 99 in 1986–1989. This results in an analysis sample of 409 blacks and 3,203 non-Hispanic whites.
In Figure 3, we report surprising results. The mortality hazard rates of both blacks and non-Hispanic whites increase until the age of 100, but then experience a decline from ages 101 to 105 (the oldest age we analyze). By way of comparison, we plot the probability of death by age from the 2013 Social Security Life Tables for Females. Because 30 percent of our sample is male and this group is from older cohorts, we expect the SSA estimates to be a lower bound for our estimates, but they diverge after about age 94. Moreover, our estimated age profiles, which feature clear mortality deceleration, look suspiciously like our simulations of the Methuselah effect (Figure 1).
Figure 3. Nonparametric estimated hazard curves from NHIS data.
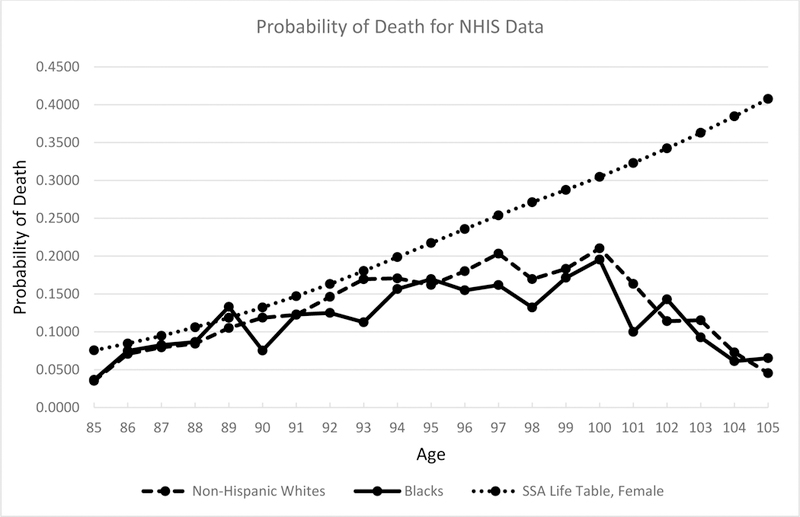
Note: The solid black lines indicate blacks; dashed black lines indicate non-Hispanic whites; and the dotted black lines indicate the SSA Life Table estimates.
To ascertain whether the type of measurement error we document in the NLS Old Men cohort also afflicts the NHIS study, we pursue a new strategy based on the “extinct generation” argument (Kannisto, 1994), using the full sample of 3,736 individuals. Because our sample has a minimum age of 85 in 1989, by 2011 the minimum-aged individual in our sample is 106. Almost everyone in these cohorts should be deceased. To estimate the number of people who should likely have survived through year 2011, we calculate the expected number of survivors from the 2013 Social Security Life Tables for Females. We expect 5.3 non-Hispanic whites to survive, 0.69 blacks to survive, and 0.13 non-black Hispanics to survive (see Table 4). These estimates are optimistic for two reasons. First, 30 percent of our sample is male, and males have higher mortality. Second, the 2013 Life Tables use data from younger cohorts and there has been a secular decline in mortality.
Table 4.
Estimated probability of surviving 21 years after Health Interview Survey for those aged 85 and older, 1986 to 1989 surveys
| Black | Non-black Hispanic |
Non-Hispanic white |
|
|---|---|---|---|
| Fraction assumed alive (N) | 0.1071 (45) |
0.1875 (15) |
0.0667 (216) |
| Fraction confirmed deceased (N) | 0.8929 (375) |
0.8125 (65) |
0.9333 (3,020) |
| Total Sample Size | 420 | 80 | 3,236 |
| Expected number alive from SSA Life Tables | 0.69 | 0.13 | 5.3 |
| P-value for test of equality with non-Hispanic whites | 0.003 | 0.000 | |
Source: Authors’ calculations from Blewett et al., Minnesota Population Center and State Health Access Data Assistance Center, Integrated Health Interview Series: Version 6.12. Minneapolis: University of Minnesota, 2015, and SSA 2013 Life Tables. Test for equality are from Fisher’s exact test, one tailed.
We present results in Table 4. Rather than the 5.3 whites we expect from the Life Tables, we have 216 non-Hispanic whites. Similarly, for blacks we have 45 respondents, rather than the estimated 0.69. Finally, for non-black Hispanics, we have 15 “survivors” rather than the expected 0.13. Clearly, many individuals died but had unreported deaths. Importantly, the rates of this Methuselah effect vary by race/ethnicity. Among non-Hispanic whites the apparent “survivor rate” to age 106 is 6.7 percent; among blacks it is 10.7 percent; and among non-black Hispanics 18.8 percent survive.
Estimating Parametric Models of Mortality in the Presence of Matching Error
An Econometric Strategy
As our theory and simulations show, accounting for matching error is essential to the accurate estimation of the hazard rate of mortality at older ages. We have also seen that in the NLS-OM and NHIS-NDI data matches, these errors are consequential. We proceed with a simple empirical model designed to allow for the type of matching error we have described. Here we do not strive to find the best model of matching error; rather our intent is to demonstrate that even simple models of matching error can profoundly affect estimated old-age mortality profiles. Our model provides insight and demonstrates a potential empirical way forward.
Our basic approach, which estimates the age specific hazard rate using discrete time methods, has a long track record in demography (Allison, 1982). Allison suggests reformatting the data so that individuals have an observation for each time period in which they are at risk, and then parameterizing the hazard as a logistic model. As Allison discusses, and demonstrates empirically, this model is not the exact equivalent of a proportional hazard model, but in practice the difference between the two models is likely to be trivial, and the logistic model converges to the proportional hazard model as the time interval becomes small.
Suppose we have a sample of n individuals, who enter the sample at age and are last observed at age . Some individuals exit due to death, in which case a death indicator variable Di is set to one. Others survive when last observed in the sample, in which case Di = 0. In the absence of missing death records, the likelihood takes the familiar form,
| (13) |
where ha is the hazard rate.
Our innovation is to modify the likelihood function to account for missing death record matches, i.e., Methuselah cases. We work with the case in which the probability of missing a death is constant across ages; generalizations to more complex cases are possible. Suppose the probability of missing a death is α. In this case “observed survivors” are a mixture of “true survivors” and Methuselah cases. Similarly, “observed deaths” encompass only a fraction of “true deaths.”
We begin by calculating the probability that an observed survivor is a Methuselah case. First, let
| (14) |
be the probability of being a true survivor. Second, note that the expected value of being a Methuselah case is just α times the probability that an individual has actually died,
| (15) |
Then the probability of being an observed survivor is given by the sum of (14) and (15),
| (16) |
Next, we expect to observe (1 – α) of all deaths; the probability of being an observed death is
| (17) |
With all this in mind, we substitute (14) into (16) and (17), and use these in our likelihood function, which gives
| (18) |
When α = 0, this expression of course simplifies to the standard likelihood function (13).
To implement our estimator, we use Allison’s (1982) familiar logistic form, setting ha to be a function of such covariates as age, race, and (where applicable) Hispanic ethnicity.
There are two ways to estimate our model. First, we can pick parameters to minimize the logarithm of the likelihood function (18). Second, a simpler alternative is possible if age is large enough for all observations. In this latter case, every apparent survivor is a Methuselah case. Thus we can simply remove these records, and then set α = 0 for the remaining records, i.e., simply estimate a logistic regression on records that have a recorded death. This is a variant of the “extinct generation estimator” first used, according to Preston, Heuveline, and Guillot (2001), by Vincent (1951). An extinct generation approach has appears in a number of subsequent students, including, e.g., Gavrilov and Gavrilova (2011).
Results
We first implement our econometric strategy with men in the NLS-OM cohort (who were aged 52 to 59 in 1966). We estimate the model for non-Hispanic white men, because this is the largest of our demographic groups. We use the SSA12 match, because that version of the data has the most acute problem with Methuselah error, and thus it presents us with the most difficult inference problem.7 As reported in Table 2, Methuselah error is on the order of 11% for the non-Hispanic white men in the sample. We estimate model (18), using a baseline hazard that is quadratic in age. As a technical matter, when setting up the maximization routine, we implement a standard strategy that insures that the matching error rate is between 0 and 1.8
In the public release of the data, all observed deaths are recorded, but the age of death is top-coded at 90 (i.e., the age of death is provided only among those dying at age 89 or younger). By 2012, individuals in the cohort are aged 98 to 105, at which age nearly all men have likely died, so it is reasonable to also implement our extinct generation estimation procedure.
Using the measurement error (ME) model (18), we estimate α to be 0.105. This is very close to the error that we calculated directly, as reported in Table 2. The clearest way to illustrate the hazard estimates is using plots. Figure 4 plots hazard curves for the ME model and the extinct generation model, and also for the naïve logit model, which makes no correction for Methuselah error. As expected, the ME model and extinct generation model give very similar inferences, and estimated mortality is substantially higher once we correct for Methuselah error. It is notable that the extinct generation approach yields estimates that are more precise than with the ME model; this is sensible since that model makes assumptions that are more restrictive.9
Figure 4. Plots of the estimated hazard curves for three models, white men in the NLS-OM SSA Match.
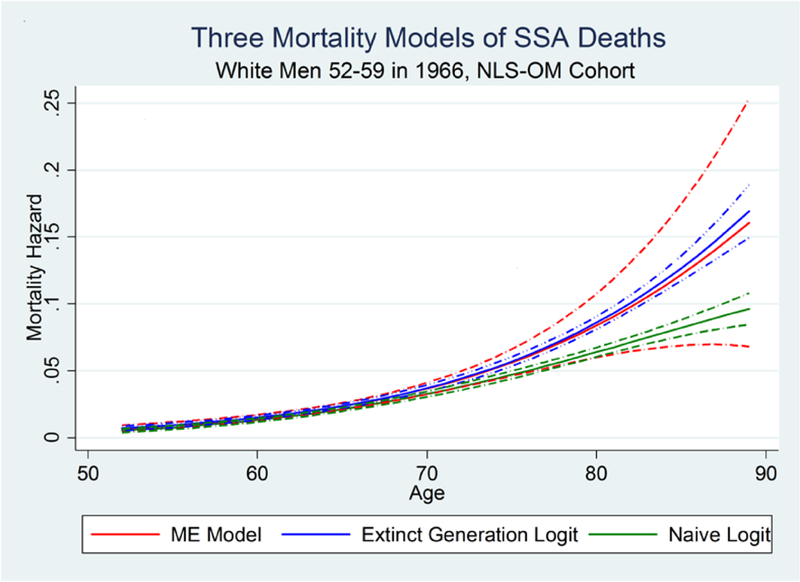
Note: The dashed-dot lines represent 95% confidence intervals.
We next apply our empirical methods to the NHIS-NDI data. These data have a number of advantages in comparison to the NLS-OM data. First, the dataset is much larger than the NLS-OM dataset, so we can proceed with a model that estimates mortality separately for non-Hispanic white, black, and Hispanic samples.10 More importantly, we can evaluate mortality post age 90 because the data are not top-coded. Finally, this exercise is important given that these data are often used to estimate mortality models.
To maintain comparison with the NLS-OM, we focus on men in birth cohorts 1907 through 1914 who appear in the 1986–1999 NHIS. These are men who were aged 72 to 92 in these years of the NHIS. Our hazard estimation now begins at age 72, the youngest age we observe the 1907 to 1914 cohort in the NHIS, and continues through age 105, the oldest potential age in 2012, which is the last year available to us in the NHIS data. We estimate a logit model with a baseline hazard that is quadratic in age and fully interacted with race/ethnicity indicator variables.
We report results in Table 5. We estimate non-negligible Methuselah error rates for all groups. It is lowest for non-Hispanic whites, higher for blacks, and higher yet for Hispanics. Using estimates of Methuselah error rates, along with the fraction of the sample for which a death was not observed in the NHIS data match, we can calculate the fraction of deaths that were not observed because of matching error. For whites, the fraction of observations for which a death was not recorded in the 2012 match is 0.0488; because our estimated Methuselah error rate is 0.037, this suggests that 76% (0.037/0.0488) of observed surviving whites are Methuselah cases. For blacks the fraction of individuals for whom a death was not recorded is 0.0792, suggesting that 90% of observed surviving blacks are Methuselah cases. Finally, among Hispanics the fraction of individuals for whom a death was not recorded is 0.1192, suggesting that 92% of observed Hispanic survivors are Methuselah cases.
Table 5.
Parameter estimates from the measurement error-corrected hazard model, NHIS data
| Variable in the Hazard Model | |
|---|---|
| Age | 0.121 |
| (0.0110) | |
| Age2 | −0.000408 |
| (0.000380) | |
| Black | 0.334 |
| (0.267) | |
| Black × Age | −0.0242 |
| (0.0392) | |
| Black × Age2 | 0.000673 |
| (0.00140) | |
| Hispanic | 0.0436 |
| (0.450) | |
| Hispanic × Age | −0.0414 |
| (0.0624) | |
| Hispanic × Age2 | 0.00216 |
| (0.00210) | |
| Constant | −3.589 |
| (0.0773) | |
| Estimated Rate of Missing Deaths | |
| Error Rate for White | 0.037 |
| (0.00229) | |
| Error Rate for Black | 0.071 |
| (0.0091) | |
| Error Rate for Hispanic | 0.110 |
| (0.0160) | |
| Observations (N × Years) | 119,007 |
Source: Authors’ calculations, National Health Interview Survey. In this regression the age variable is constructed so that Age = 1 for the youngest age in the data, which is age 72.
We observe that for each racial/ethnic group, the estimated coefficient on age squared is close to zero. There is no evidence of mortality deceleration.
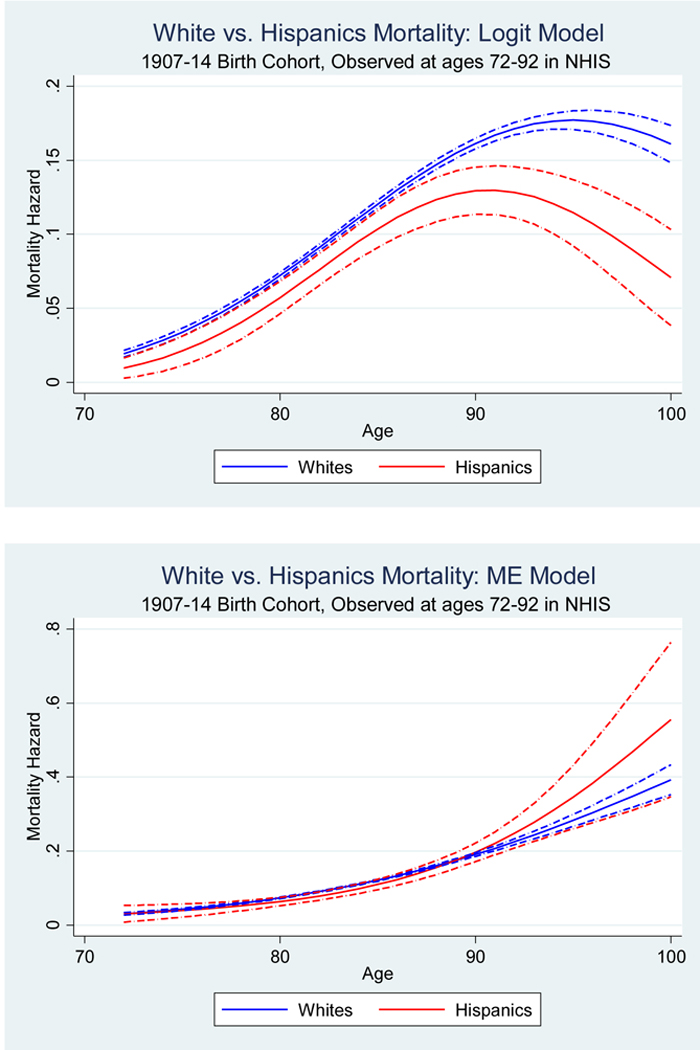
In Figure 5 we plot our estimated hazard curves, and of course we are interested in learning how our inferences differ from the naïve approach. Thus Panel A of Figure 5 displays the hazard rates for blacks vs. non-Hispanic whites—first with the naïve logit model and then with our Matching Error model. In the NHIS cohorts, a naïve model (which does not adjust for matching error) shows a black-white mortality crossover at approximately age 85. A very different pattern appears when we correct for matching error. At no age is the estimated mortality hazard lower for blacks than for whites. In Panel B the naïve analysis shows Hispanic men having a mortality advantage, especially at older ages. However, no statistically significant differences between Hispanic and non-Hispanic white mortality rates are found once we correct for differential measurement error. It appears that in these data both the black-white crossover and the Hispanic paradox are due entirely to the Methuselah effect.
Figure 5.
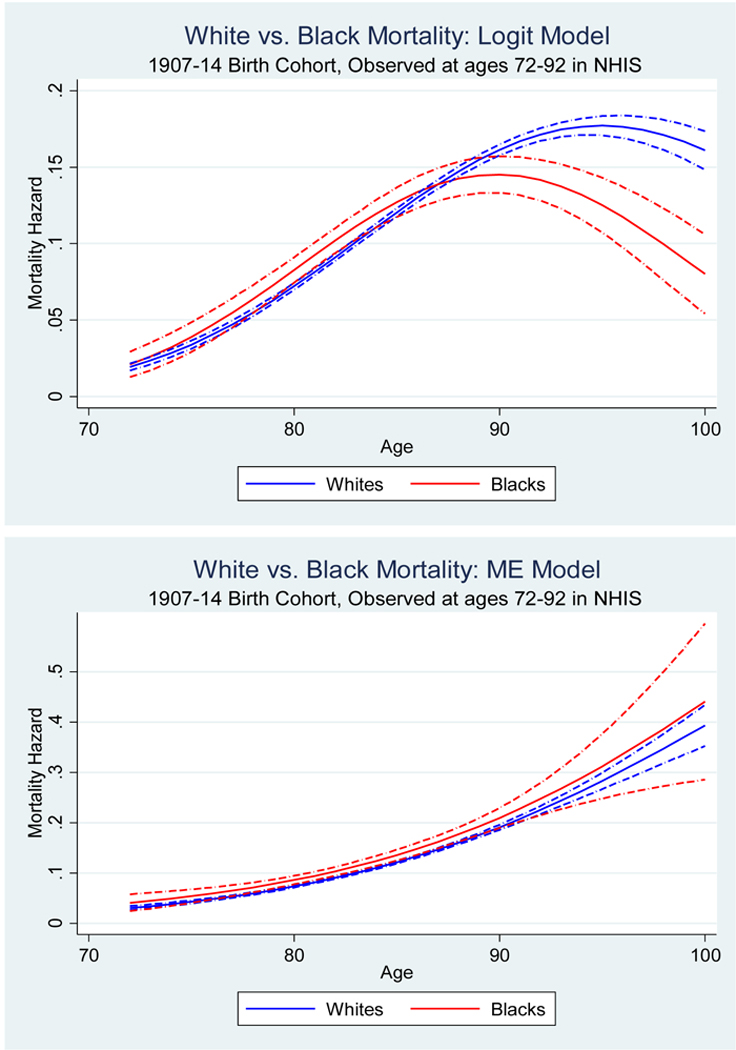
Evidence on the black-white mortality crossover and Hispanic paradox in the naïve logit model and measurement error-corrected model, NHIS-NDI data
Panel A The black-white mortality crossover
Note: The dashed-dot lines represent 95% confidence intervals.
Panel B The Hispanic paradox
Note: The dashed-dot lines represent 95% confidence intervals.
Concluding Remarks
The study of old age mortality holds an important place in demography. Observed statistical patterns have motivated a large literature that explores plausible biological mechanisms that underlie human aging. Among the key issues that have occupied scholarly attention are the following: Do we see mortality rate deceleration in old age? Is there a black-white mortality crossover, with blacks having lower mortality at advanced ages? Is there a paradoxical Hispanic advantage in mortality?
We explore these issues using data from two studies, the NLS-OM and NHIS, both of which have been matched to administrative death records. Our key contribution is a careful analysis of a pernicious form of measurement error—the failure to record some deaths. We show that in both data sources there is a non-negligible amount of such measurement error, and we show that error rates differ by race and ethnicity. Failure to recognize the error, and correct for it, could lead us to believe in mortality rate deceleration, the black-white mortality crossover, and the Hispanic paradox. Correction for the error reverses all of these inferences.
We recognize that other studies, especially those on animal populations, do not rely on data matching, and there is evidence of mortality deceleration in non-human populations. Having said that, our analysis leads us to be skeptical of evidence about deceleration in the mortality of humans.11 Similarly, black-white differences in match rates seem to be a natural feature of data that demographers often work with, and we have seen that a logical consequence of this error structure is to generate a spurious black-white mortality crossover. Similar logic pertains to the Hispanic paradox.
While we have made some progress in addressing the Methuselah effect, there are substantial issues we have not resolved. Our model is very simple; we assume that the only systematic factor affecting error is racial/ethnic group. It is likely that improvements in the Vital Statistics system mean that matching error varies also by birth cohort. It is also plausible that matching error may be a function of age at death, because data matching for deaths at unusual ages may be easier than matches at common ages. Our analytical structure could be adapted to account for these features.
In addition, we have not dealt with an alternative source of relevant measurement error—the misreporting of age. In the NLS-OM and the NHIS-NDI, age misreporting is probably not as common as in other data, because age was collected from individuals themselves, typically many years before death (Eberstein et al., 2008; Lynch et al., 2003). Nonetheless, some failure-to match may be due to age misreporting in the survey or death records. If such errors depend only on race/ethnicity, the extinct generation variant of our model deals properly with the problem (because the approach simply drops these cases), but more complex cases are possible. If the age-misreporting process can be systematically modeled by demographers, perhaps methods we develop here can be adapted to reduce biases in a more general setting.
A great deal more work lies ahead for demographers interested in the accurate assessment of mortality at older ages.
Acknowledgments
We thank the editors, three anonymous reviewers, David Card, Amitabh Chandra, James Saxon, Douglas Staiger, Lydia Veliko, and seminar participants at UC Berkeley, Indiana University/Purdue University of Indianapolis, New York University, and Washington University for helpful comments. All errors are our own.
Footnotes
This law was first quantified in 1939, when Greenwood and Irwin (1939) found that the one-year probability of death at advanced age asymptotically approaches a limit of 0.44 for women and 0.54 for men. Such a law suggests that there may be no fixed upper limit to human longevity, and thus no fixed maximal human lifespan (Thatcher et al., 1998; Gavrilov and Gavrilova, 2006).
One could imagine an error process operating predominantly in the other direction, if deaths are recorded that do not occur. This could be called the “Twain effect” (per Mark Twain’s suggestion that “the report of my death was an exaggeration”). The Twain effect would cause underestimation of the denominator in subsequent years. Here again, consequent error would progressively worsen as the cohort ages. Below we argue that this effect is not important in our application.
Preston, Elo, and Stewart (1999) show that when age is recorded in single years earlier in life (instead of 5-year intervals) this virtually eliminates biases in ASMR from age misreporting.
Yet another advantage of this approach is that longitudinal surveys often collect data on family and other contextual variables, which then allows researchers to assess relationships between early-life factors and subsequent mortality.
Readers may wonder why the Vital Statistics match used data through 2008 while the SSA Death Index is through 2012. While we informally refer to the Census Bureau as matching on the respondent’s Social Security number, this is true only in an indirect sense. The Bureau matches on a Personal Identification Key (PIK), which is a number that has a one-to-one match with the respondent’s Social Security number, to protect the confidentiality of respondents. All files used for matching must, therefore, contain this unique PIK for matching, a process known as “being PIKed.” At the time of our match, the most recent PIKed file from Vital Statistics was through 2008, while the files from SSA were through 2012.
For instance, in collecting data for the current NLS cohorts, the NLSY 1979 and NLSY 1997 cohorts, NORC requires interviewers’ proxies to provide either an obituary or a death certificate before recording a death.
We also estimated the measurement model with the VS08 match, and it performed equally well with those data.
Programs are available from the authors. Our procedure for limiting the measurement error to be between 0 and 1 entails the use of a logistic error model, specifying error to be , then allowing γ to differ for whites and blacks.
Specifically, the extinct generation approach stipulates that all missing deaths are Methuselah error, while the ME model estimates the rate of Methuselah error.
The number of person years in our NHIS-NDI analysis is 119,007.
Biological models that allow for mortality deceleration in drosophila and other non-primates may be quite different than the human biology of aging. Older theories, such as those that posit limits to cell replication should perhaps be reconsidered.
Contributor Information
Dan A. Black, University of Chicago, IZA, and NORC
Seth G. Sanders, Duke University and NORC
Lowell J. Taylor, Carnegie Mellon University, IZA, NBER and NORC
Yu-Chieh Hsu, University of Chicago and NORC.
Lynne Steuerle Schofield, Swarthmore College.
REFERENCES
- Abraido-Lanza AF, Dohrenwend BP, Ng-Mak DS, & Turner JB (1999). The Latino mortality paradox: a test of the “salmon bias” and healthy migrant hypotheses. American Journal of Public Health, 89 (10), 1543–1548. [DOI] [PMC free article] [PubMed] [Google Scholar]
- Allison PD (1982). Discrete time methods for the analysis of event histories. Sociological Methodology, 13, 61–98. [Google Scholar]
- Arias E (2006). United States life tables, 2003. National vital statistics reports, 54 (14), 1–40. [PubMed] [Google Scholar]
- Berkman L, Singer B, & Manton K (1989). Black/white differences in health status and mortality among the elderly. Demography, 26(4), 661–678. [PubMed] [Google Scholar]
- Blewett Lynn A., Rivera Drew Julia A., Griffin Risa, King Miram L., and Williams Kari. IPUMS HealthSurvey: National Health Interview Survey, Version 6.2. Minneapolis: University of Minnesota, 2016. 10.18128/D070.V6.2 [DOI] [Google Scholar]
- Coale AJ, & Kisker EE (1986). Mortality crossovers: reality or bad data? Population Studies, 40(3), 389–401. [Google Scholar]
- Cowper DC, Kubal JD, Maynard C, & Hynes DM (2002). A primer and comparative review of major U.S. mortality databases. Annals of Epidemiology, 12, 462–468. [DOI] [PubMed] [Google Scholar]
- Department of Commerce, Bureau of the Census. (1921). United States Life Tables: 1890, 1901, 1910, and 1901–1910. Washington, DC: U.S. Government Printing Office. [Google Scholar]
- Dupre ME, Franzese AT, & Parrado EA (2006). Religious attendance and mortality: Implications for the black-white mortality crossover. Demography, 43(1), 141–164. [DOI] [PubMed] [Google Scholar]
- Eberstein IW, Nam CB, & Heyman KM (2008). Causes of death and mortality crossovers by race. Biodemography and Social Biology, 54(2), 214–228. [DOI] [PubMed] [Google Scholar]
- Gavrilov LA, & Gavrilova NS (2006). Reliability theory of aging and longevity In Masoro EJ & Austad SN (Eds.), Handbook of the Biology of Aging (pp. 3–42). Burlington, MA: Academic Press. [Google Scholar]
- Gavrilov LA, & Gavrilova NS (2011). Mortality measurement at advanced ages: a study of the Social Security Administration Death Master File. North American Actuarial Journal, 15 (3), 432–447. [DOI] [PMC free article] [PubMed] [Google Scholar]
- Gompertz B (1825). On the nature of the function expressive of the law of human mortality and on a new mode determining the value of life contingencies. Philosophical Transactions of the Royal Society A, 115, 513–583. [DOI] [PMC free article] [PubMed] [Google Scholar]
- Greenwood M, & Irwin JO (1939). The biostatics of senility. Human Biology, 11, 1–23. [Google Scholar]
- Hsu Y-C (2012). Three essays on measurement and evaluation of mortality (Unpublished Ph.D. dissertation). Heinz College, Carnegie Mellon University, Pittsburgh, PA. [Google Scholar]
- Johnson N (2000). The racial crossover in comorbidity, disability, and mortality. Demography, 37, 267–283. [PubMed] [Google Scholar]
- Kannisto V (1994). Development of oldest old mortality, 1950–1990: Evidence from 28 developed countries. Odense, Denmark: Odense University Press. [Google Scholar]
- Kestenbaum B (1992). A description of the extreme aged population based on improved Medicare enrollment data. Demography, 29(4), 565–580. [PubMed] [Google Scholar]
- Lariscy JT (2011). Differential record linkage by Hispanic ethnicity and age in linked mortality studies: implications for the epidemiologic paradox. Journal of Aging and Health, 23(8), 1263–1284. [DOI] [PMC free article] [PubMed] [Google Scholar]
- Lynch SM, Brown JS, & Harmsen KG (2003). Black-white differences in mortalitycompression and deceleration and the mortality crossover reconsidered. Research on Aging, 25(5), 456–483. [Google Scholar]
- Manton KG, Poss SS, & Wing S (1979). The black/white mortality crossover: Investigation from the perspective of the components of aging. The Gerontologist, 19(3), 291–300. [DOI] [PubMed] [Google Scholar]
- Manton KG, & Stallard E (1981). Methods for evaluating the heterogeneity of agingprocesses in human populations using vital statistics data: Explaining the black/white mortality crossover by a model of mortality selection. Human Biology, 53, 47–67. [PubMed] [Google Scholar]
- Manton KG, & Stallard E (1984). Recent trends in mortality analysis. New York, NY:Academic Press. [Google Scholar]
- Manton KG, Stallard E, & Vaupel JW (1984). Methods for comparing the mortality experience of heterogeneous populations. Demography, 18, 389–410. [PubMed] [Google Scholar]
- Markides KS, & Coreil J (1986). The health of Hispanics in the Southwestern United States: An epidemiological paradox. Public Health Reports, 101, 253–265. [PMC free article] [PubMed] [Google Scholar]
- Masters RK (2012). Uncrossing the US black-white mortality crossover: The role of cohort forces in life course mortality risk. Demography, 49(3), 773–796. [DOI] [PMC free article] [PubMed] [Google Scholar]
- Minnesota Population Center and State Health Access Data Assistance Center.(2016). Integrated Health Interview Series: Version 6.21. Minneapolis, MN: University of Minnesota; Available from http://www.ihis.us [Google Scholar]
- Myers RJ (1978). An investigation of the age of an alleged centenarian. Demography, 15(2), 235–236. [PubMed] [Google Scholar]
- Nam C (1995). Another look at mortality crossovers. Social Biology, 42, 133–142. [DOI] [PubMed] [Google Scholar]
- National Center for Health Statistics. (2013). NCHS 2011 Linked Mortality Files Matching Methodology. Hyattsville, MD: Office of Analysis and Epidemiology. [Google Scholar]
- Oeppen J, & Vaupel JW (2002). Broken limits to life expectancy. Science, 296 (5570), 1029–1031. [DOI] [PubMed] [Google Scholar]
- Parnell AM, & Owens CR (1999). Evaluation of U.S. mortality patterns at old ages using the Medicare enrollment data base. Demographic Research, 1, doi: 10.4054/DemRes.1999.1.2 [DOI] [PubMed] [Google Scholar]
- Patel KV, Eschbach K, Ray LA, & Kyriakos S (2004). Evaluation of mortality data for older Mexican Americans: Implications for the Hispanic paradox. American Journal of Epidemiology, 159(7), 707–715. [DOI] [PubMed] [Google Scholar]
- Preston SH, Elo IT, Rosenwaike I, & Hill M (1996). African-American mortality at older ages: Results of a matching study. Demography, 33(2), 193–209. [PubMed] [Google Scholar]
- Preston SH, Elo IT, & Stewart Q (1999). Effects of age misreporting on mortality estimates at older ages. Population Studies, 53(2), 165–177. [Google Scholar]
- Preston SH, Heuveline P, Guillot M (2001). Demography: Measuring and Modeling Population Processes. Malden, MA: Blackwell Publishers. [Google Scholar]
- Preston SH, Elo IT, Hill ME, & Rosenwaike I (2003). The demography of African Americans 1930–1990. Dordrecht, Netherlands: Springer Netherlands. [Google Scholar]
- Preston SH, & Elo IT (2006). Black mortality at very old ages in official US life tables: A skeptical appraisal. Population and Development Review, 32(3), 557–566. [Google Scholar]
- Rosenberg HM, Maurer JD, Sorlie PD, Johnson NJ, MacDorman MF, Hoyert DL, … Scott C (1999). Quality of death rates by race and Hispanic origin: a summary of current research, 1999. Vital and Health Statistics, Series 2,128, 1–13. [PubMed] [Google Scholar]
- Shai D, & Rosenwaike I (1987). Mortality among Hispanics in metropolitan Chicago: an examination based on vital statistics data. Journal of Chronic Disease, 40, 445–51. [DOI] [PubMed] [Google Scholar]
- Swallen K, & Guend A (2003). Data quality and adjusted Hispanic mortality in the United States, 1989–1991. Ethnicity & Disease, 13, 126–33. [PubMed] [Google Scholar]
- Thatcher AR, Kannisto V, & Vaupel JW (1998). The Force of Mortality at Ages 80 to 120. Odense, Denmark: Odense University Press. [Google Scholar]
- Vaupel JW, Manton KG, & Stallard E (1979). The impact of heterogeneity in individual frailty on the dynamics of mortality. Demography, 16(3), 439–454. [PubMed] [Google Scholar]
- Vaupel JW, & Yashin A (1985). Heterogeneity’s ruses: Some surprising effects of selection on population dynamics. The American Statistician, 39, 176–185. [PubMed] [Google Scholar]
- Vincent P (1951). La mortalité des Vieillards. Population, 6, 181–204. [Google Scholar]
- Wrigley-Field E (2014). Mortality deceleration and mortality selection: Three unexpected implications of a simple model. Demography, 51, 51–71. [DOI] [PMC free article] [PubMed] [Google Scholar]