

Abstract
To make decisions about sensory stimuli, the brain must weigh the evidence that supports or opposes the alternative interpretations. In the present study, we evaluated the hypothesis that a quantity reflecting the weight of sensory evidence is represented in brain circuits responsible for the behavioral response used to indicate the decision. We trained monkeys to decide the direction of random-dot motion and to indicate their decision with an eye movement to one of two choice targets. We interrupted decision formation with electrical microstimulation of the frontal eye field, causing an evoked eye movement that is influenced by ongoing oculomotor activity. For the “pro-saccade” version of the task, in which the correct target was at a known location in the direction of motion, the microstimulus-evoked eye movement reflected both the impending pro-saccadic response and the temporal accumulation of motion information used to select that response. In contrast, for the “colored-target” task, in which the correct target was of a particular color but at an unpredictable location, little ongoing oculomotor activity was evident. The results suggest that formation of the decision and formation of the behavioral response share a common level of neural organization, but only when the decision is associated with a specific, predictable movement.
Keywords: electrical microstimulation, saccade, visual motion, perceptual decision, sensory-motor association, cortex
Introduction
Higher brain function provides for flexible associations between sensory information and behavior. Central to this flexibility is the ability to make decisions about the presence or identity of a stimulus to guide the appropriate action. Recent studies have demonstrated neural correlates of perceptual decisions in association and motor cortices, which contain neurons that appear to represent the transformation of sensory information into the preparation for action (Glimcher, 2001; Gold and Shadlen, 2001; Romo and Salinas, 2001;Schall, 2001). In the present study, we examined how the representations of these transformations depend on the particular sensory-motor association.
For many perceptual tasks, decisions about sensory stimuli instruct particular courses of action, as when detection of a stimulus is indicated with an eye or hand movement to the location of the stimulus. For a variety of these sensory-motor associations, neurons that respond selectively in anticipation of a particular movement also represent sensory information that encodes the instruction (Taira et al., 1990; Boussaoud and Wise, 1993; di Pellegrino and Wise, 1993; Chen and Wise, 1995a,1995b; Kalaska and Crammond, 1995; Murata et al., 1996,1997; Rizzolatti et al., 1996; Shen and Alexander, 1997; Zhang et al., 1997; Fadiga et al., 2000). For example, neurons in various oculomotor areas, including the lateral intraparietal area (LIP), the frontal eye field (FEF), and the superior colliculus (SC), signal both the preparation of a particular eye movement and the visual cue that instructs the movement (Gnadt et al., 1991; Glimcher and Sparks, 1992;Schall and Bichot, 1998; Colby and Goldberg, 1999). In monkeys trained to decide the direction of random-dot motion and to indicate their decision with an eye movement in the perceived direction (see Fig.1A), these neurons represent the transformation of motion information into a decision to make the appropriate eye-movement response (Horwitz and Newsome, 1999; Kim and Shadlen, 1999; Shadlen and Newsome, 2001; Roitman and Shadlen, 2002).
Fig. 1.
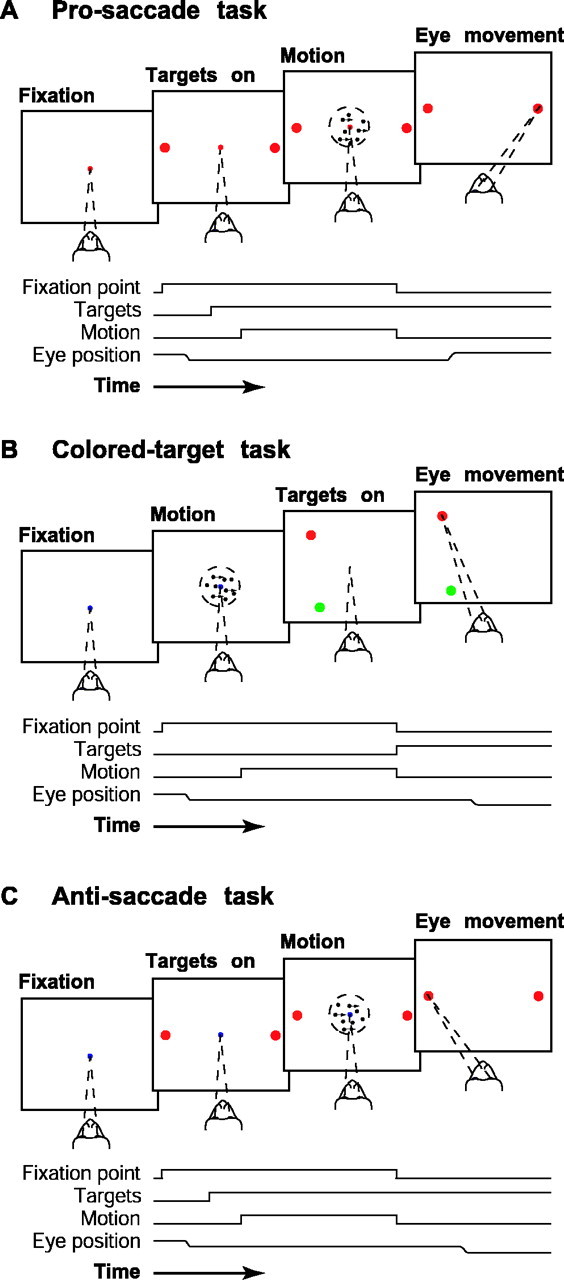
Temporal sequence of events for the direction-discrimination tasks. A, Pro-saccade task. After the monkey fixated, two red choice targets appeared 8° from the fixation point and along the axis of motion. The motion stimulus appeared after a 100–600 msec delay and remained on for 100–1500 msec, until fixation-point offset. The monkey then indicated its direction decision with an eye movement to one of the two targets and was rewarded for choosing the target in the direction of motion.B, Colored-target task. After the monkey fixated, the motion stimulus appeared after 100–600 msec and remained on for 100–1500 msec, until fixation-point offset. The two targets, one redand one green, then appeared at random locations on an imaginary circle with a radius of 8°, centered on the fixation point. The monkey indicated its direction decision with an eye movement to one of the two targets and was rewarded if motion was to the left and it chose the green target or if motion was to the right and it chose the red target. C, Anti-saccade task: like the pro-saccade task, except that the monkey was rewarded for choosing the target opposite the direction of motion.
We recently demonstrated the close link between formation of the decision and formation of the behavioral response for the direction-discrimination task (Gold and Shadlen, 2000). We interrupted motion viewing with electrical microstimulation of the FEF, resulting in evoked eye movements that deviated in the direction of the subsequently selected target. The oculomotor signals responsible for these deviations reflected the accumulated motion information that informed the monkey's direction decision.
In the present study, we used the same microstimulation technique to assess how this decision-related oculomotor activity depends on the association between the decision and the eye-movement response. We used several tasks, each of which required the monkey to form a direction decision by accumulating motion information over time but had different associations between the decision and the response. We found that the monkey's evolving direction decision was evident in oculomotor commands only when the monkey could anticipate the particular eye movement needed to indicate the decision. The results support the idea that when a decision about a sensory stimulus calls for a specific behavioral response, the decision is formed as a direct transformation of sensory information into the commands that generate the response.
Materials and Methods
We used two adult male rhesus monkeys (Macaca mulatta). All training, surgery, and experimental procedures were in accordance with the National Institutes of Health Guide for the Care and Use of Laboratory Animals and were approved by the University of Washington Animal Care Committee.
Behavioral tasks. The monkeys were trained to discriminate the direction of motion on a one-interval, two-alternative forced-choice task. The display was generated in MATLAB on a Macintosh computer, using the Psychophysics Toolbox extensions (Brainard, 1997; Pelli, 1997) and our own software to draw the motion stimulus. The motion stimulus was a random-dot kinetogram (Britten et al., 1992) contained within a circular aperture 5° in diameter and centered on the fixation point. The dots were white squares, 0.069° per side (two pixels at a screen resolution of 1024 × 768 on a 21 inch monitor positioned 60 cm from the monkey's eyes) and 19.2 cd/m2 in luminance, viewed on a black background. The dots were plotted in three interleaved sets of equal size. Each set was plotted in one of three successive video frames (at 75 Hz frame rate) and shown for just a single frame. Three frames (40 msec) later, a fraction of the dots from that set was plotted at a displacement of 0.2° to promote the perception of motion (at 5° s−1); the remainder of the dots were replotted at random locations. Together, the three sets produced a dot density of 16.7 dots per degree squared per second. The percentage of coherently moving dots (0, 3.2, 6.4, 12.8, 25.6, and 51.2%), viewing duration (100–1500 msec), and direction (two alternatives separated by 180° for a given experiment) were randomly interleaved from trial to trial. The distribution of viewing durations was chosen to approximate a flat hazard function (Luce, 1986): 100 msec plus a random time chosen from an exponential distribution with mean 300 msec. This strategy minimized the monkey's ability to anticipate the end of the trial and thus maximized our ability to “interrupt” motion viewing unexpectedly either with motion offset alone or with motion offset plus electrical microstimulation.
We used three tasks. Each required the monkey to discriminate the direction of random-dot motion and to indicate its direction decision with an eye movement to one of two choice targets. For each task, the monkey received a liquid reward for a correct response (an eye movement to the correct target) and on half the 0% coherence trials. The tasks differed in terms of the association between the direction decision and the correct eye-movement response, as follows.
For the “pro-saccade” task (see Fig. 1A), the monkey was rewarded for making an eye movement to a target at a known location in the direction of motion. First, the monkey fixated a red fixation point located at the center of the visual field. Next, two red choice targets appeared, located 8° from the fixation point and along the axis of motion. After a random delay (100 msec plus a random time chosen from an exponential distribution with mean 150 msec), the motion stimulus appeared. The motion stimulus and the fixation point were extinguished simultaneously, indicating to the monkey to make an eye movement to one of the two targets. The correct target was located in the direction of motion; thus, for rightward motion, the monkey was rewarded for making an eye movement to the target to the right of the motion stimulus. Data from this task have been presented previously (Gold and Shadlen, 2000).
For the “colored-target” task (see Fig. 1B), the monkey was rewarded for making an eye movement to a target of the appropriate color but at an unpredictable location. First, the monkey fixated a blue fixation point located at the center of the visual field. After a random delay, the motion stimulus appeared. Next, the motion stimulus and the fixation point were extinguished, and the two choice targets (one red and one green, both with a luminance of 3.1 cd/m2) were shown simultaneously. The targets were shown at random locations on an imaginary circle with a radius of 8°, centered on the fixation point. The targets were separated by at least 3°. The green target was correct if motion had a leftward component, and the red target was correct if motion had a rightward component (we never used purely vertical motion for this task).
For the “anti-saccade” task (see Fig. 1C), the monkey was rewarded for making an eye movement to a target at a known location opposite to the direction of motion. First, the monkey fixated a blue fixation point located at the center of the visual field. Next, two red choice targets appeared, located 8° from the fixation point and along the axis of motion. After a random delay, the motion stimulus appeared. The motion stimulus and the fixation point were extinguished simultaneously. The correct target was located opposite the direction of motion; thus, for rightward motion, the monkey was rewarded for making an eye movement to the target to the left of the motion stimulus. In some experiments, the choice targets did not appear until offset of the motion stimulus and fixation point.
The three tasks were not interleaved in a single experiment. Instead, we first collected data using the pro-saccade task, which the monkeys had several years of experience performing (Kim and Shadlen, 1999; Gold and Shadlen, 2000). We then trained both monkeys and collected data using the colored-target task. Finally, we trained monkey I and collected data using the anti-saccade task.
Data acquisition. In preparation for electrophysiological measurements, monkeys were implanted with a head-holding device, eye coil, and recording cylinder (Crist Instrument Co., Damascus, MD) suitable for magnetic resonance imaging (MRI). The recording cylinder was positioned above the arcuate sulcus and the posterior third of the principal sulcus (in the right hemisphere for monkey I and the left hemisphere for monkey S). Tungsten microelectrodes (∼1 MΩ impedance at 1 kHz; Fred Haer and Co.) were advanced in sterile guide tubes that extended through a plastic grid (Crist Instrument Co.) to the surface of the dura mater. Electrode tracks were registered with the anatomy using high-resolution MRI images obtained with fiducial markers in the plastic grid (1.5 T scanner, short T1 inversion recovery, using custom “carotid” radio-frequency coils). All tracks were in the portion of the anterior bank of the arcuate sulcus corresponding to the FEF, which was confirmed by physiological criteria (Bruce and Goldberg, 1985).
During an experiment, eye position was monitored using the scleral search-coil technique, sampled at 500 Hz (Robinson, 1963; Judge et al., 1980). The FEF was targeted with a single tungsten microelectrode using stereotaxic and MRI information. FEF sites were selected on the basis of the ability to evoke saccadic eye movements using electrical microstimulation. Microstimulation consisted of a train of 0.25-msec-long, biphasic pulses applied at a rate of 350–450 Hz for 60 msec. A site was selected if saccades with consistent trajectories were evoked using <50 μA of current applied in darkness.
Once a site was selected, the axis of motion discrimination was rotated to be roughly perpendicular to the trajectory of saccades evoked with fixation only. The microstimulation current was then adjusted to evoke saccades reliably during the motion-discrimination task (25–110 μA). In each experiment, a fixed percentage of trials were accompanied by microstimulation (75–80% of trials for experiments using the pro-saccade task; 70–100% of trials for experiments using the anti-saccade task; 50–100% of trials for experiments using the colored-target task); these trials were chosen at random and interleaved with trials without microstimulation. The microstimulation pulses began simultaneously with offset of the fixation point and the motion stimulus. On these trials, the evoked saccade was followed by a second, voluntary saccade to one of the choice targets. Reward was given on the basis of this second, voluntary saccade.
Data analysis. We included for analysis only trials in which the monkey maintained fixation to within a 1.2 × 1.2° square aperture while the fixation point was illuminated. Control trials without microstimulation were included only if the monkey made a single, voluntary eye movement to within 3.5° of one of the two choice targets 40–500 msec after fixation-point offset. Trials with microstimulation were included only if there were two saccades: first an evoked saccade that began 15–90 msec after fixation-point offset (i.e., microstimulation onset) and then a voluntary saccade to one of the two choice targets that began <500 msec after fixation-point offset. For the pro-saccade task, 96.2% of all control trials and 73.0% of all microstimulation trials tested in monkey I and 97.4% of all control trials and 85.0% of all microstimulation trials tested in monkey S met these criteria. For the colored-target task, 99.4% of all control trials and 90.2% of all microstimulation trials tested in monkey I and 99.6% of all control trials and 88.7% of all microstimulation trials tested in monkey S met these criteria. For the anti-saccade task, 96.7% of all control trials and 83.6% of all microstimulation trials tested in monkey I met these criteria. Most (66.0%) of the dropped microstimulation trials were attributable to no evoked saccade.
Eye-position data were aligned such that the eye position at the time of fixation-point offset (the “initial eye position” for measurements of saccade trajectory) was at the origin. Saccade parameters were measured using eye position data that were smoothed with a Gaussian function (5 msec width at half-height). Saccades were defined as eye movements that reached a peak velocity of at least 70°s−1 (this value was chosen to include the shortest microstimulus-evoked saccades, which were ∼1.5° in amplitude; the peak velocity of most saccades was substantially higher: mean ± SD = 327 ± 150°s−1 for all microstimulus-evoked saccades and 451 ± 99°s−1 for all voluntary saccades). The end of a saccade was defined as the eye position at the time that eye velocity returned to nearly zero (< 10°s−1 for at least 10 msec).
The trajectories of electrically evoked saccades were quantified as the vector from the initial eye position to the position measured at the end of the evoked saccade (the “endpoint vector”). The validity of this measurement was assessed in two ways. First, the trajectory defined by the endpoint vector was compared with the trajectory measured early in the saccade (defined as the vector from the initial eye position to the eye position measured 16 msec after saccade onset). Second, the length of the endpoint vector was compared with the path length of the actual saccade. We included for analysis only straight saccades, which were defined as those with a difference between early and late trajectories of ≤20° and a ratio of path length to endpoint vector length of ≤1.25 (91.4% of all evoked saccades met these criteria).
Endpoints of electrically evoked saccades typically drifted over the course of an experiment (often lasting >3 hr) by 2.4 ± 1.8° (mean ± SD; n = 60 ). To control for this drift, we calculated a 150 point, chronological running mean of the endpoints (separately for x and y coordinates) from all trials corresponding to each of the two direction decisions in a given experiment. For each endpoint, we then subtracted the average of the two running means (corresponding to the two direction decisions) centered on that point. This procedure caused the distributions of the x and y positions of all endpoints from a given experiment to be centered at nearly zero.
The deviation of a saccade in the direction of the monkey's decision was quantified as the dot product between the endpoint vector from running-mean-subtracted data and a unit vector along the axis of motion. For the pro- and anti-saccade tasks, the unit vector was in the direction of the target that the monkey ultimately chose. Thus, for the pro-saccade task, a positive deviation measured the magnitude of the component of the endpoint vector that was toward the direction of motion on correct trials and opposite the direction of motion on error trials. For the anti-saccade task, a positive deviation measured the magnitude of the component of the endpoint vector that was opposite the direction of motion on correct trials and toward the direction of motion on error trials. For the colored-target task, the location of the choice targets was not specified before the stimulated eye movement. We therefore adopted the same convention as in the pro-saccade task: the unit vector was in the direction of motion.
We used two strategies to combine data from multiple stimulation sites. First, we simply combined data from all sites without standardization. Thus, each stimulation trial contributed a value to the population average that reflected its absolute magnitude of deviation. Second, we performed a standardization of the deviation vectors before combining data. For each site and for each direction, the average deviation was subtracted, and the residual was expressed in units of SD, using all trials in that experiment. This method discarded information about overall magnitude of deviation but maintained information about the relative effects of motion strength and viewing duration within each session. We used the latter method to control for the possibility that experimental sessions with different average magnitudes of deviation could exert unfair leverage on the population analyses.
To quantify how the magnitude of deviation depended on motion coherence (C) and viewing time (T), we used the following regression equations:
| Equation 1 |
| Equation 2 |
where the ki are coefficients that were fit by weighted least squares, and ε is a random quantity that is assumed to be distributed as Gaussian with variance estimated from the data. To test the significance of the dependence on C (Eq.1), we used an F test (Draper and Smith, 1998) to evaluate the null hypothesis, H0: k1 = 0. To test the significance of the dependence on T (Eq. 2), we evaluated H0: k1 = k2 = 0. Icorrect is 1 or 0 to indicate correct or error trials, respectively, and was used to test the nested hypothesis that the magnitude of the deviation was different for correct versus error trials; we evaluated H0: kc = 0.
Assessment of performance and the underlying decision variable. We measured probability correct (P) as a function of motion strength and viewing duration. We quantified this dependence using several models. For each model, psychometric functions were derived by maximizing the (binomial) likelihood of observing the monkey's choices. We report the maximum likelihood estimate of each parameter along with its uncertainty using standard methods (Meeker and Escobar, 1995).
For each task, we binned the performance data by viewing duration and fit each bin to a coherence-dependent cumulative Weibull distribution function (Quick, 1974):
| Equation 3 |
where λ, α, and β are the fit parameters. The value 0.5 represents chance performance. λ represents the lapse rate, which is the probability of making an incorrect response even for easily discriminable stimuli. Because λ determines asymptotic performance at high coherences and long viewing durations, its value was determined by fitting Equation 3 to performance data from trials with long viewing durations (> 500 msec), and this value was then inserted in the equation to find best fits of α and β to the data binned by viewing duration. α is the threshold, which governs the scaling of stimulus strength (C) on performance and corresponds to the value of C that elicits 82% correct responses when asymptotic performance is perfect (i.e., λ = 0). β governs the shape of the function, affecting mainly its steepness.
We used the best fits of α and β to the time-binned data to analyze how performance depended on viewing time and whether this time dependence was affected by FEF microstimulation. We used a power-law expression to characterize the monotonic decline in threshold as a function of viewing time: α(T) = k0Tk1, where k0 and k1 are fitted parameters. To test whether the dependence on time was significant, we evaluated H0: k1 = 0. Logarithmic transformation of this power-law expression yields a linear function, which we used to test the nested hypothesis that microstimulation affects the dependence on time:
| Equation 4 |
where the ki are fitted parameters, Istim is 1 or 0 to indicate microstimulation or no microstimulation, respectively, and ε is as in Equations 1 and 2. We evaluated H0: k2 = k3 = 0.
The shape parameter, β, did not exhibit a monotonic relationship with time. We therefore used simple polynomial regression to characterize its time dependence and to evaluate the effect of microstimulation:
| Equation 5 |
where the symbols are as in Equation 4. To test the dependence on time, we evaluated H0: k1 = k2 = 0. To test whether microstimulation affects the relationship between β and T, we evaluated H0: k3 = k4 = k5 = 0.
To analyze the relationship between performance and the motion- and time-dependent saccade deviation data (see Model of a decision variable in Results), we did not bin the data by viewing time but rather expressed P as a continuous function of both motion strength and viewing time. We used two models of performance. The first model assumed that the brain accumulates motion information over time and that the monkey forms its direction decision on the basis of the value of this accumulated quantity. By treating the representation of motion information as a random variable, this model is a form of random walk, which is central to many theories of perception (Luce, 1986; Link, 1992; Ratcliff and Rouder, 1998; Gold and Shadlen, 2002). Note that many such models also attempt to explain response times (i.e., the subject determines the viewing duration needed to reach a decision) and thus assume that the decision is reached when the accumulated quantity—called a decision variable—reaches a particular value (or barrier). In contrast, in our experiments we controlled the viewing time, so our model assumed that the decision was made on the basis of whatever value the decision variable had reached at the end of that time.
For this model, the decision variable was computed as the difference between two variable quantities, S1 and S2, which can be thought of as the accumulated, coherence-dependent responses of motion sensors that encode the correct and incorrect directions of motion, respectively:
| Equation 6a |
| Equation 6b |
where C is coherence (the fraction of coherently moving dots, 0 … 1), T is viewing time (in seconds), and R0 is the response (in spikes per second) of either sensor to a 0% coherence motion stimulus. The remaining terms— a, m, and n —are fitted, positive-valued parameters that describe how coherence and time affect S1 and S2 and are described in detail in Results. 〈⋯〉 denotes expectations of S1 and S2, which are treated as normally distributed random variables with variances that scale by a factor φ with their mean values: This variability accounts for errors, which result when S2 > S1. A correct response results when S1 > S2. If S1 and S2 are independent and normally distributed, then the probability, P, of a correct response is:
| Equation 7 |
where μ is the expected value of the accumulated difference, 〈S1 − S2〉 = 〈S1〉 − 〈S2〉, and ς2is the variance, computed as the sum of the individual variances associated with S1 and S2. Note that μ and ς2 depend on both C and T. P was adjusted to take into account the lapse rate, λ, computed using Equation 3.
Our primary rationale for using this accumulation model is that when fit to the behavioral data, it enabled us to derive a decision variable, D, that we could compare to the evoked-saccade data. The value of D depended only on the difference between the opposing pools of sensors described by Equation 6 and was computed for a given motion strength and viewing duration by using the values of the parameters a, m, and n fit to the behavioral data. As with the deviation data, we calculated and plotted D for correct and incorrect choices:
| Equation 8 |
where 〈x‖y〉 indicates the expected value of x given that y is true. D is therefore the expected difference favoring the decision that the monkey actually makes and is always positive for all motion strengths and viewing durations, including the case of 0% coherent motion.
To transform D into units related to the probability of making a particular eye-movement response, we first assumed that D was proportional to the logarithm of the likelihood ratio favoring the choice that the monkey made (Gold and Shadlen, 2001):
| Equation 9 |
Thus, D can be thought of as the amount of evidence supporting the choice that the monkey made. For a two-alternative forced-choice task, we can transform this decision variable into the probability of making that choice (in this case, the correct choice) given the value of D. Using Bayes' rule and assuming equal previous probabilities of making each of the two choices:
| Equation 10 |
which rearranges to:
| Equation 11 |
where γ is a constant.
Equation 11 describes the probability of making a correct choice given a particular value of the decision variable. We fit a time-shifted and scaled version of this quantity to the magnitude of evoked-saccade deviations. That is, we fit the deviation data to a quantity related to the probability of making a particular, correct choice, given the value of D:
| Equation 12 |
where ϕ and γ are the fit parameters and δ is the time shift. ϕ scales the magnitude, which is offset to take into account the fact that P(choice‖D) varies from 0.5 to 1.0. γ is defined in Equation 11. The time shift δ accounts for a short delay after the onset of the motion stimulus, before the growing decision variable affected the developing oculomotor commands; it was computed as the first time at which deviation magnitude depended significantly on motion strength (Eq. 1; p < 0.05 ). Recall that D is a function of motion coherence and viewing time.
The second time-dependent model of performance assumed that the probability of making a correct response improves as a function of time because there are more opportunities to make the appropriate discrimination. This process, which is termed probability summation over time (Watson, 1979), was modeled using a psychometric function that was also based on the Weibull distribution:
| Equation 13 |
where λ and β are the same as in Equation 3, and ρ is a fit parameter that determines the time-dependent threshold, This model predicts that the underlying neural signals do not reflect an accumulation of motion over time but instead reflect either an undecided or a committed state in favor of one of the alternatives. To test this prediction, we analyzed whether the deviation data comprised a mixture of values that correspond to the undecided and fully committed states (see Fig. 15).
Fig. 15.

Possible alternative explanations for the deviation data. A, Performance on the pro-saccade task fit by a model of decision formation based on probability summation over time. Curves are maximum likelihood fits of Equation 13, which models the probability of a correct response as a function of both time and motion coherence. Data (points) are from all trials, without and with FEF microstimulation, in both monkeys and are plotted as a function of viewing time for different motion strengths, as indicated. B, Distributions of deviations of evoked-saccade endpoints from the pro-saccade task. The cyan curverepresents the distribution of deviations from all trials with low motion strengths (0 and 3.2% coherence) and short viewing durations (<170 msec). The blue curve represents the distribution of deviations from all trials with high motion strengths (25.6 and 51.2% coherence) and longer viewing durations (350–460 msec). Thedashed curve represents a hypothetical distribution obtained by drawing random values from the cyan and bluedistributions. Note that this mixture contains only one mode, but it is wider than the distributions shown in color. C, Comparison of the widths of distributions of deviation data from the pro-saccade task with predictions of a mixture model of extreme values. The interquartile range (IQR; i.e., width) is plotted as a function of the amount of deviation. Each point represents deviation data for one condition, defined by motion strength, viewing duration (in bins of 13.3 msec), and correct versus error.Points on the left correspond to weaker motion and shorter viewing durations. Points on theright correspond to stronger motion and longer viewing durations. The solid curve represents the running mean of these values. The dashed curve represents the expected IQR of hypothetical distributions obtained by taking random samples from the distributions at the extremes. D, Model of stereotyped dynamics of saccade preparatory signals fit to the deviation data (Eq.14). Data are separated by motion strength, as indicated in A. Black symbols represent data from 0% coherence trials; the fit to these points lies under the magenta curve. Coh, Coherence; deg, degree.
Finally, we fit the deviation data with an alternative model that did not depend on the underlying decision process. For this model, we assumed that the saccade deviations arise from stereotyped dynamics of oculomotor commands that are simply delayed as a function of motion strength:
| Equation 14 |
where k, τ, and n are fit parameters that describe the temporal dynamics of the saturating exponential function and are independent of motion strength. Only the parameter δcoh, which describes the delay, depended on motion strength. Equations 12 and 14 were both fit to the monotonically increasing part of the deviation data (<350 msec viewing time).
Results
Our central hypothesis was that when the monkey forms a decision about the direction of random-dot motion and indicates its decision with a specific, predictable eye movement, the underlying decision process is reflected in signals associated with the oculomotor response. To test this idea, we evoked eye movements with electrical microstimulation of the FEF while the monkey was forming its decision. We analyzed the trajectories of these evoked eye movements for evidence of ongoing oculomotor activity associated with the generation of the eye-movement response (Gold and Shadlen, 2000).
In the first section, below, we present data from the pro-saccade task, which had a predictable association between the decision and the eye-movement response. We show that performance improved steadily with increasing motion strength and viewing time and that a similar buildup of motion information was evident in neural signals associated with the generation of the eye-movement response. In the second section, we present data from the colored-target task, which did not have a predictable association between the decision and the eye-movement response. We show that performance also improved steadily with increasing motion strength and viewing time, but that no commensurate developing oculomotor commands were evident. We also present data from the anti-saccade task, which confirm our interpretation of the results from the other two tasks: when the decision is associated with a specific eye-movement response, decision formation is evident in the signals that generate the response. In the third section, we develop a computational model to assess more quantitatively the relationship between the motion- and time-dependent oculomotor signals evident in the pro-saccade task and the neural computations responsible for forming the monkey's direction decision.
Pro-saccade task
For the pro-saccade task (Fig. 1A), the monkey indicated its direction decision with an eye movement of a prespecified trajectory in the direction of motion. The two choice targets, which were visible from before the motion stimulus appeared until after the monkey indicated its decision, were located along the axis of motion. The correct target was located in the direction of motion. Thus, for example, a rightward decision was always indicated with a rightward eye movement. This task has been used extensively in other studies (Britten et al., 1992).
Performance on this task depended on both the strength and duration of the motion stimulus (Fig. 2). At low motion strengths and short viewing durations, performance was near chance. As motion strength and viewing duration increased, the percentage of correct responses improved steadily, to ∼100% accuracy at 51.2% motion coherence and viewing durations of more than ∼250 msec (Fig. 2A). We quantified this dependence by fitting behavioral data for different viewing durations to best-fitting cumulative Weibull distribution functions (Fig. 2B) (Quick, 1974). The fits demonstrated a systematic, inverse relationship between discrimination threshold (α in Eq. 3) and viewing duration (Fig. 2C) (Eq. 4; p < 0.01 ). The parameter β in Equation 3, which describes the shape of the psychometric function, had best-fit values of between 0.9 and 1.4 and depended significantly on viewing duration in monkey S (Fig.2D) (Eq. 5; p < 0.01 ) but not in monkey I (p = 0.18). The lapse rate (λ in Eq. 3), determined from long-duration trials, was zero for both monkeys [likelihood ratio (LR) test, H0: λ = 0; p = 1 ].
Fig. 2.

Performance on the pro-saccade task. A, Percentage correct plotted as a function of viewing time. Points are shown at the center of time bins that had the width adjusted to include approximately equal numbers of trials (n ≈ 300 trials per point). Colors represent different motion strengths, as indicated. Data are from 45,511 trials, with and without FEF microstimulation, from both monkeys. B, Percentage correct plotted as a function of motion strength. Points represent a subset of the data presented in A, binned into four groups of viewing duration, as indicated. The solid curves are maximum likelihood fits of the cumulative Weibull function (Eq. 3), computed separately for each curve. The dashed line shows the asymptotic performance (determined from λ in Eq. 3), estimated from long duration trials only. C, Discrimination threshold as a function of viewing time. Symbols and error bars represent the best fit and SEM of the parameter α in Equation 3 to performance data in 80-msec-wide bins of viewing time. To emphasize the inverse relationship between threshold and time, the best fits of Equation 4are shown (lines) for each data set. Circlescorrespond to monkey I; triangles correspond to monkey S.Closed symbols and solid lines correspond to trials without FEF microstimulation; open symbols anddashed lines correspond to trials with FEF microstimulation.D, Slope of the psychometric function (the parameter β in Eq. 3) as a function of viewing time. Symbols and error bars are plotted as in C. Note the logarithmic time scales inC and D. coh, Coherence.
To assess developing oculomotor activity during formation of this coherence- and time-dependent decision, we analyzed the trajectories of eye movements evoked with electrical microstimulation of the FEF. It is important to note that this microstimulation technique allowed us to study the mechanisms responsible for forming the direction decision without substantially disrupting performance. As shown in Figure2C, discrimination thresholds measured on trials with microstimulation were slightly higher than those measured on control trials, but by only 1.6 ± 0.3% coherence in monkey I and 1.4 ± 0.6% coherence in monkey S (Eq. 4; p < 0.01 for each monkey). There was no obvious explanation for this slight decrease in performance (e.g., it was unrelated to the percentage of trials in a given experiment in which microstimulation occurred; weighted least-squares regression; p > 0.05 for each monkey). Moreover, microstimulation affected the slope of the psychometric function in monkey S (Fig. 2D) (Eq. 5; p < 0.01 ) but not in monkey I (p = 0.77), and it did not affect the lapse rate (zero for both monkeys on trials with microstimulation). Together, these observations indicate that FEF microstimulation interfered only slightly with the monkeys' ability to perform the discrimination task.
Figure 3 illustrates the effects of FEF microstimulation on the eye movements in a single experiment (eye-movement data from all experiments are summarized in Table1). Figure 3A–C shows the monkey's eye positions from individual control trials. The eyes remained stationary during motion viewing. After a random viewing duration, the motion stimulus and the fixation point were extinguished simultaneously. The monkey then made a voluntary, saccadic eye movement that brought its gaze to one of the two choice targets, thereby indicating its direction decision.
Fig. 3.

Examples of eye movement traces from correct trials in a single pro-saccade experiment, using various motion strengths and viewing durations. Eye position was sampled in 2 msec intervals. A, Ten trials without microstimulation. Thetwo large circles represent the two targets. The fixation point is at the origin. The dashed line indicates the axis of motion. B, C, Time course of the eye movements corresponding to the trials in A. Data are aligned to fixation-point offset (time = 0). D–F, Ten trials with microstimulation, plotted as in A–C. In A–F, rightward decisions (i.e., rightward eye movements) are indicated withthicker lines than leftward decisions (i.e., leftward eye movements). pos, Position; deg, degree.
Table 1.
Eye movement during the direction-discrimination tasks1-a
| Task1-b | Monkey | Eye drift1-c | Evoked-saccade latency1-d | Pause between saccades1-d | Voluntary-saccade latency1-d | Control latency1-e |
|---|---|---|---|---|---|---|
| PS/C | I | 0.00 (0.02) | 48.2 (10.6) | 82.4 (26.7) | 162.7 (26.1) | 183.7 (27.2) |
| PS/E | I | 0.00 (0.01) | 48.6 (10.4) | 88.1 (28.6) | 168.9 (28.1) | 189.7 (28.3) |
| PS/C | S | 0.00 (0.02) | 44.2 (10.1) | 95.9 (25.5) | 183.8 (25.3) | 189.0 (21.9) |
| PS/E | S | 0.00 (0.01) | 43.9 (10.0) | 101.0 (26.7) | 188.9 (26.5) | 189.2 (21.8) |
| AS/C | I | 0.00 (0.03) | 44.5 (11.4) | 82.0 (30.2) | 160.0 (28.0) | 234.4 (30.4) |
| AS/E | I | 0.00 (0.02) | 45.3 (11.1) | 82.5 (31.7) | 162.1 (28.7) | 242.3 (33.0) |
| CT/C | I | 0.00 (0.01) | 38.6 (9.2) | 164.6 (45.2) | 224.8 (43.5) | 229.8 (33.5) |
| CT/E | I | 0.00 (0.01) | 40.4 (10.0) | 158.6 (50.9) | 220.5 (49.1) | 232.1 (36.1) |
| CT/C | S | 0.00 (0.02) | 48.5 (10.5) | 156.7 (41.4) | 234.4 (40.0) | 218.5 (34.9) |
| CT/E | S | 0.00 (0.05) | 48.6 (10.0) | 157.9 (45.4) | 235.8 (44.2) | 219.2 (37.8) |
All latencies are reported as mean (SD), in milliseconds, with respect to fixation-point offset.
PS, Pro-saccade; AS, anti-saccade; CT, colored-target; /C, all correct trials; /E, all error trials.
Mean (SD) offset in eye position, in degrees, in the direction of dots along the axis of motion, during the final 50 msec of motion viewing.
Measured on trials with FEF microstimulation.
Measured on control trials without microstimulation.
Figure 3D–F shows eye-position data from the same experiment but from trials with microstimulation. The monkey's eyes again remained stationary during motion viewing. After a random viewing duration, the motion stimulus and the fixation point were extinguished, and electrical microstimulation was begun simultaneously. The monkey then made two distinct saccadic eye movements. The first, electrically evoked saccade had a trajectory roughly perpendicular to the axis of motion. The second, voluntary saccade traveled from the endpoint of the evoked saccade to one of the two choice targets, thereby indicating the monkey's direction decision.
By interrupting motion viewing, FEF microstimulation interrupted the period during which the monkey gathered motion information toward a direction decision. We tested whether this evolving decision was reflected in developing oculomotor commands by analyzing the trajectories of the eye movements evoked by the FEF microstimulation. We quantified this trajectory as the vector defined by the change in eye position from the onset of electrical microstimulation to the pause immediately after the first (evoked) saccade (the “endpoint vector” or simply “endpoint”). Subsequent analyses include only straight saccades, for which the endpoint vector was a reliable estimate of saccade trajectory (see Materials and Methods).
The endpoints of eye movements evoked by electrical microstimulation of the FEF during the discrimination task were similar to those evoked with fixation only but tended to deviate in the direction of the subsequently selected target. Figure4A shows the endpoints of the electrically evoked saccades from correct discrimination trials in a single experiment, sorted by the monkey's choice. In nearly all cases, the endpoints were located above the fixation point, similar to those evoked with fixation only (data not shown). However, on trials in which the monkey subsequently chose the left target, the endpoints of the evoked saccades tended to deviate leftward. Conversely, on trials in which the monkey subsequently chose the right target, the endpoints tended to deviate rightward.
Fig. 4.

Effect of target choice on electrically evoked eye movements from the pro-saccade task. A, Endpoints of evoked saccades for all correct trials from the experiment depicted in Figure3. Open and closed symbols represent leftward and rightward decisions, respectively. The magnitude of separation was defined as the distance between the means of the two distributions of endpoints (filled circles, designated with anopen and a closed symbol; r = 4.4°). The dashed line connecting the mean endpoints defines an axis of separation that is nearly parallel to the axis of random-dot motion, indicated by the line between the choice targets (large filled circles). The angle between these two lines gives the direction of separation (θ = 0.28 radians).B, Mean endpoint positions of evoked saccades for all correct discrimination trials from each site tested. Line segments radiating from the origin represent the mean evoked saccade. Circles (monkey I) and triangles (monkey S) show the mean evoked saccades sorted by the direction of the ensuing target choice. Closed symbols indicate the more rightward choice. For each experiment, the dependence of endpoint position on target choice was significant (two-dimensional Kolmogorov–Smirnov test; p < 0.01). C, Polar plot of the magnitude (r) and direction (θ) of saccade endpoint separation, as described in A, for all sites tested in monkey I (circles) and monkey S (triangles).Angles near zero indicate that the endpoints tended to deviate along the axis of motion and in the direction of the subsequently selected target. Values for r and θ were computed from run-mean-subtracted data, as described in Materials and Methods but not shown in A. deg, Degree; rad, radian.
Figure 4, B and C, summarizes the effect of the monkey's direction decision on the endpoints of evoked saccades for all 32 sites tested. Figure 4B shows the average endpoint vectors of saccades evoked on all correct discrimination trials (lines radiating from the center). These average trajectories, which ranged in amplitude from 1.5 to 12.5°, were predicted by the saccades evoked during fixation, when the monkey did not perform the discrimination task. However, averaging the trajectories across all trials belies a systematic deviation as a function of the monkey's direction decision. The pairs of symbols at the end of each radiating line show the mean saccade endpoints sorted by the monkey's decision (the dependence of endpoint position on target choice was significant for each experiment: two-dimensional Kolmogorov–Smirnov test; p < 0.01 ). These endpoints tended to be separated by 1.6 ± 0.2° (mean ± SEM; radii in the polar plot in Fig.4C), along the axis formed by the two targets (angles in the polar plot in Fig. 4C). These results indicate that the trajectory of an electrically evoked saccade had a component determined by the site of electrical microstimulation and a component in the direction of the subsequently selected choice target.
We quantified the magnitude of the component of deviation in the direction of the subsequently selected choice target for both correct and error trials (see Materials and Methods for details). For correct trials, this quantity was positive, on average, indicating a deviation in both the direction of motion and the direction of the monkey's subsequent voluntary saccade (monkey I: mean ± SEM = 0.82 ± 0.01°, n = 12,480 correct trials; monkey S: 0.74 ±0.01°, n = 11,226). Although the value of this quantity varied across stimulation sites (Kruskal–Wallis test; p < 0.01 for both monkeys together or each individually), ranging from 0.39 ± 0.06 to 2.80 ± 0.20° in monkey I and 0.23 ± 0.02 to 1.67 ± 0.03° in monkey S, it indicated a consistent direction of deviation for all 32 sites. For error trials, this quantity was also positive, on average, indicating a deviation opposite the direction of motion but in the direction of the monkey's subsequent voluntary saccade (monkey I: 0.53 ± 0.02°, n = 2,577 error trials; monkey S: 0.62 ± 0.02°, n = 2,556; these values were significantly smaller than those measured on correct trials; t tests; p < 0.01 ). Like the data from correct trials, the value of this quantity varied across stimulation sites ( p < 0.01 for both monkeys together or each individually), ranging from 0.31 ± 0.03 to 1.78 ± 0.10° in monkey I and 0.17 ± 0.05 to 1.32 ± 0.08° in monkey S, but indicated a consistent direction of deviation for all sites. These results indicate that the deviation reflected the impending motor command (which itself reflected the monkey's direction decision) and not simply the direction of the motion stimulus.
This component of the evoked saccade in the direction of the subsequently selected target was not simply a function of the intended eye movement; it also depended on the strength and viewing duration of the motion stimulus. Figure5A shows the endpoints of evoked saccades on trials from a single experiment in which the monkey viewed weak motion for a short time, conditions that make it difficult to reach an accurate direction decision. These evoked saccades deviated only slightly in the direction of the subsequently selected target. Figure 5B shows the endpoints of evoked saccades from the same experiment, but on trials in which the monkey viewed strong motion for a longer time, conditions that make it easy to make an accurate direction decision. These evoked saccades deviated more strongly in the direction of the subsequently selected target.
Fig. 5.

Effect of motion strength and viewing duration on electrically evoked eye movements from the pro-saccade task. A, B, Endpoints of evoked saccades from all correct trials in the experiment depicted in Figure 4A. Open and closed symbols indicate trials in which the monkey subsequently indicated a leftward or rightward decision, respectively. The average endpoint was estimated as a running mean and subtracted from each data point, thereby centering the distribution of points at the origin. The magnitude of deviation in the direction of the subsequently selected target was quantified as the dot product between the endpoint vector (thin arrows) and the unit vector in the direction of the target (thick arrows). Examples are illustrated inred. Zero magnitude is represented by the roughlyvertical lines that pass through the origin. Positive values indicate deviations in the direction of the subsequently selected target. Deviation magnitude was smaller on trials with weak motion and short viewing durations (colored symbols in A; mean ± SEM = 0.5 ± 0.3°) than on trials with strong motion and longer viewing durations (colored symbols inB; 3.2 ± 0.1°). C, Summary of the effect of motion strength on deviation magnitude. Data are sorted by viewing duration, as labeled. Symbols and error bars represent mean and SEM. The effect of motion strength was significant for all but the earliest epoch (Eq. 1; p < 0.01). Data are from correct trials.D, Summary of the effect of viewing duration on deviation magnitude. Data are sorted by motion strength, as labeled. Symbols and error bars represent mean and SEM in 40-msec-wide bins of viewing duration. The effect of viewing duration was significant at each coherence (Eq. 2; p < 0.01). Solid linesrepresent data from correct trials; dashed lines represent data from error trials. E, Data as in D, but standardized with respect to the mean for each experiment (see Materials and Methods for details). For this data set, the effect of motion strength was significant for all but the earliest epoch (Eq. 1;p < 0.01), and the effect of viewing duration was significant at each coherence (Eq. 2; p < 0.01).coh, Coherence; deg, degree.
Figure 5C–E summarizes the effects of motion strength and viewing duration on evoked-saccade trajectory from the population of data from all 32 experiments. For correct trials, the average magnitude of deviation increased steadily as a function of both motion strength (Fig. 5C) and viewing duration (which tended to cause a steady increase in deviation magnitude to a plateau or slight decrease at ∼350–500 msec) (Fig. 5D, E). For error trials, the average magnitude had a similar dependence on viewing duration but was smaller and tended to decrease with increasing coherence (Fig.5D, E). These trends were evident in data combined directly (Fig. 5C, D) and data standardized to account for differences in deviation magnitude measured in different experimental sessions (Fig. 5E). As illustrated by the similarity of these two data sets, the strength and duration of the motion stimulus were the strongest and most consistent factors of the experimental protocol that influenced the deviation data.
Several other factors had slight effects on the deviation data. An increased percentage of microstimulation trials in a given experiment corresponded to larger deviations in both monkeys (weighted linear regression; p < 0.01 ). The amount of overall drift in endpoint position was also positively correlated with the magnitude of deviation in monkey I (p < 0.01) but not monkey S (p = 0.15). The average magnitude of the endpoint vector was positively correlated with deviation magnitude in monkey I (p < 0.01) but negatively correlated in monkey S (p < 0.01). These effects are removed in the standardized data set used to construct Figure 5E.
The results suggest that when a decision about the direction of motion is indicated with an eye movement in the same direction, neural signals associated with the generation of the eye-movement response also reflect a quantity that is a graded function of motion strength and viewing duration. Thus, for this task, there appears to be a close link between formation of the decision and formation of the behavioral response. In the next section, we corroborate this interpretation by measuring evoked-saccade deviations on tasks with different decision-response associations.
Colored-target task
A key point in interpreting the pro-saccade data is that the task explicitly linked the monkey's direction decision with a specific eye-movement response. Our results appear to be a direct consequence of this link: formation of the decision was evident in signals that reflect the development of the eye-movement response (the evoked-saccade deviations). A test of this interpretation would be to unlink the decision and the eye-movement response, which in principle should eliminate the decision-related oculomotor activity. We performed this test by requiring the monkeys to make the same decision about the direction of random-dot motion as the pro-saccade task but to indicate their decision with an eye movement to a target of a certain color: green for leftward motion, red for rightward motion (Fig.1B). Importantly, the targets were not visible until after the motion stimulus was extinguished, and they appeared at random locations. Thus, during motion viewing and decision formation, the monkey could not prepare an eye-movement response to a particular location.
Performance on the colored-target task improved as a function of motion strength and viewing duration (Fig. 6). At low motion strengths and short viewing durations, performance was near chance. As motion strength and viewing duration increased, performance improved steadily, to ∼90% accuracy at 51.2% motion coherence and viewing durations of more than ∼400 msec. This dependence on motion strength and viewing duration was similar to that found on the pro-saccade task. Psychometric threshold was inversely related to viewing time (Fig. 6C) (Eq. 4; p < 0.01 ) and was significantly affected by FEF microstimulation for monkey I (p < 0.01) but not monkey S (p = 0.80). Likewise, the slope of the psychometric function varied significantly (but not monotonically) with viewing time (Fig.6D) (Eq. 5; p < 0.01 ) and was significantly affected by FEF microstimulation in monkey I (p < 0.01) but not monkey S (p = 0.37). Peak performance was lower (i.e., the lapse rate was higher: 9.1 ± 1.0% coherence for monkey I; 7.6 ± 1.0% for monkey S) on the colored-target task, particularly on microstimulation trials (16.2 ± 1.4% coherence for monkey I; 11.5 ± 2.1% for monkey S).
Fig. 6.

Performance on the colored-target task.A, Percentage correct plotted as a function of viewing time. Points are shown at the center of time bins that had the width adjusted to include approximately equal numbers of trials (n ≈ 350 trials per point). Colors represent different motion strengths, as indicated. Data are from 61,057 trials, with and without FEF microstimulation, from both monkeys. B, Percentage correct plotted as a function of motion strength. Pointsrepresent a subset of the data presented in A, binned into four groups of viewing duration, as indicated. The solid curves are maximum likelihood fits of the cumulative Weibull function (Eq. 3), computed separately for each curve. The dashed line shows the asymptotic performance (determined from λ in Eq.3), estimated from long duration trials only. C, Discrimination threshold as a function of viewing time. Symbols and error bars represent the best fit and SEM, respectively, of the parameter α in Eq. 3 to performance data in 80-msec-wide bins of viewing time. To emphasize the inverse relationship between threshold and time, best fits of Equation 4 are shown (lines) for each data set. Circles correspond to monkey I;triangles correspond to monkey S. Closed symbolsand solid lines correspond to trials without FEF microstimulation; open symbols and dashed linescorrespond to trials with FEF microstimulation. D, Slope of the psychometric function (the parameter β in Eq. 3) as a function of viewing time. Symbols and error bars are plotted as in C.Note the logarithmic time scales in C and D. coh, Coherence.
Figure 7 illustrates eye-movement data from a single experiment using the colored-target task (eye-movement data from all experiments are summarized in Table 1). The monkey's eyes remained stationary during motion viewing. On trials without microstimulation, the fixation point and the motion stimulus were extinguished, and the two choice targets were shown simultaneously, after which the monkey made a single, saccadic eye movement directly to one of the targets. This eye movement was initiated with a longer latency relative to fixation-point offset than for the pro-saccade task (Table 1), reflecting the additional time needed to process the location of the targets. On trials with FEF microstimulation, the fixation point and the motion stimulus were extinguished, the two choice targets were shown, and electrical microstimulation was begun simultaneously. The monkey then made two distinct eye movements. The first, electrically evoked saccade had a trajectory roughly perpendicular to the axis of motion. The second, voluntary saccade traveled from the endpoint of the evoked saccade to one of the two choice targets, the color of which indicated the monkey's direction decision.
Fig. 7.

Examples of eye movement traces from correct trials in a single colored-target experiment, using various motion strengths and viewing durations. Eye position was sampled in 2 msec intervals. A, Ten trials without microstimulation. The targets are not shown because they appeared at different locations for each trial. The fixation point is at the origin. The dashed line indicates the axis of motion. B, C, Time courses of the eye movements corresponding to the trials in A. Data are aligned to fixation-point offset (time = 0). D–F, Ten trials with microstimulation, plotted as in A–C. InA–F, rightward decisions (i.e., eye movements to the red target) are indicated with thicker lines than leftward decisions (i.e., eye movements to the green target). pos, Position; deg, degree.
For this task, the monkey's direction decision had little effect on the endpoints of saccades evoked with FEF microstimulation. Figure8A shows the evoked-saccade endpoints from all straight saccades and correct trials in a single experiment, sorted by the monkey's choice. The endpoints of these saccades were located above the fixation point, similar to those evoked with fixation only (data not shown). Importantly, the endpoints were similarly distributed regardless of the monkey's direction decision.
Fig. 8.

Effect of target choice on electrically evoked eye movements from the colored-target task. A, Endpoints of evoked saccades for all correct trials from the experiment depicted in Figure 7. Open and closed symbols represent leftward and rightward direction decisions, respectively (n = 905; many points are obscured by other symbols). The magnitude of separation was defined as the distance between the means of the two distributions of endpoints (filled circles, which are superimposed, designated with anopen and a closed symbol; r = 0.1°). The dashed line connecting the mean endpoints defines an axis of separation that crosses the axis of random-dot motion, indicated by the line through the fixation point at the origin. The angle between these two lines gives the direction of separation (θ = 0.73 radians). B, Mean endpoint positions of evoked saccades for all correct discrimination trials from each site tested. Line segments radiating from the origin represent the mean evoked saccade. Circles(monkey I) and triangles (monkey S) show the mean evoked saccades sorted by the monkey's direction decision. Closed symbols indicate rightward decisions. Large symbolsindicate experiments in which the dependence of endpoint position on target choice was significant (two-dimensional Kolmogorov–Smirnov test; p < 0.01). C, Polar plot of the magnitude (r) and direction (θ) of saccade endpoint separation, as described in A, for all sites tested in monkey I (circles) and monkey S (triangles). Radii near zero imply minimal separation of endpoints. Values forr and θ were computed from run-mean-subtracted data, as described in Materials and Methods but not shown in A. deg, Degree; rad, radian.
Figure 8, B and C, summarizes the effects of the monkey's direction decision on the endpoints of saccades evoked on discrimination trials from each of the 18 colored-target experiments. There was a slight but significant difference between endpoints associated with the two direction decisions in 15 of these experiments (Fig. 8B) (two-dimensional Kolmogorov–Smirnov test; p < 0.01 ). However, this difference reflected a separation of mean endpoints of <0.6° for all sites tested (radii in the polar plot in Fig. 8B). Moreover, these separations were in no systematic direction relative to the axis of random-dot motion (angles in the polar plot in Fig. 8C). Accordingly, the magnitude of deviation along the axis of motion was significantly smaller than that found in the pro-saccade data ( t tests comparing correct or error data across sites for each monkey individually; p < 0.01 ). For correct trials from monkey I, the mean ± SEM deviation was 0.11 ± 0.01° ( n = 7062 trials), ranging from −0.02 ± 0.02 to 0.13 ± 0.01° for individual experiments. For error trials from monkey I, the magnitude of deviation was 0.05 ± 0.01° (n = 2610), ranging from −0.09 ± 0.01 to 0.08 ± 0.11°. For correct trials from Monkey S, the magnitude of deviation was −0.07 ± 0.01° (n = 6512), ranging from −0.18 ± 0.03 to 0.03 ± 0.01°. For error trials from Monkey S, the magnitude of deviation was 0.00 ± 0.01° (n = 2513), ranging from −0.07 ± 0.02 to 0.07 ± 0.03°.
The near absence of deviations along the axis of motion appeared to reflect the fact that the monkey could not predict the direction of the appropriate eye-movement response while viewing the motion stimulus. The lack of visual targets during the motion-viewing period by itself did not minimize the deviations: significantly larger deviations along the axis of motion were found when targets were similarly hidden until after decision formation but then appeared at predictable locations along the axis of motion (mean ± SEM magnitude of deviation = 0.69 ± 0.02° from 4876 correct trials for two sites in monkey I; t test; p < 0.01 ). Instead, the unpredictability of the target locations seemed to dissociate the monkey's direction decision from a plan to make a particular eye movement, thereby minimizing the effect of oculomotor preparation on the evoked saccades.
This interpretation implies that the evoked-saccade endpoints should reflect oculomotor preparatory signals once target locations are specified. Because the evoked saccades began ∼40–50 msec after onset of the targets (Table 1), there was generally too little time for visual information about target location to affect oculomotor processing. Indeed, for trials in which the saccades were evoked with relatively short latencies, there was no deviation in the direction of the subsequently selected target. For trials with longer latencies, however, a small amount of such deviation was evident (Table2). Note that this effect is in contrast to data from the pro-saccade task, in which the monkey could prepare its eye-movement response while viewing the motion stimulus, and accordingly, evoked-saccade deviations toward the selected target were apparent regardless of the latency of the evoked saccade ( t tests evaluating whether deviation magnitude equaled zero for different latencies; p < 0.01 ).
Table 2.
Deviations of evoked eye movements toward the subsequently selected target for the colored-target task
| Monkey | Evoked-saccade latency2-a | Number of trials | Deviation wrt target2-b |
|---|---|---|---|
| 0–25 percentile | |||
| I/Correct | <33 | 4813 | 0.01 (0.01) |
| I/Error | <33 | 1300 | 0.02 (0.01) |
| S/Correct | <43 | 2415 | 0.00 (0.01) |
| S/Error | <43 | 837 | 0.00 (0.01) |
| 75–100 percentile | |||
| I/Correct | >43 | 3620 | 0.10 (0.01)* |
| I/Error | >47 | 1245 | 0.16 (0.02)* |
| S/Correct | >53 | 2172 | 0.12 (0.02)* |
| S/Error | >53 | 785 | 0.15 (0.03)* |
Significantly different from 0; t test;p < 0.01.
Latencies are reported in milliseconds, with respect to fixation-point offset.
Magnitude of deviation measured in the direction of the subsequently selected target, in degrees. Values are mean (SEM).
The evoked-saccade endpoints for the colored-target task also were more stereotyped than those measured for the pro-saccade task, providing further evidence that the colored-target endpoints did not reflect the monkey's direction decision. Endpoint variability across all motion strengths and viewing times was significantly smaller for the colored-target task than for the pro-saccade task, whether measured in all directions (monkey I: mean ± SEM absolute lengths of endpoint vectors for run-mean subtracted data = 0.55 ± 0.01° for the colored-target task, compared with 1.40 ± 0.01° for the pro-saccade task; monkey S: 0.62 ± 0.01° compared with 1.26 ± 0.01° for the pro-saccade task; Kolmogorov–Smirnov tests; p < 0.01 ) or just along the axis of motion (monkey I: SD of the magnitude of deviation from correct trials = 0.36° for the colored-target task, compared with 1.04° for the pro-saccade task; monkey S: 0.41° compared with 0.88° for the pro-saccade task; F tests; p < 0.01 ). These small, stereotyped deviations along the axis of motion were influenced only slightly by motion strength and viewing time. Moreover, these effects were not consistent between the two monkeys. For monkey I, the magnitude of deviation increased slightly but systematically with increasing motion strength (Fig.9A) but tended to decrease slightly with increasing viewing time (Fig. 9B, C). In contrast, for monkey S, the magnitude of deviation tended to decrease slightly with increasing motion strength (Fig. 9D) but was not monotonically related to viewing time (Fig. 9E, F). Thus, for this task, there was no buildup of motion information apparent in saccades evoked while the monkey was viewing the motion stimulus and forming its direction decision.
Fig. 9.

Effect of motion strength and viewing duration on electrically evoked eye movements during the colored-target task.A–C, Data from monkey I. D–F, Data from monkey S. In A and D, data are separated by viewing duration, as labeled. Symbols and error bars represent mean and SEM, respectively. The effect of motion strength was significant for each time epoch in monkey I but only the earliest two epochs in monkey S (Eq. 1; p < 0.01). In B and E, data are separated by motion strength, as labeled. Symbols and error bars represent mean and SEM in 40-msec-wide bins of viewing duration. The effect of viewing duration was not significant for any coherence in monkey I and was significant for all but 6.4% coherence in monkey S (Eq. 2; p < 0.01). Data in A, B, D, andE are from correct trials. C, F, Data as inB and E, respectively, but standardized with respect to the mean (see Materials and Methods for details). For this data set, the effect of motion strength was significant for each time epoch in monkey I but only the earliest two epochs in monkey S (Eq. 1;p < 0.01). The effect of viewing duration was significant for 12.8% coherence in monkey I and for all but 0 and 6.4% coherence in monkey S (Eq. 2; p < 0.01).coh, Coherence; deg, degree.
Together, the pro-saccade and colored-target data suggest that the deviations evident in the pro-saccade task correspond to developing oculomotor commands that reflect the gradual conversion of motion information into a plan to generate the appropriate eye-movement response. The deviations do not simply represent the motion stimulus itself, because they are opposite the direction of motion on error trials on the pro-saccade task, and they are much smaller and not similarly related to motion strength or viewing time on the colored-target task (when the same motion stimulus is used). Moreover, the deviations do not simply represent the monkey's direction decision, independent of the motor response; again, the colored-target data appear to rule out this explanation.
To further test this idea, we trained one of the monkeys on a third version of the direction-discrimination task, the anti-saccade task, which restored a predictable (albeit reversed) association between the decision and the eye movement response (Fig. 1C). As on the other versions of the task, the monkey's performance on this task depended on the strength and viewing duration of the motion stimulus (Fig. 10). At low motion strengths and short viewing durations, performance was near chance. As motion strength and viewing duration increased, performance improved steadily, to ∼95% accuracy at 51.2% motion coherence and viewing durations of more than ∼300 msec (Fig. 10A, B). Fits to time-binned data of the cumulative Weibull function (Eq. 3) showed that increased viewing time caused a systematic decrease in discrimination threshold (Fig. 10C) (Eq. 4; p < 0.01 ) and caused a slight change in the slope of the psychometric function (Fig.10D) (Eq. 5; p < 0.01 ). On trials with FEF microstimulation, psychophysical threshold increased by 8.9 ± 1.0% coherence (Fig. 10C) (Eq. 4; p < 0.01 ). There was a significant change in the slope of the psychometric functions (Fig. 10D) (Eq. 5; p < 0.01 ), and the lapse rate decreased on trials with microstimulation (3.6 ± 1.3 vs 5.2 ± 1.4% on control trials). In general, despite a degradation of psychophysical thresholds on trials with FEF microstimulation, all trials appeared to depend on a coherence- and time-dependent decision process that was similar to the one responsible for performance on the other two tasks.
Fig. 10.

Performance on the anti-saccade task.A, Percentage correct plotted as a function of viewing time. Points are shown at the center of time bins that had width adjusted to include approximately equal numbers of trials (n ≈ 250 trials per point). Colors represent different motion strengths, as indicated. Data are from 16,298 trials, with and without FEF microstimulation, from monkey I. B, Percentage correct plotted as a function of motion strength. Points represent a subset of the data presented in A, binned into four groups of viewing duration, as indicated. The solid curves are maximum likelihood fits of the cumulative Weibull function (Eq. 3), computed separately for each curve. The dashed line shows the asymptotic performance (determined from λ in Eq. 3), estimated from long duration trials only. C, Discrimination threshold as a function of viewing time. Symbols and error bars represent the best fit and SEM of the parameter α in Eq. 3 to performance data in 80-msec-wide bins of viewing time. To emphasize the inverse relationship between threshold and time, best fits of Equation 4 are shown (lines) for each data set. Closed symbolsand solid lines correspond to trials without FEF microstimulation; open symbols and dashed linescorrespond to trials with FEF microstimulation. D, Slope of the psychometric function (the parameter β in Eq. 3) as a function of viewing time. Symbols and error bars are plotted as in C.Note the logarithmic time scales in C and D. coh, Coherence.
Figure 11 illustrates eye-movement data from a single experiment (eye-movement data from all experiments are summarized in Table 1). The monkey's eyes remained stationary during motion viewing. On trials without microstimulation, the fixation point and the motion stimulus were extinguished simultaneously, after which the monkey made a single, saccadic eye movement directly to one of the two choice targets. On trials with microstimulation, the fixation point and the motion stimulus were extinguished, and FEF microstimulation was begun simultaneously. The monkey then made two distinct eye movements. The first, electrically evoked saccade had a trajectory roughly perpendicular to the axis of motion. The second, voluntary saccade traveled from the endpoint of the evoked saccade to one of the two choice targets, thereby indicating the monkey's direction decision.
Fig. 11.

Examples of eye movement traces from correct trials in a single anti-saccade experiment, using various motion strengths and viewing durations. Eye position was sampled in 2 msec intervals. A, Ten trials without microstimulation. Thetwo large circles represent the two targets. The fixation point is at the origin. The dashed line indicates the axis of motion. B, C, Time courses of the eye movements corresponding to the trials in A. Data are aligned to fixation-point offset (time = 0). D–F, Ten trials with microstimulation, plotted as in A–C. In A–F, rightward decisions (i.e., leftward eye movements) are indicated withthicker lines than leftward decisions (i.e., rightward eye movements). pos, Position; deg, degree.
Like the pro-saccade data, the endpoints of eye movements evoked electrically during the anti-saccade task deviated in the direction of the monkey's subsequent eye-movement response. Unlike the pro-saccade data, however, this direction was opposite the perceived direction of motion. Figure 12Ashows endpoints from all correct trials in a single experiment, separated by the monkey's choice. In all cases, the endpoints were similar to those from saccades evoked with fixation only (data not shown) and were located above the fixation point. However, on trials in which the monkey subsequently chose the left target, corresponding to rightward motion, the endpoints of the evoked saccades tended to be located slightly to the left. Conversely, on trials in which the monkey subsequently chose the right target, corresponding to leftward motion, the endpoints tended to be located slightly to the right. In fact, at all 11 sites tested, the mean saccade endpoint vector depended significantly on target choice (Fig. 12B) (two-dimensional Kolmogorov–Smirnov test; p < 0.01 ). On average, the mean endpoints corresponding to the two direction decisions for a given experiment were separated from each other roughly along the axis of motion (angles in the polar plot in Fig.12C) by 2.1 ± 0.6° (mean ± SEM; radii in the polar plot in Fig. 12C).
Fig. 12.

Effect of target choice on electrically evoked eye movements from the anti-saccade task. A, Endpoints of evoked saccades for all correct trials from the experiment depicted in Figure 11. Open and closed symbols represent leftward and rightward decisions (i.e., rightward and leftward eye movements), respectively. The magnitude of separation was defined as the distance between the means of the two distributions of endpoints (filled circles, designated with an openand a closed symbol; r = 3.8°). Thedashed line connecting the mean endpoints defines an axis of separation that is nearly parallel to the axis of random-dot motion, indicated by the line between the choice targets (large filled circles). The angle between these two lines gives the direction of separation (θ = 0.02 radians).B, Mean endpoint positions of evoked saccades for all correct discrimination trials from each site tested. Line segments radiating from the origin represent the mean evoked saccade. Symbols show the mean evoked saccades sorted by the direction of the ensuing target choice. Closed symbolsindicate the more leftward choice (indicating a decision that motion was rightward). For each experiment, the dependence of endpoint position on target choice was significant (two-dimensional Kolmogorov–Smirnov test; p < 0.01). C, The magnitude (r) and direction (θ) of separation, as described in A, for all 11 sites. Angles near zero indicate that the endpoints tended to deviate along the axis of motion and in the direction of the subsequently selected target. Values for r and θ were computed from run-mean-subtracted data, as described in Materials and Methods but not shown in A. deg, Degree; rad, radian.
For each trial, we determined the component of the electrically evoked saccade in the direction of the monkey's impending eye-movement response, which was the same convention used for the pro-saccade data (see Materials and Methods). For correct trials, the magnitude of deviation was positive, on average, and thus was in the direction of motion: the magnitude of deviation in a given experiment ranged from 0.22 ± 0.02° (mean ± SEM) to 3.06 ± 0.08° and combined across all experiments was 1.06 ± 0.02° ( n = 6929 correct trials). For error trials, this quantity was also positive, on average indicating a deviation opposite the direction of motion: the magnitude of deviation in a given experiment ranged from 0.21 ± 0.03 to 2.50 ± 0.16° and combined across all experiments was 0.70 ± 0.03° ( n = 1917 error trials; this was significantly smaller than deviations on correct trials; t test; p < 0.01 ). These results indicate that the endpoints of eye movements evoked by FEF microstimulation tended to deviate in the direction of the subsequent, voluntary eye movement, which was opposite the perceived direction of motion.
As for the pro-saccade data, these deviations depended on the coherence and duration of the motion stimulus. On difficult trials in which the monkey viewed weak motion for a short duration, the deviations in the direction of the subsequently selected target were small (Fig.13A). In contrast, on easier trials in which the monkey viewed strong motion for a longer time, the deviations were large (Fig. 13B). In general, the average magnitude of this deviation increased significantly as a function of motion strength for all but the shortest viewing durations (Fig.13C) and as a function of viewing duration (up to ∼400 msec) for all coherences (Fig. 13D, E).
Fig. 13.

Effect of motion strength and viewing duration on electrically evoked eye movements from the anti-saccade task. A, B, Endpoints of evoked saccades from all correct trials in the experiment depicted in Figure 12A. Open and closed symbols indicate trials in which the monkey subsequently indicated a leftward or rightward direction decision, respectively. The average endpoint was estimated as a running mean and subtracted from each data point, thereby centering the distribution of points at the origin. The magnitude of deviation in the direction of the subsequently selected target was quantified as the dot product between the endpoint vector (thin arrows) and the unit vector in the direction of the target (thick arrows). Examples are illustrated inred. Zero magnitude is represented by the roughlyvertical lines that pass through the origin. Positive values indicate deviations in the direction of the subsequently selected target. Deviation magnitude was smaller on trials with weak motion and short viewing durations (colored symbols in A; mean ± SEM = 0.2 ± 0.2°) than on trials with strong motion and longer viewing durations (colored symbols inB; 4.0 ± 0.2°). C, Summary of the effect of motion strength on deviation magnitude. Data are sorted by viewing duration, as labeled. Symbols and error bars represent mean and SEM. The effect of motion strength was significant for all but the earliest epoch (Eq. 1; p < 0.01). Data are from correct trials.D, Summary of the effect of viewing duration on deviation magnitude. Data are sorted by motion strength, as labeled. Symbols and error bars represent mean and SEM in 53-msec-wide bins of viewing duration. The effect of viewing duration was significant at each coherence (Eq. 2; p < 0.01). Solid linesrepresent data from correct trials; dashed lines represent data from error trials. E, Data as in D, but standardized with respect to the mean for each experiment (SD; see Materials and Methods for details). For this data set, the effect of motion strength was significant for all but the earliest epoch (Eq. 1; p < 0.01), and the effect of viewing duration was significant at each coherence (Eq. 2;p < 0.01). coh, Coherence; deg, degree.
Thus, data from the pro-saccade, colored-target, and anti-saccade tasks together demonstrate that the deviations are not simple reflections of the motion stimulus itself or the direction of the monkey's decision per se but rather represent these factors only insofar as they bear on the development of the associated oculomotor plan.
Model of a decision variable
Performance on the direction-discrimination tasks improved with increasing motion strength and viewing duration. When the decision was indicated with an eye movement to a target at a particular location (e.g., the pro-saccade task), evoked-saccade endpoints deviated in the direction of the subsequent eye-movement response. The magnitude of this deviation increased in a coherence-independent manner for the first ∼175 msec of viewing duration and then increased steadily as a function of both motion strength and viewing duration. We tested the idea that the coherence- and time-dependent deviations reflect the neural computations that convert incoming motion information into a binary decision and subsequent eye-movement response. We first show that performance can be explained by a model of decision formation in which motion information is accumulated into a decision variable, which is a quantity that is monotonically related to the relative likelihood of one alternative versus the other (Green and Swets, 1966; Graham, 1989; Gold and Shadlen, 2001). We then show that a version of this decision variable, derived from performance, matches the deviation data from the pro-saccade task. Finally, we show that two alternative models fail to explain the deviation data.
To model performance, we assumed that the monkey's decision was based on the value of a decision variable. The decision variable was computed as the difference between two variable quantities that represented the accumulated responses of motion sensors that encoded the two directions of motion (Eq. 6). The expected value and the variability of the decision variable governed performance accuracy (Eq. 7). The fit of this model to the performance data specified how the decision variable depended on motion strength and viewing duration to account for the monkeys' choices.
The psychometric functions derived by fitting this model to performance data from the pro-saccade and colored-target tasks are summarized in Figure 14A and Table3. Only three values, a, m, and n from Equation 6, were fit in this procedure. The remaining two factors in the model (see Eqs. 6 and 7) were held constant at realistic values: R0 = 10 spikes/sec, which is consistent with measurements from the middle temporal visual area (MT) (Britten et al., 1993), and φ = 0.3, a reasonable value for the pooled responses of weakly correlated neurons (Zohary et al., 1994; Shadlen et al., 1996). These factors had little effect on the critical parameters m and n, which describe how the underlying decision variable in the model depends on coherence and time, respectively. Both factors affected primarily the value of a (Table 3).
Fig. 14.

Comparison of deviation data with a decision variable inferred from psychophysics. A, Model fit to behavioral data from the pro-saccade task. Data are from all trials, without and with FEF microstimulation, in both monkeys and are plotted as a function of viewing time for different motion strengths, as indicated. The smooth curves are maximum likelihood fits of the model described in Equations 6 and 7. The model quantifies the decision variable that underlies the monkey's choices. B, Expected value of the underlying decision variable as a function of viewing time for different motion strengths (as in A). The decision variable is derived from the fit of the model to the pro-saccade data, shown in A. Solid lines represent correct trials; dashed lines represent error trials. The decision variable approximates the logarithm of the likelihood ratio favoring motion in the direction chosen by the monkey (this conditionalization ensures that the value is always positive). C, Transformation of the decision variable to movement probability. The decision variable from B was transformed to the probability of making a particular eye-movement response (Eq. 12). Thecurves are scaled and shifted to align with the pro-saccade deviation data (points). Circles andsolid lines represent correct trials; crosses anddashed lines represent error trials. Data are separated by motion strength, as indicated in A. In B andC, black curves and symbols represent data from 0% coherence trials. arb units, Arbitrary units;coh, coherence; deg, degree.
Table 3.
Best-fit values of parameters from the temporal accumulation model of decision formation3-a
| Task3-b | R0 | φ | a | m | n |
|---|---|---|---|---|---|
| PS | 10 | 0.30 | 35.70 ± 1.90 | 0.99 ± 0.02 | 1.01 ± 0.03 |
| PS | 1 | 0.05 | 5.07 ± 0.22 | 1.02 ± 0.02 | 1.00 ± 0.03 |
| PS | 1 | 1.00 | 67.53 ± 3.70 | 1.34 ± 0.02 | 0.98 ± 0.03 |
| PS | 50 | 0.05 | 24.58 ± 0.45 | 0.90 ± 0.00 | 1.02 ± 0.03 |
| PS | 50 | 1.00 | 136.93 ± 3.31 | 0.97 ± 0.01 | 1.01 ± 0.02 |
| CT | 10 | 0.30 | 27.53 ± 0.12 | 0.92 ± 0.01 | 1.47 ± 0.02 |
See Materials and Methods and Results for details. Values are reported as maximum likelihood estimates ± SE. Combined data from both monkeys (except anti-saccade task), using trials without and with FEF microstimulation.
PS, Pro-saccade; CT, colored-target.
The fits to the model indicate that performance was consistent with a decision process that was based on an accumulation of motion information over time. The best fits produced values of m and n that were near unity for the pro- and anti-saccade tasks, with slightly higher values for n on the colored-target task (Table 3). Values near unity imply that the decision variable scales in an essentially linear fashion with both motion strength and viewing duration. Such a decision variable is suggestive of a temporal integration of the kind of coherence-dependent neural activity found in the MT (Britten et al., 1993).
To compare the expected value of the decision variable (D), derived from the fit to performance, with the deviation data, we considered one additional transformation. D represents the accumulated weight of evidence distinguishing between the alternative direction decisions, and it increases steadily and without bound (Fig.14B). Perhaps a more natural quantity to be represented in the oculomotor system is the probability of making a particular eye movement. The transformation of D into such a probability is straightforward given the observation that D is roughly proportional to the logarithm of the likelihood ratio (logLR) favoring the correct choice, as we have described elsewhere (Gold and Shadlen, 2001). Because we are sorting the data into correct and incorrect choices, this transformation causes a compression of D into probability on [0.5 to 1] (Eq. 12).
We compared this transformed version of the decision variable, derived from performance, to the coherence- and time-dependent deviation data from the pro- and anti-saccade tasks. This comparison involved scaling the transformed decision variable to match the ranges of deviation magnitudes that we measured, but not altering the coherence or time dependence of either quantity. For the pro-saccade task, both quantities varied with motion coherence and viewing time in a similar manner (Fig. 14C) (χ2 goodness of fit; Q = 0.0648 ). For correct trials, both the transformed decision variable and the saccade deviations increased with stronger motion and increased toward a point of saturation with increasing viewing time. For incorrect trials, both quantities increased with viewing time but decreased with greater motion strength. An exception to the match between the transformed decision variable and the saccade deviations can be seen at the strongest motion strengths on correct trials, where the deviation magnitude begins to decrease at longer viewing durations. Presumably this decrease occurs because the monkey formed its decision before microstimulation onset on these long trials, and thus the oculomotor preparation signals at the time of microstimulation were dominated by other factors.
We considered two alternative explanations for the deviation data. One possibility is that the decision is not based on an accumulation of motion information but results from the perception of momentary motion features in the random-dot stimulus. This process, called probability summation over time (Watson, 1979), assumes that the slope of the psychometric function (β in Eq. 13) is unchanged by viewing duration, which is consistent with the observations in Figures2D, 6D, and 11D.Moreover, the probability summation model predicts improved performance with stronger motion and longer viewing times, because they provide a higher frequency of salient motion features, and is consistent with performance (Fig. 15A). Thus, on the basis of behavioral performance alone, both the probability summation and motion accumulation models appear to be equally plausible explanations for the monkeys' decision process.
The probability summation and motion accumulation models can be distinguished on the basis of the underlying neural signals. A decision based on discrete, salient motion events would not reflect a gradually accumulating quantity in the brain. Instead, a motion event would trigger a more abrupt transition from an uncommitted or “no decision” state to a committed or “decision” state. To account for the deviation data, this idea implies that although the averaged curves appear to be smoothly varying functions of coherence and time (Fig. 5D, E), these curves must, in fact, reflect a mixture of values. That is, before the decision is made, there should be (on average) no deviation. When the decision is made, however, the command to generate the appropriate oculomotor response is initiated and should cause a deviation in the direction of the impending eye movement that is independent of the motion stimulus that led to the decision. Thus, an intermediate value of the average magnitude of deviation would reflect a mixture of deviations corresponding to the no decision and decision states.
We found no evidence that the deviation data reflected a mixture of values from two states. In principle, such a mixture should result in a bimodal distribution of deviations at intermediate viewing durations and motion strengths, but this was not the case (dip test; p > 0.9 for both the pro- and anti-saccade data) (Hartigan and Hartigan, 1985). However, it could be argued that such bimodality is likely to be obscured by the high degree of variability in the deviation data (Fig. 15B): for fixed conditions (i.e., correct or error trials for a given coherence and viewing duration), the distribution of deviation magnitudes had an interquartile range (IQR; a non-parametric, robust measure of spread) that was, on average, 1.4° (this variability seemed to be inherent to the technique, because saccades evoked from fixation in the absence of motion viewing had an IQR of 1.2° in the horizontal direction and 0.9° in the vertical direction; n = 5428 trials). Given this variability, we devised a more sensitive test to recognize such a mixture. We estimated the widths of distributions of deviation magnitude that would arise, in principle, from mixtures of values drawn from distributions representing the no decision and decision states. As shown in Figure 15C, we assumed that these states corresponded to outermost values from the pro-saccade data. However, the IQRs of distributions corresponding to intermediate values of the average magnitude of deviation were substantially narrower than these estimates, suggesting that they did not arise from mixtures of values from two states.
A second possible explanation for the deviation data is that regardless of the underlying decision process, only its outcome affects the developing oculomotor commands that give rise to the deviations. This possibility, like probability summation, implies that on a given trial, the coherence- and time-dependent decision process affects only when and in which direction to generate the appropriate oculomotor response. We therefore fit the deviation data to a model of developing activity that reflected stereotyped dynamics of a preparatory signal to the saccadic system (Eq. 14). This model assumed that the coherence- and time-dependent decision affected only when to initiate the oculomotor response and where the eyes would move. The developing activity reflected in the growing deviations would thus represent, for example, pre-saccadic activity found in numerous oculomotor areas, including the FEF and the SC, that are involved in generating the commands to move the eyes (Sparks and Hartwich-Young, 1989;Gaymard et al., 1998). The fit of the pro-saccade data to this model was poor relative to the fit to the decision-variable model (Fig. 15D) (χ2 goodness of fit; Q < 10−9). The poor fit was attributable to the fact that motion coherence affected only the delay before the stereotyped rise. Various alternatives to Equation 14describing the dynamics of the stereotyped rise provided similarly poor fits.
Thus, the data appear to be most consistent with a process that caused the magnitude of deviation to take on intermediate values that varied smoothly with motion strength and viewing duration. This process is not consistent with discrete, stimulus-independent decision states or the stereotyped dynamics of developing oculomotor commands that are generated after the decision is formed. Instead, this process appears to involve developing oculomotor commands that reflect not just the impending eye-movement response, but also the gradual transformation of motion information into the preparation of the response.
Discussion
The results demonstrate that a decision about the direction of random-dot motion is represented in gradually evolving commands to generate the appropriate eye-movement response when the decision is indicated with an eye movement to a previously specified location (the pro- and anti-saccade tasks) but not otherwise (the colored-target task). In the following sections, we first discuss the microstimulation technique that we used to probe developing oculomotor signals. We then develop the idea that these signals reflect an accumulation of motion information into a direction decision when the decision instructs a particular eye-movement response. Finally, we consider how the brain forms more abstract decisions that are not linked to specific actions.
Microstimulation technique
We assessed ongoing oculomotor activity during the discrimination tasks by interrupting motion viewing with electrical microstimulation of the FEF and analyzing the trajectories of the resulting, evoked eye movements. We adopted this strategy because previous work showed that electrically evoked eye movements can be affected by ongoing activity in the oculomotor system. Microstimulation of the FEF or the SC typically evokes an eye movement with a stereotyped trajectory that depends on the site of stimulation when applied in darkness (Robinson and Fuchs, 1969; Robinson, 1972; Bruce and Goldberg, 1985). In contrast, similar microstimulation can result in either no eye movement or an evoked movement with a trajectory that reflects the associated oculomotor behavior when applied during visual fixation (Tehovnik et al., 1999), immediately before or during a visually guided eye movement (Sparks and Mays, 1983;Schlag et al., 1989), during smooth pursuit (Marrocco, 1978), or concurrent with shifts in visual attention (Kustov and Robinson, 1996).
We found that the evoked saccades deviated from their normal trajectories when the monkey's direction decision instructed an eye movement to a particular location. This deviation was in the direction of the monkey's subsequent eye-movement response (toward and away from the perceived direction of motion in the pro- and anti-saccade tasks, respectively). Similar deviations are found when microstimulation occurs after an explicit instruction to move the eyes but before the movement is initiated (Mays and Sparks, 1980). We interpret the deviations in our experiments as a reflection of an evolving plan to generate the impending eye-movement response.
The present results argue against a number of alternative explanations for the deviations. First, they do not represent the motion stimulus itself, because they were not systematically related to the direction of motion on the colored-target task and were opposite the direction of motion on pro-saccade error trials and anti-saccade correct trials. Second, they do not reflect the monkey's direction decision independent of the subsequent eye-movement response; otherwise, the deviation data from the colored-target task would be expected to show a similar coherence-dependent buildup as was seen in the pro- and anti-saccade data. Third, the deviations do not seem to reflect an ongoing eye movement at the time of microstimulation, which can cause a compensatory deviation opposite the direction of the ongoing movement (Schlag et al., 1989). In principle, to account for our data, this idea implies that the monkey's eyes were moving opposite the direction of the dots for the pro-saccade task and in the direction of the dots for the anti-saccade task. In fact, there was no tendency for either monkey to adjust its eye position along the axis of motion while viewing the dots (Table 1). Fourth, the deviations do not reflect systematic offsets in fixation because each deviation was measured with respect to eye position at microstimulation onset. Fifth, the deviations were not simply part of the voluntary saccade to one of the choice targets, which was initiated after a delay after the termination of the evoked saccade. Indeed, the deviations were measured using only straight saccades and thus did not reflect curved trajectories that might have arisen as a combination of a nondeviated evoked saccade and a voluntary saccade toward one of the choice targets (McPeek and Keller, 2001).
It is not clear how, under these conditions, the oculomotor system generated an evoked saccade with a component determined by the site of FEF microstimulation and a component determined by the direction of the planned eye-movement response. Numerous oculomotor regions are thought to be involved in forming the direction decision and preparing the appropriate oculomotor response, including area LIP (Shadlen and Newsome, 2001;Roitman and Shadlen, 2002), the SC (Horwitz and Newsome, 1999, 2001), and areas of the prefrontal cortex including the FEF (Kim and Shadlen, 1999). In principle, developing activity in any or all such areas could interact with the electrical microstimulation to affect the evoked saccades (Schiller and Sandell, 1983). This interpretation suggests that although our electrode was placed in the FEF, this technique is an assay of activity not just in the FEF but in the oculomotor system as a whole.
Another difficulty in understanding how these components interact in the oculomotor system is the complicated effects of microstimulation, which in our study likely activated all FEF neurons clustered near the electrode tip (Tehovnik, 1996). In addition, the microstimulation could have caused both orthodromic (Hanes and Wurtz, 2001) and antidromic activation (Ferraina et al., 2002) of other oculomotor regions that connect with the FEF, notably the SC and LIP (Wurtz et al., 2001). Regardless of the exact pattern of activation, this aggregate of microstimulus-evoked activity tended to dominate the evoked-saccade trajectory, which when evoked during the discrimination task tended to deviate by <2° from the trajectory evoked in darkness.
Decisions linked to specific actions
The developing oculomotor commands evident during motion viewing on the pro- and anti-saccade tasks depend not just on the impending eye-movement response, but also on the strength and duration of the motion stimulus. This dependence is consistent with a decision process, based on an accumulation of motion information over time, that can account for performance. In contrast, the deviation data do not appear to be consistent with a decision process that is completed elsewhere in the brain and affects only when to initiate a particular oculomotor command.
Thus, when the monkey's direction decision instructs a specific eye-movement response, there is a continuous flow of motion information into the circuits responsible for forming the oculomotor response. This motion information, known to be represented in area MT and the medial superior temporal (MST) area of extrastriate visual cortex (Newsome and Pare, 1988; Britten et al., 1992; Salzman et al., 1992; Celebrini and Newsome, 1994, 1995; Pasternak and Merigan, 1994;Salzman and Newsome, 1994), appears to be accumulated over time into a decision variable that can account for performance. Indeed, the idea that the developing decision is represented as a temporal accumulation of motion information in the oculomotor system has been shown to have neural correlates in numerous brain regions involved in preparing the eye-movement response, including area LIP, the prefrontal cortex, and the SC (Horwitz and Newsome, 1999, 2001;Kim and Shadlen, 1999; Shadlen and Newsome, 2001; Roitman and Shadlen, 2002).
These results, linking decision formation to the generation of the behavioral response, reflect the one-to-one mapping between the decision and the behavioral response. That is, for the pro- and anti-saccade tasks, a particular direction decision always leads to a particular behavioral response. Accordingly, the brain appears to construe motion evidence for or against a direction decision as equivalent to evidence for or against generating the appropriate eye-movement response. This idea is supported by numerous studies that have shown that the interpretation of sensory information is represented in neurons that signal specific actions, like purposive eye or arm movements (Boussaoud et al., 1995; Schall and Bichot, 1998; Colby and Goldberg, 1999;Romo and Salinas, 2001). Likewise, there appears to be a close relationship between the mechanisms that shift gaze and the mechanisms that shift attention (Kustov and Robinson, 1996; Moore and Fallah, 2001), providing further evidence that circuits involved in the preparation for specific actions can play a central role in the interpretation of sensory stimuli and the formation of decisions that guide those actions.
Decisions not linked to specific actions
The colored-target task represents a form of “abstract” decision-making, in that the monkey's direction decision is not linked to a particular eye-movement response. Accordingly, circuits involved in preparing particular eye movements do not appear to play a role in forming this kind of decision. However, the monkeys' performance on the colored-target task indicates that the underlying decision process is similar to that used for the pro- and anti-saccade tasks. The results from those tasks suggest that a continuous flow of motion information is accumulated in circuits that form the direction decision. Where is this accumulation evident for the colored-target task when the decision does not instruct a particular action?
The decision on the colored-target task can be thought of as instructing a behavioral rule: rightward motion instructs the rule “when two targets appear, choose the red one,” whereas leftward motion instructs the rule “when two targets appear, choose the green one.” According to this interpretation, the neurons involved in accumulating motion information toward a direction decision do not represent specific actions but rather behavioral rules. Clinical (Milner, 1963) and physiological evidence (Hoshi et al., 2000; Wallis et al., 2001) suggest that the prefrontal cortex, particularly Walker's area 46, represents behavioral rules. This representation may be part of a more general or “pragmatic” framework that includes representations of potential, deferred, or rule-based actions (Jeannerod, 1994;Rizzolatti et al., 1996). It remains to be seen whether these neurons accumulate sensory information into categorical decisions that therefore may be formed independently of specific, predictable behavioral responses.
Footnotes
This research was supported by National Institutes of Health Grants EY11378 and RR00166, Howard Hughes Medical Institute, the McKnight Foundation, and the Burroughs-Wellcome Fund. We thank M. Mihali and L. Jasinski for expert technical assistance and M. Mazurek, J. Ditterich, A. Huk, and P. Janssen for helpful comments on this manuscript.
Correspondence should be addressed to Joshua I. Gold, Department of Neuroscience, University of Pennsylvania, 116 Johnson Pavilion, 3610 Hamilton Walk, Philadelphia, PA 19104-6074. E-mail:jigold@mail.med.upenn.edu.
References
- 1.Boussaoud D, Wise SP. Primate frontal cortex: effects of stimulus and movement. Exp Brain Res. 1993;95:28–40. doi: 10.1007/BF00229651. [DOI] [PubMed] [Google Scholar]
- 2.Boussaoud D, di Pellegrino G, Wise SP. Frontal lobe mechanisms subserving vision-for-action versus vision-for-perception. Behav Brain Res. 1995;72:1–15. doi: 10.1016/0166-4328(96)00055-1. [DOI] [PubMed] [Google Scholar]
- 3.Brainard DH. The psychophysics toolbox. Spat Vis. 1997;10:433–436. [PubMed] [Google Scholar]
- 4.Britten KH, Shadlen MN, Newsome WT, Movshon JA. The analysis of visual motion: a comparison of neuronal and psychophysical performance. J Neurosci. 1992;12:4745–4765. doi: 10.1523/JNEUROSCI.12-12-04745.1992. [DOI] [PMC free article] [PubMed] [Google Scholar]
- 5.Britten KH, Shadlen MN, Newsome WT, Movshon JA. Responses of neurons in macaque MT to stochastic motion signals. Vis Neurosci. 1993;10:1157–1169. doi: 10.1017/s0952523800010269. [DOI] [PubMed] [Google Scholar]
- 6.Bruce CJ, Goldberg ME. Primate frontal eye fields. I. Single neurons discharging before saccades. J Neurophysiol. 1985;53:603–635. doi: 10.1152/jn.1985.53.3.603. [DOI] [PubMed] [Google Scholar]
- 7.Celebrini S, Newsome WT. Neuronal and psychophysical sensitivity to motion signals in extrastriate area MST of the macaque monkey. J Neurosci. 1994;14:4109–4124. doi: 10.1523/JNEUROSCI.14-07-04109.1994. [DOI] [PMC free article] [PubMed] [Google Scholar]
- 8.Celebrini S, Newsome WT. Microstimulation of extrastriate area MST influences performance on a direction discrimination task. J Neurophysiol. 1995;73:437–448. doi: 10.1152/jn.1995.73.2.437. [DOI] [PubMed] [Google Scholar]
- 9.Chen LL, Wise SP. Neuronal activity in the supplementary eye field during acquisition of conditional oculomotor associations. J Neurophysiol. 1995a;73:1101–1121. doi: 10.1152/jn.1995.73.3.1101. [DOI] [PubMed] [Google Scholar]
- 10.Chen LL, Wise SP. Supplementary eye field contrasted with the frontal eye field during acquisition of conditional oculomotor associations. J Neurophysiol. 1995b;73:1122–1134. doi: 10.1152/jn.1995.73.3.1122. [DOI] [PubMed] [Google Scholar]
- 11.Colby CL, Goldberg ME. Space and attention in parietal cortex. Annu Rev Neurosci. 1999;22:319–349. doi: 10.1146/annurev.neuro.22.1.319. [DOI] [PubMed] [Google Scholar]
- 12.di Pellegrino G, Wise SP. Visuospatial versus visuomotor activity in the premotor and prefrontal cortex of a primate. J Neurosci. 1993;13:1227–1243. doi: 10.1523/JNEUROSCI.13-03-01227.1993. [DOI] [PMC free article] [PubMed] [Google Scholar]
- 13.Draper NR, Smith H. Applied regression analysis, Ed 3. Wiley; New York: 1998. [Google Scholar]
- 14.Fadiga L, Fogassi L, Gallese V, Rizzolatti G. Visuomotor neurons: ambiguity of the discharge or “motor” perception? Int J Psychophysiol. 2000;35:165–177. doi: 10.1016/s0167-8760(99)00051-3. [DOI] [PubMed] [Google Scholar]
- 15.Ferraina S, Pare M, Wurtz RH. Comparison of cortico-cortical and cortico-collicular signals for the generation of saccadic eye movements. J Neurophysiol. 2002;87:845–858. doi: 10.1152/jn.00317.2001. [DOI] [PubMed] [Google Scholar]
- 16.Gaymard B, Ploner CJ, Rivaud S, Vermersch AI, Pierrot-Deseilligny C. Cortical control of saccades. Exp Brain Res. 1998;123:159–163. doi: 10.1007/s002210050557. [DOI] [PubMed] [Google Scholar]
- 17.Glimcher PW. Making choices: the neurophysiology of visual-saccadic decision making. Trends Neurosci. 2001;24:654–659. doi: 10.1016/s0166-2236(00)01932-9. [DOI] [PubMed] [Google Scholar]
- 18.Glimcher PW, Sparks DL. Movement selection in advance of action in the superior colliculus. Nature. 1992;355:542–545. doi: 10.1038/355542a0. [DOI] [PubMed] [Google Scholar]
- 19.Gnadt JW, Bracewell RM, Andersen RA. Sensorimotor transformation during eye movements to remembered visual targets. Vision Res. 1991;31:693–715. doi: 10.1016/0042-6989(91)90010-3. [DOI] [PubMed] [Google Scholar]
- 20.Gold JI, Shadlen MN. Representation of a perceptual decision in developing oculomotor commands. Nature. 2000;404:390–394. doi: 10.1038/35006062. [DOI] [PubMed] [Google Scholar]
- 21.Gold JI, Shadlen MN. Neural computations that underlie decisions about sensory stimuli. Trends Cogn Sci. 2001;5:10–16. doi: 10.1016/s1364-6613(00)01567-9. [DOI] [PubMed] [Google Scholar]
- 22.Gold JI, Shadlen MN. Banburismus and the brain: decoding the relationship between sensory stimuli, decisions, and reward. Neuron. 2002;36:299–308. doi: 10.1016/s0896-6273(02)00971-6. [DOI] [PubMed] [Google Scholar]
- 23.Graham NVS. Visual pattern analyzers. Oxford UP; Oxford: 1989. [Google Scholar]
- 24.Green DM, Swets JA. Signal detection theory and psychophysics. Wiley; New York: 1966. [Google Scholar]
- 25.Hanes DP, Wurtz RH. Interaction of the frontal eye field and superior colliculus for saccade generation. J Neurophysiol. 2001;85:804–815. doi: 10.1152/jn.2001.85.2.804. [DOI] [PubMed] [Google Scholar]
- 26.Hartigan JA, Hartigan PM. The dip test of unimodality. Ann Stat. 1985;13:70–84. [Google Scholar]
- 27.Horwitz GD, Newsome WT. Separate signals for target selection and movement specification in the superior colliculus. Science. 1999;284:1158–1161. doi: 10.1126/science.284.5417.1158. [DOI] [PubMed] [Google Scholar]
- 28.Horwitz GD, Newsome WT. Target selection for saccadic eye movements: prelude activity in the superior colliculus during a direction-discrimination task. J Neurophysiol. 2001;86:2543–2558. doi: 10.1152/jn.2001.86.5.2543. [DOI] [PubMed] [Google Scholar]
- 29.Hoshi E, Shima K, Tanji J. Neuronal activity in the primate prefrontal cortex in the process of motor selection based on two behavioral rules. J Neurophysiol. 2000;83:2355–2373. doi: 10.1152/jn.2000.83.4.2355. [DOI] [PubMed] [Google Scholar]
- 30.Jeannerod M. The representing brain: neural correlates of motor intention and imagery. Behav Brain Sci. 1994;17:187–245. [Google Scholar]
- 31.Judge SJ, Richmond BJ, Chu FC. Implantation of magnetic search coils for measurement of eye position: an improved method. Vision Res. 1980;20:535–538. doi: 10.1016/0042-6989(80)90128-5. [DOI] [PubMed] [Google Scholar]
- 32.Kalaska JF, Crammond DJ. Deciding not to GO: neuronal correlates of response selection in a GO/NOGO task in primate premotor and parietal cortex. Cereb Cortex. 1995;5:410–428. doi: 10.1093/cercor/5.5.410. [DOI] [PubMed] [Google Scholar]
- 33.Kim JN, Shadlen MN. Neural correlates of a decision in the dorsolateral prefrontal cortex of the macaque. Nat Neurosci. 1999;2:176–185. doi: 10.1038/5739. [DOI] [PubMed] [Google Scholar]
- 34.Kustov AA, Robinson DL. Shared neural control of attentional shifts and eye movements. Nature. 1996;384:74–77. doi: 10.1038/384074a0. [DOI] [PubMed] [Google Scholar]
- 35.Link SW. The wave theory of difference and similarity. Erlbaum; Hillsdale, NJ: 1992. [Google Scholar]
- 36.Luce RD. Response times: their role in inferring elementary mental organization. Oxford UP; New York: 1986. [Google Scholar]
- 37.Marrocco RT. Saccades induced by stimulation of the frontal eye fields: interaction with voluntary and reflexive eye movements. Brain Res. 1978;146:23–34. doi: 10.1016/0006-8993(78)90215-9. [DOI] [PubMed] [Google Scholar]
- 38.Mays LE, Sparks DL. Saccades are spatially, not retinocentrically, coded. Science. 1980;208:1163–1165. doi: 10.1126/science.6769161. [DOI] [PubMed] [Google Scholar]
- 39.McPeek RM, Keller EL. Short-term priming, concurrent processing, and saccade curvature during a target selection task in the monkey. Vision Res. 2001;41:785–800. doi: 10.1016/s0042-6989(00)00287-x. [DOI] [PubMed] [Google Scholar]
- 40.Meeker WQ, Escobar LA. Teaching about approximate confidence regions based on maximum likelihood estimation. Am Stat. 1995;49:48–53. [Google Scholar]
- 41.Milner B. Effects of different brain lesions on card sorting. Arch Neurol. 1963;9:90–100. [Google Scholar]
- 42.Moore T, Fallah M. Control of eye movements and spatial attention. Proc Natl Acad Sci USA. 2001;98:1273–1276. doi: 10.1073/pnas.021549498. [DOI] [PMC free article] [PubMed] [Google Scholar]
- 43.Murata A, Gallese V, Kaseda M, Sakata H. Parietal neurons related to memory-guided hand manipulation. J Neurophysiol. 1996;75:2180–2186. doi: 10.1152/jn.1996.75.5.2180. [DOI] [PubMed] [Google Scholar]
- 44.Murata A, Fadiga L, Fogassi L, Gallese V, Raos V, Rizzolatti G. Object representation in the ventral premotor cortex (area F5) of the monkey. J Neurophysiol. 1997;78:2226–2230. doi: 10.1152/jn.1997.78.4.2226. [DOI] [PubMed] [Google Scholar]
- 45.Newsome WT, Pare EB. A selective impairment of motion perception following lesions of the middle temporal visual area (MT). J Neurosci. 1988;8:2201–2211. doi: 10.1523/JNEUROSCI.08-06-02201.1988. [DOI] [PMC free article] [PubMed] [Google Scholar]
- 46.Pasternak T, Merigan WH. Motion perception following lesions of the superior temporal sulcus in the monkey. Cereb Cortex. 1994;4:247–259. doi: 10.1093/cercor/4.3.247. [DOI] [PubMed] [Google Scholar]
- 47.Pelli DG. The VideoToolbox software for visual psychophysics: transforming numbers into movies. Spat Vis. 1997;10:437–442. [PubMed] [Google Scholar]
- 48.Quick RF., Jr A vector-magnitude model of contrast detection. Kybernetik. 1974;16:65–67. doi: 10.1007/BF00271628. [DOI] [PubMed] [Google Scholar]
- 49.Ratcliff R, Rouder JN. Modeling response times for two-choice decisions. Psychol Sci. 1998;9:347–356. [Google Scholar]
- 50.Rizzolatti G, Fadiga L, Gallese V, Fogassi L. Premotor cortex and the recognition of motor actions. Brain Res Cogn Brain Res. 1996;3:131–141. doi: 10.1016/0926-6410(95)00038-0. [DOI] [PubMed] [Google Scholar]
- 51.Robinson DA. A method of measuring eye movement using a scleral search coil in a magnetic field. IEEE Trans Biomed Eng. 1963;10:137–145. doi: 10.1109/tbmel.1963.4322822. [DOI] [PubMed] [Google Scholar]
- 52.Robinson DA. Eye movements evoked by collicular stimulation in the alert monkey. Vision Res. 1972;12:1795–1808. doi: 10.1016/0042-6989(72)90070-3. [DOI] [PubMed] [Google Scholar]
- 53.Robinson DA, Fuchs AF. Eye movements evoked by stimulation of frontal eye fields. J Neurophysiol. 1969;32:637–648. doi: 10.1152/jn.1969.32.5.637. [DOI] [PubMed] [Google Scholar]
- 54.Roitman JD, Shadlen MN. Response of neurons in the lateral intraparietal area during a combined visual discrimination reaction time task. J Neurosci. 2002;22:9475–9489. doi: 10.1523/JNEUROSCI.22-21-09475.2002. [DOI] [PMC free article] [PubMed] [Google Scholar]
- 55.Romo R, Salinas E. TOUCH AND GO: decision-making mechanisms in somatosensation. Annu Rev Neurosci. 2001;24:107–137. doi: 10.1146/annurev.neuro.24.1.107. [DOI] [PubMed] [Google Scholar]
- 56.Salzman CD, Newsome WT. Neural mechanisms for forming a perceptual decision. Science. 1994;264:231–237. doi: 10.1126/science.8146653. [DOI] [PubMed] [Google Scholar]
- 57.Salzman CD, Murasugi CM, Britten KH, Newsome WT. Microstimulation in visual area MT: effects on direction discrimination performance. J Neurosci. 1992;12:2331–2355. doi: 10.1523/JNEUROSCI.12-06-02331.1992. [DOI] [PMC free article] [PubMed] [Google Scholar]
- 58.Schall JD. Neural basis of deciding, choosing and acting. Nat Rev Neurosci. 2001;2:33–42. doi: 10.1038/35049054. [DOI] [PubMed] [Google Scholar]
- 59.Schall JD, Bichot NP. Neural correlates of visual and motor decision processes. Curr Opin Neurobiol. 1998;8:211–217. doi: 10.1016/s0959-4388(98)80142-6. [DOI] [PubMed] [Google Scholar]
- 60.Schiller PH, Sandell JH. Interactions between visually and electrically elicited saccades before and after superior colliculus and frontal eye field ablations in the rhesus monkey. Exp Brain Res. 1983;49:381–392. doi: 10.1007/BF00238780. [DOI] [PubMed] [Google Scholar]
- 61.Schlag J, Schlag-Rey M, Dassonville P. Interactions between natural and electrically evoked saccades. II. At what time is eye position sampled as a reference for the localization of a target? Exp Brain Res. 1989;76:548–558. doi: 10.1007/BF00248911. [DOI] [PubMed] [Google Scholar]
- 62.Shadlen MN, Newsome WT. Neural basis of a perceptual decision in the parietal cortex (area LIP) of the rhesus monkey. J Neurophysiol. 2001;86:1916–1936. doi: 10.1152/jn.2001.86.4.1916. [DOI] [PubMed] [Google Scholar]
- 63.Shadlen MN, Britten KH, Newsome WT, Movshon JA. A computational analysis of the relationship between neuronal and behavioral responses to visual motion. J Neurosci. 1996;16:1486–1510. doi: 10.1523/JNEUROSCI.16-04-01486.1996. [DOI] [PMC free article] [PubMed] [Google Scholar]
- 64.Shen L, Alexander GE. Neural correlates of a spatial sensory-to-motor transformation in primary motor cortex. J Neurophysiol. 1997;77:1171–1194. doi: 10.1152/jn.1997.77.3.1171. [DOI] [PubMed] [Google Scholar]
- 65.Sparks DL, Hartwich-Young R. The deep layers of the superior colliculus. Rev Oculomot Res. 1989;3:213–255. [PubMed] [Google Scholar]
- 66.Sparks DL, Mays LE. Spatial localization of saccade targets. I. Compensation for stimulation-induced perturbations in eye position. J Neurophysiol. 1983;49:45–63. doi: 10.1152/jn.1983.49.1.45. [DOI] [PubMed] [Google Scholar]
- 67.Taira M, Mine S, Georgopoulos AP, Murata A, Sakata H. Parietal cortex neurons of the monkey related to the visual guidance of hand movement. Exp Brain Res. 1990;83:29–36. doi: 10.1007/BF00232190. [DOI] [PubMed] [Google Scholar]
- 68.Tehovnik EJ. Electrical stimulation of neural tissue to evoke behavioral responses. J Neurosci Methods. 1996;65:1–17. doi: 10.1016/0165-0270(95)00131-x. [DOI] [PubMed] [Google Scholar]
- 69.Tehovnik EJ, Slocum WM, Schiller PH. Behavioural conditions affecting saccadic eye movements elicited electrically from the frontal lobes of primates. Eur J Neurosci. 1999;11:2431–2443. doi: 10.1046/j.1460-9568.1999.00665.x. [DOI] [PubMed] [Google Scholar]
- 70.Wallis JD, Anderson KC, Miller EK. Single neurons in prefrontal cortex encode abstract rules. Nature. 2001;411:953–956. doi: 10.1038/35082081. [DOI] [PubMed] [Google Scholar]
- 71.Watson AB. Probability summation over time. Vision Res. 1979;19:515–522. doi: 10.1016/0042-6989(79)90136-6. [DOI] [PubMed] [Google Scholar]
- 72.Wurtz RH, Sommer MA, Pare M, Ferraina S. Signal transformations from cerebral cortex to superior colliculus for the generation of saccades. Vision Res. 2001;41:3399–3412. doi: 10.1016/s0042-6989(01)00066-9. [DOI] [PubMed] [Google Scholar]
- 73.Zhang J, Riehle A, Requin J, Kornblum S. Dynamics of single neuron activity in monkey primary motor cortex related to sensorimotor transformation. J Neurosci. 1997;17:2227–2246. doi: 10.1523/JNEUROSCI.17-06-02227.1997. [DOI] [PMC free article] [PubMed] [Google Scholar]
- 74.Zohary E, Shadlen MN, Newsome WT. Correlated neuronal discharge rate and its implications for psychophysical performance. Nature. 1994;370:140–143. doi: 10.1038/370140a0. [DOI] [PubMed] [Google Scholar]