

Abstract
We detected and mapped a dynamically spreading wave of gray matter loss in the brains of patients with Alzheimer's disease (AD). The loss pattern was visualized in four dimensions as it spread over time from temporal and limbic cortices into frontal and occipital brain regions, sparing sensorimotor cortices. The shifting deficits were asymmetric (left hemisphere > right hemisphere) and correlated with progressively declining cognitive status (p< 0.0006). Novel brain mapping methods allowed us to visualize dynamic patterns of atrophy in 52 high-resolution magnetic resonance image scans of 12 patients with AD (age 68.4 ± 1.9 years) and 14 elderly matched controls (age 71.4 ± 0.9 years) scanned longitudinally (two scans; interscan interval 2.1 ± 0.4 years). A cortical pattern matching technique encoded changes in brain shape and tissue distribution across subjects and time. Cortical atrophy occurred in a well defined sequence as the disease progressed, mirroring the sequence of neurofibrillary tangle accumulation observed in cross sections at autopsy. Advancing deficits were visualized as dynamic maps that change over time. Frontal regions, spared early in the disease, showed pervasive deficits later (>15% loss). The maps distinguished different phases of AD and differentiated AD from normal aging. Local gray matter loss rates (5.3 ± 2.3% per year in AD v 0.9 ± 0.9% per year in controls) were faster in the left hemisphere (p < 0.029) than the right. Transient barriers to disease progression appeared at limbic/frontal boundaries. This degenerative sequence, observed in vivo as it developed, provides the first quantitative, dynamic visualization of cortical atrophic rates in normal elderly populations and in those with dementia.
Keywords: Alzheimer's disease, aging, dementia, magnetic resonance imaging, brain mapping, imaging, longitudinal, cortex
Introduction
Strategies to chart how Alzheimer's disease (AD) spreads dynamically in the brain are vital for understanding how it progresses and for mapping treatment effects. A dynamic map of AD could uncover the path of degeneration for different brain systems and define a powerful biological marker for clinical trials. Such brain maps would visualize the order in which cortical systems are affected in living populations and identify how changes correlate with cognitive decline.
This study used serial brain imaging and cortical mapping to visualize how AD spreads spatially and temporally in the brain. It reveals anatomically selective, stage-specific deficits. It also allows us to visualize the sequence in which deficits appear. It also provides the first detailed, three-dimensional (3D) quantitative maps of cortical gray matter and whole brain changes over time in any disease.
In early AD, intraneuronal filamentous deposits, or neurofibrillary tangles (NFTs), accumulate within neurons. These deposits are composed of hyperphosphorylated tau-protein (Hulstaert et al., 1999). This cellular pathology disrupts axonal transport and induces widespread metabolic decline. The resulting neuronal loss is observable as gross atrophy with magnetic resonance imaging (MRI). Temporoparietal association cortices and the medial temporal lobe are severely atrophied in AD (DeCarli, 2000), with the entorhinal cortex and hippocampus the earliest and most severely affected (Janke et al., 2001; Thompson et al., 2001b). Profound atrophy is also observed in the posterior cingulate gyrus and adjacent precuneus. Specific atrophic patterns differentiate AD from frontotemporal, semantic, and Lewy body dementias (O'Brien et al., 2001; Studholme et al., 2001). Patients with AD show minimal primary visual, sensorimotor, and frontal atrophy until late in the disease. Before symptom onset in AD, and also in those at genetic risk, gray matter loss is detectable in the anterior hippocampal/amygdala region (Lehtovirta et al., 2000; Reiman et al., 2001).
Of particular interest is the temporal sequence of deficits in AD because they spread across the cortex. Braak and Braak (1997)noted at autopsy that NFT distribution was initially restricted to entorhinal cortices, spreading to higher-order temporoparietal association cortices, then to frontal, and ultimately, to primary sensory and visual areas (Delacourte et al., 1999; Price and Morris, 1999).
We set out to determine whether a similar wave of cortical atrophy could be mapped in patients while they were alive. The goal was to visualize the transit of the disease within cortex and relate it to cognitive decline. Recently, we used dynamic brain mapping to uncover the trajectory of cortical change as schizophrenia develops in the teenage brain (Thompson et al., 2001d) and as normal adolescents lose gray matter (Sowell et al., 2001). In dementia, we expected a similarly selective profile of brain changes, instead emerging from temporal cortices and sparing primary cortices until late in the disease. We also hypothesized first that frontal and association cortices would be progressively enveloped as cognitive function declined, and second, that the pathology would evolve differently in each brain hemisphere, with the left hemisphere engulfed earlier and more severely than the right.
Materials and Methods
Subjects
Over a time interval of 3 years, we used longitudinal MRI scanning (two scans, baseline, and follow-up) and cognitive testing to study a group of subjects with AD as their disease progressed. A second, demographically matched group of healthy, elderly control subjects was also imaged longitudinally (two scans) as they aged. The AD subject group consisted of 12 patients who were scanned twice (six men, six women; mean age ± SE at first scan 68.4 ± 1.9 years; at final scan, 69.8 ± 2.0 years; mean interval between first and last scans, 1.5 ± 0.3 years). These patients were diagnosed with AD using criteria listed in the Diagnostic and Statistical Manual of Mental Disorders (American Psychiatric Association, 2000), and they had a typical clinical presentation. They also fulfilled the standards for probable AD according to criteria established by the National Institute of Neurological Disorders and Stroke and the Alzheimer's Disease and Related Disorders Association (McKhann et al., 1984). All patients were reassessed at intervals of 3–6 months with a full clinical evaluation, and their cognitive status was evaluated using the Mini-Mental State Exam (MMSE) (Folstein et al., 1975). During the study, subjects' cognitive status declined rapidly from an initial MMSE score of 17.7 ± 1.9 to 12.9 ± 2.5 (mean change 5.5 ± 1.9 points; p < 0.00054, one-tailed t test; maximum score 30). This corresponds approximately to a transition from moderate to severe AD. At the same time, a group of 14 healthy elderly controls was scanned twice (seven men, seven women; age at first scan 71.4 ± 0.9 years; age at final scan 74.0 ± 0.9 years; mean interval between first and last scans 2.6 ± 0.3 years). During the study, the control subjects' cognitive status remained stable. Their MMSE score was 29.5 ± 0.3 at both baseline and follow-up, with no change.
Exclusion criteria for the two groups included the presence of white matter lesions on T2-weighted MRI scans, preexisting psychiatric illness or head injury, and history of substance abuse or depression as measured by the Geriatric Depression Scale (Yesavage, 1988). All subjects were right-handed. Informed consent was obtained from all participants before scanning. AD and control samples consisted of subjects who were entirely different from the group of patients with AD and controls from whom data were reported in our previous cross-sectional study (Thompson et al., 2001b). Three disease stages were effectively mapped in this new, longitudinal sample. These broadly correspond to healthy aging and the transition from moderate to severe AD (with MMSE scores of 29, 18, and 13, respectively).
MRI scanning
Patients and controls were scanned identically with the same scanning protocol over time. Each subject underwent two MRI scans separated by >1 year. Images were acquired on a 2 Tesla Bruker Medspec S200 whole-body scanner (Bruker Medical, Ettingen, Germany) at the Centre for Magnetic Resonance (University of Queensland, Australia). A linearly polarized birdcage head-coil (Bruker Medical) was used for signal reception. Three-dimensional T1-weighted images were acquired with an inversion recovery segmented 3D gradient echo sequence (known as magnetization prepared rapid gradient echo; MP-RAGE) to resolve anatomy at high resolution. Acquisition parameters were as follows: inversion time (TI)/repetition time (TR)/echo time (TE) = 850/1000/8.3 msec; flip angle = 20°; 32 phase-encoding steps per segment; a 23 cm field of view. Images were acquired in an oblique plane perpendicular to the long axis of the hippocampus (Jack et al., 1998), with an acquisition matrix of 256 × 256 × 96, and zero-filled to 2563.
Image processing and analysis
Serial images acquired across the 2 year time span were processed as follows. Briefly, for each scan, a radio frequency bias field correction algorithm eliminated intensity drifts attributable to scanner field inhomogeneity, using a histogram spline sharpening method (Sled et al., 1998). Images were then normalized by transforming them to a standard 3D stereotaxic space in a two-step process that retained information on brain change over time. First, each initial T1-weighted scan was aligned linearly (registered) to a standard brain imaging template (International Consortium for Brain Mapping nonlinear average brain template, ICBM152) (Evans et al., 1994) with automated image registration software (Collins et al., 1994). Follow-up scans were then rigidly aligned to the baseline scan from the same subject (Collins et al., 1994). These mutually registered scans for each patient were then linearly mapped into ICBM space by combining the intrapatient transform with the previously computed transform to stereotaxic space.
Tissue maps
To equalize image intensities across subjects, registered scans were matched by histogram. A supervised tissue classifier generated detailed maps of gray matter, white matter, and CSF. Briefly, 120 samples of each tissue class were interactively tagged to compute the parameters of a Gaussian mixture distribution that reflects statistical variability in the intensity of each tissue type (Zijdenbos and Dawant, 1994). A nearest-neighbor tissue classifier assigned each image voxel to a particular tissue class (gray, white, or CSF) or to a background class (representing extracerebral voxels in the image). The inter-rater and intra-rater reliability of this protocol, and its robustness to changes in image acquisition parameters, have been described previously (Sowell et al., 1999). Gray and white matter maps were retained for subsequent analysis.
Three-dimensional cortical maps
A surface model of the cortex was automatically extracted (MacDonald et al., 2000) for each subject and time point as described in our previous studies (Thompson et al., 2001c). This software creates a mesh-like surface that is continuously deformed to fit a cortical surface tissue threshold intensity value from the brain volume. The software was modified to permit high-resolution extraction of both the lateral and medial hemispheric surfaces, including the cingulate, primary visual cortex, and corpus callosum (Fig.1). The intensity threshold was defined as the MRI signal value that best differentiated cortical CSF on the outer surface of the brain from the underlying cortical gray matter.
Fig. 1.
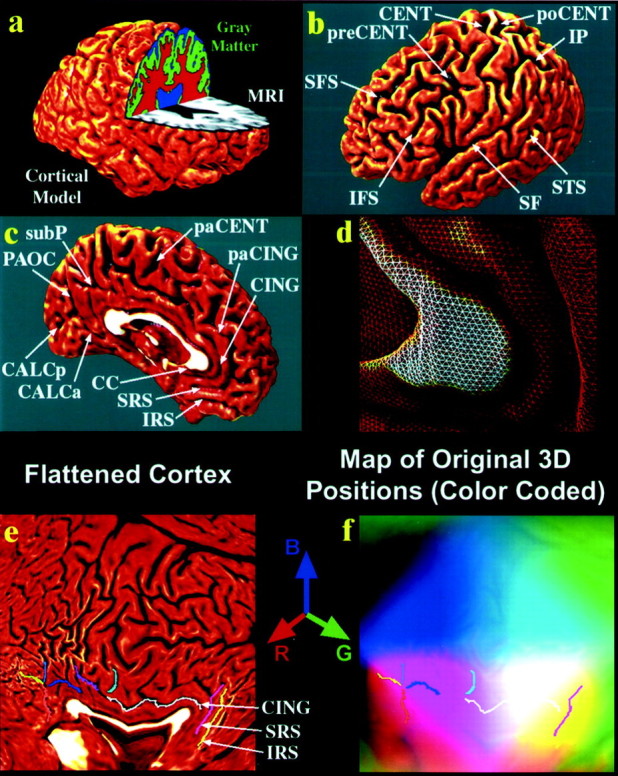
. Creating 3D average cortical models and maps in populations of elderly people and those with AD: cortical flattening. Using a cortical flattening process (a–f) and sulcal matching techniques (Fig. 2), an average model of the cortex (Fig. 2f) can be built for a group of subjects. The goal of this process is to allow data (such as gray matter volumes) to be averaged from corresponding regions of cortex across subjects, reinforcing features that occur consistently. Briefly, the individual MRI scan (a,gray) is processed to split it up into gray matter (green), white matter (red), and cerebrospinal fluid (blue). A 3D cortical surface model (a) is extracted from the scan, and the following sulci are traced as 3D curves directly on this surface model.b, c, Superior and inferior frontal (SFS, IFS), precentral and postcentral (preCENT, poCENT), central (CENT), intraparietal (IP), superior temporal (STS), Sylvian fissures (SF), paracentral (paCENT), cingulate (CING) and paracingulate (paCING), subparietal (subP), callosal (CC), superior and inferior rostral (SRS, IRS), parieto-occipital (PAOC), and anterior and posterior calcarine (CALCa/CALCp) sulci. Because the surface is made up of discrete triangular tiles (d), a process of geometrical flattening can be applied to lay out the cortical regions, and the sulcal curves that delimit them, as features in 2D (e). Information on where these cortical points originally came from in 3D can still be saved in this 2D image format. Using a color-coding system, cortical point 3D locations (x,y, z) are given unique colors (with intensities of red, green, andblue proportional to x, y, and z, respectively), and these colors are plotted into the flat map. These color images represent the cortical shape and are used in Figure 2 to compute information on cortical pattern differences across subjects and to make an “average shape” cortex for a group of subjects.
Cortical pattern matching
An image analysis technique known as cortical pattern matching was used to better localize disease effects on cortical anatomy over time and to increase the power to detect systematic changes. The approach models and controls for gyral pattern variations across subjects, and it visualizes average maps of cortical change in a population and encodes its variance and any group differences.
On the basis of cortical models for each subject at different time points, a 3D deformation vector field was computed measuring shape change in the brain surface across the time interval (Thompson et al., 2001c). This directly accommodates any brain shape changes when comparing cortical gray matter within a subject across time. The deformation reconfigures the earlier cortex into the shape of the later one, matching the entire gyral patterns and cortical surfaces in the pair of 3D image sets.
Matching cortical anatomy across subjects. A second deformation was computed that matches gyral patterns across all the subjects in the study as well as the deformation that matches anatomy over time. This allows data to be averaged and compared across corresponding cortical regions [the algorithm for this is described inThompson et al. (2000a,b)]. As shown in Figure 1, a large set of 72 sulcal landmarks per brain is used to constrain the mapping of one cortex onto another. This associates corresponding cortical regions across subjects. An image analyst (K.M.H.) who was blind to subject diagnosis, gender, and age traced each of 30 sulci in each hemisphere on the surface rendering of each subject's brain (13 on the medial surface, 17 on the lateral surface). On the lateral brain surface these included the Sylvian fissure; central, precentral, and postcentral sulci; superior temporal sulcus (STS) main body, STS ascending branch, and STS posterior branch; primary and secondary intermediate sulci; and inferior temporal, superior and inferior frontal, intraparietal, transverse occipital, olfactory, occipitotemporal, and collateral sulci. On the medial surface these included the callosal sulcus, the inferior callosal outline, the paracentral sulcus, anterior and posterior cingulate sulci, the outer segment of a double parallel cingulate sulcus (where present) (Ono et al., 1990), the superior and inferior rostral sulci, the parieto-occipital sulcus, the anterior and posterior calcarine sulci, and the subparietal sulcus. In addition to contouring the major sulci, a set of six midline landmark curves bordering the longitudinal fissure was outlined in each hemisphere to establish hemispheric gyral limits. Spatially registered gray scale image volumes in coronal, axial, and sagittal planes were available simultaneously to help disambiguate brain anatomy. Landmarks were defined according to a detailed anatomical protocol (Steinmetz et al., 1990; Leonard, 1996; Sowell et al., 2001; Hayashi et al., 2002) based on the Atlas of the Cerebral Sulci (Ono et al., 1990). This protocol is available on the internet (Hayashi et al., 2002) and has known inter-rater and intra-rater reliability, as reported previously (Sowell et al., 2001).
Average cortical model construction. To create an average 3D cortical model for each group of subjects (e.g., elderly normal or AD), the following steps were used (Figs. 1,2) [for details, see Thompson et al. (2001)]. For each subject, all sulcal/gyral landmarks (Fig.1b,c) were flattened into a 2D plane along with the cortical model (Fig. 1e). Technical issues of minimal distortion and the computation of these flat mappings are addressed inThompson et al. (2001c). A color code (Fig. 1f) retains the original 3D position of each cortical point as a red, green, and blue color triplet plotted in the 2D parameter space (Fig.1f). Once data are in this flat space, sulcal features are aligned across subjects with a warping technique. To illustrate this process, Figure 2a shows part of the flat map of one subject and its corresponding color code (Fig.2c). An average set of sulcal curves, derived from many subjects, is overlaid on the flat map (Fig. 2a). These maps are warped (Fig. 2b) so that individual sulcal features in them are driven into correspondence with the average set of sulcal curves. Figure 2d shows how this warping process affects a regular grid ruled over an individual color-coded flat map. The warped color images (Fig. 2d) from many subjects are averaged together pixel by pixel and decoded; it can be shown mathematically that this image averaging creates a crisp average cortical model with gyral features in their mean anatomic locations (Fig.2f) (Thompson and Toga, 1997; Thompson et al., 2000a,b). The point of this procedure is that the computational matching of sulci avoids destructive cancellation of features (Fischl et al., 1999). This cancellation happens when images are directly averaged together (Fig. 2e). Common features, reinforced in the group average, appear in their group mean anatomic locations (Fig.2f). It is important to note that local measures of gray matter density (see below) (Fig. 3) may be convected along with these warps and plotted on the average cortex, before statistical analysis. Confounding effects of cross-subject anatomical variance are greatly reduced, thereby empowering detection of disease effects.
Fig. 2.
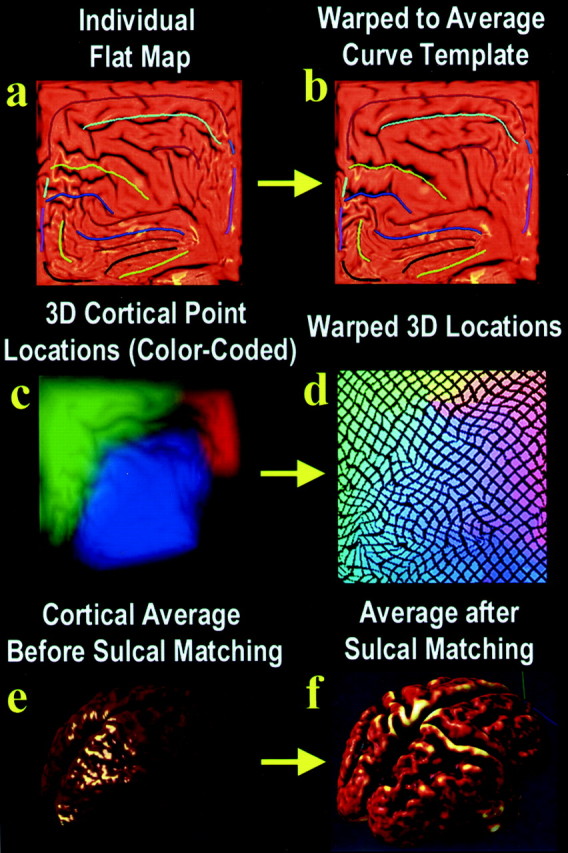
. Creating 3D average cortical models and maps in elderly populations and those with AD: sulcal matching. The idea behind sulcal matching is to average cortical data from corresponding regions across subjects, accommodating sulcal pattern differences across subjects using an elastic warping process. Briefly, the sulcal curves from all the subjects in the study are flattened, and their shapes are averaged across subjects to make an average set of sulcal curves (a). The sulcal pattern of each individual, as seen in the individual's flattened cortical map (a), differs a little from this average set of curves. A 2D elastic deformation can be applied to an individual's flat map, which drives its features into exact correspondence with the average set of sulcal curves (b). This same deformation can be applied to the color-coded image (c) that stores 3D cortical positions from that individual (see Fig. 1 for an explanation). Images such asc or d can be averaged, pixel by pixel, across all subjects in a group and then decoded to produce a 3D shape. If this is performed before sulcal matching on images such asc, a smooth cortex results (e). It is intriguing that if it is performed on warped color images such asd, a crisp average cortex results, which reinforces group features in their mean anatomic locations (f). This process can create average cortical models for a group of subjects, but it can also transfer cortical data (such as gray matter density information) from many subjects onto a common cortical surface for comparison. In doing so, it accommodates complex differences in cortical patterning across subjects.
Fig. 3.
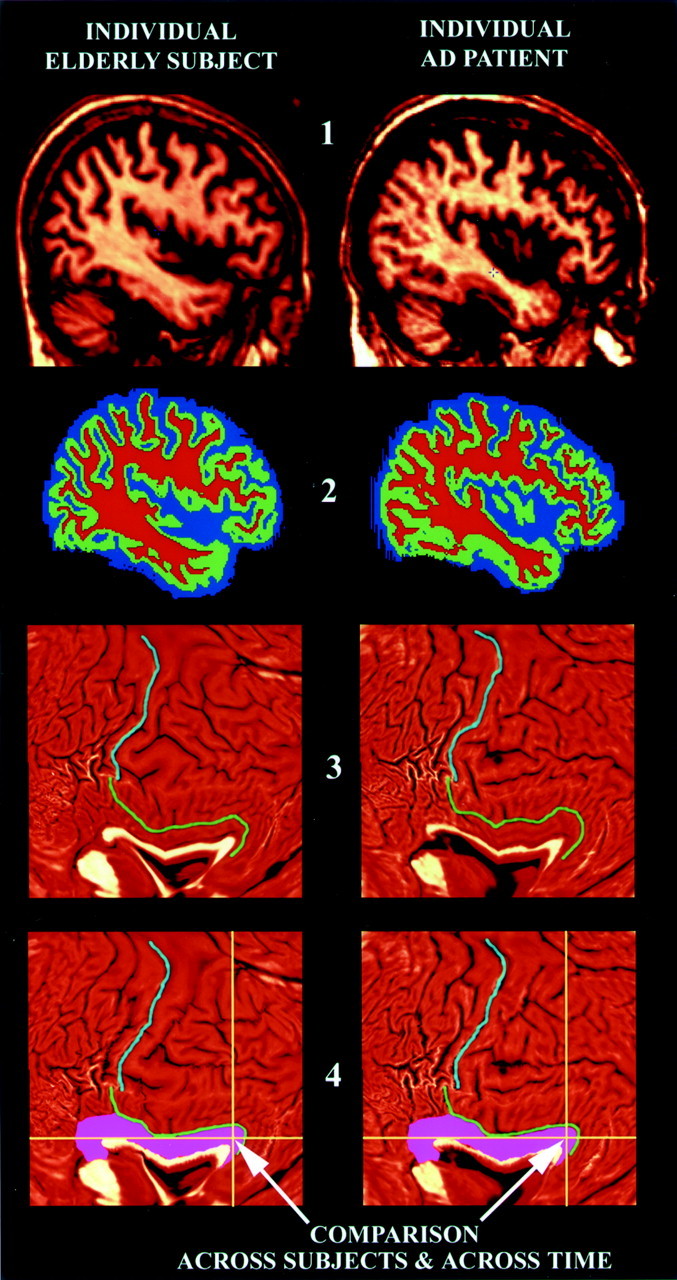
. Image processing steps applied to individual scans in this study. This flow chart illustrates the key steps used to process the MRI brain scans in this study. They are illustrated here on example brain MRI data sets from a healthy control subject (left) and from a patient with AD (right). First, the MRI images (stage 1) have extracerebral tissues deleted from the scans, and the individual pixels are classified as gray matter, white matter, or CSF (shown ingreen, red, and blue; stage 2). After flattening a 3D geometric model of the cortex (stage 3), features such as the central sulcus (light blue curve) and cingulate sulcus (green curve) may be reidentified. An elastic warp is applied (stage 4), thereby moving these features and entire gyral regions (pink) into the same reference position in flat space. After aligning sulcal patterns from all individual subjects, group comparisons can be made at each 2D pixel (yellow cross-hairs) that effectively compare gray matter measures across corresponding cortical regions. In this study, the cortical measure that is compared across groups and over time is the amount of gray matter (stage 2) lying within 15 mm of each cortical point. The results of these statistical tests can then be plotted back onto an average 3D cortical model made for the group (Fig. 1), and the findings can be visualized as a color-coded map (Figs. 4-8).
Averaging cortical gray matter maps. Given that the deformation maps associate cortical locations with the same relation to the primary folding pattern across subjects, a local measurement of gray matter density was made in each subject and averaged across equivalent cortical locations. To quantify local gray matter, we used a measure termed gray matter density, which has been used in many previous studies to compare the spatial distribution of gray matter across subjects (Wright et al., 1995; Bullmore et al., 1999; Sowell et al., 1999; Ashburner and Friston, 2000; Mummery et al., 2000; Rombouts et al., 2000; Baron et al., 2001; Good et al., 2001; Thompson et al., 2001a,b). This measures the proportion of gray matter in a small region of fixed radius (15 mm) around each cortical point. Given the large anatomic variability in some cortical regions, high-dimensional elastic matching of cortical patterns (Thompson et al., 2000a,b,2001a) was used to associate measures of gray matter density from homologous cortical regions first across time and then also across subjects (Fig. 3). One advantage of cortical matching is that it localizes deficits relative to gyral landmarks; it also averages data from corresponding gyri, which would be impossible if data were mapped only linearly into stereotaxic space. Annualized 4D maps of gray matter loss rates within each subject were elastically realigned for averaging and comparison across diagnostic groups (Fig. 4).
Fig. 4.

. Average gray matter loss rates in healthy aging and AD. The maps show the average local rates of loss for gray matter, in groups of controls (top,a–d) and patients with AD (bottom, e–h). Loss rates are <1% per year in controls. They are significantly higher in AD and strongest in frontal and temporal regions (g, h) at this stage of AD (as the MMSE score falls from 18 to 13).
Mapping gray matter loss
Statistical maps were generated indicating locally the degree to which gray matter loss rates were statistically linked with diagnosis and cognitive performance (MMSE scores) (Fig.5). To do this, at each cortical point, a multiple regression was run to assess whether the gray matter loss rate at that point depended on the covariate of interest (e.g., test scores, diagnosis). The p value describing the significance of this linkage was plotted at each point on the cortex using a color code to produce a statistical map (Figs. 5, 6,7).
Fig. 5.

Mapping links between cognitive performance and changing brain structure. These maps show the significance of the linkage between gray matter reductions and cognition, as measured by MMSE score. Variations in temporal, parietal, and ultimately frontal (e) tissue are linked with cognitive status. Less gray matter is strongly correlated with worse cognitive performance, in all regions with prominent deficits. Linkages are detected most strongly in the left hemisphere medial temporoparietal zones (d). As expected, no linkages are found with sensorimotor gray matter variation (b), which was not in significant deficit in late AD.
Fig. 6.

Mapping early and late deficits in AD. Deficits occurring during the development of AD are detected by comparing average profiles of gray matter between patients and controls at their first scan (mean MMSE = 18; top) and their follow-up scan 1.5 years later (mean MMSE = 13;bottom). The average percentage loss in patients is shown in the right four panels, and the significance of this loss is shown in the left four panels. Although severe temporal lobe loss (T) and parietal loss have already occurred at baseline (top) and subsequently continue (Fig. 4), the frontal deficits characteristic of late AD are not found until significant cognitive decline has occurred (bottom). A process of fast attrition occurs over the 1.5 years after the baseline scan. Note the relative sparing of sensorimotor cortices at both disease stages (S/M). Regionally significant effects are codedred and assessed by permutation, which corrects for multiple comparisons.
Fig. 7.
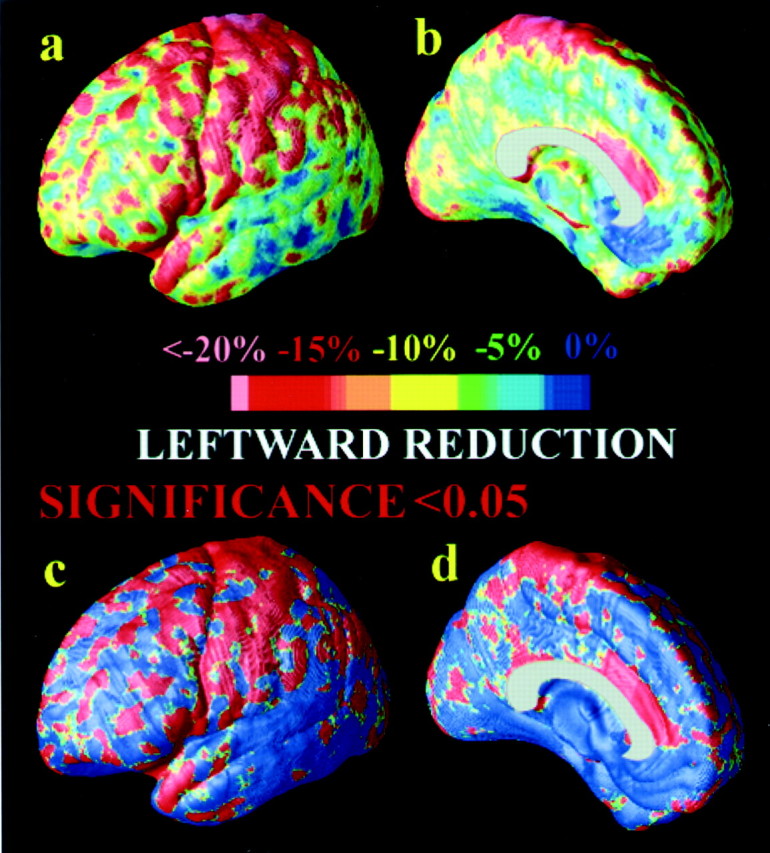
. Gray matter asymmetry in healthy controls. The asymmetric loss of gray matter in AD (left hemisphere faster than right) compounds an existing asymmetry in the distribution of gray matter, observed here in healthy controls (a,b). Here, control subjects show an average 15–20% less gray matter in sensorimotor regions (a), which is highly significant (c). These maps are computed by comparing the average gray matter maps on the leftand the right and taking their ratio (L/R). Comparisons are made after adjusting for both cortical pattern differences across subjects and gyral pattern asymmetries, using cortical pattern matching (Fig.2).
Permutation testing. Maps identifying these linkages were computed pointwise across the cortex and assessed statistically by permutation. We preferred this process over using an analytical null distribution to avoid assuming that the smoothness tensor of the residuals of the statistical model were stationary across the cortical surface. The presence of significant effects in maps of statistics can be tested typically using parametric inference based on Gaussian random field theory (Friston et al., 1996) or by nonparametric (e.g., permutation) methods, both of which have been applied widely in functional (Holmes et al., 1996) and structural brain imaging (Bullmore et al., 1999; Sowell et al., 1999). We used permutation here to avoid making assumptions about the spatial covariance of the residuals (Nichols and Holmes, 2002) and to avoid complex corrections for data localized on surfaces [for a discussion of this issue, see Thompson et al. (2000a,b)]. Permutation methods, used here, measure the distribution of features in statistical maps (such as the area with statistics above a predetermined threshold) that would be observed by accident if the subjects were randomly assigned to groups. This computed distribution is then used to compare the features that occurred in the true experiment with those that occurred by accident in the random groupings. A ratio is computed describing what fraction of the time an effect of similar or greater magnitude to the real effect occurs in the random assignments. This is the chance of the observed pattern occurring by accident. This fraction provides an overall significance value for the map (corrected for multiple comparisons) (Nichols and Holmes, 2002).
To define a corrected significance value (i.e., an overall pvalue) for a map, we established a primary threshold ofp = 0.01 for all significance maps and measured the total area of the cortex with statistics more significant, at a voxel level, than this threshold [as in previous work, for example, Sowell et al. (2001)]. This threshold (p = 0.01) was chosen a priori on the basis of our previous work in an independent, cross-sectional sample (Thompson et al., 2001b) to optimize detection of broad, diffuse effects. The previous study suggested that large areas of cortex would be diffusely affected at a voxel-wise significance level stronger than 0.01. The total area of the suprathreshold regions on the surface was computed. This area measure was used in the permutation tests to control the number of false positives per map. A total suprathreshold area statistic was chosen rather than a measure of cluster extent or peak height (Friston et al., 1996) to sensitize the permutation test to the detection of subtle but diffuse effects that occur over large (and possibly disconnected) regions of cortex. Despite the selection of a low significance threshold at the voxel level to define clusters, the overallp value for the map still controls for type I error, because the threshold to define significant clusters is the same in the real and in the null simulations from which the permutation distribution is drawn. The total area of the average surface with suprathreshold statistics was used rather than the number of surface vertices with suprathreshold statistics because the total area is invariant to the sampling density of points on the surface (so long as the surface is sufficiently highly sampled).
Control for multiple comparisons. In this type of statistical map, the number of tests that are computed is 65,536 per hemisphere, because this is the number of vertices in the surface model of each cortical hemisphere. However, these tests are highly correlated, and the spatial covariance of their residuals is incorporated into the null distribution; this controls for the number of independent tests (Thompson et al., 2000a,b).
Specification of a region of interest. Because we expected highly significant effects, we did not in general restrict the anatomical search space for the permutation tests, as is common in functional imaging (Friston et al., 1996). Permutations were conducted over the entire hemisphere (this results in conservative control over type I error, because features anywhere on the cortex enter the null distribution). Left and right hemispheres were assessed separately. In one case, we assessed whether the medial surface was affected. To do this we created a volume of interest (or search region) that contained the medial hemispheric surface only, using the surface lines traced at the interhemispheric margin to define its boundary on the average surface. Suprathreshold effects in this cortical region were then assessed to compute a permutation distribution on their total area, and an overall corrected p value was derived for the medial wall effects.
In each case, the covariate vector was permuted 1 million times on an SGI RealityMonster supercomputer with 32 internal R10000 processors, and a null distribution was developed for the area of the average cortex with statistics above a fixed threshold (p < 0.01) in the significance maps. (Post hoc tests revealed that the corrected pvalues were robust to differences in the choice of this primary threshold.) An algorithm was then developed to report the significance probability for each map as a whole (Thompson et al.,2000a,b,2001a), so the significance of the loss patterns could be assessed after the appropriate correction for multiple comparisons. Separate maps were made to show average rates of loss (Fig. 5) and the significance of this loss in patients relative to controls (Fig.6a,b).
Results
Mapping average gray matter deficits in AD
In patients with AD, a highly significant gray matter deficit was observed in a broad anatomical region encompassing bilateral temporal and parietal cortices (Fig. 6a) (using permutation tests for an effect of diagnosis; p < 0.00495 left hemisphere, p < 0.0154 right hemisphere). The most significant impairments occurred in temporal and parietal regions (Fig. 6a, red), where deficits exceeded 15% (Fig. 6c). More intriguing was the anatomical specificity of the loss. A sharp division occurred in the loss maps (Fig. 6b, blue), with central and post-central gyri displaying minimal loss compared with the parietal association cortices immediately posterior to them. Primary sensory and motor cortices were comparatively spared in the disease (with a 0–5% deficit on average in the central and postcentral gyri (Fig.6b, S/M).
Figure 6e–h (bottom row) shows the average deficit pattern in AD 1.5 years later, after a rapid decline in MMSE score from 17.7 ± 1.9 to 12.9 ± 2.5 (p < 0.00054). Again, the cortex exhibits substantial gray matter loss, with deficits intensifying still further in the most severely affected regions (Fig.6e,f) (using permutation tests for an effect of diagnosis; p < 0.00027 left hemisphere,p < 0.00056 right hemisphere). Two features are apparent. First, the frontal cortices, initially only mildly affected (with 6–10% loss), are now severely affected (deficits exceeded 15% everywhere) (Fig. 6g), and second, the sensory and motor territory is still comparatively spared (Fig. 6f,blue), despite the frontal spread of the deficits.
Dynamic, four-dimensional maps
The time course of these gray matter losses, as they emerge over a period of cognitive decline lasting 1.5 years, is observed in the accompanying video sequences (see supplementary data, available at:http://www.loni.ucla.edu/∼thompson/AD_4D/dynamic.html). These 4D data were computed from the maps with a previously described algorithm (Thompson and Toga, 1997). The transit of deficits from temporoparietal into frontal cortices is dramatic and so is the sparing of sensorimotor areas.
Medial wall effects
Given the interest in early limbic changes in AD, we also mapped the loss pattern across the medial wall of the brain hemispheres (Fig.8). Again, sulcal pattern matching was used to pool information from corresponding cortical regions (e.g., cingulate) across subjects and to create the average maps of gray matter deficits in AD.
Fig. 8.

. Asymmetric deficits progressing across the medial wall in AD. Medial wall deficits in AD in the right and left hemispheres (top, a,b). Colors show the average percentage loss of gray matter relative to the control average. Profound loss engulfs the left medial wall (>15%; b,d). On the right, however, the deficits in temporoparietal and entorhinal territory (a) spread forward into the cingulate 1.5 years later (c), after a five point drop in average MMSE score. Note the prominent division between limbic and frontal zones, with different degrees of impairment (c). The corpus callosum is indicated in white; maps of gray matter change are not defined here, because it is a white matter commissure.
In the left hemisphere, the entire medial cortex was in deficit at the first scan (Fig. 8b). In the right hemisphere, we found it intriguing that the anatomy was segregated into three major systems (Fig. 8a). (1) Greatest impairment (>15%) was observed in the temporal/entorhinal regions and the parietal lobule, and, perhaps surprisingly, the adjacent occipital/visual cortices; (2) the cingulate/paralimbic belts (10 to 15% loss) were significantly but less severely affected (Fig. 8a, yellow); (3) frontal regions, and in particular orbitofrontal regions (Fig.8a), were comparatively spared (0–5% loss) (Fig.8a, blue). The left hemisphere was significantly more severely impaired than the right (p < 0.029 for disease-specific asymmetry; corrected p < 0.0018 left hemisphere, p < 0.014 right hemisphere, for the effect of diagnosis at the initial scan on the medial wall; permutation tests). Most left hemisphere regions showed a >15% deficit relative to healthy controls (Fig. 8b), consistent with our earlier cross-sectional studies in an independent sample (Thompson et al., 2001b). Both left and right hemisphere maps suggested that limbic regions are more intensely impaired than frontal cortices in AD. This remained true even late in the disease when multiple systems are severely affected (Fig. 8c). After a sharp drop in MMSE score from 18 to 13, most of the cortex was engulfed (Fig. 8,bottom) (corrected p < 0.00015 left hemisphere, corrected p < 0.00015 right hemisphere, for the effect of diagnosis on the medial wall; permutation tests). Even then, some cortical regions were mostly intact (Fig.8c, blue), specifically in the frontal and sensorimotor cortices. A frontal band (0–5% loss) was sharply delimited (Fig. 8c) from the limbic and temporoparietal regions that showed severest deficits in AD (>15% loss). This pattern is consistent with the hypothesis that AD pathology spreads centrifugally from limbic/paralimbic to higher-order association cortices (Mesulam, 2000).
Cognitive correlates
It was also important to confirm that these structural differences were functionally significant. To do this, we tested whether gray matter differences linked with differences and declines in cognitive performance, as quantified by MMSE scores. MMSE scores were lower in the AD group than in controls both initially (p< 2.85 × 10⁻⁷) and after 1.5 years (p < 2.6 × 10⁻⁸). When rates of change were considered, MMSE decline over time was highly significant in AD (p < 0.00054), whereas no changes were detected in the controls (mean change, 0.0; p > 0.05).
Highly significant linkages were found relating lower cognitive scores to greater gray matter deficits (Fig. 5). These correlations were observed in all brain regions in which there was significant loss (Fig.5a–d), including the temporalparietal and limbic cortices. Linkages were also found between frontal gray matter reduction and lower MMSE scores, but only at the later time point, when frontal gray matter was in significant deficit (Fig. 5e). As expected, no correlations were found between gray matter differences in sensory and motor cortices and cognitive performance (Fig. 5b,blue, S/M). These maps support the idea that structure/cognition effects are regionally specific in AD, at least initially (Fig. 5b). Correlations were strongest in regions with greatest average loss (left cingulate and left temporal and parietal cortices) (Fig. 5d). These correlation maps were confirmed to be significant by permutation (p < 0.0013 left hemisphere, p< 0.0028 right hemisphere, when mean MMSE score was 18, andp < 0.0028 left hemisphere, p < 0.0047 right hemisphere, when mean MMSE score had declined to 13).
Mapping rates of loss
The availability of repeat scans from the same subjects allowed rates of tissue loss to be computed locally for each subject and each location on the cortex. These changes are shown as a map (Fig. 4). This illustrates the group average rate of gray matter loss across the cortical surface, in patients and controls. Even the healthy controls showed a trend for diffuse gray matter loss (Fig. 4a–d) (p < 0.08) at an annual rate of 0.91 ± 0.92% per year overall (left hemisphere 1.16 ± 1.41% per year; right hemisphere 0.67 ± 1.25% per year). However, very few regions exceeded 1% annual gray matter loss (Fig. 4, top). This approximates the tissue loss rate seen in normal adolescence (Thompson et al., 2001d). The anatomy of the healthy controls therefore remained relatively stable, whereas their MMSE score remained unchanged at 29.5 ± 0.3.
Patients with AD lost significant gray matter (p< 0.05 for overall annual loss of gray matter) (Fig. 4e–h) and at a significantly more rapid rate than controls (p < 0.042), with a total gray matter loss rate of 5.03 ± 2.28% per year (left hemisphere 5.43 ± 3.29% per year; right hemisphere 4.64 ± 3.31% per year). Regions with a prominent 4–5% annual loss included the right cingulate, temporal, and frontal cortices bilaterally (Fig. 4, bottom row). The loss rate patterns were also more spatially diffuse than the deficit maps at baseline and follow-up (Figs. 5, 6). In summary, the leading edge of the region with significant deficits spreads somewhat centrifugally (from medial temporal/limbic to frontal regions). Nonetheless, the loss rate maps show progressively intensifying deficits at the leading edge (frontal cortex) as well as in regions that are already severely affected, (e.g., the lateral surfaces of the temporal lobes).
Loss rate asymmetries
In patients with AD, the left hemisphere lost gray matter faster than the right (0.79% per year faster) (p < 0.04). This is consistent with previous reports of the left hemisphere being more severely affected in AD, both metabolically and structurally (Friedland and Luxenberg, 1988; Loewenstein et al., 1989; Johnson et al., 1998; Janke et al., 2001; Thompson et al., 2001b). A trend for faster gray matter loss in the left hemisphere was also observed in controls (0.50% per year faster; p < 0.057).
Logically, if an asymmetric loss process had already been occurring for many years, one might expect the left hemisphere to have significantly less gray matter than the right at the baseline scan, in both patients and controls. This was confirmed to be the case. Figure 7 shows the average gray matter asymmetry in the controls, with a prominent sensorimotor region showing 15–20% less gray matter in the left hemisphere (Fig. 7a) compared with its counterpart on the right. These maps were created by subtracting the gray matter map in the left hemisphere from that on the right, in each individual, before averaging data from corresponding cortical regions across subjects. To account for gyral pattern asymmetries (Geschwind and Levitsky, 1968), this subtraction was performed after computing an additional warp in the cortical parameter space to align each subject's left and right gyral patterns. Both controls (p < 0.0069) (Fig. 7c,d) and patients (p < 0.0091) had significantly less cortical gray matter in the left hemisphere. In AD, there was also an increase in asymmetry over time (p < 0.028) in the overall quantity of gray matter (including deep nuclei as well as cortex). This was not detected in controls. In AD, the left hemisphere had 2.4% (±2.0%) less gray matter overall than the right at baseline, and 3.5% (±2.0%) less gray matter at follow-up.
This indicates faster left hemisphere cortical degeneration in AD, at least during the time interval observed in this study. When the components of this gray matter asymmetry are factored apart, the loss process in AD therefore occurs first at an asymmetric rate (left faster than right), and second, on top of a prevailing gray matter asymmetry (left less than right) observed in AD and even in healthy elderly subjects.
Whole-brain atrophic rates
Because cortical gray matter maps discriminated patients from controls so strongly (with p < 0.005 initially andp < 0.0005 at follow-up; permutation tests), we wanted to test whether simpler measures would also reveal disease-related differences or rates of change. The goal was to compare volumes and maps to see which detected losses most effectively.
Whole-brain atrophic rates (i.e., the loss rate for total cerebral volume) were found to discriminate patients and controls. Total cerebral volume was computed from the cortical models (Fig. 1), and its annual rate of change was computed for all subjects in the study. Overall cerebral volume loss rates were significantly faster in AD than in controls, with a loss rate of 5.22 ± 2.04% per year in AD (p < 2.3 × 10⁻⁵), compared with 0.88 ± 0.15% per year in controls (p < 0.013 for significant loss in controls, p < 0.003 for group difference; both hemispheres pooled). In patients with AD, the left hemisphere lost volume at 5.86 ± 8.60% per year, compared with 0.99 ± 0.59% in controls (p < 0.019 for significant loss in controls, p < 0.023 for group difference), whereas with AD the right hemisphere lost volume at 4.57 ± 5.61% per year, compared with 0.88 ± 0.46% in controls (p < 0.0083 for significant loss in controls,p < 0.0095 for group difference; all tests one-tailed). These disease effects were found in multiple regressions that controlled for age and gender (although effects of these covariates were not significant; overall multiple r = 0.48; p < 0.006). A trend for faster left hemisphere loss also was observed for cerebral volume (p < 0.055), in line with the significantly faster gray matter loss rate mapped in the left hemisphere.
To determine whether the cerebral volume loss rate was attributable primarily to gray or white matter degeneration, we also evaluated white matter loss rates. We did not find a faster white matter loss rate in AD relative to controls (p = 0.41), although both groups lost significant white matter over time (p < 0.035). The white matter loss rate in AD (3.30 ± 2.06% per year; left hemisphere 3.20 ± 2.91% per year, right hemisphere 3.40 ± 3.03% per year) was comparable with that in controls (2.72 ± 1.44% per year; left hemisphere 2.91 ± 2.09% per year, right hemisphere 2.52 ± 2.07%/year), and no asymmetries were detected (p > 0.1).
Discussion
This study used new longitudinal brain mapping techniques to chart the transit of structural deficits across the cortex in AD. When the deficit data are visualized in 4D, a dynamic, spreading wave of loss is observed. The left hemisphere was engulfed fastest, with the right after a similar sequence after a time lag. In the right hemisphere, sharp boundaries appeared in the deficit patterns at the cingulate/frontal border on the medial wall (Fig. 8c), indicating differential susceptibility, at least transiently, in mild to moderate AD. Regionally selective atrophy was found in distinct disease phases, with initial sparing of frontal and then only sensorimotor cortices. Deficits and rates of change were coupled with declining cognitive status and quantified by MMSE scores. As a supplement to clinical measures of disease progression, which can be notoriously variable (DeCarli, 2000), cortical maps quantitatively store information on changes expected in AD, offering a standard against which drug effects can be calibrated.
The path of disease progression is appreciated most clearly in the video sequences (see supplementary data). These suggest a spatially complex model of different atrophic patterns as AD progresses. Three main features are observed: (1) the overall deficit pattern spreads through the brain in a temporal–frontal–sensorimotor sequence, with a time lag in the right hemisphere; (2) the left hemisphere degenerates faster than the right, and this asymmetric loss rate increases the existing asymmetry in cortical gray matter (L<R) found in healthy elderly subjects; and (3) some phylogenetically older brain systems are spared late in the disease (e.g., sensorimotor cortices). The resultingin vivo maps differentiate AD from normal aging and visualize atrophic patterns associated with specific disease stages.
Pathology
The deficit sequence also matches the trajectory of NFT distribution observed postmortem in patients with increasing dementia severity at death (Braak and Braak, 1991, 1997). Consistent with the deficit maps observed here, NFT accumulation is minimal in sensory and motor cortices, but it occurs preferentially in entorhinal pyramidal cells, the limbic periallocortex (layers II/IV), the hippocampus/amygdala and subiculum, the basal forebrain cholinergic systems, and subsequently, in temporoparietal and frontal association cortices (layers III/V) (Pearson et al., 1985; Arnold et al., 1991). Neuropathologic studies also reveal that cortical layers III and V selectively lose large pyramidal neurons in association areas (Brun and Englund, 1981). Immunocytochemical studies report 11–50% synaptic loss in superior temporal and inferior parietal cortices in AD (Clinton et al., 1994). A heavy loss of cholinergic axons occurs, with a variable decrease in cholinoreceptive pyramidal neurons (Mesulam, 2000). Gray matter deficits may indicate a depletion in cholinoreceptive neurons and perhaps a reduced receptiveness to cholinergic therapy (Hampel et al., 2002). Gomez-Isla et al. (1997)noted that in AD, both neuronal loss and NDT density were correlated and increased in parallel with the duration and severity of illness, whereas the number of senile plaques and amyloid burden in the superior temporal sulcus were not related to neuronal loss, number of NFTs, or duration of disease.
Gray matter atrophy observed with MRI may also be attributable to a combination of processes other than, or in addition to, neuronal loss, including cell shrinkage, reduced dendritic extent, and synaptic loss (for review, see McEwen, 1997; Uylings and de Brabander, 2002). In healthy aging, age-related neuronal loss does not occur in most regions of the neocortex (Terry et al., 1987; Morrison and Hof, 1997) and appears specific to the frontal cortex (de Brabander et al., 1998) and some hippocampal regions (e.g., CA1 and the subiculum) (Simic et al., 1997). By contrast, marked neuronal loss occurs in early AD (Gomez-Isla et al., 1997), with severe early losses in layer II of the entorhinal cortex. Normal age-related cortical changes may be attributable in part to cell shrinkage (Shimada, 1999), reduced dendritic length (Flood et al., 1987; Hanks and Flood, 1991), and changes in perfusion, fat and water content, and other chemical constituents (Weinberger and McClure, 2002). Age-related dendritic reduction may be region- and lamina-specific (Uylings and Brabander, 2002). Nakamura et al. (1984) found the greatest reductions in layer V pyramidal basal dendrites with normal aging, and dentate granule cells also display significantly reduced apical dendritic length (>40% in the dentate gyrus) (Hanks and Flood, 1991). In summary, changes observed here in normal aging may primarily reflect cell shrinkage, reductions in dendritic extent, and synaptic loss; the changes in AD may reflect a combination of these processes as well as substantial neuronal loss (Gomez-Isla et al., 1997).
Metabolism
Metabolic scans in AD, acquired with [18F]-fluorodeoxyglucose positron emission tomography, show a similar deficit pattern. Decreased metabolic activity is found in temporal and parietal lobes and in the posterior cingulate cortices (Mazziotta et al., 1992; Mega et al., 1997). Frontal deficits typically occur later. These decreases predict cognitive decline rate (on the MMSE) and also survival (Jagust et al., 1996). A recent review of vascular and perfusion changes in AD (de la Torre, 2002) noted that cerebral hypoperfusion typically predates cortical hypometabolism in AD. Microvascular changes may therefore contribute to changing cortical metabolism and neocortical atrophy in AD, because these changes progress in a similar sequence.
It is interesting that gray matter loss at autopsy is predominantly cortical in patients with AD who are <80 years of age (Hubbard and Anderson, 1981). This induces corpus callosum (Thompson et al., 1998;Hampel et al., 2002) and thalamic atrophy (Jernigan et al., 1991), leading to a widespread cortical disconnection syndrome. The transition of AD pathology into frontal association cortices suggests a degeneration of synaptically linked cortical pathways, with a relative sparing of phylogenetically older, sensorimotor cortices. Occipital regions are also atrophic in this study; changes are not always detected in metabolic or perfusion studies of AD, in which visual cortices often serve as a control region in PET or single photon emission computed tomography imaging studies (Jagust et al., 1996).
Differential susceptibility
The anterior and ventromedial temporal lobes may be especially susceptible to AD pathology. The vulnerability of neocortical association areas may relate to their degree of functional connectivity with limbic structures, in which pathology begins (Arriagada, 1992). As noted in a recent physiological model (Mesulam, 2000), increased expression and phosphorylation of tau occurs in regions with high levels of neuroplasticity (Brion et al., 1994). This risk factor for NFT formation disrupts the cytoskeleton and ultimately leads to cell death. The spread of NFT pathology (Hof and Morrison, 1994; Morrison and Hof, 2002) may originate in limbic regions because of their high levels of baseline plasticity. Later cell loss in association areas may result from cortical remodeling attributable to impaired input activity in limbic–paralimbic neurons that innervate them.
Cortical specificity
In the deficit maps, some barriers to disease progression appear at architectonic boundaries. The sensorimotor division is clearest (Figs. 5b, 6b,f); the right cingulate sulcus (Fig. 8c) also delimits spared frontal from severely affected limbic cortex. These barriers may be transient, but they suggest that structural deficits may differ sharply on either side of known architectonic boundaries, a feature seen in our earlier studies (Thompson et al., 2001b).
Detection power
Practical questions arise in determining the most powerful measure to discriminate AD from healthy aging and in resolving treatment effects. Here, gray matter maps, at a single time point, better discriminated AD (p < 0.00027 at follow-up) than longitudinal loss rates for total cerebral volume (p < 0.003) and rates of overall gray matter loss (p < 0.04). All of these measures correlated significantly with cognitive decline. Brain volume change rates, derived from high-resolution cortical surface models (Fig. 1), may be more effective at discriminating AD than total gray matter changes, which may be more susceptible to partial volume error. Map-based measures showed vastly greater effect sizes than any measures based on volumes (e.g., p < 0.00027 at follow-up). Increased power may result from restricting the search space for disease effects to the cortical sheet. Permutation tests on cluster size (Bullmore et al., 1999; Thompson et al., 2001c) in the significance maps also sensitize the maps for detecting disease effects.
Advantages of this study
This study builds on previous work on AD progression (DeCarli, 2000; Ashburner et al., 2003). The advantages of this study over previous work are that advancing deficits are shown in the form of dynamically changing maps. Cortical pattern matching, a technique used here, also relates deficits to gyral anatomy (e.g., the cingulate/frontal division) (Fig. 8c). The image analysis method involves a high-dimensional registration followed by a test of gray scale differences and is therefore a hybrid in terms of the continuum between deformation morphometry and voxel-based morphometry discussed previously in the literature (Ashburner and Friston, 2001;Bookstein, 2001). As advocated previously (Bookstein, 2001), high-dimensional warping is used to align structures across subjects before comparing gray matter differences. This can increase detection power by reducing the anatomical variance present in image subtraction methods (Fig. 1). Asymmetries and group effects can then be mapped using surface-based statistics, after explicitly modeling cortical pattern differences across hemispheres, subjects, and time (Cannon et al., 2002).
Relation to previous work
Recent techniques to map AD progression use serial image alignment (Woods et al., 1993; Fox et al., 1996; Subsol et al., 1997; Wang et al., 2002), sometimes in conjunction with image deformation techniques (Freeborough and Fox, 1998; Thompson et al., 2000a,b; Janke et al., 2001; Scahill et al., 2002). These techniques produce an overall measure of change (e.g., brain volume loss in percentage) (Fox et al., 1999; Wang et al., 2002) or detailed maps of these changes (Thompson et al., 2000a,b; Janke et al., 2001). Four-dimensional maps of degenerative rates may also be derived from a deformation field that elastically transforms a subject's anatomy from its earlier configuration to its later shape (Janke et al., 2001). Using a brain boundary shift integral technique, Fox et al. (1999, 2000) noted that yearly rates of overall brain atrophy, based on their measures of total cerebral volume, were 2.4 ± 1.1% per year in AD and 0.4 ± 0.5% per year in matched elderly controls (MMSE score 19.6 ± 4.1 and 29.2 ± 1.0 at baseline, for patients and controls, respectively). These measures are slightly lower than ours (5.22 ± 2.04% per year in AD; 0.88 ± 0.15% per year in controls), although our patients are slightly more severely impaired (MMSE score falling from 18 to 13 at follow-up). This may support the idea that atrophic rates accelerate as the disease progresses (Kaye et al., 1999). A limitation of our current study is our use of only two time points per subject, which forces us to assume linear loss during the interscan interval. Future studies using multiple time points per patient (Janke et al., 2001) will reveal whether AD accelerates or progresses nonlinearly over time.
The profound deficits observed here further support the focus on temporal lobe as a site of early and progressive change in AD (Murphy et al., 1993; Kaye et al., 1997; Jack et al., 1998; Laakso et al., 2000). Jobst et al. (1994) noted faster change rates, even before symptom development, in normal individuals who went on to develop mild cognitive impairment. In the future, cortical maps may help to map preclinical brain change in those at genetic risk for AD (e.g., ApoE4 carriers) (Small et al., 2000; Reiman et al., 2001; see alsoThompson et al., 2003).
In summary, the dynamic maps presented here suggest that dynamic structural changes in AD, mapped in living patients, are congruent with earlier cross-sectional metabolic and pathologic changes. This sheds light on the complex pattern and timing of these cortical events. The overall strategy described here also provides quantitative and visual criteria to assess genetic effects on brain structure (Thompson et al., 2001a; Thompson and Toga, 2002) and to map drug effects in clinical trials.
Footnotes
This work was supported by National Library of Medicine Grant R01 LM05639, by National Center for Research Resources Grants P41 RR13642 and M01 RR00865, by a grant from GlaxoSmithKline Pharmaceuticals UK, and by Human Brain Project Grant P01 MH52176 to the International Consortium for Brain Mapping, which is funded jointly by the National Institute of Mental Health and the National Institute on Drug Abuse.
Correspondence should be addressed to Dr. Paul Thompson, Room 4238, Reed Neurological Research Center, Laboratory of Neuro Imaging, Department of Neurology, University of California Los Angeles School of Medicine, 710 Westwood Plaza, Los Angeles, CA 90095-1769. E-mail:thompson@loni.ucla.edu.
References
- 1.American Psychiatric Association. Diagnostic and statistical manual of mental disorders, Ed 4 (DSM-IV). American Psychiatric Association; Washington, DC: 2000. [Google Scholar]
- 2.Arnold SE, Hyman BT, Flory J, Damasio AR, Van Hoesen GW. The topographical and neuroanatomical distribution of neurofibrillary tangles and neuritic plaques in the cerebral cortex of patients with Alzheimer's disease. Cereb Cortex. 1991;1:103–116. doi: 10.1093/cercor/1.1.103. [DOI] [PubMed] [Google Scholar]
- 3.Arriagada P, Growdon JH, Hedley-Whyte ET, Hyman BT. Neurofibrillary tangles, but not plaques parallel duration and severity of Alzheimer's disease. Neurology. 1992;42:631–639. doi: 10.1212/wnl.42.3.631. [DOI] [PubMed] [Google Scholar]
- 4.Ashburner J, Friston KJ. Voxel-based morphometry—the methods. NeuroImage. 2000;11:805–821. doi: 10.1006/nimg.2000.0582. [DOI] [PubMed] [Google Scholar]
- 5.Ashburner J, Friston KJ. Why voxel-based morphometry should be used. NeuroImage. 2001;14:1238–1243. doi: 10.1006/nimg.2001.0961. [DOI] [PubMed] [Google Scholar]
- 6.Ashburner J, Csernansky J, Davatzikos C, Fox NC, Frisoni G, Thompson PM (2003) Computational neuroanatomy: towards a computer-assisted diagnosis of degenerative brain diseases based on magnetic resonance imaging. Lancet Neurol, in press. [DOI] [PubMed]
- 7.Baron JC, Chetelat G, Desgranges B, Perchey G, Landeau B, de la Sayette V, Eustache F. In vivo mapping of gray matter loss with voxel-based morphometry in mild Alzheimer's disease. NeuroImage. 2001;14:298–309. doi: 10.1006/nimg.2001.0848. [DOI] [PubMed] [Google Scholar]
- 8.Bookstein FL. Voxel-based morphometry should not be used with imperfectly registered images. NeuroImage. 2001;14:1454–1462. doi: 10.1006/nimg.2001.0770. [DOI] [PubMed] [Google Scholar]
- 9.Braak H, Braak E. Neuropathological staging of Alzheimer related changes. Acta Neuropathol. 1991;82:239–259. doi: 10.1007/BF00308809. [DOI] [PubMed] [Google Scholar]
- 10. Braak H, Braak E. Staging of Alzheimer-related cortical destruction. Int Psychogeriatr 9[Suppl 1] 1997. 257 261; discussion 269–272. [PubMed] [Google Scholar]
- 11.Brion JP, Octave JN, Couck AM. Distribution of the phosphorylated microtubule-associated protein tau in developing cortical neurons. Neuroscience. 1994;63:895–909. doi: 10.1016/0306-4522(94)90533-9. [DOI] [PubMed] [Google Scholar]
- 12.Brun A, Englund E. Regional pattern of degeneration in Alzheimer's disease: neuronal loss and histopathologic grading. Histopathology. 1981;5:549–564. doi: 10.1111/j.1365-2559.1981.tb01818.x. [DOI] [PubMed] [Google Scholar]
- 13.Bullmore ET, Suckling J, Overmeyer S, Rabe-Hesketh S, Taylor E, Brammer MJ. Global, voxel, and cluster tests, by theory and permutation, for a difference between two groups of structural MR images of the brain. IEEE Trans Med Imaging. 1999;18:32–42. doi: 10.1109/42.750253. [DOI] [PubMed] [Google Scholar]
- 14.Cannon TD, Thompson PM, van Erp T, Toga AW, Poutanen V-P, Huttunen M, Lönnqvist J, Standertskjöld-Nordenstam C-G, Narr KL, Khaledy M, Zoumalan CI, Dail R, Kaprio J. Cortex mapping reveals regionally specific patterns of genetic and disease-specific gray-matter deficits in twins discordant for schizophrenia. Proc Natl Acad Sci USA. 2002;99:3228–3233. doi: 10.1073/pnas.052023499. [DOI] [PMC free article] [PubMed] [Google Scholar]
- 15.Clinton J, Blackman SEA, Royston MC, Robert GW. Differential synaptic loss in the cortex in AD: a study using archival material. NeuroReport. 1994;5:497–500. doi: 10.1097/00001756-199401120-00032. [DOI] [PubMed] [Google Scholar]
- 16.Collins DL, Neelin P, Peters T, Evans AC. Automatic 3D intersubject registration of MR volumetric data in standardized Talairach space. J Comput Assist Tomogr. 1994;18:192–205. [PubMed] [Google Scholar]
- 17.de Brabander JM, Kramers RJ, Uylings HB. Layer-specific dendritic regression of pyramidal cells with aging in the human prefrontal cortex. Eur J Neurosci. 1998;10:1261–1269. doi: 10.1046/j.1460-9568.1998.00137.x. [DOI] [PubMed] [Google Scholar]
- 18.DeCarli C. Part IV. Neuroimaging in dementing disorders. Dis Mon. 2000;46:706–724. doi: 10.1016/s0011-5029(00)90031-2. [DOI] [PubMed] [Google Scholar]
- 19.Delacourte A, David JP, Sergeant N, Buee L, Wattez A, Vermersch P, Ghozali F, Fallet-Bianco C, Pasquier F, Lebert F, Petit H, Di Menza C. The biochemical pathway of neurofibrillary degeneration in aging and Alzheimer's disease. Neurology. 1999;52:1158–1165. doi: 10.1212/wnl.52.6.1158. [DOI] [PubMed] [Google Scholar]
- 20.de la Torre JC. Alzheimer disease as a vascular disorder: nosological evidence. Stroke. 2002;33:1152–1162. doi: 10.1161/01.str.0000014421.15948.67. [DOI] [PubMed] [Google Scholar]
- 21.Evans AC, Collins DL, Neelin P, MacDonald D, Kamber M, Marrett TS. Three-dimensional correlative imaging: applications in human brain mapping. In: Thatcher RW, Hallett M, Zeffiro T, John ER, Huerta M, editors. Functional neuroimaging: technical foundations. Academic; San Diego: 1994. pp. 145–162. [Google Scholar]
- 22.Fischl B, Sereno MI, Tootell RBH, Dale AM. High-resolution inter-subject averaging and a coordinate system for the cortical surface. Hum Brain Mapp. 1999;8:272–284. doi: 10.1002/(SICI)1097-0193(1999)8:4<272::AID-HBM10>3.0.CO;2-4. [DOI] [PMC free article] [PubMed] [Google Scholar]
- 23.Flood DG, Buell SJ, Horwitz GJ, Coleman PD. Dendritic extent in human dentate gyrus granule cells in normal aging and senile dementia. Brain Res. 1987;402:205–216. doi: 10.1016/0006-8993(87)90027-8. [DOI] [PubMed] [Google Scholar]
- 24.Folstein MF, Folstein SE, McHugh PR. “Mini mental state”: a practical method of grading the cognitive state of patients for the clinician. J Psychiatr Res. 1975;12:189–198. doi: 10.1016/0022-3956(75)90026-6. [DOI] [PubMed] [Google Scholar]
- 25.Fox NC, Freeborough PA, Rossor MN. Visualisation and quantification of rates of atrophy in AD. Lancet. 1996;348:94–97. doi: 10.1016/s0140-6736(96)05228-2. [DOI] [PubMed] [Google Scholar]
- 26.Fox NC, Scahill RI, Crum WR, Rossor MN. Correlation between rates of brain atrophy and cognitive decline in AD. Neurology. 1999;52:1687–1689. doi: 10.1212/wnl.52.8.1687. [DOI] [PubMed] [Google Scholar]
- 27.Fox NC, Cousens S, Scahill R, Harvey RJ, Rossor MN. Using serial registered brain magnetic resonance imaging to measure disease progression in Alzheimer disease: power calculations and estimates of sample size to detect treatment effects. Arch Neurol. 2000;57:339–344. doi: 10.1001/archneur.57.3.339. [DOI] [PubMed] [Google Scholar]
- 28.Freeborough PA, Fox NC. Modeling brain deformations in Alzheimer disease by fluid registration of serial 3D MR images. J Comput Assist Tomogr. 1998;22:838–843. doi: 10.1097/00004728-199809000-00031. [DOI] [PubMed] [Google Scholar]
- 29.Friedland RP, Luxenberg J. Neuroimaging and dementia. In: Theodore WH, editor. Clinical neuroimaging: frontiers in clinical neuroscience, Vol 4. Allan Liss; New York: 1988. pp. 139–163. [Google Scholar]
- 30.Friston KJ, Holmes A, Poline JB, Price CJ, Frith CD. Detecting activations in PET and fMRI: levels of inference and power. NeuroImage. 1996;4:223–235. doi: 10.1006/nimg.1996.0074. [DOI] [PubMed] [Google Scholar]
- 31.Geschwind N, Levitsky W. Human brain: left-right asymmetries in temporal speech region. Science. 1968;161:186–187. doi: 10.1126/science.161.3837.186. [DOI] [PubMed] [Google Scholar]
- 32.Gomez-Isla T, Hollister R, West H, Mui S, Growdon JH, Petersen RC, Parisi JE, Hyman BT. Neuronal loss correlates with but exceeds neurofibrillary tangles in Alzheimer's disease. Ann Neurol. 1997;41:17–24. doi: 10.1002/ana.410410106. [DOI] [PubMed] [Google Scholar]
- 33.Good CD, Johnsrude IS, Ashburner J, Henson RN, Friston KJ, Frackowiak RSJ. A voxel-based morphometric study of aging in 465 normal adult human brains. NeuroImage. 2001;14:21–36. doi: 10.1006/nimg.2001.0786. [DOI] [PubMed] [Google Scholar]
- 34.Hampel H, Teipel SJ, Alexander GE, Pogarell O, Rapoport SI, Moller HJ. In vivo imaging of region and cell type specific neocortical neurodegeneration in Alzheimer's disease: perspectives of MRI derived corpus callosum measurement for mapping disease progression and effects of therapy. Evidence from studies with MRI, EEG and PET. J Neural Transm. 2002;109:837–855. doi: 10.1007/s007020200069. [DOI] [PubMed] [Google Scholar]
- 35.Hanks SD, Flood DG. Region-specific stability of dendritic extent in normal human aging and regression in Alzheimer's disease. I. CA1 of hippocampus. Brain Res. 1991;540:63–82. doi: 10.1016/0006-8993(91)90493-f. [DOI] [PubMed] [Google Scholar]
- 36.Hayashi KM, Thompson PM, Mega MS, Zoumalan CI (2002) Medial hemispheric surface gyral pattern delineation in 3D: surface curve protocol. Available at:http://www.loni.ucla.edu/∼khayashi/Public/medial_surface/ MedialLinesProtocol.
- 37.Hof PR, Morrison JH. The cellular basis of cortical disconnection in Alzheimer disease and related dementing conditions. In: Terry RD, Katzman R, Bick KL, editors. Alzheimer disease. Raven; New York: 1994. pp. 197–229. [Google Scholar]
- 38.Holmes AP, Blair RC, Watson JD, Ford I. Nonparametric analysis of statistic images from functional mapping experiments. J Cereb Blood Flow Metab. 1996;16:7–22. doi: 10.1097/00004647-199601000-00002. [DOI] [PubMed] [Google Scholar]
- 39.Hubbard BM, Anderson JM. A quantitative study of cerebral atrophy in old age and senile dementia. J Neurol Sci. 1981;50:135–145. doi: 10.1016/0022-510x(81)90048-4. [DOI] [PubMed] [Google Scholar]
- 40.Hulstaert F, Blennow K, Ivanoiu A, Schoonderwaldt HC, Riemenschneider M, De Deyn PP, Bancher C, Cras P, Wiltfang J, Mehta PD, Iqbal K, Pottel H, Vanmechelen E, Vanderstichele H. Improved discrimination of AD patients using beta-amyloid(1–42) and tau levels in CSF. Neurology. 1999;52:1555–1562. doi: 10.1212/wnl.52.8.1555. [DOI] [PubMed] [Google Scholar]
- 41.Jack CR, Jr, Petersen RC, Xu Y, O'Brien PC, Smith GE, Ivnik RJ, Tangalos EG, Kokmen E. Rate of medial temporal lobe atrophy in typical aging and Alzheimer's disease. Neurology. 1998;51:993–999. doi: 10.1212/wnl.51.4.993. [DOI] [PMC free article] [PubMed] [Google Scholar]
- 42.Jagust WJ, Haan MN, Eberling JL, Wolfe N, Reed BR. Functional imaging predicts cognitive decline in Alzheimer's disease. J Neuroimaging. 1996;6:156–160. doi: 10.1111/jon199663156. [DOI] [PubMed] [Google Scholar]
- 43.Janke AL, de Zubicaray GI, Rose SE, Griffin M, Chalk JB, Galloway GJ. 4D deformation modeling of cortical disease progression in Alzheimer's dementia. Magn Reson Med. 2001;46:661–666. doi: 10.1002/mrm.1243. [DOI] [PubMed] [Google Scholar]
- 44.Jernigan TL, Salmon D, Butters N, Hesselink JR. Cerebral structure on MRI, part II: specific changes in Alzheimer's and Huntington's diseases. Biol Psychiatry. 1991;29:68–81. doi: 10.1016/0006-3223(91)90211-4. [DOI] [PubMed] [Google Scholar]
- 45.Jobst KA, Smith AD, Szatmari M, Esiri MM, Jaskowski A, Hindley N, McDonald B, Molyneux AJ. Rapidly progressing atrophy of medial temporal lobe in Alzheimer's disease. Lancet. 1994;343:829–830. doi: 10.1016/s0140-6736(94)92028-1. [DOI] [PubMed] [Google Scholar]
- 46.Johnson KA, Jones K, Holman BL, Becker JA, Spiers PA, Satlin A, Albert MS. Preclinical prediction of Alzheimer's disease using SPECT. Neurology. 1998;50:1563–1571. doi: 10.1212/wnl.50.6.1563. [DOI] [PubMed] [Google Scholar]
- 47.Kaye J, Moore M, Kerr D. The rate of brain volume loss accelerates as Alzheimer's disease progresses from a presymptomatic phase to frank dementia. Neurology. 1999;52[Suppl]:A569–A570. [Google Scholar]
- 48.Kaye JA, Swihart T, Howieson D, Dame A, Moore MM, Karnos T, Camicioli R, Ball M, Oken B, Sexton G. Volume loss of the hippocampus and temporal lobe in healthy elderly persons destined to develop dementia. Neurology. 1997;48:1297–1304. doi: 10.1212/wnl.48.5.1297. [DOI] [PubMed] [Google Scholar]
- 49.Laakso MP, Lehtovirta M, Partanen K, Riekkinen PJ, Soininen H. Hippocampus in AD: a 3-year follow-up MRI study. Biol Psychiatry. 2000;47:557–561. doi: 10.1016/s0006-3223(99)00167-5. [DOI] [PubMed] [Google Scholar]
- 50.Lehtovirta M, Laakso MP, Frisoni GB, Soininen H. How does the apolipoprotein E genotype modulate the brain in aging and in Alzheimer's disease? A review of neuroimaging studies. Neurobiol Aging. 2000;21:293–300. doi: 10.1016/s0197-4580(00)00120-2. [DOI] [PubMed] [Google Scholar]
- 51.Leonard CM. Structural variation in the developing and mature cerebral cortex: noise or signal? In: Thatcher RW, Reid Lyon G, Rumsey J, Krasnegor N, editors. Developmental neuroimaging: mapping the development of brain and behavior. Academic; New York: 1996. pp. 207–231. [Google Scholar]
- 52.Loewenstein DA, Barker WW, Chang JY, Apicella A, Yoshii F, Kothari P, Levin B, Duara R. Predominant left hemisphere metabolic dysfunction in dementia. Arch Neurol. 1989;46:146–152. doi: 10.1001/archneur.1989.00520380046012. [DOI] [PubMed] [Google Scholar]
- 53.MacDonald D, Kabani N, Avis D, Evans AC. Automated 3-D extraction of inner and outer surfaces of cerebral cortex from MRI. NeuroImage. 2000;12:340–356. doi: 10.1006/nimg.1999.0534. [DOI] [PubMed] [Google Scholar]
- 54.Mazziotta JC, Frackowiak RS, Phelps ME. The use of positron emission tomography in the clinical assessment of dementia. Semin Nucl Med. 1992;22:233–246. doi: 10.1016/s0001-2998(05)80118-7. [DOI] [PubMed] [Google Scholar]
- 55.McEwen BS. Possible mechanisms for atrophy of the human hippocampus. Mol Psychiatry. 1997;2:255–262. doi: 10.1038/sj.mp.4000254. [DOI] [PubMed] [Google Scholar]
- 56.McKhann G, Drachman D, Folstein M, Katzman R, Price D, Stadian EM. Clinical diagnosis of AD: report of the NINCDS-ARDRA Work Group under the auspices of the Health and Human Services Task Force on Alzheimer's Disease. Neurology. 1984;34:939–944. doi: 10.1212/wnl.34.7.939. [DOI] [PubMed] [Google Scholar]
- 57.Mega MS, Chen S, Thompson PM, Woods RP, Karaca TJ, Tiwari A, Vinters H, Small GW, Toga AW. Mapping pathology to metabolism: coregistration of stained whole brain sections to PET in AD. NeuroImage. 1997;5:147–153. doi: 10.1006/nimg.1996.0255. [DOI] [PubMed] [Google Scholar]
- 58.Mesulam MM. A plasticity-based theory of the pathogenesis of Alzheimer's disease. Ann NY Acad Sci. 2000;924:42–52. doi: 10.1111/j.1749-6632.2000.tb05559.x. [DOI] [PubMed] [Google Scholar]
- 59.Morrison JH, Hof PR. Life and death of neurons in the aging brain. Science. 1997;278:412–419. doi: 10.1126/science.278.5337.412. [DOI] [PubMed] [Google Scholar]
- 60.Morrison JH, Hof PR. Selective vulnerability of corticocortical and hippocampal circuits in aging and Alzheimer's disease. Prog Brain Res. 2002;136:467–486. doi: 10.1016/s0079-6123(02)36039-4. [DOI] [PubMed] [Google Scholar]
- 61.Mummery CJ, Patterson K, Price CJ, Ashburner J, Frackowiak RS, Hodges JR. A voxel-based morphometry study of semantic dementia: relationship between temporal lobe atrophy and semantic memory. Ann Neurol. 2000;47:36–45. [PubMed] [Google Scholar]
- 62.Murphy DGM, DeCarli CD, Daly E, Gillette JA, McIntosh AR, Haxby JV, Teichberg D, Schapiro MB, Rapoport SI, Horwitz B. Volumetric magnetic resonance imaging in men with dementia of the Alzheimer type: correlations with disease severity. Biol Psychiatry. 1993;34:612–621. doi: 10.1016/0006-3223(93)90153-5. [DOI] [PubMed] [Google Scholar]
- 63.Nakamura S, Akiguchi I, Kameyama M, Kudo M, Mizuno N. Senile changes in the basal dendrites of the pyramidal cells in the human motor cortex: a quantitative Golgi study. Rinsho Shinkeigaku. 1984;24:85–95. [PubMed] [Google Scholar]
- 64.Nichols TE, Holmes AP. Nonparametric permutation tests for functional neuroimaging: a primer with examples. Hum Brain Mapp. 2002;15:1–25. doi: 10.1002/hbm.1058. [DOI] [PMC free article] [PubMed] [Google Scholar]
- 65.O'Brien JT, Paling S, Barber R, Williams ED, Ballard C, McKeith IG, Gholkar A, Crum WR, Rossor MN, Fox NC. Progressive brain atrophy on serial MRI in dementia with Lewy bodies, AD, and vascular dementia. Neurology. 2001;56:1386–1388. doi: 10.1212/wnl.56.10.1386. [DOI] [PubMed] [Google Scholar]
- 66.Ono M, Kubik S, Abernathey CD. Atlas of the cerebral sulci. Thieme; Stuttgart, Germany: 1990. [Google Scholar]
- 67.Pearson RCA, Esiri MM, Hiorns RW, Wilcock GK, Powell TPS. Anatomical correlates of the distribution of the pathological changes in the neocortex in Alzheimer's disease. Proc Natl Acad Sci USA. 1985;82:4531–4534. doi: 10.1073/pnas.82.13.4531. [DOI] [PMC free article] [PubMed] [Google Scholar]
- 68.Price JL, Morris JC. Tangles and plaques in nondemented aging and “preclinical” Alzheimer's disease. Ann Neurol. 1999;45:358–368. doi: 10.1002/1531-8249(199903)45:3<358::aid-ana12>3.0.co;2-x. [DOI] [PubMed] [Google Scholar]
- 69.Reiman EM, Caselli RJ, Chen K, Alexander GE, Bandy D, Frost J. Declining brain activity in cognitively normal apolipoprotein E epsilon 4 heterozygotes: a foundation for using positron emission tomography to efficiently test treatments to prevent Alzheimer's disease. Proc Natl Acad Sci USA. 2001;98:3334–3339. doi: 10.1073/pnas.061509598. [DOI] [PMC free article] [PubMed] [Google Scholar]
- 70.Rombouts SA, Barkhof F, Witter MP, Scheltens P. Unbiased whole-brain analysis of gray matter loss in Alzheimer's disease. Neurosci Lett. 2000;285:231–233. doi: 10.1016/s0304-3940(00)01067-3. [DOI] [PubMed] [Google Scholar]
- 71.Scahill RI, Schott JM, Stevens JM, Rossor MN, Fox NC. Mapping the evolution of regional atrophy in Alzheimer's disease: unbiased analysis of fluid-registered serial MRI. Proc Natl Acad Sci USA. 2002;99:4703–4707. doi: 10.1073/pnas.052587399. [DOI] [PMC free article] [PubMed] [Google Scholar]
- 72.Shimada A. Age-dependent cerebral atrophy and cognitive dysfunction in SAMP10 mice. Neurobiol Aging. 1999;20:125–136. doi: 10.1016/s0197-4580(99)00044-5. [DOI] [PubMed] [Google Scholar]
- 73.Simic G, Kostovic I, Winblad B, Bogdanovic N. Volume and number of neurons of the human hippocampal formation in normal aging and Alzheimer's disease. J Comp Neurol. 1997;379:482–494. doi: 10.1002/(sici)1096-9861(19970324)379:4<482::aid-cne2>3.0.co;2-z. [DOI] [PubMed] [Google Scholar]
- 74.Sled JG, Zijdenbos AP, Evans AC. A non-parametric method for automatic correction of intensity non-uniformity in MRI data. IEEE Trans Med Imaging. 1998;17:87–97. doi: 10.1109/42.668698. [DOI] [PubMed] [Google Scholar]
- 75.Small GW, Ercoli LM, Silverman DH, Huang SC, Komo S, Bookheimer SY, Lavretsky H, Miller K, Siddarth P, Rasgon NL, Mazziotta JC, Saxena S, Wu HM, Mega MS, Cummings JL, Saunders AM, Pericak-Vance MA, Roses AD, Barrio JR, Phelps ME. Cerebral metabolic and cognitive decline in persons at genetic risk for Alzheimer's disease. Proc Natl Acad Sci USA. 2000;97:6037–6042. doi: 10.1073/pnas.090106797. [DOI] [PMC free article] [PubMed] [Google Scholar]
- 76.Sowell ER, Thompson PM, Holmes CJ, Jernigan TL, Toga AW. Progression of structural changes in the human brain during the first three decades of life: in vivo evidence for post-adolescent frontal and striatal maturation. Nat Neurosci. 1999;2:859–861. doi: 10.1038/13154. [DOI] [PubMed] [Google Scholar]
- 77.Sowell ER, Thompson PM, Mega MS, Zoumalan CI, Lindshield C, Rex DE (2000) Gyral pattern delineation in 3D: surface curve protocol. Available at: http://www.loni.ucla. edu/∼esowell/new_sulcvar.html
- 78.Sowell ER, Thompson PM, Tessner KD, Toga AW. Accelerated brain growth and cortical gray matter thinning are inversely related during post-adolescent frontal lobe maturation. J Neurosci. 2001;21:8819–8829. doi: 10.1523/JNEUROSCI.21-22-08819.2001. [DOI] [PMC free article] [PubMed] [Google Scholar]
- 79.Steinmetz H, Furst G, Freund H-J. Variation of perisylvian and calcarine anatomic landmarks within stereotaxic proportional coordinates. Am J Neuroradiol. 1990;11:1123–1130. [PMC free article] [PubMed] [Google Scholar]
- 80.Studholme C, Cardenas V, Schuff N, Rosen H, Miller B, Weiner MW. Detecting spatially consistent structural differences in Alzheimer's and frontotemporal dementia using deformation morphometry. Proceedings of the Third International Conference on Medical Image Computing and Computer Assisted Intervention (MICCAI). Springer; Berlin: 2001. [Google Scholar]
- 81.Subsol G, Roberts N, Doran M, Thirion JP, Whitehouse GH. Automatic analysis of cerebral atrophy. Magn Reson Imaging. 1997;15:917–927. doi: 10.1016/s0730-725x(97)00002-7. [DOI] [PubMed] [Google Scholar]
- 82.Terry RD, DeTeresa R, Hansen LA. Neocortical cell counts in normal human adult aging. Ann Neurol. 1987;21:530–539. doi: 10.1002/ana.410210603. [DOI] [PubMed] [Google Scholar]
- 83.Thompson PM, Mega MS, Narr KL, Sowell ER, Blanton RE, Toga AW. Brain image analysis and atlas construction. In: Fitzpatrick M, Sonka M, editors. Handbook on medical image analysis. SPIE; Bellingham, WA: 2000. [Google Scholar]
- 84.Thompson PM, Toga AW. Detection, visualization and animation of abnormal anatomic structure with a deformable probabilistic brain atlas based on random vector field transformations. Med Image Anal. 1997;1:271–294. doi: 10.1016/s1361-8415(97)85002-5. [DOI] [PubMed] [Google Scholar]
- 85.Thompson PM, Toga AW. A framework for computational anatomy. Comput Vis Sci. 2002;5:1–12. [Google Scholar]
- 86.Thompson PM, MacDonald D, Mega MS, Holmes CJ, Evans AC, Toga AW. Detection and mapping of abnormal brain structure with a probabilistic atlas of cortical surfaces. J Comp Assist Tomogr. 1997;21:567–581. doi: 10.1097/00004728-199707000-00008. [DOI] [PubMed] [Google Scholar]
- 87.Thompson PM, Moussai J, Khan AA, Zohoori S, Goldkorn A, Mega MS, Small GW, Cummings JL, Toga AW. Cortical variability and asymmetry in normal aging and Alzheimer's disease. Cereb Cortex. 1998;8:492–509. doi: 10.1093/cercor/8.6.492. [DOI] [PubMed] [Google Scholar]
- 88.Thompson PM, Giedd JN, Woods RP, MacDonald D, Evans A, Toga AW. Growth patterns in the developing brain detected by using continuum-mechanical tensor maps. Nature. 2000a;404:190–193. doi: 10.1038/35004593. [DOI] [PubMed] [Google Scholar]
- 89.Thompson PM, Woods RP, Mega MS, Toga AW. Mathematical/computational challenges in creating deformable and probabilistic atlases of the human brain. Hum Brain Mapp. 2000b;9:81–92. doi: 10.1002/(SICI)1097-0193(200002)9:2<81::AID-HBM3>3.0.CO;2-8. [DOI] [PMC free article] [PubMed] [Google Scholar]
- 90.Thompson PM, Cannon TD, Narr KL, van Erp T, Khaledy M, Poutanen V-P, Huttunen M, Lönnqvist J, Standertskjöld-Nordenstam C-G, Kaprio J, Dail R, Zoumalan CI, Toga AW. Genetic influences on brain structure. Nat Neurosci. 2001a;4:1253–1258. doi: 10.1038/nn758. [DOI] [PubMed] [Google Scholar]
- 91.Thompson PM, Mega RS, Woods RP, Zoumalan CI, Lindshield CJ, Blanton RE, Moussai J, Holmes CJ, Cummings JL, Toga AW. Cortical change in Alzheimer's disease detected with a disease-specific population-based brain atlas. Cereb Cortex. 2001b;11:1–16. doi: 10.1093/cercor/11.1.1. [DOI] [PubMed] [Google Scholar]
- 92.Thompson PM, Mega MS, Vidal C, Rapoport JL, Toga AW. Detecting disease-specific patterns of brain structure using cortical pattern matching and a population-based probabilistic brain atlas. IEEE Conference on Information Processing in Medical Imaging, Davis, CA. In: Insana M, Leahy R, editors. Lecture notes in computer science 2082. Springer; New York: 2001c. pp. 488–501. [DOI] [PMC free article] [PubMed] [Google Scholar]
- 93.Thompson PM, Vidal CN, Giedd JN, Gochman P, Blumenthal J, Nicolson R, Toga AW, Rapoport JL. Mapping adolescent brain change reveals dynamic wave of accelerated gray matter loss in very early-onset schizophrenia. Proc Natl Acad Sci USA. 2001d;98:11650–11655. doi: 10.1073/pnas.201243998. [DOI] [PMC free article] [PubMed] [Google Scholar]
- 94.Thompson PM, Cannon TD, Toga AW (2003) Mapping genetic influences on human brain structure. Ann Med, in press. [DOI] [PubMed]
- 95.Uylings HB, de Brabander JM. Neuronal changes in normal human aging and Alzheimer's disease. Brain Cogn. 2002;49:268–276. doi: 10.1006/brcg.2001.1500. [DOI] [PubMed] [Google Scholar]
- 96.Wang D, Chalk JB, Rose SE, de Zubicaray GI, Cowin G, Galloway GJ, Barnes D, Spooner D, Doddrell DM, Semple J. MR image-based measurement of rates of change in volumes of brain structures. Part II: application to a study of Alzheimer's disease and normal aging. Magn Reson Imaging. 2002;20:41–48. doi: 10.1016/s0730-725x(02)00472-1. [DOI] [PubMed] [Google Scholar]
- 97.Weinberger DR, McClure RK. Neurotoxicity, neuroplasticity, and magnetic resonance imaging morphometry: what is happening in the schizophrenic brain? Arch Gen Psychiatry. 2002;59:553–558. doi: 10.1001/archpsyc.59.6.553. [DOI] [PubMed] [Google Scholar]
- 98.Woods RP, Mazziotta JC, Cherry SR. MRI-PET registration with automated algorithm. J Comput Assist Tomogr. 1993;17:536–546. doi: 10.1097/00004728-199307000-00004. [DOI] [PubMed] [Google Scholar]
- 99.Wright IC, McGuire PK, Poline JB, Travere JM, Murray RM, Frith CD, Frackowiak RS, Friston KJ. A voxel-based method for the statistical analysis of gray and white matter density applied to schizophrenia. NeuroImage. 1995;2:244–252. doi: 10.1006/nimg.1995.1032. [DOI] [PubMed] [Google Scholar]
- 100.Yesavage JA. Geriatric depression scale. Psychopharmacol Bull. 1988;24:709–711. [PubMed] [Google Scholar]
- 101.Zijdenbos AP, Dawant BM. Brain segmentation and white matter lesion detection in MR images. Crit Rev Biomed Eng. 1994;22:401–465. [PubMed] [Google Scholar]