

Abstract
The CNS is shielded from systemic influences by two separate barriers, the blood–brain barrier (BBB) and the blood-to-CSF barrier. Failure of either barrier bears profound significance in the etiology and diagnosis of several neurological diseases. Furthermore, selective opening of BBB tight junctions provides an opportunity for delivery of otherwise BBB impermeant drugs. Peripheral assessment of BBB opening can be achieved by detection in blood of brain-specific proteins that extravasate when these endothelial junctions are breached. We developed a proteomic approach to discover clusters of CNS-specific proteins with extravasation into serum that correlates with BBB openings. Protein profiles from blood samples obtained from patients undergoing iatrogenic BBB disruption (BBBD) with intra-arterial hyperosmotic mannitol were compared with pre-BBB opening serum. A low molecular weight protein (14 kDa) identified by mass spectroscopy as transthyretin (TTR) consistently correlated with BBBD. Protein gel electrophoresis and immunodetection confirmed that TTR was indeed extravasated in its monomeric form when CNS barriers were breached. The time course of TTR extravasation was compared with release from the brain of another BBB integrity marker, S-100β (11 kDa). Kinetic analysis revealed that the appearance of S-100β, presumably originating from perivascular astrocytic end feet, preceded extravasation of TTR by several minutes. Because TTR is localized primarily in choroid plexus and, as a soluble monomer, in CSF, we concluded that although S-100β is a marker of BBB integrity, TTR instead may be a peripheral tracer of blood-to-cerebrospinal barrier.
Keywords: MRI, neurological disorders, choroid plexus, cerebral blood flow, neurodegeneration, neuroinflammation
Introduction
Loss of blood–brain barrier (BBB) function is an etiologic component of many neurological diseases. An intact BBB may restrict the delivery of certain therapeutic substances to the brain. Thus, measuring BBB function may be important to diagnose disease progression and monitor time-dependent changes in BBB integrity when chemotherapic penetration may be enhanced. At present, only invasive and expensive techniques such as contrast-enhanced magnetic resonance imaging, computed tomography (CT) scan, and lumbar puncture are available to clinically assess BBB integrity. An alternative approach has been proposed, consisting of detection of changes in blood composition that indicate BBB disruption (Kapural et al., 2002).
Current BBB assessment by imaging or CSF sampling is based on direct or indirect determination of protein permeability across the BBB. CNS proteins are normally asymmetrically distributed, with generally much high concentration in plasma than in CSF. Thus, the appearance of plasma proteins in CSF is a hallmark of numerous CNS disorders with presumed or overt BBB disruption. Only a few proteins are synthesized exclusively by, or are present in, higher concentrations in CSF or interstitial compartment compared with the blood. These CSF markers may appear or increase their plasma concentration after passage across a failed BBB. Therefore, measuring levels of CSF proteins in plasma may be a reliable way to monitor blood to CNS barrier integrity without the use of invasive methods.
S-100β is primarily synthesized in the brain by the end feet process of the astrocytes and is quickly released from the brain in the blood when the BBB is disrupted (Dyck et al., 1993; Buccoliero et al., 2002;Kapural et al., 2002; Mercier and Hatton, 2000). S-100β has also been found in other tissues but at lower concentrations (Mrak et al., 1994;Jonsson, 1998). Although the appearance of S-100β in plasma correlated well with BBB openings, S-100β has been shown to increase in plasma, CSF, or both, as a consequence of other pathologies not limited to the CNS. S-100β may detect brain damage or indicate advanced metastasis in melanoma patients (Jonsson et al., 1998; Chakrabarty and Franks, 1999; Brochez and Naeyaert, 2000;Ingebrigtsen et al., 2000; Grocott and Arrowsmith, 2001). These limitations of S-100β as a marker of BBB functions prompted us to look for alternative markers. To achieve this we followed the same approach used to unveil elevations of S-100β in peripheral blood of patients affected by primary brain lymphoma and undergoing iatrogenic BBB disruption (BBBD) with intra-arterial mannitol infusion, followed by chemotherapy (Neuwelt et al., 1980; Kroll and Neuwelt, 1998). We processed plasma samples obtained from these patients at four different time points before and after the BBBD by using two-dimensional (2D)-gel protein separation (Molloy, 2000; Davidsson et al., 2001). This was coupled with Maldi-mass spectrometry to sequence protein signals that were correlated with the time course of BBB opening as predicted by parallel measurements of S-100β. We report the characterization of a novel marker, transthyretin (TTR), a low molecular weight protein with a complex plasma/CSF distribution that appears in blood in its monomeric form after brain barrier opening.
Materials and Methods
BBB disruption. The Cleveland Clinic Brain Tumor Institute provides a treatment called blood–brain barrier disruption (Neuwelt et al., 1991; Crossen et al., 1992;Roman-Goldstein et al., 1995; Kroll and Neuwelt, 1998) for primary CNS lymphomas, primitive neuroectodermal tumors, some gliomas, CNS germinoma, and some metastatic brain tumors (such as breast, small cell lung, or germ cell). All procedures were performed after informed consent was obtained using protocols approved by the Cleveland Clinic Foundation Institutional Review Board. In this protocol, intra-arterial mannitol (1.4 m) is administered via a carotid or vertebral artery, and BBBD is confirmed by contrast CT immediately after chemotherapy.
Protein analysis. Sucrose gradient separation was performed to divide proteins by molecular weight. Ten milliliters of discontinuous 10/25/40% gradient and 200 μl of sample (75 μl of serum, 125 μl of gradient buffer) were used. The upper fraction was collected after 16 hr of centrifugation at 4°C (225,0000 × g). The low molecular weight fraction was filtered with a 3 kDa molecular weight cutoff (Amicon Centricon YM 3000) for 6 hr (5800 × g) to remove sucrose. Both SDS and NO-SDS-PAGE were used. Non-SDS-PAGE samples were analyzed in non-denaturing conditions.
Identification of TTR protein was performed by Western blotting techniques. Serum samples obtained from the BBBD procedures and protein were probed overnight at 4°C with primary TTR rabbit anti-human antibody (1:1000; Dako). Protein concentration was estimated according to the Bradford assay method. Relative expressions of proteins were determined by densitometric analysis using Scion Image Software. This approach was used to quantify the TTR and haptoglobin data shown in Figure 3. Radial immunodiffusion (RID) was used to quantitatively determine TTR in serum. Prefabricated immunodiffusion plates were purchased from Kent Laboratories (Bellingham, WA). Experiments were performed as recommended by the vendor.
Fig. 3.

Time course of serum protein changes after BBB disruption. S-100β, TTR, haptoglobin, and NSE were measured at the time indicated by the inset. Note that S-100β and TTR increased significantly after BBB opening but with different kinetics. NSE and haptoglobin-1 (Hapto-1) remained unchanged throughout the procedure. The timeline is color-coded to match the histogram bars. The mean ± SD of three experiments is shown; *p < 0.05. Note that the values for TTR and haptoglobin-1 are expressed as percentage change of spot intensity (see Materials and Methods), whereas NSE and S-100β were measured by immunodetection techniques, and the values are expressed in nanograms per milliliter. The values for S-100β were scaled for clarity (100×). TTR, Transthyretin; NSE, neuron-specific enolase; MTX, methotrexate;NICU, neurointensive care unit.
For mass spectroscopy we used a liquid chromatography–mass spectroscopy (LC–MS) system Finnigan LCQ-Deca ion trap mass spectrometer system with a Protana microelectrospray ion source interfaced to a self-packed 10 cm × 75 μm inner diameter Phenomenex Jupiter C18 reversed-phase capillary chromatography column. Data were analyzed by using all collision-induced dissociation spectra collected in the experiment to search the National Center for Biotechnology Information nonredundant database with the search program TurboSequest. All matching spectra were verified by manual interpretation. The interpretation process was also aided by additional searches using the programs Mascot and Fasta, performed as needed.
Statistical methods. Data are presented as means ± SEM. ANOVA was need to determine significance. Origin 7.0 (Microcal) was used for statistical analysis.
Results
We tested blood samples from three patients affected by primary brain lymphoma who underwent monthly hemispheric BBBD by intra-arterial infusion of 1.4 m mannitol before receiving intra-arterial methotrexate (Neuwelt et al., 1980, 1991; Roman-Goldstein et al., 1995;Kroll and Neuwelt, 1998). Blood samples (29 total) were obtained at four different times for each hemispheric disruption: after anesthesia induction, 45 sec after mannitol infusion, ∼45 sec after methotrexate infusion, and during recovery in the neurointensive care unit (4–5 hr after the procedure). The patients that we chose had a very good BBB opening with mannitol infusion as confirmed by CT scans performed after the procedure was completed (Fig. 1).
Fig. 1.

Schematic representation of the experiments described herein. A, Schematic representation and anatomic correlates of intra-arterial injection of hyperosmotic media and chemotherapeutic agents used to treat primary brain lymphomas with blood–brain barrier disruption. Hemispheric opening of the BBB was achieved after this procedure. B, The success of the procedure was quantified by CT scans taken approximately after completing the injection protocol. Note the hemisphere enhancement by iodinated contrast media indicated by arrows.
2-D gel electrophoresis
Two-dimensional electrophoresis is a powerful technique for separating proteins by iso-electric point and molecular weight (Molloy, 2000; Davidsson et al., 2001). This technique was used to compare human serum samples obtained from BBBD protocols to detect changes in protein content before and after opening the blood–brain barrier. Figure2 shows the results of a typical experiment. Care was taken to ensure that an equal amount of protein was loaded on each gel. A quantitative analysis was performed to confirm that gels prepared with pre-BBBD and post-BBBD were comparable. To this end, a comparison spot corresponding to haptoglobin (18 kDa, pI 5.4–6), was used as internal control.
Fig. 2.
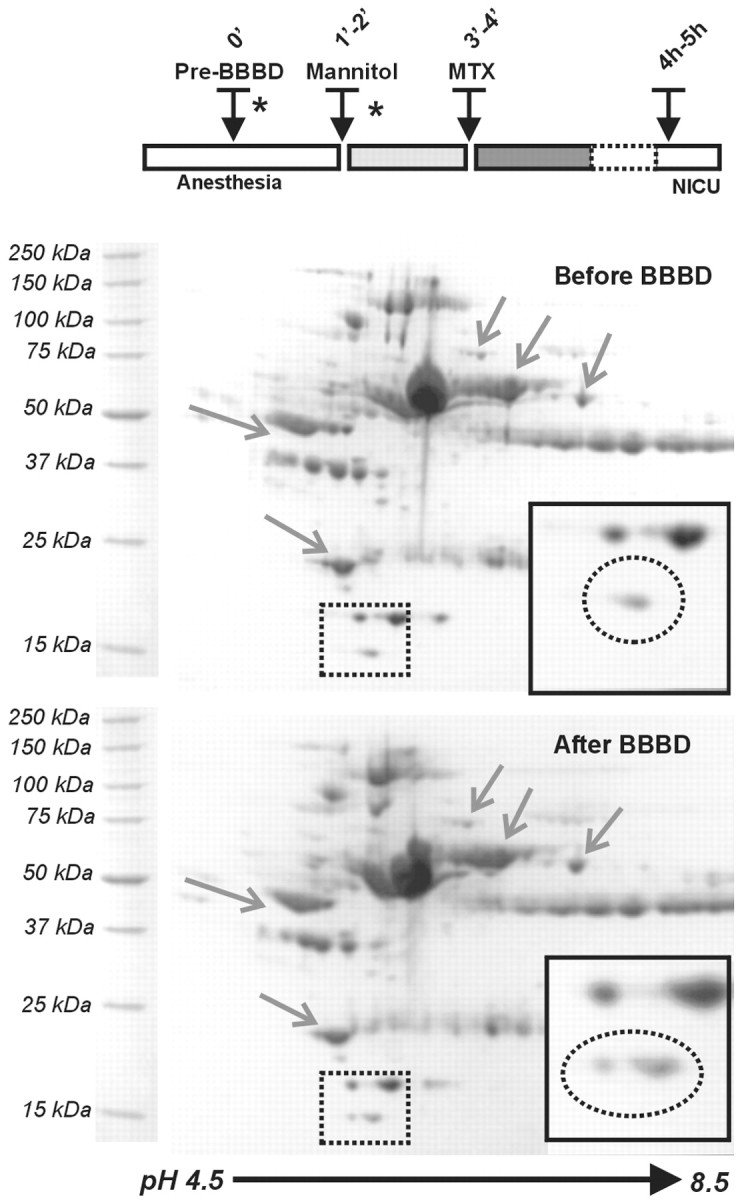
Detection of putative BBB markers by 2D gel electrophoresis of human blood proteins before and after osmotic opening of the BBB by intra-arterial mannitol. The samples used for loading were taken before mannitol injection and after chemotherapy. The timing of the injection of the osmotic agent and the introduction of the chemotherapic agent (methotrexate) are shown in the timeline. Protein signals that remained unchanged are indicated byarrows. The region in which significant changes were observed is boxed by a dashed line. Note the appearance of a distinct spot after BBB disruption. This spot corresponded to a protein of approximate molecular weight of 14 kDa and a pI of 5.5.
Comparison of gels prepared with pre-BBBD and post-BBBD was achieved by use of automated computer software. A number of strategies were used to ensure that the changes in protein levels were caused by BBB opening and not random fluctuations. First, we considered significant only the appearance of detectable spots ex novo and excluded increased levels of preexisting proteins. This criterion was used to minimize the possibility of uneven loading of gels as cause for the observed changes. Second, we excluded from further analysis changes that were not consistently observed in all BBBD. Thus, only spots that consistently appeared in post-BBBD gels in all three patients were further analyzed. Finally, we were limited to the identification of proteins that were amenable for mass spectroscopy analysis on Coomassie-stained gels.
A 14 kDa and 5.5 pI protein appeared after all BBBD procedures (Fig.2). The size of the Coomassie-stained spot was quantified by proteomic software (Fig. 3). Theasterisks indicate the actual time points at which the samples used for the gels were taken. This protein was subsequently identified as TTR (see below). Previous results demonstrated that opening of the BBB by osmotic means causes a reproducible increase in serum levels of S-100β. In contrast, levels of the putative marker of neuronal damage, neuron-specific enolase (NSE), remained unchanged. We compared the time-dependent appearance of TTR with changes of NSE and S-100β during the same procedures. As shown in Figure 3, BBBD caused S-100β and TTR changes characterized by distinct time dependency, whereas the internal controls haptoglobin and NSE remained essentially unaffected, on average. Note, however, that although S-100β increased significantly immediately (40 sec) after mannitol injection and BBB disruption, TTR levels were elevated only after a longer delay.
Molecular nature of the putative marker
After obtaining quantitative results describing protein changes, we investigated the qualitative nature of the low molecular weight protein shown in Figure 2. Protein identification was performed by LC–MS microelectroscopy mass spectroscopy. The region of interest was cut out from the gel and digested overnight with trypsin. The digest was analyzed by mass spectroscopy to determine peptide molecular weight and amino acid sequence. An additional spot (haptoglobin) was also processed to standardize the procedure for each individual gel. The polypeptide fragments obtained after digestion are shown in Table 1.
Table 1.
Maldi-mass Spectroscopy
| Protein fragments obtained from MALDI-mass spectroscopy | Transthyretin amino-acid sequence |
|---|---|
| VLDAV R | |
| GSPAIN VAV HVFR | |
| KAADDT WEPFASGK | MASHRLLLLC LAGLVFVSEA GPTGTGESKC |
| AADDT WEPFASGK | PLMVKVLDAV RGSPAINVAV HVFRKAADDT |
| TS ESGELHGLTT EEEFVEGIYK | WEPFASGKTS ESGELHGLTT EEEFVEGIYK |
| TS ESGELHGLTT EEEFVEGIYK VEIDTK | VEIDTKSYWK ALGISPFHEH AEVVFTANDS |
| VEIDTK | GPRRYTIAAL LSPYSYSTPA VVTNPKE |
| SYWK | |
| ALGISPFHEH AEVVFTANDS GPR |
All of the fragments matched perfectly with the sequence of human transthyretin, formerly known as pre-albumin (NBCI 4507225). In addition, the molecular weight and isoelectric point of the spot identified in Figure 2 corresponded to the monomeric form of TTR. Transthyretin is the major protein product of the choroid plexuses and represents 20% of the total amount of protein in CSF (Hamilton and Benson, 2001). In plasma, TTR is present in a homotetrameric form with specific binding to several other proteins (Monaco, 2000). TTRCSF is predominantly represented as a monomer, with accumulation of the tetrameric protein in epithelial cells of the choroid plexus (Puchades et al., 1999; Hiraoka et al., 2000).
Immunological characterization of serum transthyretin
To confirm that the protein spot identified by the BBBD procedure was indeed human transthyretin, we performed Western blot analysis on samples taken from the same patients used for 2-D gel electrophoresis (Fig. 4). Samples processed under denaturing conditions displayed increased TTR immunoreactivity consistent with increased monomeric and dimeric TTR levels after BBBD. A commercially available TTR tetramer (55 kDa) was used as reference and loaded in the gel after processing under identical conditions. After denaturation, both dimeric and monomeric bands were identified by comparison with molecular weight standards. Furthermore, we used an alternative immunodetection approach based on quantitative RID of the sample in a gel containing antibody TTR. This test was performed, in contrast, on nondenaturated protein; however, the observed increase in TTR as detected by RID does not necessary imply that the monomeric form of TTR was indeed increased in plasma.
Fig. 4.

Immunological analysis of protein changes induced by BBB disruption. Top panel, Denaturated proteins were run in parallel with purified TTR (left lane). Western blot analysis revealed a significant increase of immunosignal for both low molecular weight isoforms. Quantitative analysis was performed on the same samples by RID (bottom panels); note the progressive increase of the immunoprecipitation signal surrounding the sample port (see Materials and Methods for details). The numeric values represent TTR levels extrapolated from these measurements and are expressed as micrograms per milliliter.
Because the tests described above were performed either under conditions that do not allow preservation of native protein structure (e.g., monomer vs tetramer) or by RID, we performed additional experiments on nondenatured proteins obtained from identical samples and separated by their molecular weight (Fig.5). Purified TTR was again loaded as reference. Note that even under nondenatured conditions, a sharp increase in a band consistent with the monomeric form of TTR occurred after BBB disruption. Also note that this band was virtually absent before the BBBD, confirming that the monomeric form of TTR is present predominately in the CSF.
Fig. 5.

Non-SDS separation of pre-BBBD and post-BBBD samples. Low molecular weight proteins obtained after separation with a sucrose gradient (cutoff 50 kDa) were loaded on a non-denaturating gel. Note the appearance of a 15 kDa molecular weight band after BBB disruption. Also note that this band corresponds to the monomeric form of standard TTR loaded on a separate gel.
Discussion
The main aim of the experiments described herein was to develop a technique that allows detection of novel serum markers indicative of breaching of the cellular barriers that normally shield the brain from systemic influences. We discovered a new marker of barrier integrity, transthyretin, by combing proteomic strategies with clinical procedures during which the BBB is disrupted to allow penetration of chemotherapic agents to treat brain tumors. Both mass spectroscopy and immunoblotting confirmed that TTR is increased early (minutes) after BBB disruption. However, the time course of TTR extravasation from CSF to plasma lagged behind that of another BBB marker, S-100β. In addition, monomeric TTR is normally present in high concentration in the CSF. These observations suggested that the appearance of TTR in serum after BBBD may indicate compromise of the blood–CSF barrier rather than the blood–brain barrier.
Proteomics and BBB markers
The original discovery of the usefulness of S-100β as an indicator of BBBD was obtained by immunodetection methods and has led to a reinterpretation of the significance of serum S-100β in various pathologic scenarios. Indeed, although S-100β extravasation in blood was originally believed to represent brain damage, the finding that S-100β may increase in the virtual absence of or preceding neuroglial damage prompted us to hypothesize that the appearance of CSF protein in serum may represent BBB disruption rather than brain damage (Kapural et al., 2002; Marchi et al., 2003). This was further supported by data demonstrating that large increases in S-100βCSFdo not lead to significant plasma changes when the BBB is intact (Janigro et al., 2002). However, S-100β increases in serum may also reflect peripheral neoplasms [e.g., melanoma (Bonfrer et al., 1998;Brochez and Naeyaert, 2000) or schwannoma (Mrak et al., 1994; Feany et al., 1998)], or other conditions in which the BBB may be intact and neuronal damage absent. We decided to use a broad proteomic analysis strategy to reveal other peripheral markers of BBB function and dysfunction to overcome the limitations of S-100β as a serum marker of BBB integrity and to further assess the potential clinical usefulness of other BBB markers.
Plasma electrophoresis has been used to diagnose human diseases. Conversely, CSF protein analysis has been instrumental in understanding CNS disorders (Reiber, 2001). In particular, the presence of abnormal levels of plasma protein in CSF has been interpreted as a sign of BBB failure. The same interpretation may be applied to modern contrast agent-based radiological investigations, in which variously labeled plasma proteins are detected in the CNS when the BBB is breached (Ross et al., 1989). We demonstrated the feasibility and usefulness of the proteomic approach to screen blood for potential markers of BBB function. This was made possible by the availability of blood samples obtained from patients undergoing controlled and quantifiable (by CT) opening of the BBB by osmotic challenge. The same BBBD procedure was used previously to validate the role of S-100β to detect BBB opening (Kapural et al., 2002).
Significance of CNS barriers
The barrier that separates the blood from the cerebral interstitial fluid is defined as the BBB, whereas the barrier that separates the blood and CSF (BCSFB) discontinues the circulation between the blood and CSF (Davson and Segal, 1995). Both barriers are formed by cell layers expressing intercellular tight junctions; however, the BBB is made of endothelial cells, whereas the blood-to-CSF barrier consists of epithelial cells (Segal, 2000). To a large extent, both CNS barriers are impermeant to macromolecules, thus hampering passage of proteins from the blood to the brain/CSF and vice versa. As a consequence of CSF production by choroid plexus epithelium and the endothelial BBB, CSF protein content is significantly lower than plasma. Thus, when the BBB or the BCSFB is breached, plasma proteins leak into the CSF. This constitutes the basis for diagnostic procedures based on detection of CSF protein by biochemical or radiologic means (Reiber, 1998, 2001; Reiber and Peter, 2001).
Recent evidence suggests that the opposite phenomenon, i.e., leakage of CSF-specific proteins into blood, may also be used to detect BBB integrity (Kapural et al., 2002). S-100β is, at least theoretically, an ideal marker of BBB function, because it is heavily expressed by perivascular astrocytes, appears in blood seconds after BBB opening, and is normally low in the serum of control subjects (Ingebrigtsen et al., 1999; Grocott and Arrowsmith, 2001; Grocott et al., 2001). Measurement of BBB intactness by peripheral blood analysis is desirable in a number of pathologies, including stroke, intracerebral hemorrhage, and head injury. Similarly, assessment of functionality of the blood-to-CSF barrier may be useful to detect incipient or ongoing brain inflammation, hydrocephalus, etc. Such a marker is currently unavailable.
Transthyretin and CNS barriers
Transthyretin represents a disproportionate fraction (25%) of CSF protein, prompting the suggestion that it is either selectively transported across the blood–CSF barrier or synthesized de novo within the CNS (Schussler, 2000; Hamilton and Benson, 2001). It has been demonstrated that the latter is the case and that the epithelial cells of the choroid plexus are the site of synthesis in both rats and humans (Reiber, 2001). TTR shows high-affinity binding to plasma retinol-binding protein (RBP) and is involved in the transport of tyrosine into the brain (Hamilton and Benson, 2001). TTR variants have been implicated in various human disorders, including Alzheimer's dementia (Hund et al., 2001; Saraiva, 2001).
In the blood, TTR is usually present in its tetrameric form and originates from liver secretion (Hamilton and Benson, 2001). Approximately 40% of plasma TTR circulates in a tight protein–protein complex with the plasma RBP. TTR is synthesized by choroid plexus epithelial cells and subsequently released into the CSF. Plasma TTR is present in the homotetramer form, whereas its CSF form is primarily monomeric (Hiraoka et al., 2000). In contrast to the BBB marker S-100β, TTR is not expressed by perivascular astrocytes or any other cells in the brain parenchyma (Herbert et al., 1986). Although levels of TTR in brain interstitial fluid have not been measured, it is unlikely that selective opening of the BBB (but not of the blood-to-CSF barrier) would cause extravasation of TTR in plasma (Fig.6).
Fig. 6.

Different distribution between S-100β and TTR in the brain. In the brain, S-100β is synthesized primarily by the astrocytes surrounding the BBB, whereas TTR is synthesized by the choroid plexuses and is found in the ventricular CSF. This topographic segregation may explain the different roles of these markers. See Discussion.
Although the appearance of S-100β serum occurred immediately after BBBD by mannitol, TTR increases lagged behind. We interpreted this as indirect evidence linking TTR extravasation to blood-to-CSF barrier rather than BBB impairment. This was further supported by the following considerations: (1) S-100β but not TTR is expressed at the BBB; (2) TTR is highly concentrated at the site of the blood-to-CSF barrier and in the ventricular CSF; and (3) brain TTR is primarily monomeric (Puchades et al., 1999; Hiraoka et al., 2000), as is the increased protein that we found in plasma after BBBD. Alternatively, delayed appearance of TTR may be attributable to the different spatial concentration gradients acting on S-100β and TTR (different cell sources) and the time taken for TTR to reach the brain capillaries from the CSF. Finally, it is possible that differences in molecular weight between S-100β (11 kDa) and TTR (14 kDa) are responsible to some degree for these differences.
There are several issues that need to be addressed concerning the putative role of TTRmonomer as a peripheral marker of BCSF barrier integrity. For example, opening of the CNS barriers with mannitol for chemotherapic purposes was followed by injection of the anti-neoplastic agent methotrexate. It is thus possible that methotrexate may be involved in the release process of TTR from the CNS compartment to plasma. This seems highly unlikely on the basis of experiments in which samples were taken from patients undergoing intra-arterial chemotherapy without mannitol-induced BBB disruption. In these samples, no detectable changes in S-100β (Kapural et al., 2002) or TTR were seen (data not shown). Reproducibility of the techniques used was another obvious concern. This was addressed by a number of strategies aimed at minimizing background interference, e.g., uneven loading of gels. We performed experiments on samples taken from three subjects, and each sample was processed in duplicate. Furthermore, data from 2D gels were normalized by comparison with identified spots (haptoglobin) that were not expected to change during the BBBD procedure. TTR was identified by four separate methods: 2D gel electrophoresis (on the basis of isoelectric properties and molecular weight), mass spectroscopy, immunodiffusion, and Western blotting. Finally, the monomeric nature of the tracer was determined by non-SDS-PAGE (Fig. 5).
To directly follow the process of extravasation of tracer molecules from the blood to the brain and vice versa, one should ideally compare changes occurring simultaneously in plasma and CSF (Stanness et al., 1996, 1997). CSF sampling from lymphoma patients is unnecessary and unethical, making it impossible to perform these experiments. On the other hand, osmotic opening of the BBB is, to our knowledge, the only controlled BBB disruption procedure in which peripheral blood can be collected at short time intervals. Thus, future animal studies will allow direct examination of how TTR and S-100β levels in the CSF relate to their appearance in plasma. However, 2D gel electrophoresis analysis of CSF samples from “control patients” (i.e., not affected by obvious CNS disorders) revealed that the TTRmonomer is represented mostly in the CSF and that a broad number of isoforms may therefore have a positive gradient for extravasation in peripheral blood if and when the blood-to-CSF barrier is breached.
In conclusion, we have shown that the TTRmonomeris a candidate marker for blood-to-CSF barrier dysfunction, in a manner similar to S-100β in its relationship to the BBB proper. Future studies will investigate the usefulness of this marker in the management or diagnosis of disorders such as hydrocephalus, meningitis, and other cerebrovascular disorders.
Footnotes
This work was supported in part by the National Institutes of Health (NIH-NS43284, NIH-HL51614, and NIH-NS38195). We also thank Dr. Anne-Charlotte Aronsson for continuous support and encouragement, and Luca Cucullo, Matteo Marroni, and Barbara Aumayr for helpful discussion. Sangtec Medical (Bromma, Sweden) provided the kits for immunodetection of NSE and S-100β.
Correspondence should be addressed to Dr. Damir Janigro, Cerebrovascular Research, NB-20 Lerner Research Institute, Cleveland Clinic Foundation, 9600 Euclid Avenue, Cleveland, OH 44196. E-mail:janigrd@ccf.org.
References
- 1.Bonfrer JM, Korse CM, Nieweg OE, Rankin EM. The luminescence immunoassay S-100: a sensitive test to measure circulating S-100B: its prognostic value in malignant melanoma. Br J Cancer. 1998;77:2210–2214. doi: 10.1038/bjc.1998.368. [DOI] [PMC free article] [PubMed] [Google Scholar]
- 2.Brochez L, Naeyaert JM. Serological markers for melanoma. Br J Dermatol. 2000;143:256–268. doi: 10.1046/j.1365-2133.2000.03649.x. [DOI] [PubMed] [Google Scholar]
- 3.Buccoliero AM, Caldarella A, Noccioli B, Fiorini P, Taddei A, Taddei GL. Brain heterotopia in pharyngeal region. A morphological and immunohistochemical study. Pathol Res Pract. 2002;198:59–63. doi: 10.1078/0344-0338-00186. [DOI] [PubMed] [Google Scholar]
- 4.Chakrabarty A, Franks AJ. Meningioangiomatosis: a case report and review of the literature. Br J Neurosurg. 1999;13:167–173. doi: 10.1080/02688699943934. [DOI] [PubMed] [Google Scholar]
- 5.Crossen JR, Goldman DL, Dahlborg SA, Neuwelt EA. Neuropsychological assessment outcomes of nonacquired immunodeficiency syndrome patients with primary central nervous system lymphoma before and after blood-brain barrier disruption chemotherapy. Neurosurgery. 1992;30:23–29. doi: 10.1227/00006123-199201000-00005. [DOI] [PubMed] [Google Scholar]
- 6.Davidsson P, Paulson L, Hesse C, Blennow K, Nilsson CL. Proteome studies of human cerebrospinal fluid and brain tissue using a preparative two-dimensional electrophoresis approach prior to mass spectrometry. Proteomics. 2001;1:444–452. doi: 10.1002/1615-9861(200103)1:3<444::AID-PROT444>3.0.CO;2-Q. [DOI] [PubMed] [Google Scholar]
- 7.Davson H, Segal MB. The proteins and other macromolecules of the CSF. In: Davson H, Segal MB, editors. Physiology of the CSF and of the blood-brain barrier. CRC; New York: 1995. pp. 573–606. [Google Scholar]
- 8.Dyck RH, Van Eldik LJ, Cynader MS. Immunohistochemical localization of the S-100 beta protein in postnatal cat visual cortex: spatial and temporal patterns of expression in cortical and subcortical glia. Brain Res Dev Brain Res. 1993;72:181–192. doi: 10.1016/0165-3806(93)90183-b. [DOI] [PubMed] [Google Scholar]
- 9.Feany MB, Anthony DC, Fletcher CD. Nerve sheath tumours with hybrid features of neurofibroma and schwannoma: a conceptual challenge. Histopathology. 1998;32:405–410. doi: 10.1046/j.1365-2559.1998.00419.x. [DOI] [PubMed] [Google Scholar]
- 10.Grocott HP, Arrowsmith JE. Serum S100 protein as a marker of cerebral damage during cardiac surgery. Br J Anaesth. 2001;86:289–290. [PubMed] [Google Scholar]
- 11.Grocott HP, Laskowitz DT, Newman MF. Markers of cerebral injury. In: Newman SP, Harrison MJG, editors. The brain and cardiac surgery. Harwood Academic; Amsterdam: 2001. pp. 113–142. [Google Scholar]
- 12.Hamilton JA, Benson MD. Transthyretin: a review from a structural perspective. Cell Mol Life Sci. 2001;58:1491–1521. doi: 10.1007/PL00000791. [DOI] [PMC free article] [PubMed] [Google Scholar]
- 13.Herbert J, Wilcox JN, Pham KT, Fremeau RT, Jr, Zeviani M, Dwork A, Soprano DR, Makover A, Goodman DS, Zimmerman EA. Transthyretin: a choroid plexus-specific transport protein in human brain. The 1986 S. Weir Mitchell Award. Neurology. 1986;36:900–911. doi: 10.1212/wnl.36.7.900. [DOI] [PubMed] [Google Scholar]
- 14.Hiraoka A, Tominaga I, Hori K. Sodium dodecylsulfate capillary gel electrophoretic measurement of the concentration ratios of albumin and alpha2-macroglobulin in cerebrospinal fluid and serum of patients with neurological disorders. J Chromatogr [A] 2000;895:339–344. doi: 10.1016/s0021-9673(00)00584-7. [DOI] [PubMed] [Google Scholar]
- 15.Hund E, Linke RP, Willig F, Grau A. Transthyretin-associated neuropathic amyloidosis. Pathogenesis and treatment. Neurology. 2001;56:431–435. doi: 10.1212/wnl.56.4.431. [DOI] [PubMed] [Google Scholar]
- 16.Ingebrigtsen T, Waterloo K, Jacobsen EA, Langbakk B, Romner B. Traumatic brain damage in minor head injury: relation of serum S-100 protein measurements to magnetic resonance imaging and neurobehavioral outcome. Neurosurgery. 1999;45:468–475. doi: 10.1097/00006123-199909000-00010. [DOI] [PubMed] [Google Scholar]
- 17.Ingebrigtsen T, Romner B, Marup-Jensen S, Dons M, Lundqvist C, Bellner J, Alling C, Borgesen SE. The clinical value of serum S-100 protein measurements in minor head injury: a Scandinavian multicentre study. Brain Inj. 2000;14:1047–1055. doi: 10.1080/02699050050203540. [DOI] [PubMed] [Google Scholar]
- 18.Jonsson H, Johnsson P, Alling C, Westaby S, Blomquist S. Significance of serum S100 release after coronary artery bypass grafting. Ann Thorac Surg. 1998;65:1639–1644. doi: 10.1016/s0003-4975(98)00229-x. [DOI] [PubMed] [Google Scholar]
- 19.Kapural M, Bengez L, Barnett G, Perl J, II, Masaryk TJ, Apollo D, Mayberg MR, Janigro D. S-100B as a possible serum marker for disruption on the blood-brain barrier. Brain Res. 2002;940:102–104. doi: 10.1016/s0006-8993(02)02586-6. [DOI] [PubMed] [Google Scholar]
- 20.Kroll RA, Neuwelt EA. Outwitting the blood-brain barrier for therapeutic purposes: osmotic opening and other means. Neurosurgery. 1998;42:1083–1099. doi: 10.1097/00006123-199805000-00082. [DOI] [PubMed] [Google Scholar]
- 21.Marchi N, Rasmussen P, Kapural M, Fazio V, Kight K, Mayberg MR, Kanner A, Albensi B, Cavaglia M, Janigro D (2003) Peripheral markers of brain damage and blood-brain barrier dysfunction. Restor Neurol, in press. [PMC free article] [PubMed]
- 22.Mercier F, Hatton GI. Immunocytochemical basis for a meningeo-glial network. J Comp Neurol. 2000;420:445–465. doi: 10.1002/(sici)1096-9861(20000515)420:4<445::aid-cne4>3.0.co;2-3. [DOI] [PubMed] [Google Scholar]
- 23.Molloy MP. Two-dimensional electrophoresis of membrane proteins using immobilized pH gradients. Anal Biochem. 2000;280:1–10. doi: 10.1006/abio.2000.4514. [DOI] [PubMed] [Google Scholar]
- 24.Monaco HL. The transthyretin-retinol-binding protein complex. Biochim Biophys Acta. 2000;1482:65–72. doi: 10.1016/s0167-4838(00)00140-0. [DOI] [PubMed] [Google Scholar]
- 25.Mrak RE, Flanigan S, Collins CL. Malignant acoustic schwannoma. Arch Pathol Lab Med. 1994;118:557–561. [PubMed] [Google Scholar]
- 26.Neuwelt EA, Frenkel EP, Diehl J, Vu LH, Rapoport SI, Hill SA. Reversible osmotic blood-brain barrier disruption in humans: implications for the chemotherapy of brain tumors. Neurosurgery. 1980;7:44–52. doi: 10.1227/00006123-198007000-00007. [DOI] [PubMed] [Google Scholar]
- 27.Neuwelt EA, Goldman DL, Dahlborg SA, Crossen J, Ramsey F, Roman Goldstein S, Braziel R, Dana B. Primary CNS lymphoma treated with osmotic blood-brain barrier disruption: prolonged survival and preservation of cognitive function. J Clin Oncol. 1991;9:1580–1590. doi: 10.1200/JCO.1991.9.9.1580. [DOI] [PubMed] [Google Scholar]
- 28.Puchades M, Westman A, Blennow K, Davidsson P. Analysis of intact proteins from cerebrospinal fluid by matrix-assisted laser desorption/ionization mass spectrometry after two-dimensional liquid-phase electrophoresis. Rapid Commun Mass Spectrom. 1999;13:2450–2455. doi: 10.1002/(SICI)1097-0231(19991230)13:24<2450::AID-RCM811>3.0.CO;2-N. [DOI] [PubMed] [Google Scholar]
- 29.Reiber H. Cerebrospinal fluid–physiology, analysis and interpretation of protein patterns for diagnosis of neurological diseases. Mult Scler. 1998;4:99–107. doi: 10.1177/135245859800400302. [DOI] [PubMed] [Google Scholar]
- 30.Reiber H. Dynamics of brain-derived proteins in cerebrospinal fluid. Clin Chim Acta. 2001;310:173–186. doi: 10.1016/s0009-8981(01)00573-3. [DOI] [PubMed] [Google Scholar]
- 31.Reiber H, Peter JB. Cerebrospinal fluid analysis: disease-related data patterns and evaluation programs. J Neurol Sci. 2001;184:101–122. doi: 10.1016/s0022-510x(00)00501-3. [DOI] [PubMed] [Google Scholar]
- 32.Roman-Goldstein S, Mitchell P, Crossen JR, Williams PC, Tindall A, Neuwelt EA. MR and cognitive testing of patients undergoing osmotic blood-brain barrier disruption with intraarterial chemotherapy. AJNR Am J Neuroradiol. 1995;16:543–553. [PMC free article] [PubMed] [Google Scholar]
- 33.Ross JS, Masaryk TJ, Modic MT. Three-dimensional FLASH imaging: applications with gadolinium-DTPA. J Comput Assist Tomogr. 1989;13:547–552. doi: 10.1097/00004728-198905000-00042. [DOI] [PubMed] [Google Scholar]
- 34.Saraiva MJ. Transthyretin mutations in hyperthyroxinemia and amyloid diseases. Hum Mutat. 2001;17:493–503. doi: 10.1002/humu.1132. [DOI] [PubMed] [Google Scholar]
- 35.Schussler GC. The thyroxine-binding proteins. Thyroid. 2000;10:141–149. doi: 10.1089/thy.2000.10.141. [DOI] [PubMed] [Google Scholar]
- 36.Segal MB. The choroid plexuses and the barriers between the blood and the cerebrospinal fluid. Cell Mol Neurobiol. 2000;20:183–196. doi: 10.1023/a:1007045605751. [DOI] [PubMed] [Google Scholar]
- 37.Stanness KA, Guatteo E, Janigro D. A dynamic model of the blood-brain barrier “in vitro.”. Neurotoxicology. 1996;17:481–496. [PubMed] [Google Scholar]
- 38.Stanness KA, Westrum LE, Mascagni P, Fornaciari E, Nelson JA, Stenglein SG, Janigro D. Morphological and functional characterization of an in vitro blood-brain barrier model. Brain Res. 1997;771:329–342. doi: 10.1016/s0006-8993(97)00829-9. [DOI] [PubMed] [Google Scholar]