

Abstract
To clarify the mechanism underlying improvement of parkinsonian signs by high-frequency electrical stimulation (HFS) of the subthalamic nucleus (STN), we investigated the effects of STN HFS on neuronal activity of the internal and external segment of the globus pallidus (GPi and GPe, respectively) in two rhesus monkeys rendered parkinsonian by administration of 1-methyl-4-phenyl-1,2,3,6-tetrahydropyridine. A scaled-down version of the chronic stimulating electrode used in humans, consisting of four metal contacts 0.50 mm in length each separated by 0.50 mm, was implanted through a cephalic chamber targeting the STN. Histological reconstruction revealed that the cathode was located in the STN in both monkeys. Extracellular recordings from a total of 110 pallidal neurons during STN stimulation were performed. Poststimulus time histograms of single neurons triggered by 2 Hz STN stimulation pulses at 2.4–3.0 V revealed short-latency excitations at 2.5–4.5 and 5.5–7.0 msec after stimulation onset and inhibitions at 1.0–2.5, 4.5–5.5, and 7.0–9.0 msec for both GPe and GPi neurons. These short-latency responses were present with 136 Hz stimulation, at voltages effective for alleviation of parkinsonian signs, resulting in a significant increase in mean discharge rate and a stimulus-synchronized regular firing pattern. These results indicate that activation of the STN efferent fibers and resultant changes in the temporal firing pattern of neurons in GPe and GPi underlie the beneficial effect of HFS in the STN in Parkinson's disease and further support the role of temporal firing patterns in the basal ganglia in the development of Parkinson's disease and other movement disorders.
Keywords: subthalamic nucleus, globus pallidus, Parkinson's disease, MPTP, deep brain stimulation, motor circuit
Introduction
High-frequency electrical stimulation (HFS) of the subthalamic nucleus (STN), internal segment of the globus pallidus (GPi), and motor thalamus can improve motor signs in patients with Parkinson's disease (PD) (Benabid et al., 1991;Limousin et al., 1995; Davis et al., 1997; Krack et al., 1998; Kumar et al., 1998); however, its mechanism of action remains unclear. In each structure, ablation and stimulation produce similar effects on tremor and other parkinsonian motor signs. These observations have lead to the hypothesis that HFS acts to inhibit neuronal activity at the stimulation site. Previous studies in anesthetized rats have demonstrated decreased neuronal activity in the STN, entopeduncular nucleus (EP), and substantia nigra pars reticulata (SNr), and increased neuronal activity in the GP and ventrolateral nucleus of the thalamus after 130 Hz STN stimulation (Benazzouz et al., 1995). An in vitro study using isolated slice preparations also revealed that high-frequency STN stimulation induced strong suppression of STN neuronal activity secondary to depression of intrinsic voltage-gated currents (Beurrier et al., 2001). These results have led to the assumption that STN HFS improves parkinsonian motor signs by suppressing STN excitatory output to its target nuclei, i.e., the GPi and the SNr. On the other hand, an intracerebral microdialysis study in rats demonstrated a significant increase of extracellular glutamate levels in the EP and substantia nigra (SN) by 130 Hz STN stimulation, consistent with activation of STN neurons and axons (Windels et al., 2000). Because it has been demonstrated in rats that STN neurons can discharge at a maximum frequency of ∼500 Hz (Kitai and Kita, 1987) and SN neurons can follow STN stimulation at >100 Hz in rats (Hammond et al., 1978), it is difficult to explain the discrepancy between the results of these studies. To clarify the mechanism underlying the effects of STN HFS on parkinsonian motor signs, we examined the effect of HFS in the STN on the neuronal responses of pallidal neurons in the 1-methyl-4-phenyl-1,2,3,6-tetrahydropyridine (MPTP) monkey model of PD using an experimental setting that was homologous to that used in humans.
Materials and Methods
The experiments were conducted in two rhesus monkeys (Macaca mulatta; R7160 and R370 weighing 5.2 and 6.9 kg, respectively). The studies were performed in compliance with The National Institutes of Health Guide for Care and Use of Laboratory Animals (1996) and with the Emory University guidelines for the use and care of laboratory animals in research.
MPTP treatment. The monkeys were treated with MPTP via a single injection through the internal carotid artery (left side in R7160, right side in R370). The total amounts of MPTP were 3.2 mg (0.6 mg/kg) and 4.1 mg (0.6 mg/kg), respectively. Both monkeys developed a stable parkinsonian state characterized by contralateral rigidity and bradykinesia. Tremor was not present at rest or with action in either monkey.
Surgical procedure. A metal chamber was anchored over the left cerebral hemisphere in monkey R7160 and the right cerebral hemisphere in monkey R370. The chamber was placed aseptically under isofluorane anesthesia. A chronic stimulating electrode was implanted through a recording chamber targeting the STN (Fig.1), previously identified by microelectrode mapping. The tips of the chronic stimulating electrode were connected to a programmable pulse generator (Itrel II, Medtronic Inc.) implanted subcutaneously in the monkey's back. The stimulating lead was a scaled-down version of the chronic stimulation electrode used in humans (Model 3387, Medtronic Inc.) and consisted of four metal contacts (impedances of 100–150 MΩ) each with a diameter of 0.76 mm, thickness of 0.50 mm, and separation between contacts of 0.50 mm.
Fig. 1.

Location of the electrode contacts and neurons recorded during 136 Hz at 1.8 V in monkey R7160 and at 3.0 V in monkey R370, and changes in the firing rate. The cathode of the stimulation electrode was located in the posteromedial portion of the STN in monkey R7160 and on the posterior portion of the STN in monkey R370, 1 mm lateral to that of monkey R7160. Scale bars, 5 mm. OT, Optic tract; Ret, thalamic reticular nucleus;SN, substantia nigra; STR, striatum;TH, thalamus.
Behavioral assessment. The amount of spontaneous movement was assessed using a computer-assisted method of behavioral assessment to quantify the amount of movement (Bergman et al., 1990) while the monkey was in a Plexiglas cage. Each session was videotaped for subsequent rating by examiners blinded to the experimental condition. During the videotape ratings the order of stimulation conditions was randomized, and two scorers (blinded to the experimental condition) counted the total movement time per 10 min for the arm and leg on the right and left sides of the body from the video. A post hocanalysis (Tukey's honestly significant difference) was used to determine the significance of the difference in the amount of time of limb movement. Muscle tone of the biceps brachii muscles evoked by manual elbow extension contralateral to the HFS was assessed using electromyography (EMG). The most effective pair of stimulating electrode contacts was chosen for bipolar stimulation in each animal after evaluation of the clinical effect and the adverse effects. The threshold for adverse effects was determined by inspection of the animal for capsular responses with the onset of stimulation. The effect of STN stimulation on spontaneous movement and muscle tone was compared under the different experimental conditions. Stimulation conditions were 210 μsec pulse width, 20 and 136 Hz, and 1.4, 2.4, and 3.0 V in R7160, and 90 μsec pulse width, 2, 136, and 185 Hz, and 2.0 and 3.5 V in R370. Maximal voltage for the behavioral assessment was set to just below the threshold for corticospinal contraction at 136 or 185 Hz in each monkey.
Recording procedure and data collection. Neuronal activity was recorded extracellularly from the external globus pallidus (GPe) and GPi. A glass-coated platinum–iridium microelectrode (impedances of 0.4–0.8 MΩ at 2 kHz) was positioned within the chamber with the use of an x–y coordinate microdrive (MO-95-lp, Narishige Scientific Instruments). Recording penetrations were made in parasagittal planes moving in a rostral to caudal manner at an angle of 70° to the orbitomeatal line. Neurons in GPi were examined for their response to passive manipulations of the limbs and orofacial structures. Spontaneous neuronal activity (with the animal sitting still with head fixed) was recorded under the following conditions: prestimulation, on-stimulation, and poststimulation. The duration of the prestimulation and poststimulation periods was set at 15–25 sec, and the duration of the on-stimulation period was set at 25–35 sec for 136 Hz and at 100–110 sec for 2 Hz stimulation. The change in neuronal activity was evaluated at 2 Hz stimulation with 2.4 V in R7160 and 3.0 V in R370, and at 136 Hz with 1.4 and 1.8 V in R7160, and with 2.0 and 3.0 V in R370. The 136 Hz stimulation of 1.4 V in R7160 and 2.0 V in R370 produced no apparent effect, but that of 1.8 V in R7160 and 3.0 V in R370 produced a consistent improvement in rigidity and bradykinesia, on the basis of clinical examination of animals in the primate chair. The effect of 5 min of extended 136 Hz, 3.0 V stimulation was studied in nine GP neurons in R370. The analog neuronal signal was amplified, bandpass filtered at 300–10,000 Hz, digitized, and sampled at 50 kHz with 4096-point vertical resolution for off-line analysis.
Data analysis. The software for analysis of neural signals during stimulation was developed using a C compiler running on DOS for off-line analysis (Hashimoto et al., 2002). The template of the stimulus artifact is constructed by averaging across all peristimulus segments. During stimulation, the stimulus artifact template was subtracted from the individual traces, and neuronal spikes were detected. A peristimulus time histogram (PSTH) was constructed, and mean discharge rates were determined. For comparison of the mean frequency in the prestimulation, on-stimulation, and poststimulation periods, Student's t test (two-tailed; p < 0.05) was used. A significant increase or decrease in firing probability was accepted if a single bin in the PSTH was higher or lower than the mean prestimulation firing probability ± 3.3 SDs (p = 0.001), or when the p value of two to four consecutive bins by the Wilcoxon signed rank test was <0.01.
Histological analysis. After completion of the study the monkeys were killed with an overdose of pentobarbital (100 mg/kg), and the brains were processed histologically. The brain was sectioned in the frontal plane in R7160 and in the sagittal plane in R370. Recording sites in the GPe and GPi were reconstructed by identification of gliosis along the microelectrode and HFS electrode tracks and electrophysiological landmarks (DeLong, 1971). The stimulating lead was positioned in the STN 6 mm from the midline in monkey R7160 and 7 mm from the midline in monkey R370 (Fig. 1). In both monkeys, tyrosine hydroxylase staining revealed a nearly complete loss of dopaminergic cells in the substantia nigra pars compacta.
Results
Effects of STN HFS on parkinsonian signs
Stimulation at 136 Hz was associated with increased spontaneous movement in both monkeys that was voltage and frequency dependent (Fig.2A,B). The movement was normal in nature (not dyskinetic), and although increased bilaterally, the increase was significant only for the side contralateral to stimulation. Muscle tone on the contralateral side was reduced with high-frequency stimulation (Fig. 2C). The effect of stimulation on spontaneous movement and rigidity appeared within the seconds after onset of stimulation. The improvement of rigidity disappeared within 10–20 sec and that of bradykinesia within seconds to minutes after stimulation was discontinued.
Fig. 2.
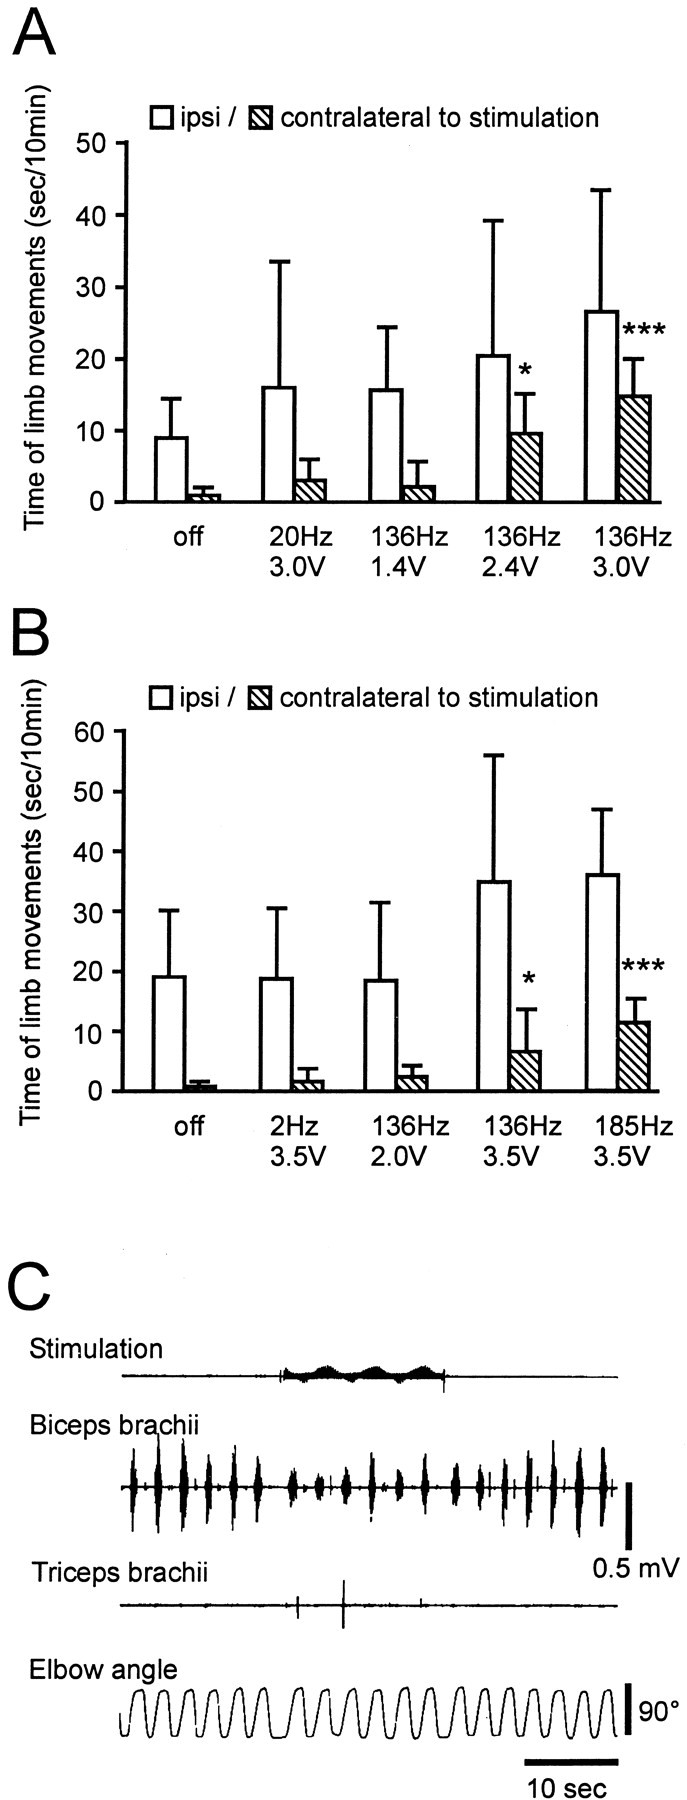
Effect of STN stimulation on movement and rigidity. The total movement time of the limbs was measured by raters blinded to the experimental condition (S.P. and M.O.) from seven recordings for each stimulation condition. Without stimulation, the monkeys sat quietly with little movement of the extremities (bradykinesia) on the side contralateral to the MPTP injection. Stimulation at 136 Hz was associated with increased movement on both sides in monkey R7160 (A) and monkey R370 (B). Increases in movement time were larger on the side contralateral to STN stimulation in both monkeys (right side in R7160, left side in R370). Asterisks indicate a significant difference in the on versus off stimulation condition: *p < 0.05, ***p < 0.001; apost hoc analysis (Tukey's honestly significant difference). C, Stimulation at 136 Hz, 3.0 V (top, stimulation signals recorded from the chamber) reduced biceps brachii EMGs (second trace, surface EMGs) induced by manual elbow extension (bottom trace) in monkey R370.
Effects of STN stimulation on pallidal neurons
In the two monkeys, the activity of a total of 110 GP neurons was studied. Eighty-two percent of GPi neurons showed somatosensory responses, indicating that most recorded GPi neurons were located in the sensorimotor territory. GPe neurons analyzed were all high-frequency-discharge type (DeLong, 1971); burst-type neurons (DeLong, 1971) were not included. The responses of 29 GPe and 47 GPi neurons were recorded during both ineffective and effective STN stimulation at 136 Hz. The locations of these neurons are illustrated in Figure 1. The effect of a range of stimulation frequencies (2, 136, and 157 Hz) at both ineffective and effective voltages (effect on rigidity and bradykinesia) on neuronal activity were studied. STN stimulation of 2 Hz at voltages and pulse widths effective in ameliorating bradykinesia and rigidity at high frequency (2.4 V, 210 μsec in monkey R7160 and 3.0 V, 90 μsec in monkey R370) produced a pattern of short-latency responses that consisted of five consecutive components of inhibition and excitation (Fig. 3, Table 1). The sequence of inhibition and excitation after 2 Hz stimulation pulses was preserved at stimulation frequencies of 136 and 157 Hz. At stimulation frequencies of 136 and 157 Hz, the later components of these short-latency responses were partially obscured by the next stimulation pulse. Consequently, at higher frequencies of stimulation the interstimulus period was occupied by four short-latency components (inhibition–excitation–inhibition–excitation). The excitation components of the short-latency responses were more tightly correlated to the time of the stimulation pulse at higher stimulation frequencies (Fig. 3).
Fig. 3.

Overlay of 50 sweeps of neuronal activity of a GPi cell during 2 Hz (top), 136 Hz (middle), and 157 Hz (bottom) stimulation at 3.0 V (R370). Depolarization (negative potential) is shown as an upward deflection. Each stimulation frequency is associated with excitation peaks at 2.5–4.0 msec and 5.5–7.0 msec after the onset of stimulation. Short-latency excitation was greater and more tightly coupled to each stimulation pulse during higher-frequency stimulation.Arrows indicate residual stimulation artifacts after artifact template subtraction.
Table 1.
Percentage of neurons showing short-latency responses after 2 Hz STN stimulation
| Latency (msec) | Response | R7160 (2.4 V) | R370 (3.0 V) | ||
|---|---|---|---|---|---|
| GPe (n = 16) | GPi (n = 22) | GPe (n = 18) | GPi (n = 27) | ||
| 1.0–2.5 | Inhibition | 31 | 77 | 56 | 67 |
| 2.5–4.5 | Excitation | 63 | 41 | 83 | 52 |
| 4.5–5.5 | Inhibition | 25 | 41 | 11 | 70 |
| 5.5–7.0 | Excitation | 19 | 73 | 33 | 63 |
| 7.0–9.0 | Inhibition | 6 | 45 | 28 | 44 |
The consistent pattern and precise latencies of the responses that occurred during stimulation changed the spontaneous irregular firing of GP neurons into a high-frequency regular pattern of discharge (Fig.4). The interstimulus interval (ISI) histograms of the prestimulation and poststimulation periods show widely varying ISIs with a small peak at 4–5 msec. The ISI histogram of the 136 Hz stimulation period, on the other hand, revealed large peaks at 4 and 8 msec, indicating a regular firing pattern with most ISIs occurring at regular intervals after the stimulation pulse. The increased mean firing rate reflected the dominant effect of the short-latency excitatory responses after each stimulation pulse (Fig.5A,B).
Fig. 4.

Rasters (A) and ISI histograms (B) of GPi neuronal activity (R370). The firing changed from an irregular pattern with varying ISIs into a high-frequency regular pattern with most ISIs occurring at 4 or 8 msec during 136 Hz, 3.0 V stimulation.
Fig. 5.

A, B, Examples of neuronal responses occurring during STN stimulation in a GPi and GPe cell, respectively. Top traces show analog signal overlays of 100 sweeps made by triggering at 10 msec intervals in the prestimulation (before start of stimulation) period and by triggering on the stimulation pulse in the on-stimulation period.Arrows indicate residual stimulation artifacts after artifact template subtraction. Middle traces display PSTHs reconstructed from successive 7.0 msec time periods in the prestimulation period and from the interstimulus periods, in the on-stimulation period. The first PSTH bin is omitted in the on-stimulation period because of signal saturation and residual stimulation artifacts. *Significant increase at p< 0.01; † significant decrease at p< 0.01; Wilcoxon signed rank test. Bottom plotsrepresent the mean firing rate calculated every 1 sec on the basis of the PSTH illustrating the time course of the firing rate.C, An example of the time course of the change in firing rate of a GPi neuron during prolonged 136 Hz STN stimulation. Increased mean discharge rates in this neuron were sustained during the 5 min stimulation period. The thick bars indicate the stimulation period.
During HFS at 136 and 157 Hz, the discharge rate quickly attained its maximum and then gradually decreased in approximately half of GPe and GPi neurons in which a change was noted. Although the discharge rate gradually decreased during stimulation, it remained higher than the prestimulation period (Fig. 5A,B). During periods of prolonged stimulation lasting >5 min, a sustained increase in mean discharge rate occurred in seven of seven GPi neurons and two of two GPe neurons (Fig. 5C).
Changes in the shape of action potentials were observed during HFS in more than half of recorded neurons in which the firing rate increased. During HFS there was a decrement in the amplitude of both the negative and positive phases (Figs. 3, 5A,B). The degree of amplitude decrement was <20% in most neurons, but a few neurons showed changes of nearly 50%. Action potential amplitude began to change with a time lag of several seconds after the start of stimulation and returned to normal within several seconds after termination of stimulation.
On the basis of the fixed latency of response with no jitter, it appeared that some GPe neurons were antidromically activated. Some of these antidromic responses may have been obscured by the stimulation artifact. Given the interference of the stimulation artifact with antidromic potentials, no attempts were made in the present study to confirm their presence in GPe by paired-pulse stimulation or collision testing.
Changes in the average firing rate of GPe and GPi neurons with 136 Hz stimulation at 1.4 and 1.8 V in monkey R7160 and 2.0 and 3.0 V in monkey R370 are shown in Figure 6. In monkey R7160 at 1.4 V stimulation at 136 Hz (ineffective in improving bradykinesia or rigidity), the overall firing rate of GPe and GPi neurons was not changed significantly (Fig.6A). At 1.8 V stimulation (effective for alleviation of parkinsonian signs), however, there was a shift in the proportion of neurons in both GPe and GPi that showed a significant increase in the average firing rate. The overall firing rate in GPe increased from 50.4 ± 9.9 (mean, SD) to 65.4 ± 28.5 spikes per second and in GPi from 63.2 ± 17.2 to 81.7 ± 37.0 spikes per second, respectively (Fig. 6B). At the effective voltage, 53% of GPe neurons (8 of 15) and 61% of GPi neurons (14 of 23) showed a significant increase in mean discharge rate (Fig. 6C). Similar to monkey R7160, in monkey R370, stimulation at 136 Hz at a voltage ineffective in improving bradykinesia or rigidity (2.0 V) did not produce a significant change in the average firing rate or discharge pattern of neurons in GPe or GPi (Fig. 6D). At a voltage effective for alleviation of parkinsonian motor signs (3.0 V stimulation at 136 Hz), however, the overall firing rate in GPe increased from 40.5 ± 17.4 to 102.9 ± 54.0 spikes per second and in GPi from 70.4 ± 27.6 to 112.0 ± 36.8 spike per second, respectively (Fig. 6E). During effective stimulation, 86% of GPe neurons (12 of 14) and 88% of GPi neurons (21 of 24) showed a significant increase in the average firing rate and developed a more regular pattern of discharge (Fig.6F).
Fig. 6.
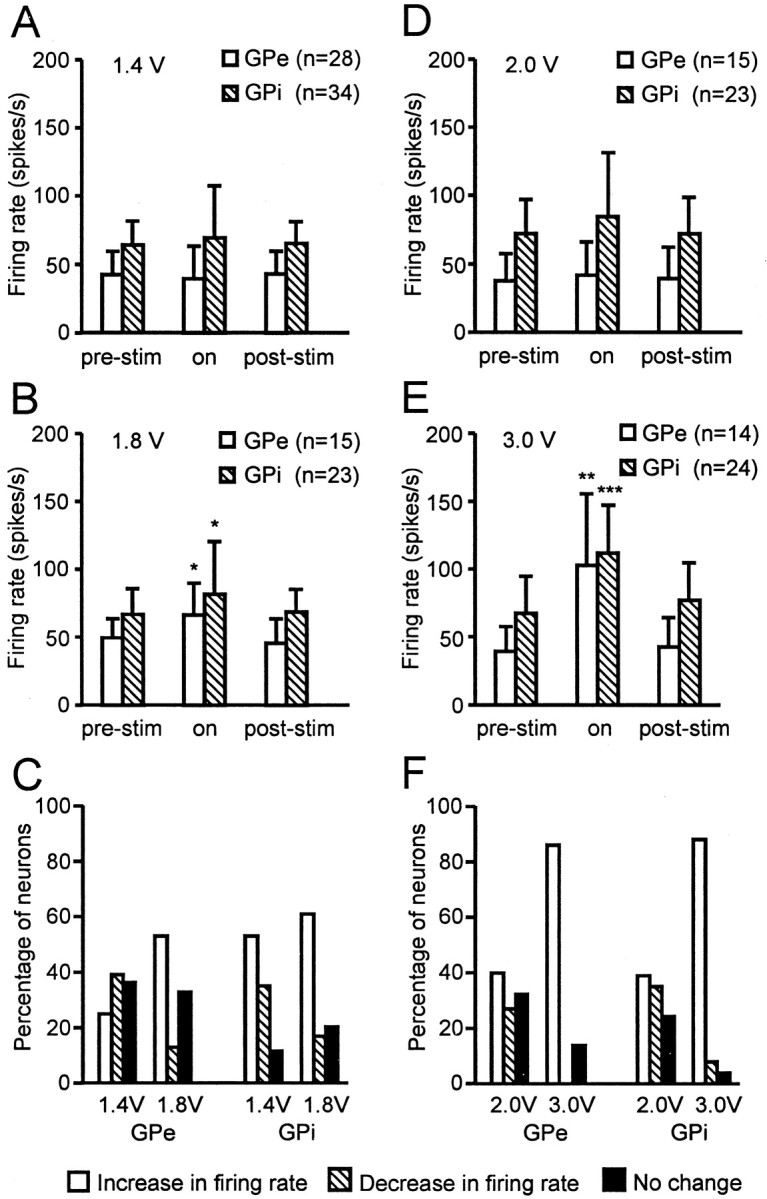
Change in the mean firing rate of GPe and GPi neurons during 136 Hz STN stimulation in the two monkeys.A–C, Monkey R7160. During 1.4 V stimulation, the firing rates did not change significantly in either GPe or GPi, but during 1.8 V stimulation, the mean discharge rate increased significantly, and the percentage of neurons displaying a change in the firing rate showed a strong shift to excitation in both GPe and GPi. D–F, Monkey R370. Stimulation of 2.0 V did not induce a significant change in the firing rate, but 3.0 V stimulation increased the firing rate significantly and shifted the percentage of neurons to excitation in both GPe and GPi. Asterisks indicate a significant difference in on versus off stimulation conditions. Significant differences: *p < 0.01, **p < 0.001, ***p < 0.001; t test.
Discussion
Our experimental setting closely reproduces the HFS system used in humans, and the results demonstrated that STN stimulation produces short-latency excitatory responses that tonically increase the average firing rate in both GPi and GPe. The results are in stark contrast to previous studies in anesthetized rats that showed a reduction of EP and SNr activity consistent with suppression of STN neuronal output during STN HFS (Benazzouz et al., 1995; Beurrier et al., 2001). We also observed a decrease in the ratio of action potential amplitude to duration in many neurons, similar to the change preceding depolarization block as observed in spinal or nigral dopamine neurons (Curtis et al., 1960; Hollerman et al., 1992). Although the increased firing rate in GP neurons was sustained in the present study, it is possible that STN neurons could enter a state of depolarization block with inhibition of STN neuronal activity, as observed in previous studies (Benazzouz et al., 1995; Beurrier et al., 2001). Although activation of GPi neurons coincident with inhibition of STN during HFS in the STN may appear paradoxical, it is consistent with previous modeling studies suggesting that axons exiting the stimulated structure may be activated at stimulation parameters that inhibit neuronal activity (McIntyre and Grill, 1999). Our studies were also performed in awake primates using a stimulating lead that is similar to that used in humans. Thus, the difference in the experimental conditions could also contribute to the different observations and may explain the discrepancy between our results and that of the previous study.
Although we did not directly explore the mechanism(s) underlying the short-latency excitation and inhibition observed in this study, it is likely that the earliest excitatory response (peak, 3–4 msec after the stimulation pulse) occurred as the result of orthodromic activation of STN → GPe and STN → GPi axons. The latency of monosynaptic EPSPs of STN → EP nucleus projections of 1.7 ± 0.5 msec (mean, SD) reported in the rat (Nakanishi et al., 1991) and that of STN → GPe, GPi projections of 2–10 msec in the monkey (Nambu et al., 2000) would be consistent with this assumption. The second facilitation (peak, 5.5–7.0 msec after the stimulation pulse) could occur as a result of splitting the early excitation peak into two excitation periods by interposition of the second inhibition. The second inhibition at 4.5–5.5 msec may have been elicited through disynaptic STN → GPe and GPe → GPi pathways or by the refractory period of the earliest excitation. The inhibition preceding the earliest excitation evoked by STN stimulation in GPi could occur as the result of antidromic activation of GPe → STN collaterals to GPi, consistent with single neuron staining studies in the rat (Kita and Kitai, 1994) and the monkey (Shink et al., 1996; Sato et al., 2000). This would also be consistent with previous observations in Japanese macaques of antidromic activation of GPe at 1.0 ± 0.3 msec (mean, SD) (Hasegawa and Hamada, 2000) after stimulation in the STN and may provide physiological confirmation of the existence of axon collaterals from GPe to GPi (Smith et al., 1994; Nambu and Llinás, 1997). In addition to the above mechanisms, resetting of pallidal neuronal activity after IPSPs has been reported (Kita, 2001), and this mechanism could also contribute to the induction of a more rhythmic discharge pattern, time-synchronized to inhibitory inputs.
A leading hypothesis regarding the development of movement disorders of basal ganglia origin suggests that hyperkinetic and hypokinetic disorders occur as a result of changes in the mean discharge rate in the GPi and SNr, which in turn suppress thalamocortical output (Albin et al., 1989; DeLong, 1990). Metabolic studies using positron emission tomography (Playford et al., 1992; Eidelberg et al., 1994) and physiological recordings of neuronal activity in the basal ganglia (Miller and DeLong, 1987; Filion and Tremblay, 1991) are consistent with this hypothesis. In addition to changes in mean discharge rate, however, altered firing patterns in the pallidum have also been reported in MPTP-induced parkinsonian animals. Increases in bursting activity (Filion and Tremblay, 1991; Bergman et al., 1994), periodic oscillatory activity (Bergman et al., 1994; Nini et al., 1995;Raz et al., 2000), and synchronization of GPi (Bergman et al., 1994;Nini et al., 1995) or GPi and striatal neurons (Raz et al., 2001) have all been reported to occur in this model. Increases in bursting and oscillation patterns of STN neurons in parkinsonian animals have also been observed (Bergman et al., 1994; Hassani et al., 1996; Plenz and Kitai, 1999), suggesting that the altered STN output may contribute to the observed changes in pattern in GPi neurons. Synchronized oscillatory bursts of the GPe, GPi, or STN have been proposed to have a causative relationship for the development of parkinsonian motor signs (Bergman et al., 1994; Nini et al., 1995). Synchronous oscillation in the basal ganglia may break down independent processing in the motor circuit and disrupt signal processing at the cortical level (Raz et al., 2000). The results from the present study indicate that the firing rate in these structures is not an absolute determinant for the development or relief of parkinsonian symptoms. Indeed, the change in discharge pattern in GP neurons during STN HFS, from an irregular to a stimulus-synchronized regular pattern of discharge in the face of a further increase in mean discharge rate, suggests that temporal and spatial patterns of neuronal activity in the basal ganglia may play a more significant role than rate in the development of parkinsonian motor signs.
The significance of changes in temporal and spatial firing patterns of neurons in the basal ganglia in the pathophysiology of movement disorders has been supported by observations in humans with PD and dystonia undergoing microelectrode recording procedures. Decreased firing rates in the GPi have been commonly observed in patients with generalized dystonia (Lozano et al., 1997; Lenz et al., 1998; Vitek et al., 1999) and hemiballism (Lozano et al., 1997; Suarez et al., 1997;Vitek et al., 1999), both of which have been classified as hyperkinetic disorders. Although inactivation of the GPi is expected to worsen hyperkinetic disorders by increased disinhibition of the thalamocortical projection, most patients with generalized dystonia and hemiballism have shown significant improvement by posteroventral pallidotomy (Lozano et al., 1997; Suarez et al., 1997; Ondo et al., 1998; Vitek et al., 1999). Irregular firing and widened sensory receptive fields in GPi cells were observed in generalized dystonia, and a “burst and pause” firing pattern correlated to EMG activity in the hemiballistic limb has been reported (Lenz et al., 1998; Vitek et al., 1999). Abolition of dystonia and hemiballism after inactivation of the GPi by pallidotomy suggests that the abnormal firing pattern is more fundamental to the development of these movement disorders than the mean firing rate.
The present study demonstrates that during STN stimulation the interstimulus period is occupied by periodic sequences of neuronal activity in the pallidum that are time-locked to the stimulation pulse. As a result, there may be little chance for a spike train conveying normal or abnormal information to reach its targets intact. In a functional sense, improvement of parkinsonian motor signs by STN HFS may be achieved by blocking transmission of altered patterns of neuronal activity in the basal ganglia to its target structures in the thalamus and brainstem. Conceptually, high-frequency regular firing of the pallidum resulting from STN HFS may itself represent a form of abnormal activity. Thus, HFS may essentially replace one type of subcortical noise with another that is less disruptive to cortical function.
In summary, the present results provide experimental evidence to support the concept that HFS increases output from the stimulated site and changes the firing pattern and mean discharge rate of neurons at the projection sites. The results further support the hypothesis that altered patterns of neuronal activity in the basal ganglia play a significant role in the pathophysiology of movement disorders and provide a physiological basis for the improvement of parkinsonian motor signs during HFS in the STN.
Footnotes
This work was supported National Institutes of Health Grants R-29NS30719 and RO1 NS 37019 and a grant from Medtronic Inc., Neurological Division. We thank M. R. DeLong, M. D. Crutcher, T. Wichmann, and G. Russo for discussions and for reviewing this manuscript.
Correspondence should be addressed to Dr. Jerrold L. Vitek, Department of Neurology, Woodruff Memorial Building, Suite 6000, Emory University School of Medicine, 1639 Pierce Drive, Atlanta, GA 30322. E-mail: jvitek@emory.edu.
References
- 1.Albin RL, Young AB, Penny JB. The functional anatomy of basal ganglia disorders. Trends Neurosci. 1989;12:366–375. doi: 10.1016/0166-2236(89)90074-x. [DOI] [PubMed] [Google Scholar]
- 2.Benabid AL, Pollak P, Gervason C, Hoffmann D, Gao DM, Hommel M, Perret JE, De Rougemont J. Long-term suppression of tremor by chronic stimulation of the ventral intermediate thalamic nucleus. Lancet. 1991;337:403–406. doi: 10.1016/0140-6736(91)91175-t. [DOI] [PubMed] [Google Scholar]
- 3.Benazzouz A, Piallat B, Pollak P, Benabid AL. Responses of substantia nigra pars reticulata and globus pallidus complex to high frequency stimulation of the subthalamic nucleus in rats: electrophysiological data. Neurosci Lett. 1995;189:77–80. doi: 10.1016/0304-3940(95)11455-6. [DOI] [PubMed] [Google Scholar]
- 4.Bergman H, Wichmann T, DeLong MR. Reversal of experimental parkinsonism by lesions of the subthalamic nucleus. Science. 1990;249:1436–1438. doi: 10.1126/science.2402638. [DOI] [PubMed] [Google Scholar]
- 5.Bergman H, Wichmann T, Karmon B, DeLong MR. The primate subthalamic nucleus. II. Neuronal activity in the MPTP model of parkinsonism. J Neurophysiol. 1994;72:507–520. doi: 10.1152/jn.1994.72.2.507. [DOI] [PubMed] [Google Scholar]
- 6.Beurrier C, Bioulac B, Audin J, Hammond C. Subthalamic nucleus neurons switch from single-spike activity to burst-firing mode. J Neurosci. 2001;85:1351–1356. doi: 10.1523/JNEUROSCI.19-02-00599.1999. [DOI] [PMC free article] [PubMed] [Google Scholar]
- 7.Curtis DR, Phillis JW, Watkins JC. The chemical excitation of spinal neurones by certain acidic amino acids. J Physiol (Lond) 1960;150:656–682. doi: 10.1113/jphysiol.1960.sp006410. [DOI] [PMC free article] [PubMed] [Google Scholar]
- 8.Davis KD, Taub E, Houle S, Lang AE, Dostrovsky JO, Tasker RR, Lozano AM. Globus pallidus stimulation activates the cortical motor system during alleviation of parkinsonian symptoms. Nat Med. 1997;3:671–674. doi: 10.1038/nm0697-671. [DOI] [PubMed] [Google Scholar]
- 9.DeLong MR. Activity of pallidal neurons during movement. J Neurophysiol. 1971;34:414–427. doi: 10.1152/jn.1971.34.3.414. [DOI] [PubMed] [Google Scholar]
- 10.DeLong MR. Primate models of movement disorders of basal ganglia origin. Trends Neurosci. 1990;13:281–285. doi: 10.1016/0166-2236(90)90110-v. [DOI] [PubMed] [Google Scholar]
- 11.Eidelberg D, Moeller JR, Dhawan V, Spetsieris P, Takikawa S, Ishikawa T, Chaly T, Robeson W, Margouleff D, Przedborski S, Fahn S. The metabolic topography of parkinsonism. J Cereb Blood Flow Metab. 1994;14:783–801. doi: 10.1038/jcbfm.1994.99. [DOI] [PubMed] [Google Scholar]
- 12.Filion M, Tremblay L. Abnormal spontaneous activity of globus pallidus neurons with MPTP-induced parkinsonism. Brain Res. 1991;547:142–151. [PubMed] [Google Scholar]
- 13.Hammond C, Deniau JM, Rizk A, Feger J. Electrophysiological demonstration of an excitatory subthalamonigral pathway in the rat. Brain Res. 1978;151:235–244. doi: 10.1016/0006-8993(78)90881-8. [DOI] [PubMed] [Google Scholar]
- 14.Hasegawa N, Hamada I. Physiologic evidence for the afferent innervation of the subthalamic nucleus (STN) by the external pallidal segment (GPe) in primates. Jpn J Physiol. 2000;50[Suppl]:S156. [Google Scholar]
- 15.Hashimoto T, Elder CM, Vitek JL. A template subtraction method for stimulus artifact removal in high-frequency deep brain stimulation. J Neurosci Methods. 2002;113:181–186. doi: 10.1016/s0165-0270(01)00491-5. [DOI] [PubMed] [Google Scholar]
- 16.Hassani OK, Mouroux M, Féger J. Increased subthalamic neuronal activity after nigral dopaminergic lesion independent of disinhibition via the globus pallidus. Neuroscience. 1996;72:105–115. doi: 10.1016/0306-4522(95)00535-8. [DOI] [PubMed] [Google Scholar]
- 17.Hollerman JR, Abercrombie ED, Grace AA. Electrophysiological, biochemical, and behavioral studies of acute haloperidol-induced depolarization block of nigral dopamine neurons. Neuroscience. 1992;47:589–601. doi: 10.1016/0306-4522(92)90168-2. [DOI] [PubMed] [Google Scholar]
- 18.Kita H. Neostriatal and globus pallidus stimulation induced inhibitory postsynaptic potentials in entopeduncular neurons in rat brain slice preparations. Neuroscience. 2001;105:871–879. doi: 10.1016/s0306-4522(01)00231-7. [DOI] [PubMed] [Google Scholar]
- 19.Kita H, Kitai ST. The morphology of globus pallidus projection neurons in the rat: an intracellular staining study. Brain Res. 1994;636:308–319. doi: 10.1016/0006-8993(94)91030-8. [DOI] [PubMed] [Google Scholar]
- 20.Kitai ST, Kita H. Anatomy and physiology of the subthalamic nucleus: a driving force of the basal ganglia. In: Carpenter MB, Gessa GL, editors. The basal ganglia II. Structure and function: current concepts. Plenum; New York: 1987. pp. 357–373. [Google Scholar]
- 21.Krack P, Pollak P, Limousin P, Hoffmann D, Xie J, Benazzouz A, Benabid AL. Subthalamic nucleus or internal pallidal stimulation in young onset Parkinson's disease. Brain. 1998;121:451–457. doi: 10.1093/brain/121.3.451. [DOI] [PubMed] [Google Scholar]
- 22.Kumar R, Lozano AM, Montgomery E, Lang AE. Pallidotomy and deep brain stimulation of the pallidum and subthalamic nucleus in advanced Parkinson's disease. Mov Disord. 1998;13[Suppl 1]:73–82. [PubMed] [Google Scholar]
- 23.Lenz FA, Suarez JI, Verhagen Metman L, Reich SG, Karp BI, Hallett M, Rowland LH, Dougherty PM. Pallidal activity during dystonia: somatosensory reorganization and changes with severity. J Neurol Neurosurg Psychiat. 1998;65:767–770. doi: 10.1136/jnnp.65.5.767. [DOI] [PMC free article] [PubMed] [Google Scholar]
- 24.Limousin P, Pollak P, Benazzouz A, Hoffmann D, Le Bas J-F, Broussolle E, Perret JE, Benabid AL. Effect on parkinsonian signs and symptoms of bilateral subthalamic nucleus stimulation. Lancet. 1995;345:91–95. doi: 10.1016/s0140-6736(95)90062-4. [DOI] [PubMed] [Google Scholar]
- 25.Lozano AM, Kumar R, Gross RE, Giladi N, Hutchison WD, Dostrovsky JO, Lang AE. Globus pallidus internus pallidotomy for generalized dystonia. Mov Disord. 1997;12:865–870. doi: 10.1002/mds.870120606. [DOI] [PubMed] [Google Scholar]
- 26.McIntyre CC, Grill WM. Excitation of central nervous system neurons by nonuniform electric fields. Biophys J. 1999;76:878–888. doi: 10.1016/S0006-3495(99)77251-6. [DOI] [PMC free article] [PubMed] [Google Scholar]
- 27.Miller WC, DeLong MR. Altered tonic activity of neurons in the globus pallidus and subthalamic nucleus in the primate MPTP model of parkinsonism. In: Carpenter MB, Jayaraman A, editors. The basal ganglia II. Structure and function: current concepts. Plenum; New York: 1987. pp. 415–427. [Google Scholar]
- 28.Nakanishi H, Kita H, Kitai ST. Intracellular study of rat entopeduncular nucleus neurons in an in vitro slice preparation: response to subthalamic stimulation. Brain Res. 1991;549:285–292. doi: 10.1016/0006-8993(91)90469-c. [DOI] [PubMed] [Google Scholar]
- 29.Nambu A, Llinás R. Morphology of globus pallidus neurons: its correlation with electrophysiology in guinea pig brain slices. J Comp Neurol. 1997;377:85–94. [PubMed] [Google Scholar]
- 30.Nambu A, Tokuno H, Hamada I, Kita H, Imanishi M, Akazawa T, Ikeuchi Y, Hasegawa N. Excitatory cortical inputs to pallidal neurons via the subthalamic nucleus in the monkey. J Neurophysiol. 2000;84:289–300. doi: 10.1152/jn.2000.84.1.289. [DOI] [PubMed] [Google Scholar]
- 31.Nini A, Feingold A, Slovin H, Bergman H. Neurons in the globus pallidus do not show correlated activity in the normal monkey, but phase-locked oscillations appear in the MPTP model of parkinsonism. J Neurophysiol. 1995;74:1800–1805. doi: 10.1152/jn.1995.74.4.1800. [DOI] [PubMed] [Google Scholar]
- 32.Ondo WG, Desaloms JM, Jankovic J, Grossman RG. Pallidotomy for generalized dystonia. Mov Disord. 1998;13:693–698. doi: 10.1002/mds.870130415. [DOI] [PubMed] [Google Scholar]
- 33.Playford ED, Jenkins IH, Passingham RE, Nutt J, Frackowiak RSJ, Brooks DJ. Impaired mesial frontal and putamen activation in Parkinson's disease: a positron emission tomography study. Ann Neurol. 1992;32:151–161. doi: 10.1002/ana.410320206. [DOI] [PubMed] [Google Scholar]
- 34.Plenz D, Kitai ST. A basal ganglia pacemaker formed by the subthalamic nucleus and external globus pallidus. Nature. 1999;400:677–682. doi: 10.1038/23281. [DOI] [PubMed] [Google Scholar]
- 35.Raz A, Vaadia E, Bergman H. Firing patterns and correlations of spontaneous discharge of pallidal neurons in the normal and the tremulous 1-methyl-4 phenyl-1,2,3,6-tetrahydropyridine vervet model of parkinsonism. J Neurosci. 2000;20:8559–8571. doi: 10.1523/JNEUROSCI.20-22-08559.2000. [DOI] [PMC free article] [PubMed] [Google Scholar]
- 36. Raz A, Frechter-Mazar V, Feingold A, Abeles M, Vaadia E, Bergman H. Activity of pallidal and striatal tonically active neurons is correlated in MPTP-treated monkeys but not in normal monkeys. J Neurosci 21 2001. RC128(1–5). [DOI] [PMC free article] [PubMed] [Google Scholar]
- 37.Sato F, Lavallée P, Lévesque M, Parent A. Single-axon tracing study of neurons of the external segment of the globus pallidus in primate. J Comp Neurol. 2000;417:17–31. [PubMed] [Google Scholar]
- 38.Shink E, Bevan MD, Bolam JP, Smith Y. The subthalamic nucleus and the external pallidum: two tightly interconnected structures that control the output of the basal ganglia in the monkey. Neuroscience. 1996;73:335–357. doi: 10.1016/0306-4522(96)00022-x. [DOI] [PubMed] [Google Scholar]
- 39.Smith Y, Wichmann T, DeLong MR. Synaptic innervation of neurones in the internal pallidal segment by the subthalamic nucleus and the external pallidum in monkeys. J Comp Neurol. 1994;343:297–318. doi: 10.1002/cne.903430209. [DOI] [PubMed] [Google Scholar]
- 40.Suarez JI, Verhagen Metman L, Reich SG, Dougherty PM, Hallett M, Lenz FA. Pallidotomy for hemiballsmus: efficacy and characteristics of neuronal activity. Ann Neurol. 1997;42:807–811. doi: 10.1002/ana.410420519. [DOI] [PubMed] [Google Scholar]
- 41.Vitek JL, Chockkan V, Zhang J-Y, Kaneoke Y, Evatt M, DeLong MR, Triche S, Mewes K, Hashimoto T, Bakay RAE. Neuronal activity in the basal ganglia in patients with generalized dystonia and hemiballism. Ann Neurol. 1999;46:22–35. doi: 10.1002/1531-8249(199907)46:1<22::aid-ana6>3.0.co;2-z. [DOI] [PubMed] [Google Scholar]
- 42.Windels F, Bruet N, Poupard A, Urbain N, Chouvet G, Feuerstein C, Savasta M. Effects of high frequency stimulation of subthalamic nucleus on extracellular glutamate and GABA in substantia nigra and globus pallidus in the normal rat. Eur J Neurosci. 2000;12:4141–4146. doi: 10.1046/j.1460-9568.2000.00296.x. [DOI] [PubMed] [Google Scholar]