

Abstract
Postsynaptic AMPA receptor desensitization leads to depression at some synapses. Here we examine whether desensitization occurs at mossy fiber to granule cell synapses and how synaptic architecture could contribute. We made whole-cell voltage-clamp recordings from granule cells in rat cerebellar slices at 34°C, and stimulated mossy fibers with paired pulses. The amplitude of the second EPSC was depressed by 60% at 10 msec and recovered with τ ∼30 msec. This fast component of recovery from depression was reduced by cyclothiazide and enhanced when release probability was increased, suggesting that it reflects postsynaptic receptor desensitization. We evaluated the importance of synaptic ultrastructure to spillover and desensitization by using serial electron microscopy to reconstruct mossy fiber glomeruli. We found that mossy fiber boutons had hundreds of release sites, that the average center-to-center distance between nearest release sites was 0.46 μm, and that these sites had an average of 7.1 neighbors within 1 μm. In addition, glia did not isolate release sites from each other. By contrast, desensitization plays no role in paired-pulse depression at the cerebellar climbing fiber, where glial ensheathment of synapses is nearly complete. This suggests that the architecture of the mossy fiber glomerulus can lead to desensitization and short-term depression. Modeling indicates that, as a consequence of the close spacing of release sites, glutamate released from a single site can desensitize AMPA receptors at neighboring sites, even when the probability of release (pr) is low. When pr is high, desensitization would be accentuated by such factors as glutamate pooling.
Keywords: cyclothiazide, short-term plasticity, paired-pulse depression, spillover, glomerulus, desensitization
Introduction
Mossy fibers provide the major excitatory input to cerebellar granule cells, which are the most numerous cell type in the brain (Palay and Chan-Palay, 1974). The mossy fiber terminal contacts the dendrites of as many as 50 granule cells, with 1–10 release sites per granule cell (Jakab and Hamori, 1988;Jakab, 1989), producing a large glomerular structure. Electron microscopic studies have demonstrated that the release sites onto different dendritic processes are close to each other, suggesting that neurotransmitter may spill over between adjacent release sites (Palay and Chan-Palay, 1974; DiGregorio et al., 2002). Indeed, spillover between sites contributes to the time course of mossy fiber synaptic currents (DiGregorio et al., 2002).
The finding that glutamate spillover can activate receptors suggests that spillover can also desensitize receptors at neighboring postsynaptic densities. Cerebellar granule cells may be particularly susceptible to this phenomenon because they express AMPA receptors that rapidly desensitize (Mosbacher et al., 1994; Silver et al., 1996; Wall and Usowicz, 1998). Although the role of desensitization in short-term plasticity has not previously been examined at the mossy fiber to granule cell synapse, desensitization is known to produce profound short-term depression at other synapses (Trussell et al., 1993; Rozov et al., 2001; Chen et al., 2002). Synapses with prominent desensitization often have many release sites that are poorly isolated from each other in calyceal or glomerular structures. It has been hypothesized that desensitization is prominent at synapses with this type of architecture when a high release probability leads to glutamate release from many sites into a confined space. As a result glutamate pools, leading to a prolonged elevation of extracellular glutamate that is particularly effective at desensitizing glutamate receptors (Trussell et al., 1993; Otis et al., 1996a).
To evaluate the role of desensitization at mossy fiber to granule cell synapses, we examined short-term plasticity and quantified ultrastructural parameters that could influence spillover. We found that desensitization leads to prominent paired-pulse depression at the mossy fiber to granule cell synapse. In addition, serial electron microscopy showed that there are hundreds of release sites on each mossy fiber and that glia do not insulate these sites from each other. This ultrastructure is consistent with the hypothesis that a high release probability could lead to significant glutamate pooling and AMPA receptor desensitization. We also found that release sites are much closer together than an upper bound estimated from single sections (DiGregorio et al., 2002). Furthermore, we found that each release site had an average of seven neighboring release sites within a micrometer. Simulations of glutamate diffusion indicate that a vesicle released at one site can elevate glutamate to sufficiently high levels to desensitize receptors at many neighboring postsynaptic densities. This suggests that as a result of the high density of release sites, significant desensitization could occur at the mossy fiber synapse even when the probability of release is low and there is not appreciable glutamate pooling.
Materials and Methods
Electrophysiology. Sagittal cerebellar slices were prepared from the vermis of 17– to 21-d-old Sprague Dawley rats as described previously. Briefly, animals were anesthetized and decapitated, and the cerebellum was removed and placed into low-sodium, ice-cold artificial CSF containing (in mm): 79.1 NaCl, 22.7 NaHCO3, 68.2 sucrose, 22.7 glucose, 2.27 KCl, 1.14 NaH2PO4, 6.36 MgCl2, 0.45 CaCl2, bubbled with 95% O2/5% CO2, pH 7.1 (305 mOsm). Slices were cut on a Leica (Nussloch, Germany) VT1000S vibroslicer at 300 μm thickness and incubated at 30°C for 20 min in low-sodium solution and then for 40 min in standard recording solution containing (in mm): 125 NaCl, 26 NaHCO3, 1.25 NaH2PO4, 2.5 KCl, 25 glucose, 1 MgCl2, 2 CaCl2. Slices were then maintained at room temperature until recording.
All recordings were performed at 34°C. The bath was perfused at 3–4 ml/min using a Gilson (Middleton, WI) Minipulse 3 pump, with saline running through an in-line heater (SH-27B with TC-324B controller;Warner Instruments, Hamden, CT). Recordings of AMPA EPSCs were made in the presence of 20 μmbicuculline (Sigma, St. Louis, MO) and 5 μm3-((R)-2-carboxypiperazin-4-yl)-propyl-1-phosphoric acid (CPP) (Tocris, Ellisville, MO). Cyclothiazide (Tocris) was used at 50 μm. Slices were viewed using an Olympus (Melville, NY) BX50WI microscope with a 60× objective. Whole-cell recordings were made from granule cells using an Axopatch 200A (Axon Instruments, Foster City, CA) with 2–3 MΩ borosilicate micropipettes containing (in mm): 35 CsF, 100 CsCl, 10 EGTA, 10 HEPES, pH 7.2 (300 mOsm). Cells were voltage clamped at −70 mV. For NMDA EPSCs, recordings were made in the standard recording solution but modified to contain 3 mm CaCl2 and 0 mm MgCl2, and in the presence of 5 μm glycine, 10 μm NBQX, and 20 μm bicuculline. Presynaptic mossy fibers were stimulated by placing a 5–10 μm micropipette in the granule cell layer and stimulating with 6–14 μA (A360 stimulus isolator; World Precision Instruments, Sarasota, FL). Single or paired stimuli were applied every 20–60 sec. For paired stimuli at short intervals with significantly overlapping EPSCs, the amplitude of the second pulse was determined after subtracting the average single-pulse EPSC. Stimulation and data collection were done using an ITC-16 (Instrutech Corp., Port Washington, NY) controlled using Pulse Control software running in Igor (Wavemetrics, Lake Oswego, OR) on an Apple Macintosh (Cupertino, CA).
Electron microscopy. We processed two postnatal day 18 rats (38 and 53 gm) for electron microscopy. Each rat was anesthetized with 0.05 ml of ketaset (Henry Schein, Melville, NY) plus 0.05 ml of xylazine (Lloyd Labs, Shenandoah, IA) and then perfused through the heart with 50 ml of Ames medium (Sigma) including 0.25 gm/l heparin and 5 gm/l procaine, followed by 100 ml 2% formaldehyde and 2.5% glutaraldehyde (Tousimis, Rockville, MD) in pH 7.4 Sorenson's buffer. The brain was removed and postfixed in the same fixative overnight. The cerebellum was then dissected in 0.2 m cacodylate buffer, pH 7.4, embedded in 2% agar/2% gelatin, and cut sagittally on a tissue chopper to 0.75 mm. The slices were fixed in 2% OsO4/3% KFeCN for 2 hr at 4°C, washed with maleate buffer, pH 5.2, stained in 1% uranyl acetate in maleate buffer for 2 hr at room temperature, washed with maleate buffer, dehydrated through an ethanol series, washed in propylene oxide, pre-embedded with equal parts resin and propylene oxide, embedded in resin containing 23%/v Epon 812 (Tousimis), 23%/v Araldite 6005 (Tousimis), and 54%/v dodecenyl succinic anhydride (Fisher, Springfield, NJ), and polymerized for 24 hr at 60°C. Two ultrathin series were cut, one from each rat, of 96 and 177 sections. Sections were placed on Formvar-coated slot grids and stained with uranyl acetate and lead citrate. Grids were mounted in a rotating holder (SRH-10mod; courtesy of K. M. Harris, JEOL, Peabody, MA) and photographed on a JEOL 1200EX at 8000× and 60 kV.
Mossy fiber images were processed as described previously (Xu-Friedman et al., 2001). Briefly, images were scanned on a Duoscan 2500 (AGFA, Ridgefield Park, NJ), aligned using SEM Align, and structures of interest were traced using IGL Trace (Synapse Web, Boston University, http://synapses.bu.edu/). Section thickness was calibrated using the technique of Fiala and Harris (2001). Mossy fiber axons were identified by the structural characteristics described in Palay and Chan-Palay (1974). Release sites were identified by the presence of a presynaptic cluster of vesicles close to the membrane, active zone material, and a postsynaptic density (PSD). Missing and folded sections were corrected for by interpolating between the structures on adjacent sections. Climbing fiber images were reanalyzed from an earlier study (Xu-Friedman et al., 2001). Three-dimensional reconstructions were prepared in trueSpace (Caligari, Mountain View, CA).
To measure distances between release sites, traced mossy fibers were imported into Igor. To make a regular grid of points on the surface, the tracings were downsampled such that the point spacing along the tracings equaled the section thickness. The closest point on the mossy fiber to the center of each PSD was determined. The center-to-center distance between release sites along the surface of the mossy fiber was determined using the A* search algorithm (Russell and Norvig, 1998). A* is an iterative search algorithm that finds the shortest distance between two sites. We also measured center-to-center distances treating glia as barriers to movement along the surface of the mossy fiber. This had no measurable effect on our results, and the data presented in Figure 6 were calculated without including the effects of glia.
Fig. 6.

Distances between release sites. A, Distribution of distances to nearest neighbor. The distribution was determined separately for each mossy fiber and then normalized and averaged. Inset, Cumulative frequency histogram of nearest neighbor distances for four mossy fibers. B, Average number of release sites encountered at varying distances from a starting release site. This was determined separately for each mossy fiber and then averaged together. Inset, Close-up of the same relationship over the first 1 μm away from the average release site.
Modeling glutamate diffusion and AMPA receptor desensitization. We modeled diffusion of a single vesicle from a single release site as an instantaneous point source on an infinite plane surface. For these conditions, the concentration is given by:
| Equation 1 |
where r is the distance from the release site,t is the time since release, M is the total amount of glutamate released, and D is the diffusion constant (Crank, 1975). For a spherical vesicle of radius ρ, and initial concentration C0, thenM = 4/3 πρ3C0. This gives the glutamate concentration as a surface density, so to get concentration in units of molarity, we divide by the synaptic cleft width, λ:
| Equation 2 |
We set the parameters of Equation 2 using our electron micrographs and data from the literature. From our electron micrographs, the vesicle size is ∼50 nm in diameter, so we chose ρ = 25 nm. In addition, the cleft width at the synapse is ∼20 nm, but narrower further away (see Fig. 4B). The cleft width is affected to an unknown degree by tissue preparation, so we chose a constant value of λ = 20 nm. Vesicle glutamate concentration has been measured as 60–200 mm(Riveros et al., 1986; Burger et al., 1989), so we chose an intermediate value of 100 mm, which corresponds to ∼4000 molecules. The rate of glutamate diffusion through extracellular space is not well known. The maximum possible rate of diffusion would be D = 0.96 μm2/msec, based on the value measured for glutamine in water at 25°C (0.75 μm2/msec) (Longsworth, 1953), corrected to 34°C with Q10 = 1.3 (Hille, 1992). However,D is likely to be less than that because of viscosity of extracellular space, so we use the value 0.4 μm2/msec, as used by others (Otis et al., 1996a).
Fig. 4.
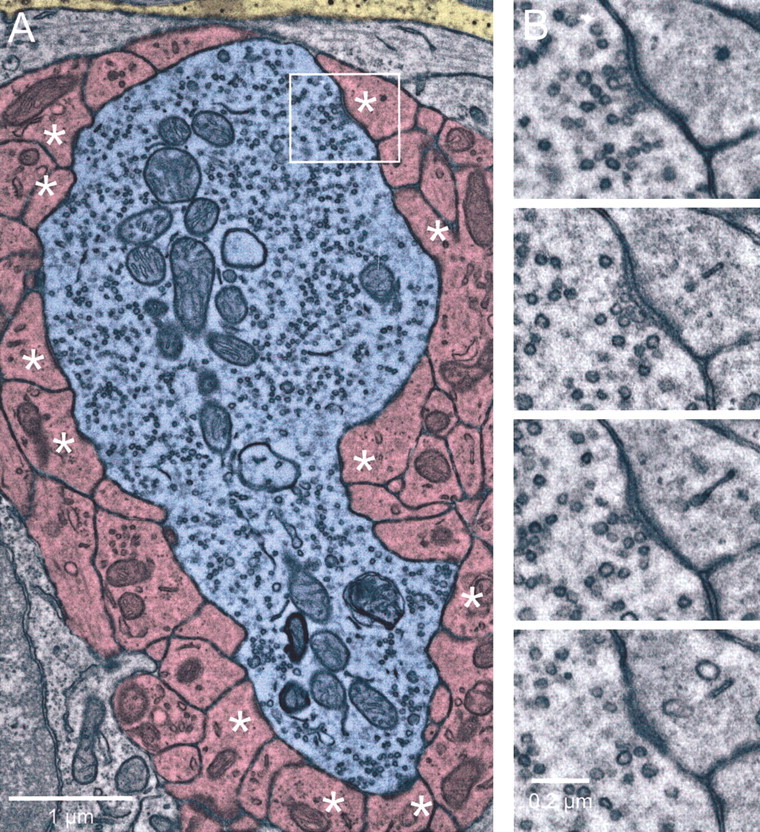
Mossy fiber ultrastructure. A, Single electron microscopic section of a mossy fiber glomerulus. The mossy fiber axon is shaded blue, granule cell dendritic processes that receive synaptic contacts from the mossy fiber in this or adjacent sections are shaded pink, and glial processes are shaded yellow. Other structures, including granule cell somata or dendritic processes that make no synaptic contact, are not shaded. Release sites are marked byasterisks. The boxed area is enlarged inB. B, Serial sections through one release site. The release site consists of a cluster of presynaptic vesicles, active zone material, widening of the synaptic cleft, and postsynaptic density.
To find the peak glutamate concentration at distance r, we take the partial derivative of C with respect tot, and set it to 0, and then solve for t. Thus, the peak glutamate concentration is reached at time:
| Equation 3 |
The concentration at time tpeakis given by substituting Equation 3 into Equation 2:
| Equation 4 |
We used the results of our model of glutamate diffusion to drive two models of AMPA receptor desensitization with different properties. The models were run in Igor, using Euler integration. The first was developed by Häusser and Roth (1997) for Purkinje cell outside-out patches and adjusted to 33–35°C by Wadiche and Jahr (2001), as shown in Model 1.
| Equation Model_1 |
The transition constants are (in sec−1): C0⇌C1 = 1.37 · 107 M−1forward, 2040 backward; C1⇌C2 = 6.02 · 106 M−1, 4720; C2⇌O = 17200, 3730; O⇌C7 = 114, 90.5; C1⇌C3 = 422, 100; C3⇌C4 = 1.37 · 107 M−1, 1054; C4⇌C5 = 476, 984; C5⇌C6 = 10340, 4000; C6⇌C7 = 0.324, 2.99; C2⇌C4 = 2000, 46.7; O⇌C5 = 3.11, 0.692. The forward transitions between C0⇌C1, C1⇌C2, and C3⇌C4 depend on glutamate binding, and so the forward rate must be multiplied by the glutamate concentration. States C3–C7 were summed to evaluate the fraction of desensitized receptors.
The second model was developed by Raman and Trussell (1995) for chick magnocellularis neuron outside-out patches, as shown in Model 2.
| Equation Model_2 |
The transition constants are (in sec−1): C0⇌C1 = 3 · 107M−1 forward, 300 backward; C1⇌C2 = 2 · 107M−1, 6 · 105; C2⇌O2s= 3000, 350; C2⇌O2f= 6 · 104, 3000; C1⇌D1 = 103, 300; D1⇌D2 = 2 · 107M−1, 1038; D2⇌C3 = 3 · 106M−1, 220; C3⇌O3 = 6, 2000; C2⇌D2= 2.7 · 104, 14. The forward transition constants C0⇌C1, C1⇌C2, D1⇌ D2, and D2⇌C3 are multiplied by the glutamate concentration. States D1 and D2 were summed to evaluate the fraction of desensitized receptors.
Results
Paired-pulse depression and AMPA receptor desensitization
We examined short-term synaptic plasticity at the mossy fiber glomerulus by recording from granule cells in whole-cell voltage clamp in sagittal slices. All experiments were conducted at 34°C, so that the kinetics of any temperature-sensitive processes contributing to short-term plasticity would be close to physiological. We stimulated the presynaptic mossy fibers using pairs of pulses with a range of interpulse intervals (Δt).
The second EPSC recorded in the granule cell was depressed with respect to the first. As shown in the representative traces of Figure1A, at Δt = 10 msec the paired-pulse ratio (PPR = amplitude of EPSC2/amplitude of EPSC1) was 0.22 for one cell and 0.52 for a second cell. This depression could be attributable to presynaptic processes such as vesicle depletion or to postsynaptic processes such as receptor desensitization.
Fig. 1.

Depression is reduced by cyclothiazide. All experiments were performed at 34°C in the presence of 5 μm CPP. Stimulus artifact has been removed for clarity.A, Two separate experiments showing the effect of cyclothiazide. Left, Average EPSCs recorded in 2 mm Cae after stimulation with interpulse interval Δt = 10 msec. Right, Average EPSCs after washing in cyclothiazide. Traces are averages of 5–13 trials. B, PPR at Δt = 10 msec in 2 and 3 mm Cae, with and without 50 μm cyclothiazide. Ratios are average ± SE of 12–51 experiments. C, Increase in PPR for Δt = 10 msec after addition of cyclothiazide. Ratios are average ± SE of 12–21 experiments.
To evaluate whether the depressed response was caused by AMPA receptor desensitization, we applied cyclothiazide (50 μm), which prevents desensitization (Yamada and Tang, 1993). For the experiments shown in Figure 1A, cyclothiazide increased the amplitude and prolonged the time course of the EPSC. In addition, PPR for the first cell increased to 0.55, and for the second it increased to 0.78. Thus cyclothiazide relieved depression for both cells, but the PPR increased to different extents (150% in Fig. 1A1vs 50% in Fig. 1A2).
We measured PPR for a number of mossy fiber connections at Δt = 10 msec in control and cyclothiazide. On average, in 2 mm external calcium (2 Cae), PPR in control conditions was 0.43 ± 0.03 (mean ± SEM; n = 51), and in cyclothiazide PPR was 0.65 ± 0.04 (n = 21) (Fig.1B). Taking the ratio of PPR in cyclothiazide to the control PPR gives an indication of the effectiveness of cyclothiazide. For synapses examined in both 2 Cae and 2 Cae + cyclothiazide, PPR increased by 83 ± 14% (n = 21) (Fig. 1C). In addition, cyclothiazide increased the initial EPSC amplitude by 35 ± 8% and increased the EPSC half-width from 1.1 ± 0.1 to 4.5 ± 0.4 msec.
We also examined PPR under different conditions of initial release probability (pr) by increasing the concentration of external calcium to 3 mm and eliminating external magnesium to keep total divalents constant (3 Cae). Higher external calcium should increase pr and the amount of glutamate released during the first EPSC, and thus increase the amount of desensitization for the second EPSC (Trussell et al., 1993). In 3 Cae, the extent of paired-pulse depression was greater (PPR = 0.32 ± 0.04; n= 22), and it was relieved to a greater extent in cyclothiazide (PPR = 0.53 ± 0.04; n = 12) (Fig.1B). For synapses examined in both 3 Cae and 3 Cae + cyclothiazide, PPR increased by 133 ± 33% (n = 12) (Fig. 1C). In addition, the amplitude of the initial EPSC increased by 27 ± 5%, and the EPSC half-width increased from 1.0 ± 0.1 to 6.1 ± 0.9 msec.
We were concerned about possible nonspecific effects of cyclothiazide on PPR. Cyclothiazide has been reported to affect presynaptic terminals (Diamond and Jahr, 1995; Ishikawa and Takahashi, 2001), thereby altering the probability of release, which could change PPR. To control for that, we examined the NMDA EPSC in the presence of 10 μm NBQX in 3 Cae, where the effects of cyclothiazide were the greatest. Addition of 50 μmcyclothiazide had a negligible effect on the integral of the EPSC (96 ± 2% of control; n = 5) (Fig.2A). This suggests that the change in PPR of the AMPA EPSC does not reflect a large decrease in the probability of release.
Fig. 2.
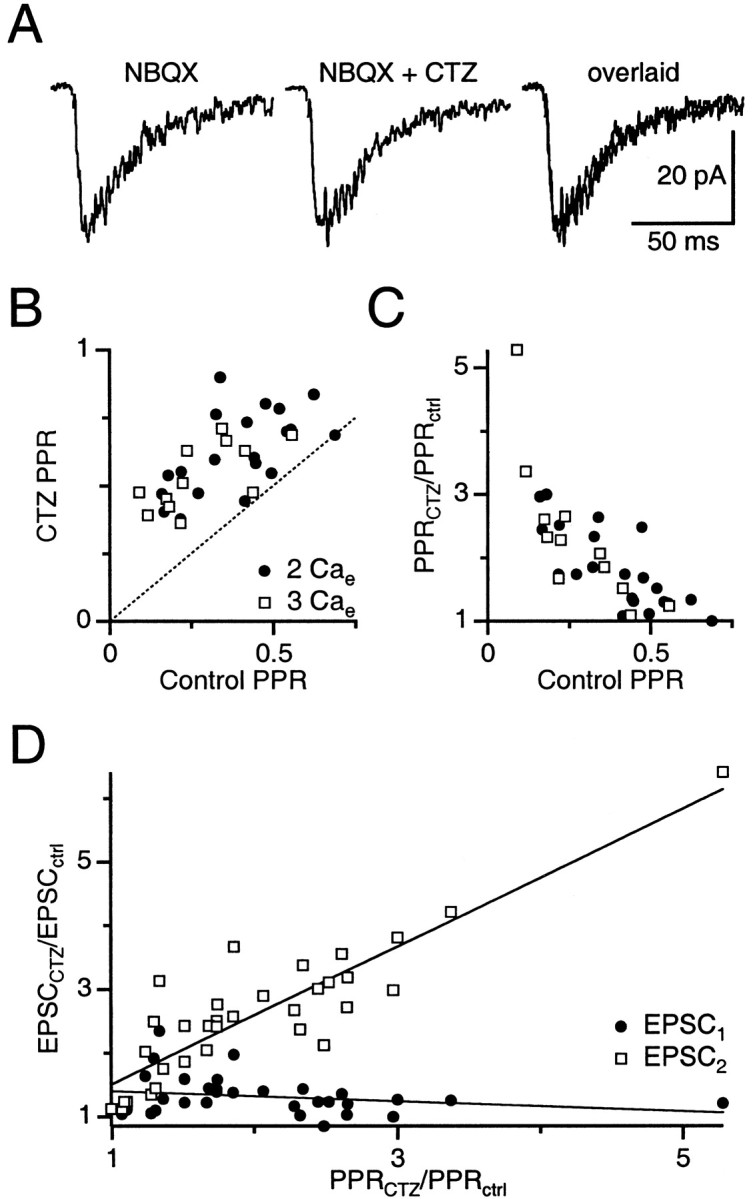
Cyclothiazide specifically affects AMPA receptor desensitization. A, No effect of cyclothiazide on NMDA EPSCs. Sample experiment in the presence of 10 μm NBQX and no CPP shows the NMDA EPSC in control (left), after addition of cyclothiazide (middle), and these two traces overlaid (right). The same lack of effect was found in four other experiments. B, Relationship between PPR at Δt = 10 msec in control conditions and cyclothiazide, in 2 mm Cae and 3 mmCae. Each point is from a single experiment. Dotted line is unity. C, Relationship between control PPR at Δt = 10 msec and the increase in PPR after addition of cyclothiazide, in 2 mm Cae and 3 mm Cae. D, Relationship between the increase in EPSC amplitude and the increase in PPR after addition of cyclothiazide for a number of experiments. Lines are fits to the data (EPSC1: intercept = 1.48 ± 0.13, slope = −0.08 ± 0.06; EPSC2: intercept = 0.43 ± 0.22, slope = 1.08 ± 0.10).
We also explored further indications of the specific effects of cyclothiazide on desensitization by taking advantage of the variability between different experiments. We examined the relationship between PPR at Δt = 10 msec in control and cyclothiazide for individual synapses and found it to be linear in both 2 Cae and 3 Cae (Fig.2B). Although the mean PPRs in 2 Cae and 3 Cae were different (Fig. 1B), the linear relationship between PPR in control and cyclothiazide for individual synapses was the same regardless of Cae(F(2,29) = 0.33; p = 0.72) (Glantz, 1997) and had a high correlation (r = 0.61). PPR in cyclothiazide was never less than PPR in control conditions (Fig. 2B,C). By considering the ratio of PPR in cyclothiazide to control (Fig.2C), it was clear that for connections with the greatest depression in control conditions (PPR < 0.25), the relative increase in PPR after treatment with cyclothiazide was the greatest. These results are consistent with the depression being caused by desensitization, because synapses with greater susceptibility to desensitization should be relieved to a greater extent by cyclothiazide. The relationship is the same whether the synapse is in 2 or 3 Cae.
Cyclothiazide also increases AMPA receptor affinity for glutamate (Yamada and Tang, 1993; Partin et al., 1996), which could cause AMPA receptors to become saturated on the first pulse, thereby reducing depression and increasing PPR. If cyclothiazide causes receptor saturation, then the change in EPSC1 amplitude should be least for synapses with the greatest increase in PPR, whereas the change in EPSC2 amplitude should be constant regardless of the increase in PPR. By contrast, if cyclothiazide changes PPR by relieving receptor desensitization, then the change in EPSC1 amplitude should be constant regardless of the increase in PPR, whereas the change in EPSC2amplitude should equal the change in PPR.
Our results are consistent with cyclothiazide reducing desensitization and not with increasing saturation. The increase in EPSC1 amplitude was constant across all experiments (slope = 0.080 ± 0.062; n = 33; Student's t = 1.29; p = 0.79) (Fig.2D). In addition, the increase in EPSC2 amplitude matched the increase in PPR with a slope not significantly different from 1 (slope = 1.08 ± 0.102; n = 33; Student's t = 0.80;p = 0.57) (Fig. 2D). These effects are most consistent with cyclothiazide increasing PPR specifically by relieving desensitization, during which cyclothiazide has a constant effect on the amplitude of EPSC1 but a variable effect on EPSC2 that depends on the initial amount of desensitization.
We also examined the time course of short-term plasticity by varying the interpulse interval. The recovery from depression is rapid in control conditions, as illustrated in the representative experiment of Figure 3A. At Δt = 10 msec, PPR was 0.49, but it recovered to 0.93 by Δt = 50 msec. Although this rapid recovery is consistent with recovery from desensitization, it could also reflect a presynaptic process, such as rapid calcium-dependent recovery from depression (Dittman and Regehr, 1998; Wang and Kaczmarek, 1998). To test this, we examined the time course of recovery of PPR in cyclothiazide in a separate population of cells. The representative mossy fiber in Figure 3B showed reduced levels of depression at Δt = 10 msec (PPR = 0.76), which subsequently recovered.
Fig. 3.
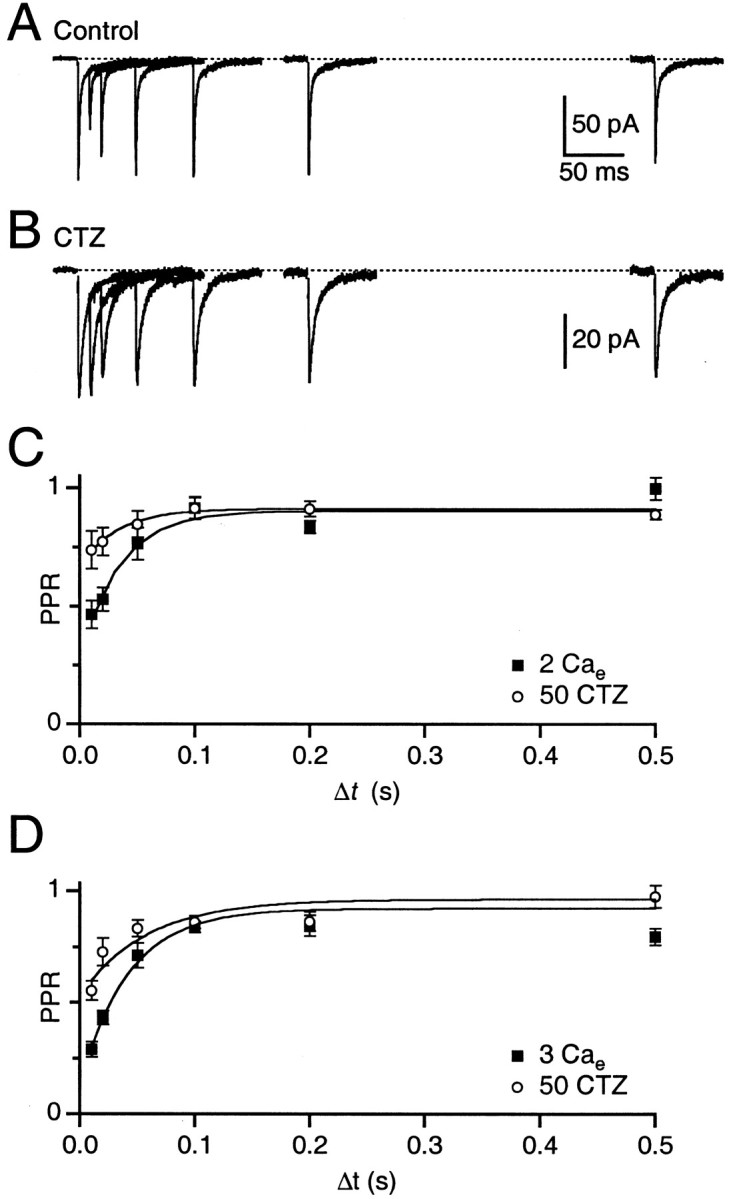
Fast component of depression is reduced by cyclothiazide. A, Single experiment showing EPSC paired-pulse plasticity in 2 mm Cae. The mossy fiber was stimulated twice with varying intervals. Eachtrace is the average of five to six trials.B, Separate experiment from A showing paired-pulse plasticity in the presence of 50 μmcyclothiazide. Each trace is the average of 10–13 trials. C, Paired-pulse plasticity in 2 mmCae, in the presence and absence of 50 μm cyclothiazide. Each point is the average of 9–11 experiments. D, Paired-pulse plasticity in 3 mm Cae, in the presence and absence of 50 μm cyclothiazide. Each point is the average of 8–10 experiments.
On average, the extent of depression was reduced in cyclothiazide (Fig.3C). We fit the recovery curves to an equation of the form PPR = A − B exp (−Δt/τ), where B represents the amplitude of depression and τ the rate of recovery. The amplitude of depression was 62% in control and only 25% in cyclothiazide. The PPR recovered at the same rate in control (τ = 35 msec) and in cyclothiazide (τ = 33 msec). We also examined the time course of recovery in 3 Cae and fit it to a single exponential (Fig.3D). Recovery from depression was rapid (τ = 42 msec), and the extent of depression was greater (79%). In cyclothiazide, PPR recovered with τ = 58 msec, and the amplitude of depression was reduced to 43%.
Thus, despite treatment with cyclothiazide, a portion of the fast depressing component persisted and had an identical rate of recovery, which suggests that 50 μm was not sufficient to completely prevent AMPA receptor desensitization. This could be because cyclothiazide has less effect on flop isoforms of AMPA receptors (Partin et al., 1994), which are expressed on granule cells (Mosbacher et al., 1994). Higher concentrations of cyclothiazide (100 μm) abolished the fast component, which is consistent with the fast component being caused entirely by receptor desensitization (n = 6). However, these results are difficult to interpret because 100 μmcyclothiazide also affected depression at longer times. This suggests that such high concentrations could have a significant presynaptic effect, as seen at other synapses (Diamond and Jahr, 1995; Ishikawa and Takahashi, 2001). We therefore restricted our studies to 50 μm cyclothiazide, which only affected rapid recovery from depression, suggesting that under these conditions there was little presynaptic effect. Our results thus represent a lower bound of the effects of desensitization on synaptic plasticity.
Serial electron microscopic reconstructions
The experiments described so far suggest that desensitization is the primary mechanism underlying paired-pulse depression at mossy fiber synapses at short interpulse intervals. To gain a better understanding of the anatomical characteristics that could contribute to this phenomenon, we made serial electron microscopic reconstructions of four mossy fibers from two rats.
The mossy fiber terminal is several micrometers across (Fig.4A, blue). It contains many small vesicles and a large number of mitochondria. The mossy fiber contacts a large number of granule cell dendrites, which cover most of its surface area (Fig. 4A,pink). Each postsynaptic granule cell gives rise to several processes, and each process receives one or more release sites (Fig. 4A, asterisks). A release site was identified by a presynaptic cluster of vesicles, active zone material, and a postsynaptic density (Fig. 4B). Glial processes are apparent in the vicinity of the mossy fiber terminal, although direct contact with the mossy fiber is limited (Fig.4A, yellow). Glia were recognized by their velate processes and the presence of dark granules (Palay and Chan-Palay, 1974). Release sites were frequently located close to each other without intervening glial processes (Fig. 4A,top left and bottom).
We made three-dimensional reconstructions of four mossy fiber glomeruli (Fig. 5). Their overall morphology was similar. The mossy fibers were elongated, with varying numbers of small processes. The reconstructed surface areas ranged from 69 to 200 μm2. Most of the mossy fiber surface area contacted granule cell dendrites, but 9–18% (15 ± 4%; mean ± SD) of the surface area contacted glia (Fig. 5,yellow). Most glial contact appeared to be on the protuberances, rather than on the main body of the mossy fiber.
Fig. 5.

Stereo pairs of reconstructed mossy fibers. Mossy fibers were reconstructed from 96 to 177 serial sections. The mossy fiber axon is depicted in blue. Mossy fiber membrane that contacts glia is colored yellow. Postsynaptic densities on opposing dendritic processes are indicated inred.
We identified all of the release sites in the series for each mossy fiber (Fig. 5, red). The number of release sites ranged from 191 to 440 per mossy fiber (Table 1). This corresponded to an average density of 2.5 ± 0.2 release sites per square micrometer over the entire mossy fiber surface, and 2.9 ± 0.2 release sites per square micrometer over the surface not apposed to glia. The average area of the postsynaptic densities was 0.04 ± 0.02 μm2 (n= 1322), which corresponds to an average diameter of 0.22 μm.
Table 1.
Mossy fiber reconstructions
| Mossy fiber | Membrane apposed to glia | Release sites | |||||
|---|---|---|---|---|---|---|---|
| No. | SA (μm2) | (μm2) | (%) | No. | PSD area (μm2) | Density (#/μm2) | Distance to nearest neighbor (μm) |
| 1 | 161 | 27 | 17 | 424 | 0.045 ± 0.027 | 3.2 | 0.43 ± 0.15 |
| 2 | 200 | 35 | 18 | 440 | 0.042 ± 0.019 | 2.7 | 0.48 ± 0.17 |
| 3 | 69 | 6 | 9 | 191 | 0.038 ± 0.020 | 3.0 | 0.46 ± 0.13 |
| 4 | 110 | 17 | 15 | 267 | 0.033 ± 0.017 | 2.9 | 0.45 ± 0.18 |
Averages are mean ± SD.
We measured the distance between release sites using the A* search algorithm (Russell and Norvig, 1998) and determined the nearest neighbor for each release site (Fig.6A). The average center-to-center distance to the nearest neighbor was 0.46 ± 0.16 μm, and 99% of sites had their nearest neighbor <1 μm away (Fig.6A, inset). By subtracting the release site average diameter, we calculate the average edge-to-edge distance as 0.24 μm. If the release sites were scattered uniformly over the surface of the mossy fiber, this nearest neighbor distance would occur with an average density of 2/πr2 = 3.0 sites per square micrometer, which is similar to the density that we observed.
A critical determinant of desensitization is the number of release sites encountered as glutamate diffuses away from a release site. To estimate this, we sorted all of the distances between sites and counted the number of neighbors whose distance away was less than some distancer. As the distance from the release site increased, the number of release sites encountered also increased, so that by 1 μm away, 7.1 ± 0.3 sites were encountered on average (mean ± SE; n = 4; range, 6.4–7.8) (Fig. 6B,inset). By 3 μm away, 73.0 ± 3.8 release sites were encountered (range, 65.8–83.7) (Fig. 6B). If the release sites were scattered uniformly over the surface of the mossy fiber, then this relationship could be fit to an equation of the formn =dπr2 − 1, wheren is the number of neighbors, d is the density of release sites, and r is the distance from the release site. This yields an estimated density of 2.6 sites per square micrometer, which is similar to the density that we observed.
Comparison with climbing fiber
To evaluate the ultrastructural specializations of the mossy fiber, we compared it with another cerebellar excitatory synapse, the climbing fiber. Climbing fibers make many release sites onto their postsynaptic Purkinje cells (Palay and Chan-Palay, 1974; Silver et al., 1998; Xu-Friedman et al., 2001) but show no use-dependent desensitization (Dittman and Regehr, 1998; Hashimoto and Kano, 1998). Previous serial electron microscopy showed that on average 87% of the perimeter of a climbing fiber synaptic cleft was surrounded by glia (Xu-Friedman et al., 2001). Here we make three-dimensional reconstructions of some representative release sites for direct comparison with our mossy fiber reconstructions (Fig.7). In these, the climbing fiber is colored blue, the postsynaptic density red, and the parts of the climbing fiber membrane that contact glia are colored yellow. In all of these examples, the amount of glial coverage is much greater than at the mossy fiber (Fig. 5), and notably, glia make extensive contact with the climbing fiber between release sites such that the release sites are almost fully surrounded and segregated. This physical barrier, combined with the presence of glutamate transporters on both glia and the Purkinje cell (Rothstein et al., 1994; Chaudhry et al., 1995), is likely to prevent spillover between sites.
Fig. 7.
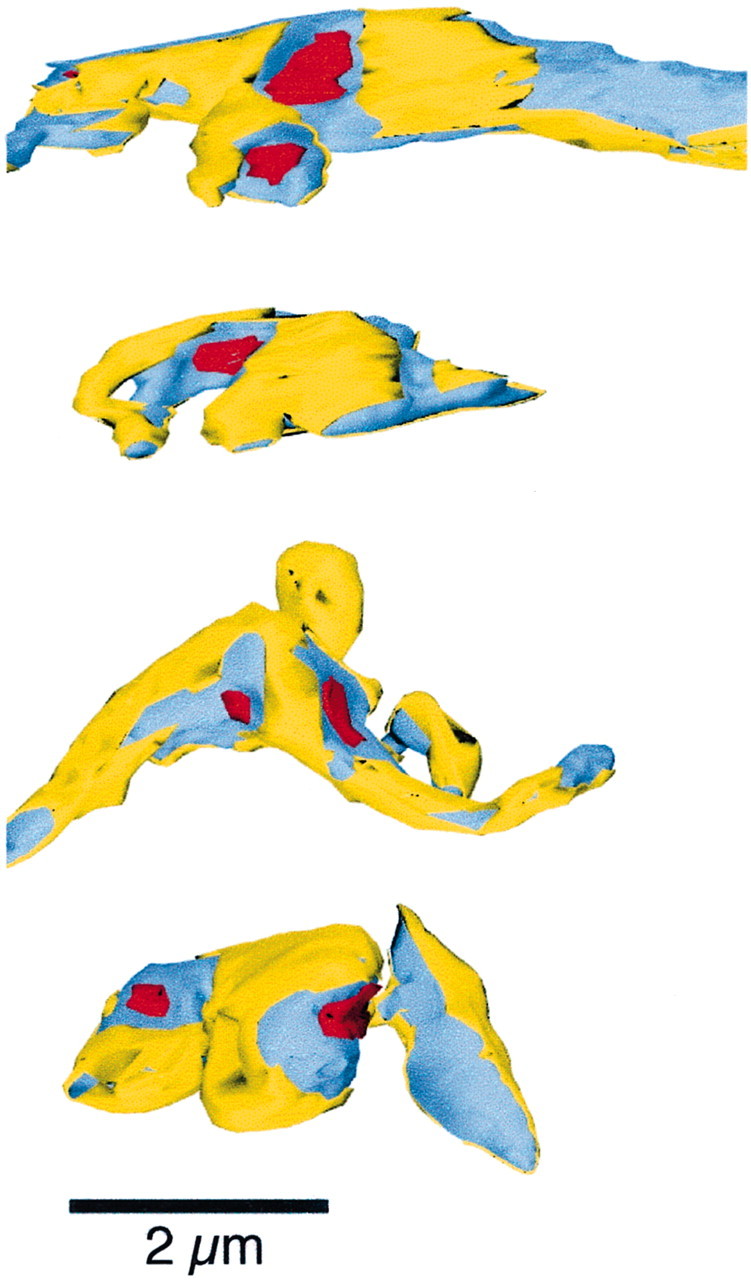
Reconstructed climbing fiber segments. The climbing fiber axon is depicted in blue. Climbing fiber membrane that contacts glia is colored yellow. Postsynaptic densities on opposing dendritic spines are indicated inred. Scale bar, 2 μm. These climbing fibers are from the data set of Xu-Friedman et al. (2001).
Modeling AMPA receptor desensitization
Our data suggest that the close spacing of mossy fiber release sites and the lack of insulation by glia could lead to spillover. Because granule cell AMPA receptors show rapid desensitization, this spillover could result in the short-term depression that we observe. To evaluate the likelihood that spillover could produce such effects, we considered the dynamics of glutamate in extracellular space. Glutamate dynamics are affected by glutamate diffusion, the geometry of extracellular space, and the locations and kinetics of glutamate pumps and buffers. At the mossy fiber, glutamate transporters appear to play only a minor role on the time scale of 10 msec (Overstreet et al., 1999; DiGregorio et al., 2002), probably because they are located on glia at a considerable distance from most release sites (Chaudhry et al., 1995). Thus, glutamate dynamics are likely to be dominated by diffusion.
Although the geometry of extracellular space can be complicated, it is instructive to consider glutamate diffusion with extracellular space approximated as a flat plane. We modeled diffusion of a single vesicle from a single release site as an instantaneous point source on an infinite plane surface, using Equation 2 and parameters derived from our electron micrographs and the literature (see Materials and Methods). Glutamate rapidly diffuses away from the release site, such that after 0.3 msec, the glutamate has spread over 1 μm away, and by 3 msec the glutamate concentration is roughly constant over the first 2 μm (Fig. 8A). At short distances (0.1 μm), the glutamate concentration rapidly rises to high levels. At 0.5 μm distance, which corresponds to the average distance between nearest neighboring release sites, glutamate reaches a peak concentration of 150 μm within 0.15 msec (Fig. 8B). At 1 μm distance, however, it reaches only 38 μm within 0.63 msec. At greater distances (> 2 μm), glutamate levels rise yet more slowly, leading to large non-uniformities in glutamate concentration over the first millisecond after release (Fig. 8B). After ∼4 msec, the concentration and rate of decay of glutamate are nearly identical over the first 2 μm. By 10 msec, extracellular glutamate levels decline to <10 μm.
Fig. 8.
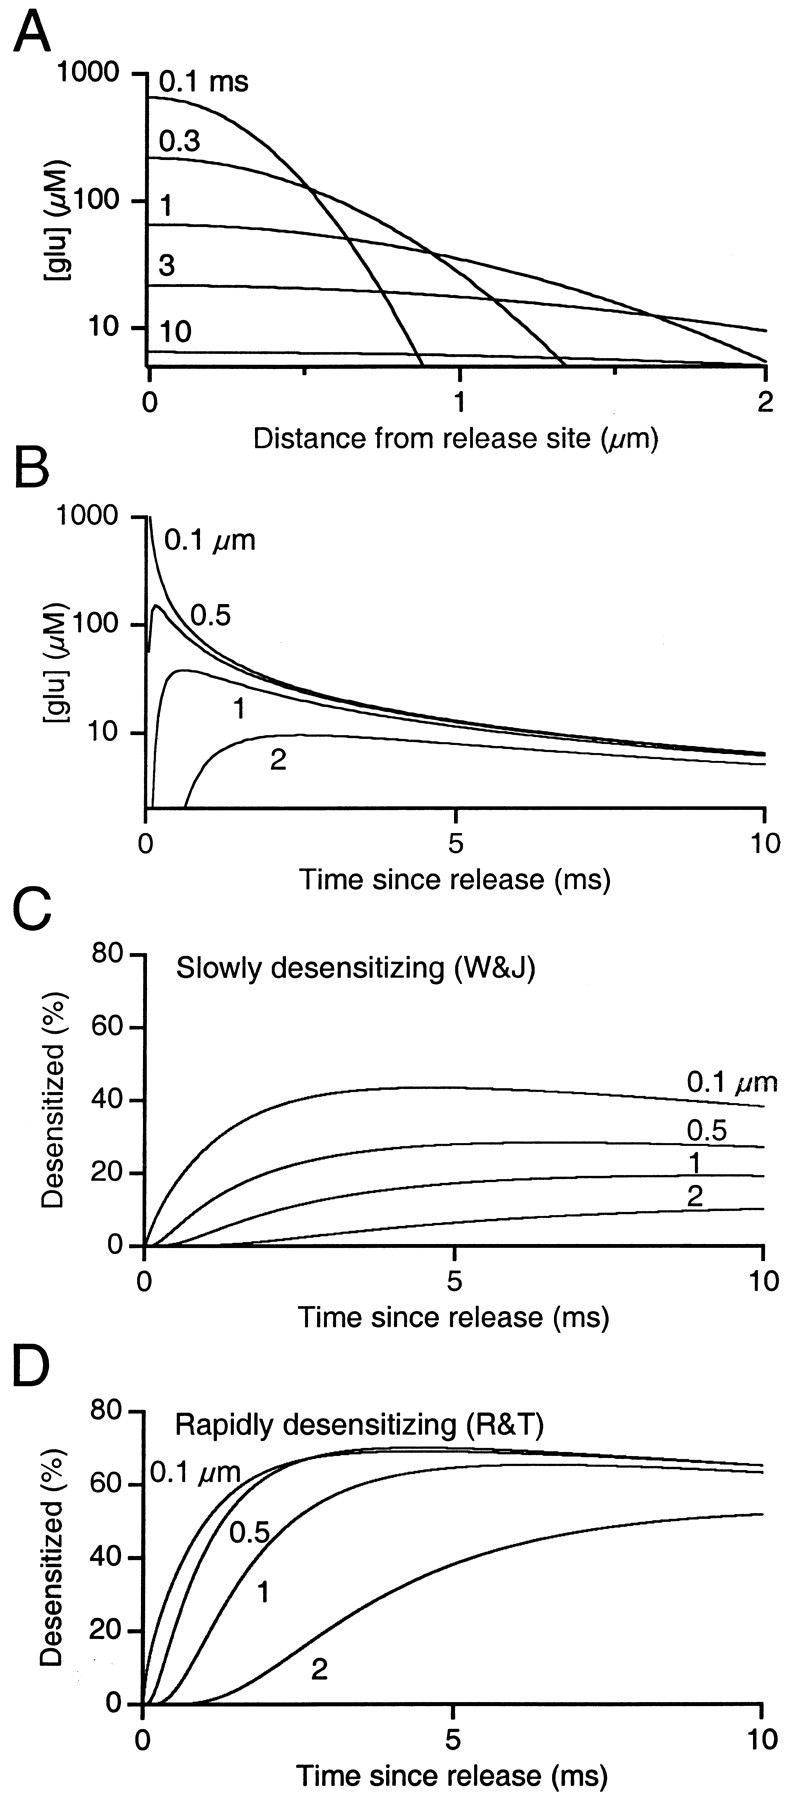
Simulation of glutamate diffusion and AMPA receptor desensitization. A, Glutamate concentration as a function of distance from the release site at a series of time points. The model was of glutamate diffusion from a single vesicle at a single release site as described by Equation 2, with vesicle radius ρ = 25 nm, initial concentrationC0 = 100 mm, cleft width λ = 20 nm, and glutamate diffusion constantD = 0.4 μm2/msec.B, Glutamate concentration as a function of time since release at various distances from the release site. C,D, AMPA receptor desensitization as a function of time since release at various distances from the release site. Two AMPA receptor models were used, based on Purkinje cell outside-out patches (C) (Model 1) (Wadiche and Jahr, 2001) and on chick magnocellularis outside-out patches (D) (Model 2) (Raman and Trussell, 1995).
We wanted to determine whether these levels of glutamate could induce significant AMPA receptor desensitization. This would require characterizing granule cell AMPA receptors using rapid glutamate application to outside-out patches. This approach is problematic because AMPA receptors are not normally expressed on granule cell somata unless they are held in culture (Silver et al., 1996; Wall et al., 2002). These somatic AMPA receptors may not have the same properties as native synaptic AMPA receptors.
Instead, we examined two well described AMPA receptor models with considerably different properties. The first is a model developed byHäusser and Roth (1997), based on Purkinje cell AMPA receptors, that was subsequently adjusted for high temperature by Wadiche and Jahr (2001). Purkinje cells predominantly express glutamate receptor subunits GluR2 and GluR3 (Martin et al., 1993; Ripellino et al., 1998), which are slowly desensitizing (Mosbacher et al., 1994). The second model that we examined was developed by Raman and Trussell (1992, 1995) and is based on chick magnocellularis neuron outside-out patch recordings. This model may be more applicable, because both chick magnocellularis neurons and cerebellar granule cells have rapidly desensitizing AMPA receptors (Raman and Trussell, 1992; Silver et al., 1996; Wall et al., 2002) and express GluR4o(Mosbacher et al., 1994; Ravindranathan et al., 2000).
We passed the glutamate transients in Figure 8Bthrough the two models and found that a significant proportion of AMPA receptors enter a desensitized state by 10 msec (Fig.8C,D). In the slowly desensitizing model ofWadiche and Jahr (2001), at 0.5 μm from the release site, 28% of AMPA receptors are desensitized after 10 msec, and at 1 μm, 19% are desensitized (Fig. 8C). The fraction of desensitized receptors then recovers with a τ of 25–30 msec. In the rapidly desensitizing model of Raman and Trussell (1995), over the first 1 μm away from the release site, >60% of the AMPAR receptors are desensitized after 10 msec, which recovers with a τ of 35–40 msec (Fig. 8D) [see also Trussell et al. (1998)]. Thus the low levels of glutamate could be sufficient to desensitize AMPA receptors at neighboring sites, and the extent of desensitization is greater for more rapidly desensitizing receptors.
The models presented here depend on several parameters that are not well known (see Materials and Methods). However, changes to the parameters that we chose for our diffusion model are unlikely to qualitatively change its implications. For example, if the diffusion constant D is lower, the peak glutamate concentration and the overall glutamate profile will be unaffected, but the time course will be prolonged (Eqs. 2, 4). This would lead to an increase in the amount of receptor desensitization under both models. If the vesicle size or glutamate concentration is lower, or if the cleft is wider, then the glutamate time course will be unaffected (Eqs. 2, 3), but lower glutamate concentrations will be reached at neighboring release sites. The main effect of lower concentration is that the number of affected release sites would decrease, but probably not drastically.
Discussion
We found that the mossy fiber to granule cell synapse exhibits paired-pulse depression and that most of this depression is caused by postsynaptic receptor desensitization. We also examined the anatomical basis for this effect using serial electron microscopy and found that mossy fiber release sites are packed together at a remarkably high density, such that a release site has an average of seven neighbors within 1 μm. Our reconstructions directly demonstrate the lack of intervening glia, which are the only structures in the glomerulus that are known to express glutamate transporters (Chaudhry et al., 1995).
Our anatomical findings support a model that AMPA-receptor desensitization and paired-pulse depression arise from elevated extracellular glutamate through spillover and pooling of glutamate from many release sites (Trussell et al., 1993; Otis et al., 1996a). At the mossy fiber, neighboring release sites are particularly close to each other (center-to-center, 0.46 μm), which brings up the additional possibility that individual release sites can influence each other. Our modeling suggests that spillover from a single release site is sufficient to desensitize a significant fraction of receptors at many adjacent release sites, potentially even in the absence of pooling, because they are so densely packed.
Criteria for use-dependent desensitization
There are a number of parameters that could affect the extent of desensitization after release. To identify which are the most critical, it is useful to compare the mossy fiber with synapses that do and do not show desensitization. Desensitization appears to play a role in paired-pulse depression at avian auditory calyceal synapses (Trussell et al., 1993; Otis et al., 1996b), the retinogeniculate synapse (Chen et al., 2002), and layer II/III cortical bipolar cells (Rozov et al., 2001). Both the avian auditory calyx and the retinogeniculate synapse have been examined at the electron microscopic level, and, like the mossy fiber, there appear to be many release sites close to each other with little intervening glia (Parks, 1981; Hamos et al., 1987). In addition, the glutamate receptors at both the avian auditory calyx and the granule cell show fast desensitization kinetics (Raman and Trussell, 1992; Mosbacher et al., 1994; Raman et al., 1994; Silver et al., 1996; Wall et al., 2002).
The mossy fiber synapse differs from the avian auditory and retinogeniculate synapses in that they each make many synapses onto a single postsynaptic target. By contrast, the mossy fiber contacts many granule cells, and each granule cell receives only a few release sites (Jakab and Hamori, 1988). At the mossy fiber, the high density of release sites is achieved by packing release sites onto many granule cells together into a single glomerulus, rather than spreading them along a series of separate varicosities. Thus, the glomerular structure is distinct from the calyx as a design for a highly desensitizing but diverging synapse.
In contrast to the synapses described above, some synapses that show short-term depression are unaffected by AMPA-desensitization blockers, for example, synapses made by climbing fibers onto Purkinje cells (Dittman and Regehr, 1998; Hashimoto and Kano, 1998) and by hippocampal CA3 pyramidal cells onto CA1 or CA3 cells (Debanne et al., 1996). We found that a major difference between the anatomical structure of climbing fiber and mossy fiber release sites is that glia contact more axonal membrane on climbing fibers and surround release sites more completely (compare Figs. 5 and 7) (Xu-Friedman et al., 2001). Glia surrounding climbing fiber synapses present a physical barrier to diffusion, and transporters on both glia and Purkinje cells will remove glutamate rapidly from extracellular space (Rothstein et al., 1994;Chaudhry et al., 1995; Otis et al., 1997; Auger and Attwell, 2000). Climbing fibers also show no physiological evidence of spillover (Wadiche and Jahr, 2001). Fewer glia at the mossy fiber results in a greater capacity for spillover.
Spillover and desensitization
Previous work suggests that the concentrations of glutamate reached in our spillover simulations are sufficient to desensitize AMPA receptors. AMPA receptor desensitization is half-maximal at 5–10 μm (Trussell and Fischbach, 1989; Raman and Trussell, 1992; Häusser and Roth, 1997). In addition, exposure to glutamate pulses as brief as 1 msec can induce significant desensitization (Trussell and Fischbach, 1989; Raman and Trussell, 1995; Häusser and Roth, 1997). In our simulations, at 1 μm distant from the release site, which encompasses seven neighboring release sites on average, the glutamate concentration is above 10 μm for 5.7 msec. Such a glutamate profile can desensitize a significant fraction of AMPA receptors in two models of AMPA receptors with different desensitization kinetics (Fig. 8C,D).
There are several ways in which the high density of mossy fiber release sites could combine with desensitizing AMPA receptors to produce the paired-pulse depression that we observe. First, as the density of release sites increases, the distance to nearest neighbors decreases, so the glutamate concentration at those neighbors would be higher (Fig.8B). Furthermore, higher density would enhance pooling of glutamate if multiple neighboring sites release vesicles. Both of these effects would increase glutamate levels and prolong receptor exposure at adjacent sites, leading to more desensitization, regardless of whether the release sites are made onto the same or different granule cells. The density of release sites at the mossy fiber and the avian auditory calyx (Parks, 1981) is particularly high, but it is much lower at the climbing fiber (Xu-Friedman et al., 2001). Thus release site density correlates with use-dependent desensitization.
Second, probability of release (pr) does affect the amount of desensitization (Figs. 1, 3, compare 2 Cae and 3 Cae), but its importance is mitigated by the high density of release sites. Our simulations suggest that glutamate reaches levels capable of inducing significant desensitization as far away as 1 μm, where the average mossy fiber release site has seven neighbors. The odds that at least one of those neighbors releases a vesicle in response to an action potential would be 80% when pr is 0.2 and 50% when pr is 0.1. In our experiments, cyclothiazide increased PPR from 0.43 to 0.65 (Fig. 1), which suggests that a minimum of 22% of granule cell AMPA receptors contributing to the second EPSC at Δt = 10 msec are desensitized. The value of pr is unknown for the mossy fiber, but the high density of release sites means that desensitization may be induced even whenpr is low.
Third, high affinity for glutamate and fast desensitization rates of the AMPA receptors will accentuate the amount of desensitization for a given amount of glutamate. Comparing the two models in Figure 8, the one based on cells that express rapidly desensitizing AMPA receptors (Fig. 8D) showed more desensitization than the one based on slowly desensitizing AMPA receptors (Fig. 8C). The rapidly desensitizing model was based on chick magnocellularis neurons, which express GluR4o, similar to the cerebellar granule cell.
Finally, our data suggest an explanation for why spillover is critical to desensitization. Without spillover, only sites that release a vesicle on the first action potential will be desensitized for the second. If pr is low, e.g., 0.1, then only 10% of these desensitized release sites will participate in the second EPSC, and because they are also partially depleted, their contribution to the EPSC will be <10%. Desensitization should only contribute to depression at these synapses whenpr is high. However, ifpr were high at a synapse with ultrastructure similar to the mossy fiber, glutamate would be unlikely to be constrained to release sites, but rather would spill out and desensitize nearby AMPA receptors. Furthermore, it is notable that the climbing fiber, which has high pr, does not show any depression attributable to desensitization (Dittman and Regehr, 1998; Hashimoto and Kano, 1998; Silver et al., 1998). Presumably the high density of transporters on both glia and the postsynaptic Purkinje cell (Rothstein et al., 1994; Chaudhry et al., 1995; Otis et al., 1997; Auger and Attwell, 2000) limits the exposure time of AMPA receptors to glutamate so that they do not enter the desensitized state for a significant time.
By contrast, a synapse that has spillover can show desensitization at much lower levels of pr provided the density of release sites is high, as at the mossy fiber glomerulus. Normally, low pr synapses do not show a presynaptic component of paired-pulse depression, because there is not significant vesicle depletion. However, a lowpr synapse could show prominent paired-pulse depression through a postsynaptic mechanism such as desensitization, particularly if its architecture were similar to the mossy fiber.
Desensitization at the mossy fiber is likely to have important consequences. Mossy fibers can fire at >100 Hz for prolonged periodsin vivo (van Kan et al., 1993), which will cause a significant drop in the AMPA receptor component of the EPSP. More work remains to be done to determine how this will affect granule cell firing properties as the NMDA component becomes relatively more prominent.
Footnotes
This work was supported by National Institutes of Health Grant NS07112 to W.G.R. We thank E. Raviola and P. Walsh for help with perfusions and tissue preparation, M. Ericsson and E. Benecchi for help with the electron microscopy, and K. Irwin for assistance with scanning and tracing micrographs. We thank K. Harris for the generous loan of equipment, and L. Trussell and I. Raman for help with modeling. We thank M. Beierlein, D. Blitz, S. Brenowitz, S. Brown, K. Foster, A. Kreitzer, and P. Safo for comments on this manuscript.
Correspondence should be addressed to Matthew A. Xu-Friedman, Department of Neurobiology, Harvard Medical School, 220 Longwood Avenue, Boston, MA 02115. E-mail:mfriedman@hms.harvard.edu.
References
- 1.Auger C, Attwell D. Fast removal of synaptic glutamate by postsynaptic transporters. Neuron. 2000;28:547–558. doi: 10.1016/s0896-6273(00)00132-x. [DOI] [PubMed] [Google Scholar]
- 2.Burger PM, Mehl E, Cameron PL, Maycox PR, Baumert M, Lottspeich F, De Camilli P, Jahn R. Synaptic vesicles immunoisolated from rat cerebral cortex contain high levels of glutamate. Neuron. 1989;3:715–720. doi: 10.1016/0896-6273(89)90240-7. [DOI] [PubMed] [Google Scholar]
- 3.Chaudhry FA, Lehre KP, van Lookeren Campagne M, Ottersen OP, Danbolt NC, Storm-Mathisen J. Glutamate transporters in glial plasma membranes: highly differentiated localizations revealed by quantitative ultrastructural immunocytochemistry. Neuron. 1995;15:711–720. doi: 10.1016/0896-6273(95)90158-2. [DOI] [PubMed] [Google Scholar]
- 4.Chen C, Blitz DM, Regehr WG. Contributions of receptor desensitization and saturation to plasticity at the retinogeniculate synapse. Neuron. 2002;33:779–788. doi: 10.1016/s0896-6273(02)00611-6. [DOI] [PubMed] [Google Scholar]
- 5.Crank J. The mathematics of diffusion. Clarendon; Oxford: 1975. [Google Scholar]
- 6.Debanne D, Guerineau NC, Gahwiler BH, Thompson SM. Paired-pulse facilitation and depression at unitary synapses in rat hippocampus: quantal fluctuation affects subsequent release. J Physiol (Lond) 1996;491:163–176. doi: 10.1113/jphysiol.1996.sp021204. [DOI] [PMC free article] [PubMed] [Google Scholar]
- 7.Diamond JS, Jahr CE. Asynchronous release of synaptic vesicles determines the time course of the AMPA receptor-mediated EPSC. Neuron. 1995;15:1097–1107. doi: 10.1016/0896-6273(95)90098-5. [DOI] [PubMed] [Google Scholar]
- 8.DiGregorio D, Nusser Z, Silver R. Spillover of glutamate onto synaptic AMPA receptors enhances fast transmission at a cerebellar synapse. Neuron. 2002;35:521–533. doi: 10.1016/s0896-6273(02)00787-0. [DOI] [PubMed] [Google Scholar]
- 9.Dittman JS, Regehr WG. Calcium dependence and recovery kinetics of presynaptic depression at the climbing fiber to Purkinje cell synapse. J Neurosci. 1998;18:6147–6162. doi: 10.1523/JNEUROSCI.18-16-06147.1998. [DOI] [PMC free article] [PubMed] [Google Scholar]
- 10.Fiala JC, Harris KM. Cylindrical diameters method for calibrating section thickness in serial electron microscopy. J Microsc. 2001;202:468–472. doi: 10.1046/j.1365-2818.2001.00926.x. [DOI] [PubMed] [Google Scholar]
- 11.Glantz SA. Primer of biostatistics. McGraw-Hill; New York: 1997. [Google Scholar]
- 12.Hamos JE, Van Horn SC, Raczkowski D, Sherman SM. Synaptic circuits involving an individual retinogeniculate axon in the cat. J Comp Neurol. 1987;259:165–192. doi: 10.1002/cne.902590202. [DOI] [PubMed] [Google Scholar]
- 13.Hashimoto K, Kano M. Presynaptic origin of paired-pulse depression at climbing fibre-Purkinje cell synapses in the rat cerebellum. J Physiol (Lond) 1998;506:391–405. doi: 10.1111/j.1469-7793.1998.391bw.x. [DOI] [PMC free article] [PubMed] [Google Scholar]
- 14.Häusser M, Roth A. Dendritic and somatic glutamate receptor channels in rat cerebellar Purkinje cells. J Physiol (Lond) 1997;501:77–95. doi: 10.1111/j.1469-7793.1997.077bo.x. [DOI] [PMC free article] [PubMed] [Google Scholar]
- 15.Hille B. Ionic channels of excitable membranes. Sinauer; Sunderland, MA: 1992. [Google Scholar]
- 16.Ishikawa T, Takahashi T. Mechanisms underlying presynaptic facilitatory effect of cyclothiazide at the calyx of Held of juvenile rats. J Physiol (Lond) 2001;533:423–431. doi: 10.1111/j.1469-7793.2001.0423a.x. [DOI] [PMC free article] [PubMed] [Google Scholar]
- 17.Jakab RL. Three-dimensional reconstruction and synaptic architecture of cerebellar glomeruli in the rat. Acta Morphol Hung. 1989;37:11–20. [PubMed] [Google Scholar]
- 18.Jakab RL, Hamori J. Quantitative morphology and synaptology of cerebellar glomeruli in the rat. Anat Embryol. 1988;179:81–88. doi: 10.1007/BF00305102. [DOI] [PubMed] [Google Scholar]
- 19.Longsworth L. Diffusion measurements, at 25°, of aqueous solutions of amino acids, peptides and sugars. J Am Chem Soc. 1953;75:5705–5709. [Google Scholar]
- 20.Martin LJ, Blackstone CD, Levey AI, Huganir RL, Price DL. AMPA glutamate receptor subunits are differentially distributed in rat brain. Neuroscience. 1993;53:327–358. doi: 10.1016/0306-4522(93)90199-p. [DOI] [PubMed] [Google Scholar]
- 21.Mosbacher J, Schoepfer R, Monyer H, Burnashev N, Seeburg PH, Ruppersberg JP. A molecular determinant for submillisecond desensitization in glutamate receptors. Science. 1994;266:1059–1062. doi: 10.1126/science.7973663. [DOI] [PubMed] [Google Scholar]
- 22.Otis T, Wu Y, Trussell LO. Delayed clearance of transmitter and the role of glutamate transporters at synapses with multiple release sites. J Neurosci. 1996a;16:1634–1644. doi: 10.1523/JNEUROSCI.16-05-01634.1996. [DOI] [PMC free article] [PubMed] [Google Scholar]
- 23.Otis T, Zhang S, Trussell LO. Direct measurement of AMPA receptor desensitization induced by glutamatergic synaptic transmission. J Neurosci. 1996b;16:7496–7504. doi: 10.1523/JNEUROSCI.16-23-07496.1996. [DOI] [PMC free article] [PubMed] [Google Scholar]
- 24.Otis TS, Kavanaugh MP, Jahr CE. Postsynaptic glutamate transport at the climbing fiber-Purkinje cell synapse. Science. 1997;277:1515–1518. doi: 10.1126/science.277.5331.1515. [DOI] [PubMed] [Google Scholar]
- 25.Overstreet LS, Kinney GA, Liu YB, Billups D, Slater NT. Glutamate transporters contribute to the time course of synaptic transmission in cerebellar granule cells. J Neurosci. 1999;19:9663–9673. doi: 10.1523/JNEUROSCI.19-21-09663.1999. [DOI] [PMC free article] [PubMed] [Google Scholar]
- 26.Palay SL, Chan-Palay V. Cerebellar cortex: cytology and organization. Springer; New York: 1974. [Google Scholar]
- 27.Parks TN. Morphology of axosomatic endings in an avian cochlear nucleus: nucleus magnocellularis of the chicken. J Comp Neurol. 1981;203:425–440. doi: 10.1002/cne.902030307. [DOI] [PubMed] [Google Scholar]
- 28.Partin KM, Patneau DK, Mayer ML. Cyclothiazide differentially modulates desensitization of alpha-amino-3-hydroxy-5-methyl-4-isoxazolepropionic acid receptor splice variants. Mol Pharmacol. 1994;46:129–138. [PubMed] [Google Scholar]
- 29.Partin KM, Fleck MW, Mayer ML. AMPA receptor flip/flop mutants affecting deactivation, desensitization, and modulation by cyclothiazide, aniracetam, and thiocyanate. J Neurosci. 1996;16:6634–6647. doi: 10.1523/JNEUROSCI.16-21-06634.1996. [DOI] [PMC free article] [PubMed] [Google Scholar]
- 30.Raman IM, Trussell LO. The kinetics of the response to glutamate and kainate in neurons of the avian cochlear nucleus. Neuron. 1992;9:173–186. doi: 10.1016/0896-6273(92)90232-3. [DOI] [PubMed] [Google Scholar]
- 31.Raman IM, Trussell LO. The mechanism of alpha-amino-3-hydroxy-5-methyl-4-isoxazolepropionate receptor desensitization after removal of glutamate. Biophys J. 1995;68:137–146. doi: 10.1016/S0006-3495(95)80168-2. [DOI] [PMC free article] [PubMed] [Google Scholar]
- 32.Raman IM, Zhang S, Trussell LO. Pathway-specific variants of AMPA receptors and their contribution to neuronal signaling. J Neurosci. 1994;14:4998–5010. doi: 10.1523/JNEUROSCI.14-08-04998.1994. [DOI] [PMC free article] [PubMed] [Google Scholar]
- 33.Ravindranathan A, Donevan SD, Sugden SG, Greig A, Rao MS, Parks TN. Contrasting molecular composition and channel properties of AMPA receptors on chick auditory and brainstem motor neurons. J Physiol (Lond) 2000;523:667–684. doi: 10.1111/j.1469-7793.2000.00667.x. [DOI] [PMC free article] [PubMed] [Google Scholar]
- 34.Ripellino JA, Neve RL, Howe JR. Expression and heteromeric interactions of non-N-methyl-d-aspartate glutamate receptor subunits in the developing and adult cerebellum. Neuroscience. 1998;82:485–497. doi: 10.1016/s0306-4522(97)00296-0. [DOI] [PubMed] [Google Scholar]
- 35.Riveros N, Fiedler J, Lagos N, Munoz C, Orrego F. Glutamate in rat brain cortex synaptic vesicles: influence of the vesicle isolation procedure. Brain Res. 1986;386:405–408. doi: 10.1016/0006-8993(86)90181-2. [DOI] [PubMed] [Google Scholar]
- 36.Rothstein JD, Martin L, Levey AI, Dykes-Hoberg M, Jin L, Wu D, Nash N, Kuncl RW. Localization of neuronal and glial glutamate transporters. Neuron. 1994;13:713–725. doi: 10.1016/0896-6273(94)90038-8. [DOI] [PubMed] [Google Scholar]
- 37.Rozov A, Jerecic J, Sakmann B, Burnashev N. AMPA receptor channels with long-lasting desensitization in bipolar interneurons contribute to synaptic depression in a novel feedback circuit in layer 2/3 of rat neocortex. J Neurosci. 2001;21:8062–8071. doi: 10.1523/JNEUROSCI.21-20-08062.2001. [DOI] [PMC free article] [PubMed] [Google Scholar]
- 38.Russell SJ, Norvig P. Artificial intelligence: a modern approach. Prentice Hall; Upper Saddle River, NJ: 1998. [Google Scholar]
- 39.Silver RA, Colquhoun D, Cull-Candy SG, Edmonds B. Deactivation and desensitization of non-NMDA receptors in patches and the time course of EPSCs in rat cerebellar granule cells. J Physiol (Lond) 1996;493:167–173. doi: 10.1113/jphysiol.1996.sp021372. [DOI] [PMC free article] [PubMed] [Google Scholar]
- 40.Silver RA, Momiyama A, Cull-Candy SG. Locus of frequency-dependent depression identified with multiple-probability fluctuation analysis at rat climbing fibre-Purkinje cell synapses. J Physiol (Lond) 1998;510:881–902. doi: 10.1111/j.1469-7793.1998.881bj.x. [DOI] [PMC free article] [PubMed] [Google Scholar]
- 41.Trussell LO, Fischbach GD. Glutamate receptor desensitization and its role in synaptic transmission. Neuron. 1989;3:209–218. doi: 10.1016/0896-6273(89)90034-2. [DOI] [PubMed] [Google Scholar]
- 42.Trussell LO, Zhang S, Raman IM. Desensitization of AMPA receptors upon multiquantal neurotransmitter release. Neuron. 1993;10:1185–1196. doi: 10.1016/0896-6273(93)90066-z. [DOI] [PubMed] [Google Scholar]
- 43.Trussell LO, Brenowitz S, Otis T. Postsynaptic mechanisms underlying synaptic depression. In: Faber DS, Korn H, Redman SJ, Thompson SM, Altman JS, editors. Central synapses: quantal mechanisms and plasticity. Human Frontier Science Program; Strasbourg: 1998. pp. 149–158. [Google Scholar]
- 44.van Kan PL, Gibson AR, Houk JC. Movement-related inputs to intermediate cerebellum of the monkey. J Neurophysiol. 1993;69:74–94. doi: 10.1152/jn.1993.69.1.74. [DOI] [PubMed] [Google Scholar]
- 45.Wadiche JI, Jahr CE. Multivesicular release at climbing fiber-Purkinje cell synapses. Neuron. 2001;32:301–313. doi: 10.1016/s0896-6273(01)00488-3. [DOI] [PubMed] [Google Scholar]
- 46.Wall MJ, Usowicz MM. Development of the quantal properties of evoked and spontaneous synaptic currents at a brain synapse. Nat Neurosci. 1998;1:675–682. doi: 10.1038/3677. [DOI] [PubMed] [Google Scholar]
- 47.Wall MJ, Robert A, Howe JR, Usowicz MM. The speeding of EPSC kinetics during maturation of a central synapse. Eur J Neurosci. 2002;15:785–797. doi: 10.1046/j.1460-9568.2002.01910.x. [DOI] [PubMed] [Google Scholar]
- 48.Wang LY, Kaczmarek LK. High-frequency firing helps replenish the readily releasable pool of synaptic vesicles. Nature. 1998;394:384–388. doi: 10.1038/28645. [DOI] [PubMed] [Google Scholar]
- 49.Xu-Friedman MA, Harris KM, Regehr WG. Three-dimensional comparison of ultrastructural characteristics at depressing and facilitating synapses onto cerebellar Purkinje cells. J Neurosci. 2001;21:6666–6672. doi: 10.1523/JNEUROSCI.21-17-06666.2001. [DOI] [PMC free article] [PubMed] [Google Scholar]
- 50.Yamada KA, Tang CM. Benzothiadiazides inhibit rapid glutamate receptor desensitization and enhance glutamatergic synaptic currents. J Neurosci. 1993;13:3904–3915. doi: 10.1523/JNEUROSCI.13-09-03904.1993. [DOI] [PMC free article] [PubMed] [Google Scholar]