Abstract
Fast electrical oscillations (FOs; >200 Hz) in the sensory neocortex can be recorded in a variety of species, including humans, and may reflect extremely fast integration of sensory information. This report demonstrates that, in the whisker representation of rat cortex, multivibrissa stimulation produces propagating FO field potential patterns and time-locked unit activity that are sensitive to submillisecond delays in interstimulus intervals. We propose that FOs may be produced by synchronized population spikes and their subthreshold sequelas in cortical pyramidal cells. FOs serve to accurately mark stimulus onset as a phase-encoded excitatory signal, producing phase-sensitive interactions that, in the context of exploratory whisking, may extract features of an object under exploration.
Keywords: fast oscillations, ripples, barrel, whisker, vibrissa, synchronization, somatosensory
Introduction
Field potentials evoked by transient physiological stimulation of somatosensory cortex are dominated by a slow wave complex that is thought to reflect asynchronous activation of supragranular and infragranular pyramidal cells, an event that occurs over tens of milliseconds after thalamocortical input (Di et al., 1990). However, recent studies using wide bandwidth recordings have revealed temporal components of the somatosensory evoked potential (SEP) complex that are an order of magnitude faster. Superimposed on the initial slow wave of the SEP are fast electrical oscillations (FOs; >200 Hz) that have received attention because they may reflect extremely rapid cellular interactions underlying somatosensory information processing (Curio et al., 1994a,b,1997; Hashimoto et al., 1996; Kandel and Buzsaki, 1997; Jones and Barth, 1999, 2002; Klostermann et al., 1999; Curio, 2000; Jones et al., 2000; Shimazu et al., 2000; Grenier et al., 2001; Ikeda et al., 2002).
Results from field potential and unit recordings of somatosensory FOs suggest that they may represent very fast interactions of local circuits established by cortical pyramidal cells (Kandel and Buzsaki, 1997; Jones and Barth, 1999, 2002; Jones et al., 2000; Grenier et al., 2001), possibly producing highly synchronized population spikes recordable at the cortical surface (Jones and Barth, 2002), similar to high-frequency ripples studied in the hippocampus (Traub et al., 1994;Schmitz et al., 2001). Inhibition appears to play little role in neocortical FO generation, because topical application of the GABAA antagonist bicuculline methiodide (BMI) has no effect on their amplitude or frequency and only serves to increase the duration of oscillatory bursts (Jones and Barth, 2002). However, despite the fact that FOs have been recorded in animal as well as human neocortex, little more is known about their neural generation and even less about their functional significance.
The purpose of the present study was to address both of these questions using combined extracellular field potential mapping and unit recording in the posteromedial barrel subfield (PMBSF) of the rat. The PMBSF consists of a columnar array of cells in the somatosensory cortex organized in somatotopic register with the 25 major vibrissas on the contralateral mystacial pad (Simons and Woolsey, 1979; Jones and Diamond, 1995). Each column or barrel represents thalamocortical terminations from a single vibrissa, as identified in cytochrome oxidase-stained tangential sections through layer 4 of the flattened cortex (Woolsey and Van der Loos, 1970). The PMBSF provides an ideal preparation for controlled examination of spatiotemporal interactions of FOs in the neocortex, because multiple discrete cortical regions may be precisely activated by stimulating single or small groups of contralateral vibrissas (Simons, 1985). In addition, the functional significance of fast interactions produced under these artificial stimulation conditions may be reasonably related to the integration of multivibrissa information required by tasks such as active touch, orienting to a stimulus, and object recognition (Simons et al., 1989).
Materials and Methods
Animals and surgery. All procedures were performed in accordance with University of Colorado Institutional Animal Care and Use Committee guidelines for the humane use of laboratory animals in biological research. Eleven adult male Sprague Dawley rats (300–400 gm) were anesthetized to surgical levels using intramuscular injections of ketamine (71 mg/kg body weight), xylazine (14 mg/kg), and acepromazine (2.4 mg/kg), placed on a regulated heating pad, and maintained with subsequent injections throughout the experiment so that the eye blink reflex could be barely elicited. A unilateral craniectomy was performed over the right hemisphere extending from bregma to lambda and from the midsagittal sinus lateral to the temporal bone, exposing a wide region of parietotemporal cortex where the dura was reflected. Animals were killed by anesthesia overdose without regaining consciousness at the conclusion of the experiment.
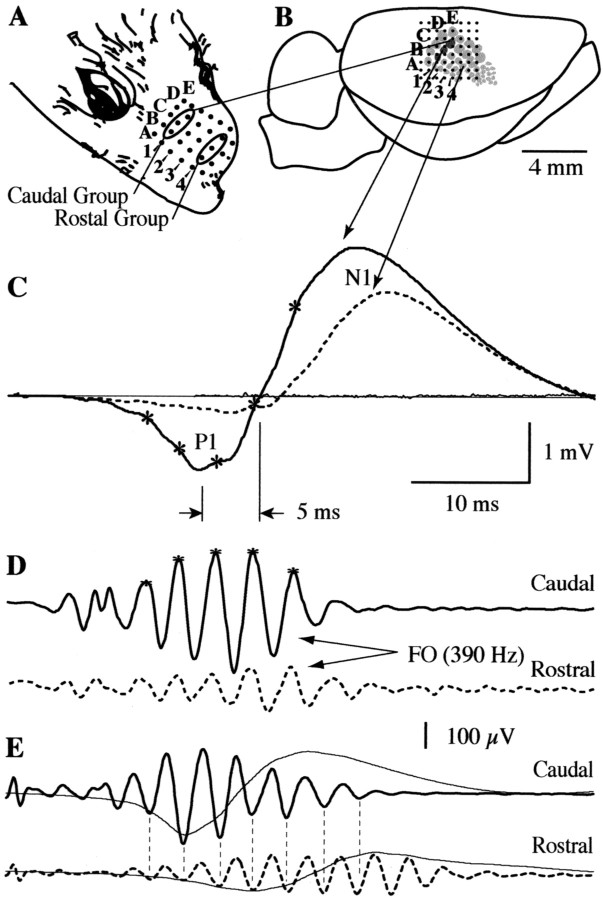
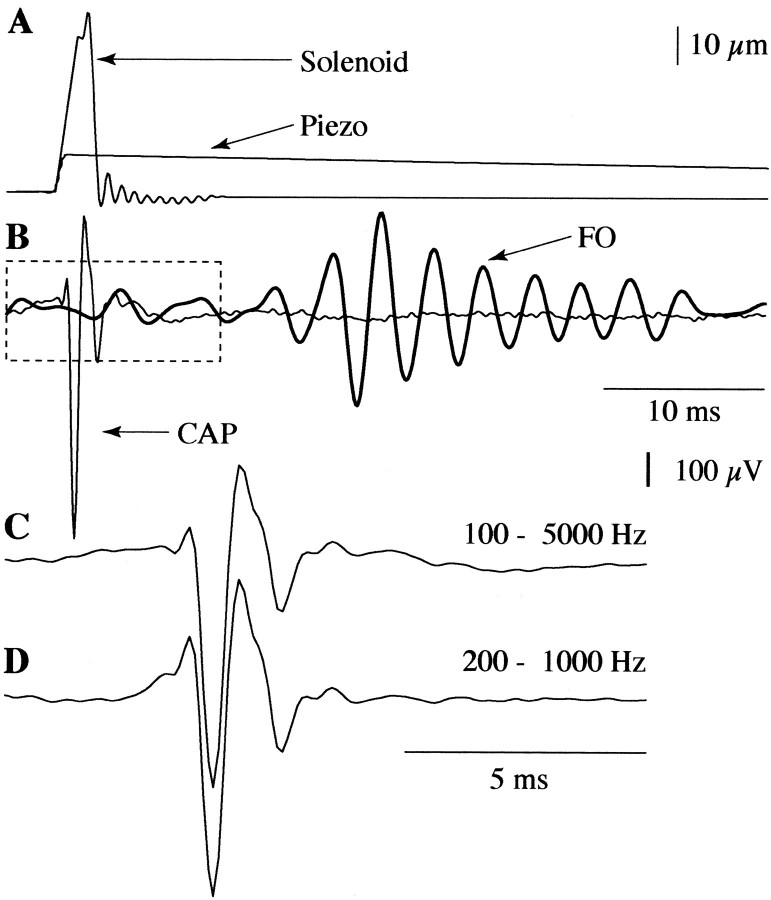
Stimulation. Separate groups of three vibrissas (see Fig.1A, vibrissa rows B–D) in the rostral (vibrissa column 4) and caudal (vibrissa column 1) regions of the left mystacial pad were clipped to a length of 2 cm, tied together, and displaced simultaneously in the ventrodorsal direction (∼10–300 μm) at a distance of 1 cm from their base. Groups of three vibrissas instead of single vibrissas were used to create a more widespread response and facilitate microelectrode targeting. However, it should be noted that this is not a requirement to evoke FOs, and that single vibrissa stimulation with displacements as small as 10 μm is equally effective (Jones and Barth, 1999). In several animals, vibrissa stimulation was delivered using a piezoelectric translator (Märzhäuser PM-10) with motor compensation disabled, which delivered a rapid displacement of the vibrissas in a dorsoventral direction (10 μm at 5 mm/sec) with negligible after-oscillations (Jones and Barth, 2002). In other animals, vibrissa stimulation was delivered with a laboratory-built solenoid and armature with greater displacement (∼200–300 μm) that was easier to position and produced similar results. Stimulator performance was verified using a laboratory-built calibration device consisting of an infrared emitter–detector photodiode pair arranged to convert movement of the actuator arm into changes in photocurrent displayed on an oscilloscope (see Fig. 2A). Additional recordings were also performed directly from the infraorbital nerve during vibrissa displacement to verify that only a single compound action potential was produced, with no repetitive discharges (see Fig. 2B–D). Separate stimulators were attached to the anterior and posterior vibrissa groups so that they could be displaced either simultaneously or asynchronously with delays ranging from 0.1 to 5.0 msec in increments of 0.1 msec.
Fig. 1.
Temporal properties of FOs and slow waves (SWs) evoked by transient displacement of three caudal vibrissas. A, The 25 major vibrissas on the contralateral mystacial pad are arranged in five rows (A–E on the dorsoventral axis) and five columns (1–4 are labeled on the caudorostral axis). A rostral and caudal group of three vibrissas (1B–D and 4B–D, respectively) were stimulated in this study. B, Surface potentials were recorded from an 8 × 8 electrode microarray (dots) with 500 μm spacing, covering a 3.5 × 3.5 mm area in a single placement. The array was positioned over the PMBSF in the right hemisphere. Three shaded columns reflect the principal barrels receiving direct thalamocortical input from the caudal group of vibrissas stimulated in this example. A template of the PMBSF was derived from previous studies and should be considered approximate. Consistent alignment of the array was achieved with evoked potentials from single vibrissa stimulation. C, A positive/negative (P1/N1) slow wave in the averaged response (n = 100) was evoked at shortest poststimulus latency over the principal barrels (dark solid trace) but was also recordable from more distant sites (dashed trace), with a progressive increase in latency. Superimposed on the P1 and N1 of the SW were high-frequency (∼400 Hz) ripples (marked with an asterisk). D, Digital bandpass filtering (200–1000 Hz) reveals that the ripples form an envelope of FOs lasting ∼13 msec. Similar to the SW, the peak amplitude of the FO envelope was shifted by several milliseconds at sites 2 mm from the principal barrels (dashed trace). However, in striking contrast to SWs, FOs remained tightly aligned in-phase in all places they were evident. E, Phase alignment of FOs (dashed lines) was evident even on trials where the envelope was prolonged and could be recorded several millimeters rostral to the principal barrels.
Fig. 2.
Temporal properties of the vibrissa stimulator and averaged (n = 100) response from the infraorbital nerve. A, Dorsoventral displacements of vibrissas were delivered using either a piezoelectric translator (Märzhäuser PM-10; Piezo) or a laboratory-built solenoid and armature (Solenoid). The temporal properties of this movement were verified using a calibration device consisting of an infrared emitter–detector photodiode pair arranged to convert movement of the actuator arm into changes in photocurrent. Neither stimulator produced after-oscillations at the frequency or latency of cortical FOs. B, An averaged compound action potential (CAP; light solid trace) recorded from the infraorbital nerve reflects the poststimulus timing of the evoked peripheral signal. The CAP preceded cortical FOs (dark trace; shown in this example for 10 μm vibrissal displacements with the piezoelectric translator) by ∼10 msec. C, A segment of the CAP highlighted with adashed box in B has been enlarged three times to permit closer examination of its temporal components. The CAP with no digital filtering (analog filtering during recording was 100–5000 Hz) was typically triphasic and lasted ∼4 msec.D, Passing the CAP through the same digital filter (200–1000 Hz) used for extracting FOs in the surface field potential added little additional distortion. The CAP was approximately twice the frequency of cortical FOs.
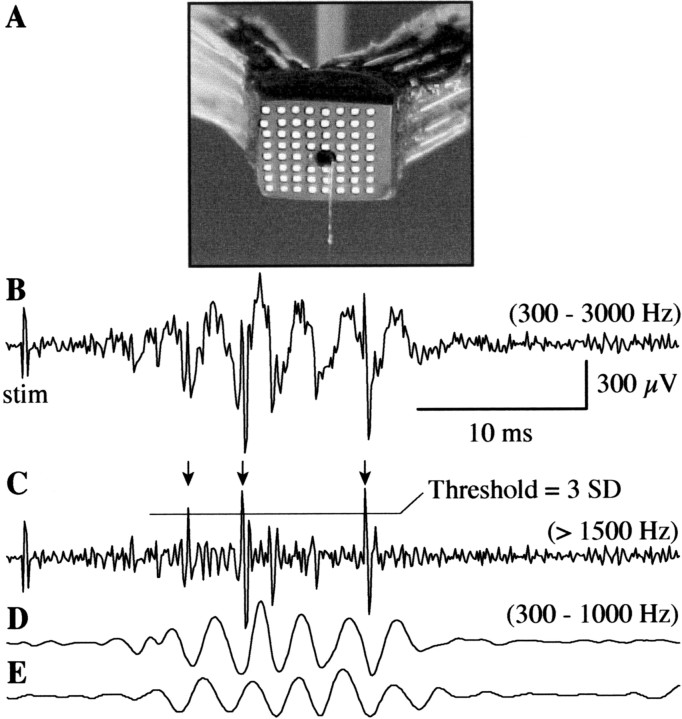
Surface and multiunit recording. Epipial maps of the vibrissa-evoked SEP complex were recorded using a flat multichannel electrode array consisting of 64 silver wires arranged in an 8 × 8 grid (tip diameter, 100 μm; interelectrode spacing, 500 μm) covering a 3.5 × 3.5 mm area of the cortical surface in a single placement (see Fig. 1B). A separate electrode array was used for simultaneous recording of epipial and depth extracellular unit potentials, providing a centralized access hole through which microelectrodes could penetrate the cortex while the surface array was in place (see Fig. 6A). Extracellular units were recorded with tungsten microelectrodes (WPI, Sarasota, FL) of ∼1 mÙ impedance measured at 1000 Hz. Given that microelectrodes were lowered through an access hole where the cortical surface could not be visualized, laminar recording depths could only be estimated approximately. Therefore, no attempt was made to segregate results on the basis of depth. Surface field potentials and depth unit potentials were referenced to a silver ball electrode secured over the contralateral frontal bone. Surface potentials were amplified (×1000), analog filtered (bandpass cutoff, −6 dB at 1–3000 Hz; roll-off, 5 dB/octave), and digitized at 10 kHz. Extracellular unit potentials were amplified (×1000), analog filtered (bandpass cutoff, −6 dB at 300–3000 Hz; roll-off, 5 dB/octave), and digitized in the same manner as surface potentials.
Fig. 6.
Method for recording and extracting multiunit responses from depth microelectrode recordings for comparison with simultaneously recorded surface field potentials. A, An 8 × 8 electrode surface array was designed with split leads and a central access hole through which microelectrodes were lowered into the cortex during surface field potential mapping. B, A single-trial microelectrode trace (analog bandpass filtered at 300–3000 Hz) shows a combination of high-frequency multiunit responses and slower oscillations in the FO frequency range. C, Multiunit responses were first separated from FOs by digital high-pass filtering (>1500 Hz). This high cutoff frequency was chosen to eliminate baseline shifts introduced by concurrent FOs. The SD of all filtered trials at a given recording location was then computed and used as threshold for identifying only the largest amplitude units for subsequent analysis. In this trial, three action potentials were identified (arrows), aligning approximately with the first, second, and fifth wave of the depth (D) and surface (E) FOs. A digital bandpass of 300–1000 Hz was used in D and E for this example only (as opposed to 200–1000 Hz used for all analyses of surface recorded FOs), because the low frequency cutoff of the microelectrode amplifier was 300 Hz.
Data collection and analysis. Two hundred millisecond samples of the whisker-evoked response were recorded, with data from individual trials stored digitally for subsequent analysis. Surface field potentials were averaged across trials and digitally filtered (first-order Butterworth) to separately examine wideband responses (1–3000 Hz) and fast oscillatory responses (200–1000 Hz). FO center frequency was defined as the largest spectral peak above 200 Hz appearing in a 512 point fast Fourier transform of the high-pass filtered data centered on the P1 peak. FO duration was defined as the total time during which the rectified and smoothed high-frequency signal exceeded two times the SD of the prestimulus baseline, and was averaged across all channels. Averaged surface responses were plotted on a template of the PMBSF in approximate register with the surface recording sites. The template was derived from previous histology and was used here for illustrative purposes only. Histological verification of precise electrode positions was not performed in the present study, because this was not required for interpretation of results.
Extracellular unit recordings were digitally high-pass filtered (1500 Hz) to separate unit action potential (AP) waveforms from fast oscillations (see Fig. 6B,C), which typically range from 300 to 500 Hz (Jones and Barth, 1999, 2002; Jones et al., 2000). APs exceeding 3 SDs, computed across all high-pass-filtered trials for a given recording location, were accepted for additional analysis (see Fig. 6C). Visual examination of responses exceeding this threshold (i.e., unit responses of an amplitude >3 SDs computed across all trials) suggested that they reflected activity of either single or small groups of units. No additional procedures for isolating single units were performed for three reasons: (1) amplitude discrimination could be confounded by slight cortical movement inherent in recordings performed through the surface array and large craniectomy, (2) the requirement for high-pass filtering to reliably separate AP waveforms from possible contamination by fast oscillations precluded discrimination methods based on waveform morphology, and (3) previous examination of intracellular responses in the PMBSF (Jones et al., 2000) indicated that vibrissa stimulation frequently evokes AP bursts in single cells that vary in morphology and amplitude within each burst, further confounding extracellular unit identification based on these parameters. Therefore, we conservatively considered all responses to be multiunit activity (MUA). MUA was computed by setting all signals below the 3 SD threshold to zero, digitally rectifying the remaining signal, averaging the rectified signal across trials at a given recording location, and digitally bandpass filtering (200–600 Hz) the resulting average.
Visual examination of single-trial MUA suggested a variable temporal pattern of unit discharge associated with simultaneously recorded surface FOs. Distinct temporal patterns were therefore additionally segregated using a K-means cluster algorithm (Hartigan and Wong, 1979). The grouping variable was the poststimulus latencies of unit responses for all trials at a given recording location. In this application, if all trials consisted of unit responses at the same poststimulus latencies, then a single cluster containing all trials would yield the minimum variance around the mean response latency. However, if unit response latencies differed systematically in subgroups of trials (i.e., occurring at the latencies of the first, second, and third FO waves in some trials, first and fourth FO waves on other trials, etc.), then trials clustered within each subgroup would yield a smaller within-group variance than if all trials were treated as a single group. The number of permitted clusters was adjusted so that no cluster contained fewer than three trials (see Fig. 8C). Surface FOs associated with the trials within each cluster were averaged separately to examine possible changes in the surface response associated with distinct unit response patterns (see Fig. 8B). Finally, the temporal pattern of unit responses in clusters identified for a single recording location were categorized according to their relationship to waves of the averaged surface FOs (i.e., unit responses during the first and second FO waves, first and third waves, etc.). This permitted the results to be summarized across all recording locations and animals independent of slight variations in FO burst latency and frequency (see Fig. 8D).
Fig. 8.
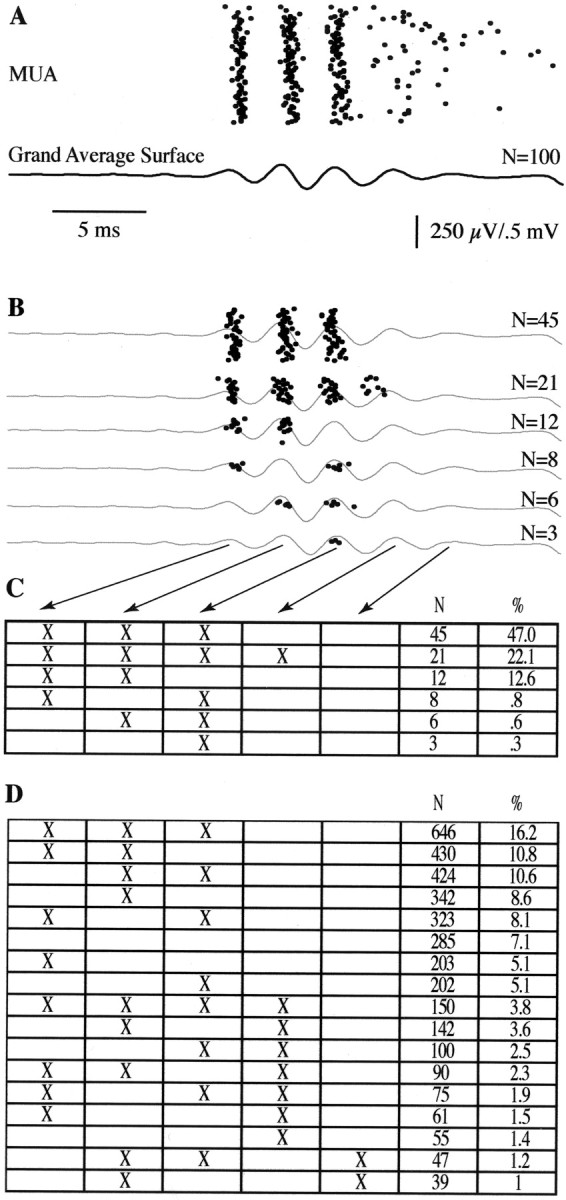
Cluster analysis of individual MUA responses.A, Same as Figure 7B. B, Clustering on the basis of the latency of multiunit discharges indicates that units rarely fire on all of the surface-recorded FO waves. However, the surface FO averaged within each cluster is similar, suggesting that variability in the MUA is local and not produced by changes in FO burst patterns. C, Clustered firing patterns of individual MUA trials depicted in B. MUA discharges aligned to each wave of surface FO are marked with anX. D, Same as C but showing the sorted MUA patterns across 3986 trials recorded from 41 sites.
Results
Transient displacement of either the rostral or caudal vibrissa group evoked a typical positive/negative slow wave response (Fig.1C, solid trace) of largest amplitude [peak-to-peak amplitude, 4.5 ± 0.68 (SD) mV;n = 11] and earliest poststimulus latency [first positive amplitude peak, 16.2 ± 2.2 (SD) msec; n= 11] in the cortical electrodes above the somatotopically related barrels (Fig. 1B, three darkened barrels reflecting the caudal vibrissa representation in this example). Amplitude peaks of the slow wave are labeled P1 and N1 to reflect their polarity and sequence of occurrence. Slow wave responses of lower amplitude and longer poststimulus latency (delayed by ∼2–4 msec) were also recordable at more distant locations (Fig. 1C, dashed trace). The average propagation rate of the slow wave, estimated from the latency of the earliest P1 to the longest latency P1 at 1 mm distance within the recording array was 310 ± 87 (SD) μm/msec (n = 14).
FOs were apparent as small amplitude [186 ± 57 (SD) μV;n = 11] ripples of ∼350 Hz [351 ± 23 (SD) Hz;n = 11] superimposed on the P1 and rising N1 of the slow wave response (Fig. 1C, peaks marked withasterisks). FOs formed an envelope (Fig.1D, solid trace) of several millisecond duration [12.8 ± 1.8 (SD) msec; n = 11]. Similar to previous studies (Jones and Barth, 1999), the FO envelope typically displayed poststimulus latency shifts of maximum amplitude at more distant electrode locations (Fig. 1D,dashed trace) with an estimated propagation velocity similar to that of the slow wave complex [290 ± 91 (SD) μm/msec;n = 14]. However, in marked contrast to the slow wave complex, the phase of FO remained closely aligned at all locations at which it could be recorded. This phase alignment was evident even on trials where the FO envelope was prolonged and could be recorded several millimeters rostral to the caudal barrel locus (Fig.1E). FOs did not appear to be influenced by temporal characteristics of stimulator or afferent discharge in the peripheral pathway. Measurements of vibrissa displacement produced by both the piezoelectric translator and solenoid revealed no notable after-oscillations at the latency or frequency of FOs (Fig.2A). In addition, simultaneous recording of compound action potentials in the infraorbital nerve occurred ∼10 msec before the FO envelope (Fig.2B) and displayed a triphasic waveform of approximately twice the frequency of FO (Fig. 2C), which was little changed when passed through the same digital filter (200–1000 Hz) used to isolate FOs in surface field potential recording (Fig.2D).
The spatial distribution of FOs evoked by displacing either the caudal (Fig. 3A, left plate) or rostral (Fig. 3B, left plate) vibrissa groups extended 1–2 mm within the PMBSF, with a region of spatially overlapping responses positioned between the principal vibrissa barrels and including the rostral barrels in this example (Fig. 3, circled trace). Superimposed and enlarged traces from each row of the electrode array (Fig.3A,B; right plates) indicated again a close phase alignment of FOs throughout the two-dimensional response complex when small subsets of vibrissae were stimulated. In this example, the FOs evoked by the caudal group alone (Fig. 3A, right plate) were delayed by ∼0.45 msec compared with that evoked by the rostral group alone (Fig.3B, right plate). When both groups were stimulated simultaneously, the resulting response covered the entire PMBSF (Fig. 3C, left plate). Because of poststimulus latency differences of the rostral and caudal responses, combined stimulation of groups produced a progressive phase shift notable in the superimposed traces from this condition, particularly in the row of electrodes covering the region of overlap between the individual group responses (Fig. 3C, right plate,circled traces).
Fig. 3.
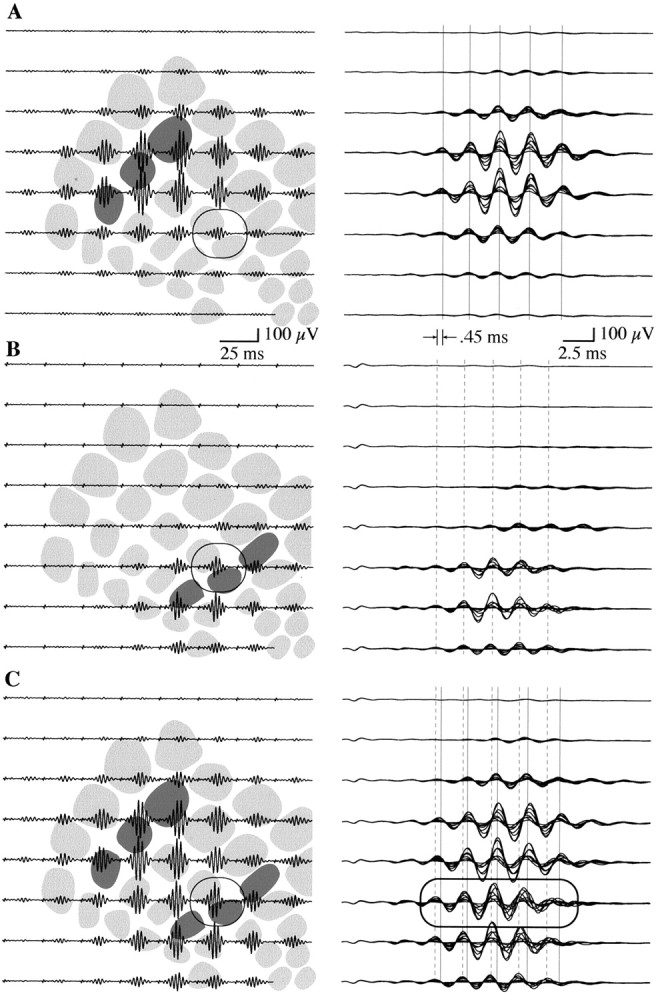
Two-dimensional mapping of averaged FOs (n = 100) evoked by separate and combined displacement of the rostral and caudal vibrissa groups.A, Displacement of the caudal group produced an FO envelope of largest amplitude at the respective principal barrels (left plate, shaded) but propagating 2–3 mm within the confines of the PMBSF. The circled tracerepresents an electrode site at which FOs for caudal and rostral stimulation spatially overlap. When enlarged traces were superimposed across electrodes within each row of the array (right plate), the close phase alignment at all recording sites was apparent (solid vertical lines). B, Same as A except for displacement of the rostral vibrissa group. Note again the phase alignment of FOs at all recording sites (right plate, dashed vertical lines). FOs during rostral group stimulation in this example were shifted by 0.45 msec poststimulation latency compared with those evoked by the caudal group. C, Simultaneous displacement of both the rostral and caudal vibrissas evoked FOs throughout much of the PMBSF. Because of the different latencies of the single group responses, FOs were phase-shifted at electrode sites positioned where the single group responses spatially overlapped (left and right plates, circled traces).
Although the response to simultaneous stimulation of both groups appeared as a simple sum of the responses to the separate groups, there was evidence for nonlinear interactions of the FO within the intervening region of the barrel field. An example of this interaction is highlighted in Figure 4 for the response from the electrode circled in Figure 3, where spatial overlap between the separate group responses was observed. At this site, the FOs evoked by stimulating both groups (Fig. 4C) appeared as the sum of responses to separate stimulation of the caudal (Fig.4A) or rostral (Fig. 4B) groups. However, a model waveform computed as the sum of the individual group responses (Fig. 4D, solid trace) was smaller than the actual combined group response, yielding a difference waveform (Fig. 4E) when the model was subtracted from the evoked waveform. Nonlinear interactions, reflected by difference waveforms, were of largest amplitude in the region of the PMBSF positioned between the principal barrels of the rostral and caudal vibrissa groups (Fig. 4F), indicating a locus of neuronal interaction where combined stimulation produced a unique and enhanced FO.
Fig. 4.
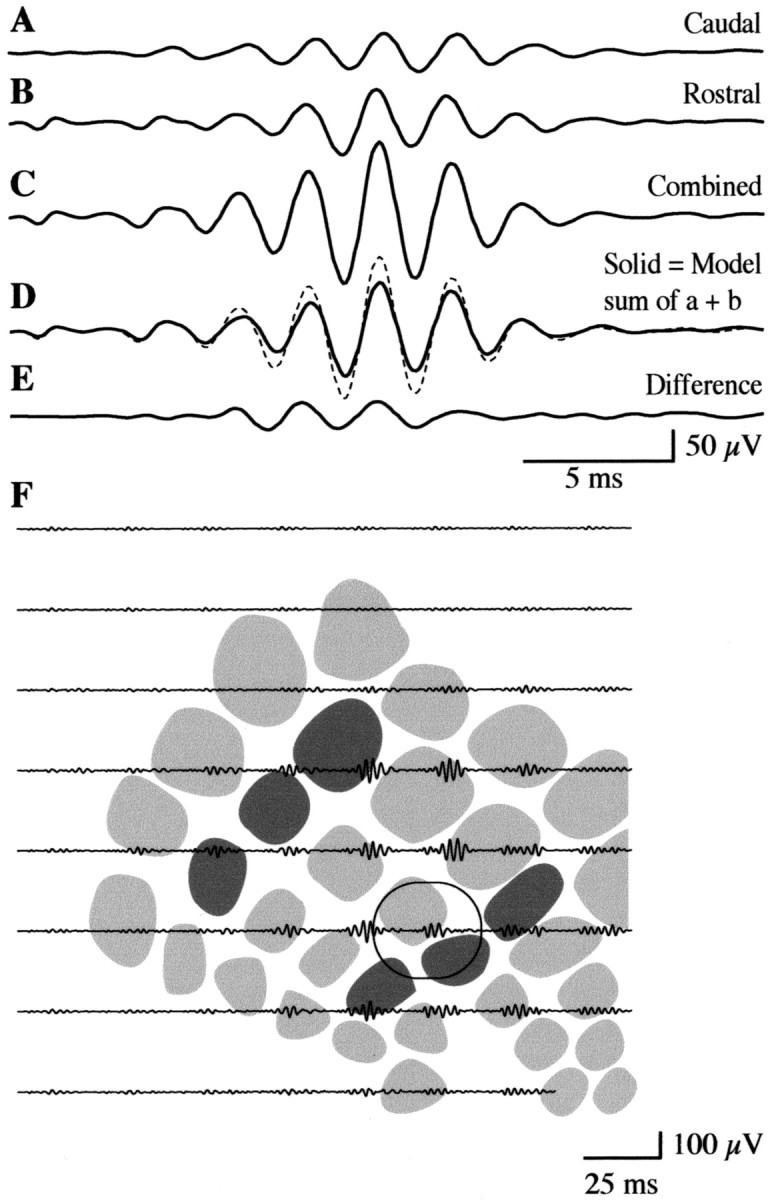
Nonlinear interactions of FOs during simultaneous displacement of the rostral and caudal vibrissa groups.A, FOs produced by displacement of the caudal group, recorded from the electrode circled in Figure 3. B, Same as A except for displacement of the rostral group.C, FOs at the same recording site during simultaneous displacement of both groups. D, A model computed as the sum of FOs produced by separate displacement of the rostral and caudal groups (solid trace) is of lower amplitude than the actual response evoked by combined displacement (dashed trace), indicating a nonlinear enhanced response.E, The nonlinear response is reflected in a difference waveform computed by subtracting the actual response to combined stimulation from the sum of the separate responses. F, Difference waveforms computed in this way were of largest amplitude in the region of PMBSF between and overlapping the rostral and caudal principal barrels. The circled trace represents the electrode enlarged in A–E.
The interactions between FOs evoked by combined rostral and caudal vibrissa stimulation were quite sensitive to the precise timing or delay between stimuli. As shown in Figure5, a 0.1 msec delay between stimulation of the rostral and caudal vibrissas produced the largest FO (Fig.5A) at the previously noted interaction locus. Increasing the delay by an additional 1.3 msec (Fig. 5B) resulted in almost complete attenuation of the FO response with no notable effect on the amplitude of the slow wave complex. Incremental 0.1 msec delays ranging from 0.0 to 5.0 msec revealed that phase-sensitive enhancement or attenuation of FOs was cyclical (Fig. 5C, bottom traces) with a half-period of 1.3 msec, similar to the 1.28 msec half-period of FOs recorded in this animal (390 Hz = 2.56 msec period = 1.28 msec half-period). The difference in stimulus delay required to produce maximum versus minimum FO responses across animals [1.40 ± 0.16 (SD) msec; n = 11] was consistently one-half the period of FO frequency [1.42 ± 0.10 (SD) msec; n = 11] and reflected the delay required to bring FOs of a given frequency 0 and 180° out of phase, respectively. Peak-to-peak amplitudes of the P1/N1 slow wave were insensitive to stimulus delays in this submillisecond range (Fig. 5C,top dashed traces). The cyclical interaction pattern of FOs was localized to an area of ∼1 mm2 of the PMBSF (Fig. 5D) corresponding to the region in which there was maximum spatial overlap between the rostral and caudal vibrissa responses.
Fig. 5.
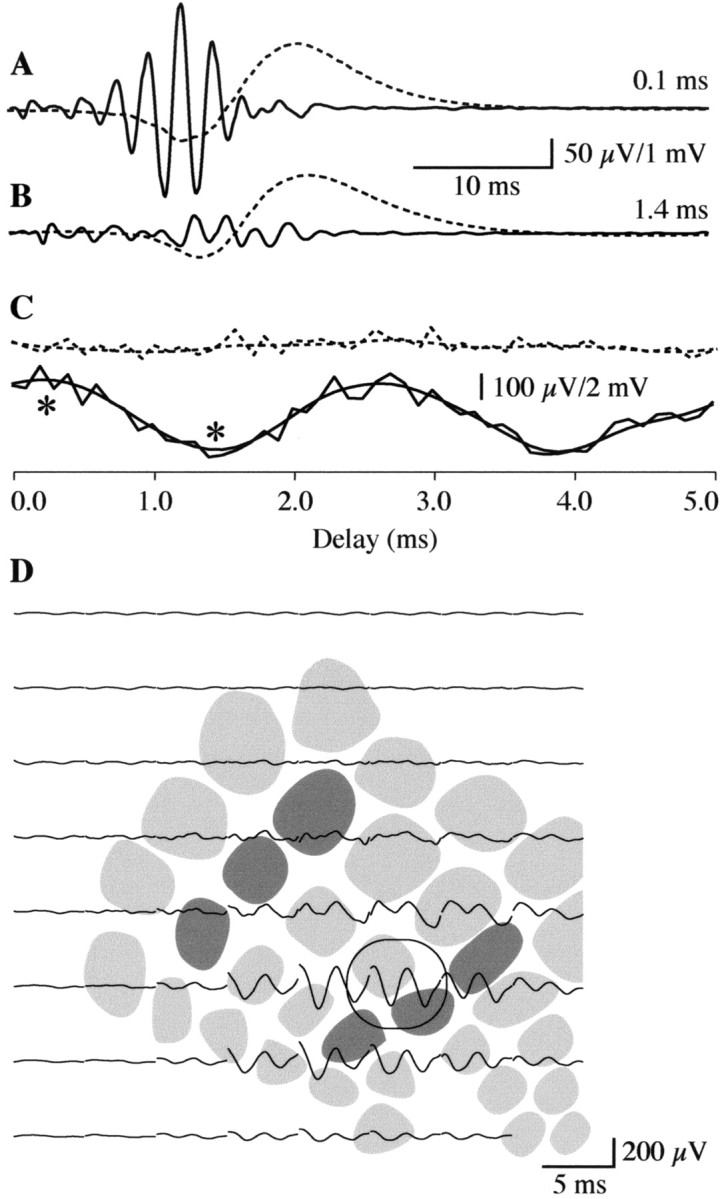
Phase-sensitive interactions of FOs produced by sequential displacement of the rostral and caudal vibrissa groups.A, At the recording site circled in D, a 0.1 msec delay between displacement of the rostral and caudal vibrissa resulted in maximum FOs (solid trace). The P1/N1 slow wave (dashed trace) was of normal amplitude.B, A 1.4 msec delay resulted in nearly complete attenuation of FOs at this location, but no notable change in slow wave amplitude. C, Interstimulus delays producing the maximum (0.1 msec) and minimum (1.4 msec) peak-to-peak amplitude FOs are marked with asterisks. When the delay was shifted in 0.1 msec increments from 0 to 5 msec, phase-sensitive interactions of FOs (bottom solid traces; smoothed and raw responses are superimposed) revealed a cyclical pattern, with a period matching that of the FO. Peak-to-peak amplitudes of the P1/N1 slow wave were insensitive to phase shifts in this submillisecond range (top dashed traces). D, Phase-sensitive interactions of FOs computed in this way were of largest amplitude in the region of PMBSF between and overlapping the rostral and caudal principal barrels. The circled trace represents the electrode enlarged inA–C.
Simultaneous surface field potential and depth multiunit recordings were performed with a modified surface array with a centralized access hole (Fig. 6A). All multiunit recording was from the interaction zone determined separately for each animal, using the modified surface array for microelectrode targeting. Figure 6B–E shows the method used to identify unit responses, described in detail in Materials and Methods. Figure 7A depicts an example of a single-trial and averaged MUA evoked with an interstimulus delay of 0.4 msec, chosen to bring FOs at adjacent surface recording sites into phase in this animal. On a majority of trials, MUA aligned to poststimulus latencies associated with the successive amplitude peaks of FOs averaged from an adjacent surface electrode. Temporally dispersed MUA was also evident, which was associated with the slow N1 wave of the surface SEP complex. In this example, and in 35 of 41 unit recordings performed, the maximum cross-correlation function computed between averaged MUA and FOs recorded at the adjacent surface electrode (Fig. 7B) was significant [Rxy = 0.51 ± 0.08 (SD);p < 0.01; n = 35]. Spectral analysis of the averaged unfiltered MUA was used to quantify the fraction of total MUA power associated with FO (300–500 Hz) as opposed to lower-frequency responses (1–200 Hz) across animals (Fig.7C). With in-phase stimulation, 22% [21.7 ± 12.7 (SD); n = 41] of MUA power was in the FO frequency range, as opposed to 58% [58.4 ± 15.7 (SD); n = 41] associated with lower frequencies (Fig. 7C, dark trace). Interstimulus intervals selected to bring the surface FO at the interaction zone out of phase (Fig. 7D) resulted in a 40% decrease in overall MUA power (t = 5.949;p < 0.0001; df = 40). More importantly, the decrease was dominated by FO frequencies, which declined by 72% (t = 5.458; p < 0.0001; df = 40) compared with a 20% decrease (t = 5.442;p < 0.0001; df = 40) in the lower-frequency band (Fig. 7C, light trace).
Fig. 7.
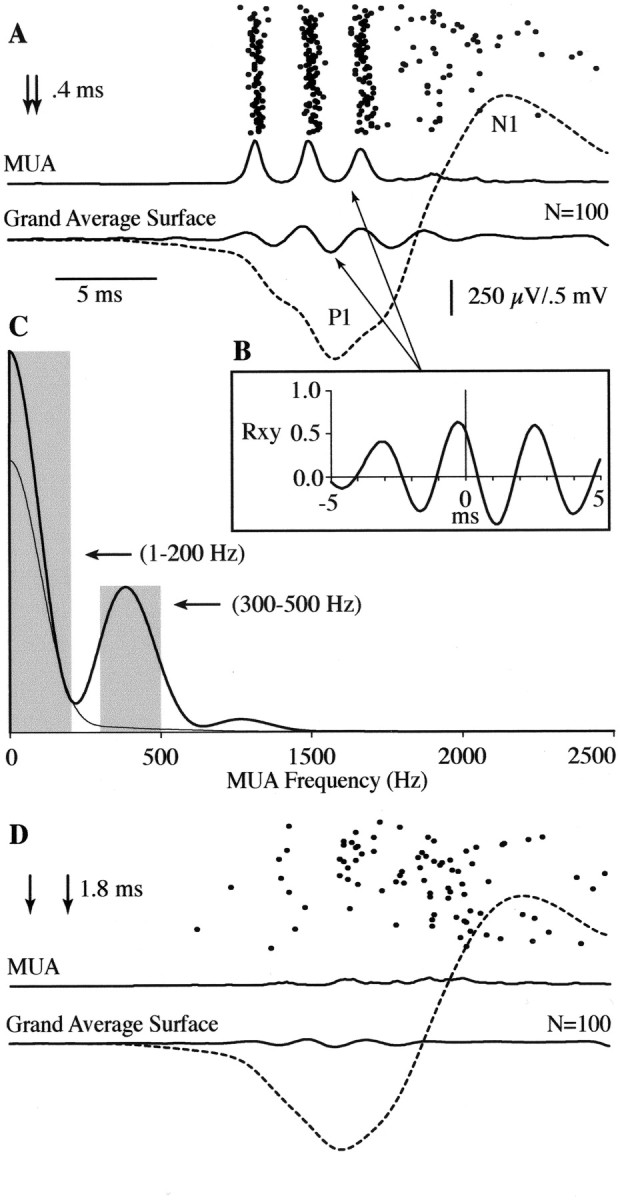
Simultaneous recording of surface field potential and MUA during maximally enhanced and attenuated FOs produced by sequential displacement of the rostral and caudal vibrissa groups.A, In this animal, a 0.4 msec delay (arrows) between rostral and caudal vibrissa displacement produced maximum FOs in the interaction zone. MUA (dots) for 100 single trials and the smoothed average (thick solid trace) appeared phase-locked to the average FO response recorded from an adjacent surface electrode (FO,solid trace; wideband response, dashed trace). B, Cross-correlation function between averaged MUA and surface FO. C, The power spectrum of averaged MUA when surface FOs are maximally in-phase (solid trace) and out of phase (light trace).Gray bars indicate power in the bandwidths of 1–200 Hz and 300–500 Hz, used to quantify changes in low- and high-frequency activity, respectively, during the in-phase and out of phase conditions. MUA in the 300–500 Hz band is almost completely abolished when surface FOs are out of phase. D, Same asA but showing responses when rostral and caudal vibrissa stimulation was separated by 1.8 msec (arrows), producing attenuated surface FOs.
Although averaged MUA displayed a close alignment with multiple peaks of the surface-recorded FOs in all animals, averaging across trials obscured a variability in firing pattern that was apparent on individual trials. Single-trial observation revealed that units only infrequently fired on every wave of a given FO burst, but instead tended to fire on subsets of FO waves that varied on a trial-to-trial basis. Figure 8Adepicts single-trial MUA and the averaged surface FO from the example of Figure 7. Sorting of the individual trials (Fig.8B,C) revealed that, although a majority of trials (47%) displayed a firing pattern aligned to the first three waves of the surface FO complex, other patterns were also apparent, with MUA aligned to all four (22%), the first two (13%), and occasionally the first and third or only the third wave. These variations in unit response were not reflected in the morphology of the surface FOs, which remained similar to the grand average even when subsets of trials belonging to sorted groups were averaged separately (Fig.8B, light traces). Thus, the variability of the MUA response was not patterned after variability in the surface-recorded FO complex. Similar results were obtained when sorting was performed across 3986 trials recorded from 41 sites (Fig.8D). Again, MUA firing patterns were most frequently aligned to the first three waves of FOs and subsets of these waves, with only 4% of trials displaying firing on all four waves, and none on all five.
Discussion
Neurogenesis and propagation of the P1/N1 slow wave and FO
Although the generation and propagation of the P1/N1 slow wave has been well established in rat somatosensory cortex (Simons, 1978; Di et al., 1990) and is mediated by chemical synaptic transmission, the generation and propagation of FOs are poorly understood. MUA is time-locked to FOs recorded at the cortical surface, yet rarely are unit discharges seen on every wave of the FO complex. FOs in sensory cortex therefore define preferred latencies for unit firing but may require rapid circuit interactions within closely coupled pyramidal cells for their generation. This conclusion is supported by recent combined intracellular and field potential recordings of FOs in the PMBSF (Jones et al., 2000) indicating that regular spiking cells, thought to represent pyramidal neurons in cortex (Connors and Gutnick, 1990), also tend to fire action potentials on only one or some cycles of a given oscillatory burst, suggesting that single cells do not serve as pacemakers for FOs. Although there is recent evidence that a special class of pyramidal fast rhythmic bursting cells may drive FOs in the cat (Grenier et al., 2001), this cell type has not yet been identified in the rat somatosensory cortex (Zhu and Connors, 1999; Jones et al., 2000).
The possibility that coupled populations of cortical pyramidal cells alone may be capable of producing FOs is supported by the observation that spontaneous FOs persist in the isolated cortical slab (Grenier et al., 2001), are abolished by kynuric acid (Ikeda et al., 2002), and may also be evoked in the PMBSF by direct electrical stimulation of the cortex (R. Staba and D. S. Barth, unpublished observations). It is unlikely that cortical inhibitory interneurons play a major role in FO generation, because application of the GABAA blocker BMI has no effect on the amplitude or frequency of FOs and only prolongs the oscillatory burst (Jones and Barth, 2002). Finally, the oscillatory mechanism for FO does not appear to require rhythmic driving from the thalamus, because FOs evoked by direct electrical stimulation of the PMBSF are unaltered by ablation of the thalamic ventrobasal complex (Staba and Barth, unpublished observations), nonrhythmic stimulation of thalamocortical fibers projecting to the PMBSF evokes cortical FO bursts (Kandel and Buzsaki, 1997), and blockade of synaptic transmission with cortical cooling (Staba and Barth, unpublished observations) or kynuric acid (Ikeda et al., 2002) indicate that monosynaptic responses to thalamic input precede and do not overlap cortical FOs.
If FOs reflect population responses of cortical pyramidal cells alone, the tight coupling required to produce such high-frequency activity is difficult to explain with chemical synaptic transmission. Perhaps cortical FOs in the somatosensory cortex are analogous to hippocampal ripple (200–400 Hz), which has been shown to reflect repetitive population spikes in a network of pyramidal cells, electrotonically coupled via axonal gap junctions (Traub et al., 1994; Draguhn et al., 1998; Schmitz et al., 2001). Computational studies of hippocampal ripples indicate that such high-frequency synchronization cannot be achieved via chemical synapses (Traub et al., 1999), a finding that might also apply to the neocortex. Although there is currently little evidence for gap junctions between cortical pyramidal cell, ripples (80–200 Hz) in the cat neocortex are eliminated by halothane, a gap junction blocker (Grenier et al., 2001). Similar effects have yet to be conclusively demonstrated in the PMBSF.
The present results indicate that the horizontal propagation of FOs appears in tandem with the slow wave complex. However, the cellular mechanism supporting their horizontal propagation may or may not be similar. It is possible that FOs could propagate through cortex by way of excitatory chemical synaptic pathways, similar to the P1/N1, with each juncture exciting local oscillatory circuits and giving the appearance of a propagating envelope. The variable delays associated with chemical synaptic transmission, combined with a substantial incidence of synaptic transmission failure (Miles and Wong, 1986), may challenge the ability of chemical synapses to establish tight phase-locking of the oscillatory response over appreciable cortical distances. However, similar phase-locking of 80–200 Hz oscillations with delays of <2 msec have been observed in the cat neocortex and attributed to excitatory chemical synaptic connections (Grenier et al., 2001). Furthermore, recent computational modeling studies (R. D. Traub, I. Pais, A. Bibbig, F. E. N. LeBeau, E. H. Buhl, S. G. Hormuzdi, H. Monyer, and M. A. Whittington, unpublished observations) suggest that although 200 Hz ripples in a network of hippocampal pyramidal cells cannot occur without pyramidal cell axonal gap junctions, phase-locking can occur on a 1–2 mm spatial scale, with or without chemical synapses.
We propose a simple model that may account for slow propagation of the FO envelope in tandem with the P1/N1 slow wave complex seen here. Assuming that short-latency FOs reflect repetitive local population spikes at the site of the principal barrels, these may produce fast repetitive subthreshold depolarizations at more distant sites. The fast subthreshold depolarizations would be expected to produce synchronized population spikes in distant populations only when the cells are brought close to threshold by slow depolarization accompanying the delayed P1/N1 slow wave complex. In this light, one role of the SEP slow wave may be to establish a momentary state of common excitability across regions of the PMBSF, assuring reliable and rapid communication within the barrel field necessary for making accurate comparisons of slight timing differences during multivibrissa displacement.
Submillisecond nonlinear interactions of FO
The present data suggest that FOs superimposed on the slow wave are best suited to such rapid temporal integration. When the delays between rostral and caudal vibrissa displacement are adjusted to yield maximum amplitude FOs in regions of interaction, the response is nonlinear, exceeding the summed response at the same location evoked by stimulation of each vibrissa group alone. The locally enhanced response might be expected if an in-phase combination of FOs brought additional cells in the interaction zone to threshold, adding to activity propagated from the principal barrel groups and increasing the amplitude of surface recorded FOs at this location. Our results are similar to unit recordings recently reported by Shimegi et al. (1999,2000) using paired stimulation of single principal and adjacent whiskers. Although submillisecond differences in interstimulus intervals were not tested in these studies, a strong nonlinear response facilitation was recorded only when two whiskers were stimulated within several milliseconds of each other.
Functional significance of FO in the PMBSF
Recent behavioral studies (Hutson and Masterson, 1986; Guic-Robels et al., 1992; Brecht et al., 1997) have suggested that the functional role of the PMBSF is in the integration of multivibrissa information required by tasks such as active touch, orienting to a stimulus, and object recognition. Because FOs may be evoked in both unanesthetized (Jones and Barth, 1999) and anesthetized animals (Jones and Barth, 1999, 2002; Jones et al., 2000), with physiologically realistic and nonvibratory single vibrissa displacements as small as 10 μm (Jones and Barth, 2002), they may play a role in multivibrissa integration during behavior. Integration occurring more than ∼15 msec after stimulus may be assumed to be mediated by inhibitory processes (Simons, 1995), well after excitatory FO bursts have diminished. We propose that FOs reflect repetitive population spikes at the principal vibrissas and possibly a combination of repetitive population spikes and subthreshold currents at more distant locations within the PMBSF, which maintain marked coupling over several millimeters of cortex and a temporal precision supporting integration of multivibrissa input with submillisecond accuracy during the earliest stages of the SEP complex.
Although the precise timing of action potentials is essential for coding the time-varying features of an ongoing stimulus, in the PMBSF, spike timing may also play a fundamental role in coding the spatial structure of environmental objects. Both neural network modeling and physiological analysis of population spike coding in somatosensory cortex suggest that precise spike timing (tested to at least 5 msec accuracy in these studies) conveys considerably more information about stimulus location than that available in spike count alone (Panzeri et al., 2001; Petersen et al., 2002). Similarly, recent studies of the temporal characteristics of integration evoked by closely timed multivibrissa stimulation demonstrate constructive and destructive interactions between cells located in neighboring barrel columns that are sensitive to interstimulus intervals as short as 1.3 msec (Shimegi et al., 1999, 2000).
One might question why FO bursts persist for more than several milliseconds. Although redundancy may apply here (Panzeri et al., 2001), the ∼13 msec duration of the FO envelope may serve a second purpose, to expand the time window within which precise comparisons of multivibrissa stimulation can be performed. FOs would be useful for the most temporally demanding of tasks, such as contact with a moving object or comparing timing differences as adjacent vibrissas within a given column contact a stationary object. Whisking velocities during exploratory behavior would be expected to produce delays between sequentially displaced vibrissas within a row on the order of 12–55 msec (Carvell and Simons, 1990), suggesting that the cortical response to these slower events is shaped primarily by inhibition (Simons, 1985). FOs may provide a mechanism for integration of far more rapid multivibrissa contact, accurately marking stimulus onset, preserving this information briefly until subsequent vibrissas have been displaced, and rapidly propagating this information within the PMBSF as a precisely phase-encoded excitatory signal (Jones and Barth, 1999) before the onset of inhibition. Phase-sensitive interactions of FOs demonstrated in this study with submillisecond accuracy during multivibrissa stimulation may, in the context of exploratory whisking, extract behaviorally relevant features of the object under exploration.
Footnotes
This research was supported by National Institute of Neurological Disorders and Stroke Grant 2 R01 NS36981. We thank Drs. Eva Fifkova and Richard Staba for their helpful comments on this manuscript.
Correspondence should be addressed to Dr. Daniel S. Barth, Department of Psychology, University of Colorado, Campus Box 345, Boulder, CO 80309-0345. E-mail: dbarth@psych.colorado.edu.
References
- 1.Brecht M, Preilowski B, Merzenich MM. Functional architecture of the mystacial vibrissae. Behav Brain Res. 1997;84:81–97. doi: 10.1016/s0166-4328(97)83328-1. [DOI] [PubMed] [Google Scholar]
- 2.Carvell GE, Simons DJ. Biometric analyses of vibrissal tactile discrimination in the rat. J Neurosci. 1990;10:2638–2648. doi: 10.1523/JNEUROSCI.10-08-02638.1990. [DOI] [PMC free article] [PubMed] [Google Scholar]
- 3.Connors BW, Gutnick MJ. Intrinsic firing patterns of diverse cortical neurons. Trends Neurosci. 1990;13:99–104. doi: 10.1016/0166-2236(90)90185-d. [DOI] [PubMed] [Google Scholar]
- 4.Curio G. Linking 600-Hz “spikelike” EEG/MEG wavelets (“s-bursts”) to cellular substrates. J Clin Neurophysiol. 2000;17:377–396. doi: 10.1097/00004691-200007000-00004. [DOI] [PubMed] [Google Scholar]
- 5.Curio G, Mackert B-M, Abraham-Fuchs K, Härer W. High-frequency activity (600 Hz) evoked in the human primary somatosensory cortex: a survey of electric and magnetic recordings. In: Pantev C, editor. Event-related brain dynamics. Plenum; New York: 1994a. pp. 205–218. [Google Scholar]
- 6.Curio G, Mackert B-M, Burghoff M, Koetitz R, Abraham-Fuchs K, Härer W. Localization of evoked neuromagnetic 600 Hz activity in the cerebral somatosensory system. Electroencephalogr Clin Neurophysiol. 1994b;91:483–487. doi: 10.1016/0013-4694(94)90169-4. [DOI] [PubMed] [Google Scholar]
- 7.Curio G, Mackert B-M, Burghoff M, Neumann J, Nolte G, Scherg M, Marx P. Somatotopic source arrangement of 600 Hz oscillatory magnetic fields at the human primary somatosensory hand cortex. Neurosci Lett. 1997;234:131–134. doi: 10.1016/s0304-3940(97)00690-3. [DOI] [PubMed] [Google Scholar]
- 8.Di S, Baumgartner C, Barth DS. Laminar analysis of extracellular field potentials in rat vibrissa/barrel cortex. J Neurophysiol. 1990;63:832–840. doi: 10.1152/jn.1990.63.4.832. [DOI] [PubMed] [Google Scholar]
- 9.Draguhn A, Traub RD, Schmitz D, Jefferys JGR. Electrical coupling underlies high-frequency oscillations in the hippocampus in vitro. Nature. 1998;394:189–192. doi: 10.1038/28184. [DOI] [PubMed] [Google Scholar]
- 10.Grenier F, Timofeev I, Steriade M. Focal synchronization of ripples (80–200 Hz) in neocortex and their neuronal correlates. J Neurophysiol. 2001;86:1884–1898. doi: 10.1152/jn.2001.86.4.1884. [DOI] [PubMed] [Google Scholar]
- 11.Guic-Robels E, Jenkins WM, Hermes B. Vibrissal roughness discrimination is barrel cortex-dependent. Behav Brain Res. 1992;48:145–152. doi: 10.1016/s0166-4328(05)80150-0. [DOI] [PubMed] [Google Scholar]
- 12.Hartigan JA, Wong MA. Algorithm AS 136: a K-means clustering algorithm. Appl Stat. 1979;28:100–108. [Google Scholar]
- 13.Hashimoto I, Mashiko T, Imada T. Somatic evoked high-frequency magnetic oscillations reflect activity of inhibitory interneurons in the human somatosensory cortex. Electroencephalogr Clin Neurophysiol. 1996;100:189–203. doi: 10.1016/0168-5597(95)00244-8. [DOI] [PubMed] [Google Scholar]
- 14.Hutson KA, Masterson RB. The sensory contribution of a single vibrissa's cortical barrel. J Neurophysiol. 1986;56:1196–1223. doi: 10.1152/jn.1986.56.4.1196. [DOI] [PubMed] [Google Scholar]
- 15.Ikeda H, Leyba L, Bartolo A, Wang Y, Okada YC. Synchronized spikes of thalamocortical axonal terminals and cortical neurons are detectable outside the pig brain with MEG. J Neurophysiol. 2002;87:626–630. doi: 10.1152/jn.00332.2001. [DOI] [PubMed] [Google Scholar]
- 16.Jones EG, Diamond IT, editors. The barrel cortex of rodents, Ed 1. Plenum; New York: 1995. [Google Scholar]
- 17.Jones MS, Barth DS. Spatiotemporal organization of fast (>200 Hz) electrical oscillations in rat vibrissa/barrel cortex. J Neurophysiol. 1999;82:1599–1609. doi: 10.1152/jn.1999.82.3.1599. [DOI] [PubMed] [Google Scholar]
- 18.Jones MS, Barth DS. Effects of bicuculline methiodide on fast (>200 Hz) electrical oscillations in rat somatosensory cortex. J Neurophysiol. 2002;88:1016–1025. doi: 10.1152/jn.2002.88.2.1016. [DOI] [PubMed] [Google Scholar]
- 19.Jones MS, MacDonald KD, Choi BJ, Dudek FE, Barth DS. Intracellular correlates of fast (>200 Hz) electrical oscillations in rat somatosensory cortex. J Neurophysiol. 2000;84:1505–1518. doi: 10.1152/jn.2000.84.3.1505. [DOI] [PubMed] [Google Scholar]
- 20.Kandel A, Buzsaki G. Cellular-synaptic generation of sleep spindles, spike-and-wave discharges, and evoked thalamocortical responses in the neocortex of the rat. J Neurosci. 1997;17:6783–6797. doi: 10.1523/JNEUROSCI.17-17-06783.1997. [DOI] [PMC free article] [PubMed] [Google Scholar]
- 21.Klostermann F, Nolte G, Curio G. Multiple generators of 600 Hz wavelets in human SEP unmasked by varying stimulus rates. NeuroReport. 1999;10:1625–1629. doi: 10.1097/00001756-199906030-00001. [DOI] [PubMed] [Google Scholar]
- 22.Miles R, Wong RKS. Excitatory synaptic interactions between CA3 neurones in the guinea-pig hippocampus. J Physiol (Lond) 1986;373:397–418. doi: 10.1113/jphysiol.1986.sp016055. [DOI] [PMC free article] [PubMed] [Google Scholar]
- 23.Panzeri S, Petersen RS, Schultz SR, Lebedev M, Diamond ME. The role of spike timing in the coding of stimulus location in rat somatosensory cortex. Neuron. 2001;29:769–777. doi: 10.1016/s0896-6273(01)00251-3. [DOI] [PubMed] [Google Scholar]
- 24.Petersen RS, Panzeri S, Diamond ME. Population coding in somatosensory cortex. Curr Opin Neurobiol. 2002;12:441–447. doi: 10.1016/s0959-4388(02)00338-0. [DOI] [PubMed] [Google Scholar]
- 25.Schmitz D, Schuchmann S, Fisahn A, Draguhn A, Buhl EH, Petrasch-Parwez RE, Dermietzel R, Heinemann U, Traub RD. Axo-axonal coupling: a new mechanism for ultrafast neuronal communication. Neuron. 2001;31:831–840. doi: 10.1016/s0896-6273(01)00410-x. [DOI] [PubMed] [Google Scholar]
- 26.Shimazu H, Kaji R, Tsujimoto T, Kohara N, Ikeda A, Kimura J, Shibasaki H. High-frequency SEP components generated in the somatosensory cortex of the monkey. NeuroReport. 2000;11:2821–2826. doi: 10.1097/00001756-200008210-00042. [DOI] [PubMed] [Google Scholar]
- 27.Shimegi S, Ichikawa T, Akasaki T, Sato H. Temporal characteristics of response integration evoked by multiple whisker stimulations in the barrel cortex of rats. J Neurosci. 1999;19:10164–10175. doi: 10.1523/JNEUROSCI.19-22-10164.1999. [DOI] [PMC free article] [PubMed] [Google Scholar]
- 28.Shimegi S, Akasaki T, Ichikawa T, Sato H. Physiological and anatomical organization of multiwhisker response interactions in the barrel cortex of rats. J Neurosci. 2000;20:6241–6248. doi: 10.1523/JNEUROSCI.20-16-06241.2000. [DOI] [PMC free article] [PubMed] [Google Scholar]
- 29.Simons DJ. Response properties of vibrissa units in the rat SI somatosensory neocortex. J Neurophysiol. 1978;41:798–820. doi: 10.1152/jn.1978.41.3.798. [DOI] [PubMed] [Google Scholar]
- 30.Simons DJ. Temporal and spatial integration in the rat SI vibrissa cortex. J Neurophysiol. 1985;54:615–635. doi: 10.1152/jn.1985.54.3.615. [DOI] [PubMed] [Google Scholar]
- 31.Simons DJ. Neuronal integration in the somatosensory whisker/barrel cortex. [In: Cerebral cortex, Vol II, The barrel cortex of rodents, Chapter 6] (Jones EG, Diamond IT, eds) pp 263–332. Plenum; New York: 1995. [Google Scholar]
- 32.Simons DJ, Woolsey TA. Functional organization in mouse barrel cortex. Brain Res. 1979;165:327–332. doi: 10.1016/0006-8993(79)90564-x. [DOI] [PubMed] [Google Scholar]
- 33.Simons DJ, Carvell GE, Land PW. The vibrissa/barrel cortex as a model of sensory information processing. In: Lund JS, editor. Sensory processing in the mammalian brain: neural substrates and experimental strategies. Oxford UP; New York: 1989. pp. 67–83. [Google Scholar]
- 34.Traub RD, Jefferys JGR, Miles R, Whittington MA, Tóth K. A branching dendritic model of a rodent CA3 pyramidal neurone. J Physiol (Lond) 1994;481:79–95. doi: 10.1113/jphysiol.1994.sp020420. [DOI] [PMC free article] [PubMed] [Google Scholar]
- 35.Traub RD, Schmitz D, Jefferys JGR, Draguhn A. High-frequency population oscillations are predicted to occur in hippocampal pyramidal neuronal networks interconnected by axoaxonal gap junctions. Neuroscience. 1999;92:407–426. doi: 10.1016/s0306-4522(98)00755-6. [DOI] [PubMed] [Google Scholar]
- 36.Woolsey TA, Van der Loos H. The structural organization of layer IV in the somatosensory region (SI) of mouse cerebral cortex. Brain Res. 1970;17:205–242. doi: 10.1016/0006-8993(70)90079-x. [DOI] [PubMed] [Google Scholar]
- 37.Zhu JJ, Connors BW. Intrinsic firing patterns and whisker-evoked synaptic responses of neurons in the rat barrel cortex. J Neurophysiol. 1999;81:1171–1183. doi: 10.1152/jn.1999.81.3.1171. [DOI] [PubMed] [Google Scholar]


