

Abstract
The theory of “parallel pathways” predicts that, except for a sign reversal, ON and OFF ganglion cells are driven by a similar presynaptic circuit. To test this hypothesis, we measured synaptic inputs to ON and OFF cells as reflected in the subthreshold membrane potential. We made intracellular recordings from brisk-transient (Y) cells in the in vitro guinea pig retina and show that ON and OFF cells in fact express significant asymmetries in their synaptic inputs. An ON cell receives relatively linear input that modulates a single excitatory conductance; whereas an OFF cell receives rectified input that modulates both inhibitory and excitatory conductances. The ON pathway, blocked by l-AP-4, tonically inhibits an OFF cell at mean luminance and phasically inhibits an OFF cell during a light increment. Our results suggest that basal glutamate release is high at ON but not OFF bipolar terminals, and inhibition between pathways is unidirectional: ON → OFF. These circuit asymmetries explain asymmetric contrast sensitivity observed in spiking behavior.
Keywords: white noise, linear–nonlinear model, receptive field center, APB, photopic vision, α cell
Introduction
ON and OFF ganglion cells form parallel pathways whose signals are relayed through the lateral geniculate nucleus (LGN) of the thalamus and ultimately converge onto the same cortical cell (Schiller, 1992). The balance between ON and OFF cells can be disturbed by injecting l-AP-4 into the eye to hyperpolarize ON bipolar cells and therefore to block the output of ON ganglion cells (Shiells et al., 1981; Slaughter and Miller, 1981;Schiller, 1982). ON pathway blockade alters the receptive field properties of cortical cells and reduces psychophysical sensitivity to contrast, especially for a stimulus brighter than the background (Schiller, 1982; Sherk and Horton, 1984; Schiller et al., 1986; Dolan and Schiller, 1994). Thus, the receptive field of a cortical cell and visual behavior depend on cooperation between ON and OFF pathways.
A common assumption is that ON and OFF pathways are opposite in sign but otherwise equal in kinetics and sensitivity, i.e., truly “parallel.” Consistent with the “parallel pathways” notion, ON and OFF cells of a given type (e.g., brisk-transient) show similar kinetics in their impulse response function (Devries and Baylor, 1997;Benardete and Kaplan, 1999; Keat et al., 2001; Chichilnisky and Kalmar, 2002). However, ON and OFF cells differ in other properties. For example, under cone-driven conditions, an ON cell fires spontaneously at a higher rate than an OFF cell (Cleland et al., 1973; Kaplan et al., 1987; Troy and Robson, 1992; Passaglia et al., 2001; Chichilnisky and Kalmar, 2002) (but see Troy and Lee, 1994). Furthermore, in primate (magnocellular pathway), an ON cell responds to both an increment and decrement of low contrast (relative to mean luminance); whereas an OFF cell responds only to a decrement of relatively high contrast (Chichilnisky and Kalmar, 2002). This asymmetry in contrast sensitivity suggests that, at low contrast, a cortical cell would be driven almost exclusively by the ON pathway.
Our goal was to discover the cellular mechanisms that cause the asymmetry in ON and OFF cell contrast sensitivity. We measured synaptic inputs to ganglion cells as reflected in the subthreshold membrane potential; these voltage measurements are influenced by intrinsic properties, but we expect little or no difference between ON and OFF cell intrinsic properties (O'Brien et al., 2002). We recorded intracellularly from ON and OFF brisk-transient ganglion cells in the guinea pig retina in vitro. We stimulated with white noise and brief contrast flashes. Guinea pig cells displayed the same ON–OFF asymmetry found in primate (Chichilnisky and Kalmar, 2002); an OFF cell alone showed strongly rectified spike output at low contrast. We proceeded to determine how this output rectification related to rectification in the membrane potential, as well as possibly distinct mechanisms for inhibition. In experiments usingl-AP-4, we reveal a circuit that underlies the control of OFF cell spike output. This circuit involves “cross talk” from the ON pathway in the form of both tonic and phasic inhibition. This cross talk was not reciprocated by the OFF pathway.
Materials and Methods
Intracellular recording. From a guinea pig anesthetized with ketamine (100 mg/kg), xylazine (20 mg/kg), and pentobarbital (150 mg/kg), both eyes were removed, after which the animal was killed by anesthetic overdose (in accordance with University of Pennsylvania and National Institutes of Health guidelines). The whole retina, including the pigment epithelium, choroid, and sclera, was mounted flat in a chamber on a microscope stage. Retina was superfused (∼4 ml/min) with oxygenated (95% O and 5% CO2) Ames medium (Sigma, St. Louis, MO) at 32–36°C. A glass electrode (tip resistance, 80–200 MΩ), filled with 1% pyranine (Molecular Probes, Eugene, OR) in 2 m potassium acetate, was used to penetrate the largest somas (diameter, 20–25 μm) in the visual streak, 2.6 ± 0.9 mm (mean ± SD) from the optic disk.l-2-Amino-4-phosphonobutyric acid (l-AP-4) and lidocaine N-ethyl bromide (QX-314) were purchased from Research Biochemicals (Natick, MA).
Membrane potential was amplified, continuously sampled at 5 kHz, and stored on computer as previously described (Demb et al., 1999,2001a,b). We wrote programs in Matlab (The Mathworks, Natick, MA) to analyze responses separately in the spike rate and subthreshold membrane potential. Spikes were detected off-line (Demb et al., 1999). Membrane potential was analyzed after removing spikes computationally: we performed a linear interpolation of the membrane potential between 1 msec before and 1–4 msec after each spike (Fig.1A). To remove high-frequency noise, membrane responses were low-pass-filtered by convolving with a Gaussian (SD, 3 msec or 53 Hz). The resting potential was determined by averaging the potential before and after a stimulus. For the responses to 17 and 100 msec pulses, responses were averaged over 5–60 repeats. Average spike responses (poststimulus time histogram) were binned at the frame rate (16.7 msec). The receptive field of each cell showed a “center–surround” organization (i.e., opposite sign responses to a spot; diameter, 500 μm; and annulus; inner and outer diameters, 740 and 2000 μm) and a frequency-doubled spiking response to a contrast-reversing grating (spatial frequency, 4.3 cycles/mm).
Fig. 1.

White noise stimulation and analysis.A, A spot covering the receptive field center of a cell modulated with intensities drawn from a Gaussian distribution (white noise; 16.7 msec frame). The top trace shows 300 msec of baseline response followed by 1 sec of white noise response. Thebottom trace shows the 1 sec white noise response after removing spikes and filtering (see Materials and Methods).B, An L–NL model was used to analyze the response to white noise. Stimulus is convolved with a L filter to generate an L model of the response. The L model is passed through a static nonlinearity to generate an L–NL model of the response. The L filter reflects the temporal sensitivity of a cell; the NL function reflects the contrast sensitivity of a cell (see Results). Analysis was performed separately for subthreshold voltages (membrane) and spike rate (spikes). For comparison with the L–NL model, membrane and spike traces are average responses to 20 repeats (averaged to reduce noise; 700 msec shown of a 5 sec stimulus presentation). Filter units are in millivolt contrast per second (membrane filter) or spike rate contrast per second (spike filter). sp, Spikes.
Visual stimulus. The stimulus was displayed on a miniature monochrome computer monitor (Lucivid MR1-103;Microbrightfield, Colchester, VT) projected through the top port of the microscope through a 2.5× objective and focused on the photoreceptors (mean luminance, ∼105isomerizations/cone/sec; resolution, 852 × 480 pixels; 60Hz vertical refresh). The relationship between gun voltage and monitor intensity was linearized in software with a look-up table. Light and dark flashes were defined by Weber contrast: (Iflash −Imean)/Imean, where Iflash is the flash intensity, and Imean is the luminance of the gray screen between flashes, set at the middle of the intensity range (i.e., contrast range, −1.0–1.0). Periodic stimuli were defined by percent Michelson contrast: 100 × (Imax–Imin)/(Imax+ Imin), whereImax andImin are the peak and trough intensities (range, 0–100%). Stimuli were programmed in Matlab using extensions provided by the high-level Psychophysics Toolbox (Brainard, 1997) and the low-level Video Toolbox (Pelli, 1997).
White noise stimulus and analysis. To characterize the temporal response of a cell and to measure contrast sensitivity, we used a 2 min white noise modulation of a 500-μm-diameter spot centered over the cell body (Fig. 1) (Marmarelis and Marmarelis, 1978;Sakai and Naka, 1987). On each frame, the spot intensity was drawn from a Gaussian distribution (mean, 0; range, –1.0 to +1.0). Stimulus contrast is defined by the Gaussian SD; here, we used a near-maximal contrast of SD = 0.30 (range, ±3.3 SDs). In a representative sample of cells (n = 9), there was an ∼20% drop in spike rate across the first 20 sec (<20% of stimulus duration); this was more similar to the effect observed in primate than salamander (Smirnakis et al., 1997; Brown and Masland, 2001; Chander and Chichilnisky, 2001; Kim and Rieke, 2001). We compared the analysis of the full 2 min to the last 90 sec; we did not find a significant effect of removing the first 30 sec, so we analyzed the full 2 min.
We analyzed the response using a linear–nonlinear (L–NL) model described in detail previously (Fig. 1) (Victor, 1987; Chander and Chichilnisky, 2001; Chichilnisky, 2001; Kim and Rieke, 2001; Rieke, 2001; Baccus and Meister, 2002; Demb, 2002). All equations were identical to those used in previous studies (Chander and Chichilnisky, 2001; Chichilnisky, 2001; Kim and Rieke, 2001). The L filter was calculated by cross-correlating the stimulus and response and was synced to the onset of the frame (rather than the offset of the frame, 16.7 msec later). For both spike and voltage responses, convolving the L filter with the stimulus generates an L model of the response. We generated an NL “input–output” function by plotting the L model (the input) versus the measured response (the output) at each point in time. We fit a smooth curve through the binned points (bin, 1.5 sec). For the spike NL function, we fit with a Gaussian cumulative distribution function (CDF), which provides a reasonable description (Chander and Chichilnisky, 2001; Chichilnisky, 2001; Chichilnisky and Kalmar, 2002). For the membrane NL function, we fit with two CDFs, one for responses to negative contrast and one for responses to positive contrast; this was necessary for fitting the NL function of an OFF cell.
In several cells, we formally tested the predictive value of the model (n = 4 ON and 6 OFF cells). We first constructed an L–NL model for the cell, based on the response to a 2 min stimulus, and then used the model to predict the response to a 5 sec stimulus (repeated 20 times). For comparison with future studies, we offer two benchmarks of how well the model performs. One benchmark is the correlation between the average response to the 5 sec trial (averaged to reduce noise) and the predicted 5 sec response from the model; this represents the amount of variance explained by the model. For spikes,r2 = 0.67 ± 0.04 (mean ± SEM; best case,r2 = 0.79); for membrane potential, r2 = 0.88 ± 0.02 (best case, r2 = 0.95). A second benchmark is the predictability of a single trial response based on the maximum likelihood estimate (i.e., the average of the other 19 trials or “repeat prediction”) versus the model prediction (Chichilnisky, 2001). For spikes, repeat prediction root mean squared (RMS) error was 0.31 ± 0.02 spikes per bin; model prediction RMS error was 0.38 ± 0.03 spikes per bin. For membrane potential, repeat prediction RMS error was 1.05 ± 0.11 mV; model prediction RMS error was 1.44 ± 0.11 mV.
We assumed that the L filter primarily reflects the response in presynaptic neurons and should therefore not be affected by polarizing the ganglion cell with current (Rieke, 2001). In cases in which we polarized the cell, we normalized the L filter measured under current injection so that the peak amplitude matched the L filter in the control condition. The L filter under control and current injection conditions virtually superimposed; then, the NL function was scaled accordingly (along the x-axis) to keep the model output constant (Chander and Chichilnisky, 2001; Kim and Rieke, 2001).
Current injection. In some experiments, steady current was injected through the pipette to determine whether responses were driven primarily by EPSPs (i.e., responses would decrease with depolarizing current and vice versa) or IPSPs (i.e., responses would increase with depolarizing current and vice versa). In most of these experiments, QX-314 (50 mm) was added to the pipette solution to block action potentials that would obscure the membrane response (Connors and Prince, 1982). The bridge on the amplifier was balanced before penetrating a cell. In addition, voltage responses were corrected for any unbalanced increase in electrode resistance after penetration by subtracting an I–V curve obtained immediately after the electrode was withdrawn from the cell (Ashmore and Copenhagen, 1983).
While injecting current, we measured the membrane potential and a light response (deviation from baseline). We fit a line (linear regression) through the membrane potential versus response plot and estimated the reversal potential as the x-intercept (see below). Using sharp electrodes, one polarizes the soma and central dendrites to a greater extent than the peripheral dendrites. Thus, to interpret the measured reversal potentials, several points are worth considering. First, synaptic inputs to a ganglion cell lie on the dendrites, not the soma, and the distribution of dendritic membrane is “dome-like” with most membrane concentrated near the soma (Kier et al., 1995); thus, most synapses lie on dendrites under the best control. Second, excitatory and inhibitory inputs are both distributed uniformly along the dendrites (Freed and Sterling, 1988; Kolb and Nelson, 1993;Weber and Stanford, 1994; Kier et al., 1995); thus, estimates for reversal potentials of excitatory and inhibitory conductances are similarly affected by electrotonic distance from the soma. In general, the actual reversal potential in the dendrite should lie between the reversal potential measured in the soma and the resting potential (Vrest) of the cell. Our main conclusions, represented in the model (see Discussion), are unaffected by this type of error in the reversal potential estimates.
Results
Basic properties of ON and OFF cells
From the visual streak, we recorded from 17 ON and 30 OFF brisk-transient (Y) cells. All showed the signature properties: a center–surround receptive field and a frequency-doubled spiking response to a contrast-reversing grating (see Materials and Methods;Enroth-Cugell and Robson, 1966; Hochstein and Shapley, 1976; Demb et al., 2001a; Levitt et al., 2001). In recordings with standard K+-acetate electrodes, the resting potential (Vrest) of an ON cell was –58.9 ± 1.8 mV (mean ± SEM; n = 13); whereas the Vrest of an OFF cell was –62.3 ± 1.5 mV (n = 19; p > 0.10). The maintained firing rate of an ON cell was 18.4 ± 3.8 Hz; whereas the rate of an OFF cell was significantly lower, 6.6 ± 1.3 Hz (p < 0.01).
White noise stimulation and analysis quantifies the temporal and contrast sensitivity of a cell
We presented a spot modulated with intensities drawn from a Gaussian distribution (white noise; see Materials and Methods). In response, the membrane potential of a cell fluctuated about Vrest with ∼50–100 msec depolarizations and single spikes or bursts of spikes riding on the depolarizations (Fig.1A). We analyzed the response, separately for membrane potential and spikes, using a model that includes two stages: an L filter followed by a static (or instantaneous) NL (L–NL model; see Materials and Methods; Victor, 1987; Chichilnisky, 2001; Kim and Rieke, 2001). The L filter emphasizes certain temporal frequencies in the stimulus; thus it provides a measure of temporal sensitivity. The NL function shows the gain (slope) at each contrast; thus it provides a measure of contrast sensitivity. The L–NL model provides a close approximation to the measured response and could account for ∼88% of the variance in the membrane and ∼67% of the variance in the spikes (see Materials and Methods).
Under our conditions (photopic mean luminance and high contrast), the average ON and OFF L filters were opposite in sign but otherwise nearly equal (Fig. 2A,B), as shown previously (Devries and Baylor, 1997; Benardete and Kaplan, 1999). Variability across cells in peak timing was comparable with that found in primate parasol cells (spike L filter peak time, SD = 8 msec for ON and 5 msec for OFF; cf. Chichilnisky and Kalmar, 2002, their Fig. 9).
Fig. 2.

Relative to an ON cell, an OFF cell receives more rectified synaptic input and transmits more rectified spike output.A, Membrane L filter and NL function for representative cells and the populations. The NL function of the ON cell reaches positive and negative amplitudes of similar extents, whereas that of the OFF cell reaches a maximum negative amplitude that is only half the maximum positive amplitude (i.e., rectification). For the L filter, response amplitude is normalized to the peak of the primary lobe (+1 for ON and –1 for OFF). For the NL input–output function, input is normalized from –1 to + 1; output is normalized so that the predicted response at 0 contrast is 0, and the maximum depolarization is 1. For single-cell NL functions, circles represent binned data points; the solid line represents a fit (see Materials and Methods). The shaded area around the average NL function represents ±SEM. An ON cell was slightly but significantly more biphasic (amplitude of peak to undershoot) than an OFF cell for both spike and membrane responses (p<0.05). B, Same format as in A for spikes. At low contrast (i.e., small values of input), an ON cell is nearly linear, whereas an OFF cell is strongly rectified. For both an ON and OFF cell, the spike L filter was more biphasic than the membrane L filter (p <0.01), consistent with high-pass filtering (Lankheet et al., 1989; Demb et al., 2001b).C, Population NL input–output functions plotted with raw response amplitudes (output). For both membrane and spikes, an OFF cell expresses a wider response range than an ON cell (p < 0.01). D, For both membrane and spikes, the NL index was significantly higher for OFF cells (p < 0.001). The scatter plot illustrates a significant correlation between the membrane and spike NL indices (p < 0.01). NL index of0 indicates a linear response.
Relative to an ON cell, an OFF cell receives more rectified synaptic input and transmits more rectified spike output
For both spikes and membrane potential, ON and OFF cells express distinct contrast sensitivities, as measured in the NL function. Key differences are observed at low contrast, reflected by moderate input levels (−0.5 to +0.5 normalized units; Fig. 2A,B). For the membrane potential, the NL function of an ON cell was nearly linear, whereas the NL function of an OFF cell was rectifying at negative amplitudes (Fig. 2A). For spikes, the NL function of an ON cell was mildly rectifying at negative amplitudes, whereas the NL function of an OFF cell was strongly rectifying (Fig.2B). We quantified the difference in the NL function between ON and OFF cells using an NL index (Fig. 2D). For both membrane potential and spikes, the NL index was higher for an OFF cell than for an ON cell (p < 0.001). Thus, an ON cell responds to both an increment and decrement of low contrast, whereas an OFF cell responds only to a decrement of relatively high contrast.
To compare differences in absolute response range, we plotted the average NL function with original units of output (millivolts or spikes per second). For both membrane potential and spikes, an OFF cell uses a wider response range (Fig. 2C). Thus, an OFF cell requires relatively high contrast to begin spiking, but its range of voltage responses (13.7 ± 0.8, mean ± SEM) is higher than for an ON cell (9.1 ± 1.2 mV; p < 0.01), and its peak spike rate (120 ± 11 Hz) is higher than for an ON cell (71 ± 9 Hz; p < 0.01).
Across all cells, the membrane NL index correlated with the spike NL index. The correlation was significant when comparing the slopes at many ranges of input for the NL function; one representative range is plotted here, +0.5 to −0.1 (r = 0.76;p < 0.01; Fig. 2D). At this range, there was a significant correlation within the population of OFF cells alone (r = 0.69; p < 0.01). Thus, rectification in the synaptic inputs of a cell relates to rectification in the spiking output of the cell.
Response to a brief contrast flash is more rectifying for an OFF cell than for an ON cell
We took a second approach to compare ON and OFF cell rectification using a stimulus and analysis that did not require a model. Relative to a gray background, a spot over the dendritic tree was flashed for a single frame (16.7 msec) at each of several positive and negative contrasts spanning the full range (Fig.3). The initial response, before the onset of adaptational processes, should reflect the instantaneous response gain. We took the average response at 33–50 msec, but a similar result was obtained when plotting other ranges (e.g., 17–50, 17–67, and 33–67 msec).
Fig. 3.

Response to a brief flash confirms that an OFF cell rectifies more than an ON cell. A, Flash response of a representative ON and OFF cell. Traces attop show the membrane response to light flashes increasing to twice the mean luminance (thin lines) and dark flashes decreasing to 0 (thick lines). Poststimulus time histograms at bottom show the corresponding spike response. The contrast–response function of each cell is shown (inset, responses averaged over a 33–50 msec time window indicated by the gray stripe; average of 15 flashes for both cells; stimulus was a 500-μm-diameter spot).B, Population contrast–response functions for normalized membrane potential and spike rate (mean ± SEM). Responses were normalized to the peak depolarization or spike rate. For comparison, population NL functions from Figure 2 are superimposed (line with shaded area).sp, Spikes.
An ON cell responded nearly linearly in its membrane potential, whereas an OFF cell responded with strong rectification at hyperpolarizing responses (Fig. 3A). Both cells responded with rectification in the spike rate, but an OFF cell responded with stronger rectification (Fig. 3A). The population analysis gave the same result (Fig. 3B). Furthermore, the population responses resemble the population NL functions from the white noise experiment (Fig. 2A,B). We conclude that an OFF cell rectifies more than an ON cell in both its synaptic input and its spike output.
We next analyzed the responses at low contrast to quantify differences between ON and OFF cell spike rates and to assess their relative abilities to signal differences from the baseline response at mean luminance (n = 6 for ON and OFF; Fig. 3). At the smallest contrast of optimal sign (+0.2 for ON and –0.2 for OFF), an ON cell fired spikes at a higher rate (36 ± 5 Hz, mean ± SEM) than an OFF cell (8 ± 3; p < 0.001). At the smallest increment (+0.2), an ON cell responded significantly above its baseline response (increase of 27 ± 7 Hz; p < 0.02); at the smallest decrement (–0.2), an ON cell responded significantly below baseline (decrease of 3 ± 1 Hz;p < 0.05). At the smallest decrement, an OFF cell responded not significantly differently from baseline (increase of 5 ± 2 Hz; p < 0.10, trend); at the next largest decrement (–0.4) an OFF cell responded significantly above baseline (increase of 44 ± 15 Hz; p < 0.05). At the lowest increment (+0.2), an OFF cell responded no differently from baseline (decrease of 0 ± 1 Hz; p > 0.10). Thus, an ON cell could signal a small increment or decrement in light intensity, whereas an OFF cell could only weakly signal a small decrement.
ON and OFF cell differences in rectification of synaptic input correspond to different mechanisms for inhibition
Greater rectification in an OFF cell can be explained by a relatively weak hyperpolarizing response. This suggests a possible difference in inhibitory mechanisms between an ON and OFF cell. To investigate this, we measured a hyperpolarizing light response while injecting steady current and estimated whether hyperpolarization is related to direct or indirect inhibition (Belgum et al., 1982). In most cases, we blocked spikes that would obscure the membrane response (50 mm QX-314 in the pipette; Connors and Prince, 1982).
If the hyperpolarizing light response was caused by direct inhibition (opening a Cl− or K+ channel), injecting negative current should reduce the response, because driving force decreases, and positive current should enhance the response, because driving force increases. Direct inhibition was observed in an OFF cell to a 100 msec light flash, with estimated reversal negative to Vrest (Fig.4A). However, an ON cell received indirect inhibition (i.e., reduced excitation); negative current increased the hyperpolarizing response to a dark flash, with estimated reversal positive to Vrest (Fig.4A). In both cells, the depolarizing light response reversed positive to Vrest, consistent with direct excitation (Fig. 4A).
Fig. 4.
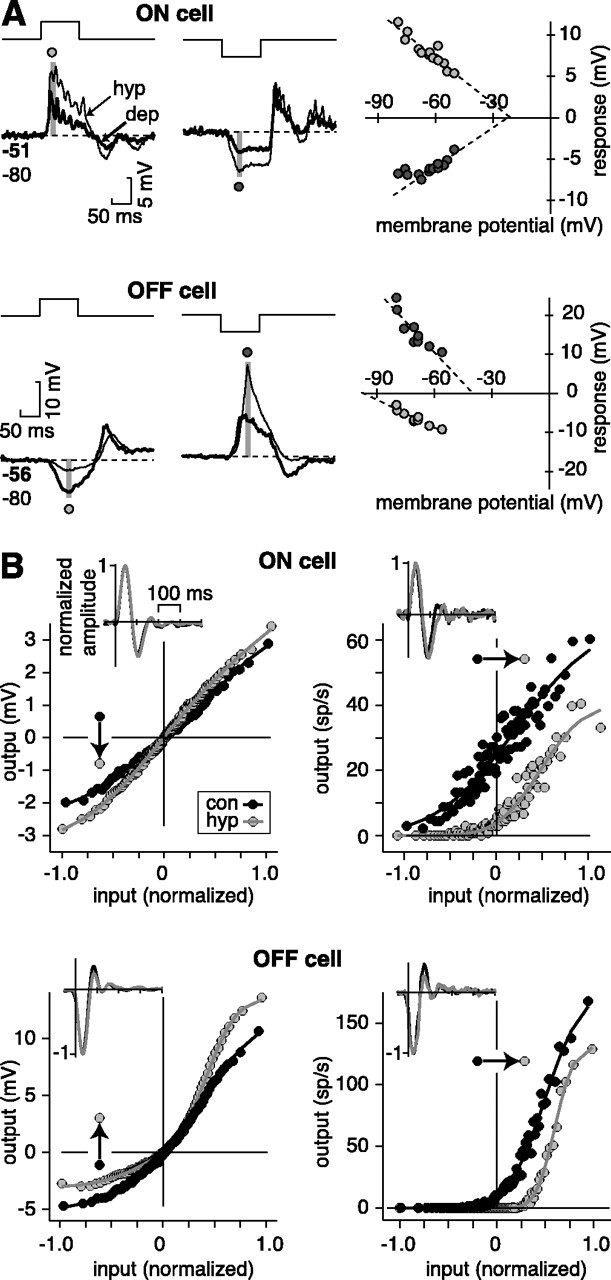
Mechanism for inhibition is indirect for an ON cell but direct for an OFF cell. A, Response to a 100 msec flash of positive (1.0) or negative (–1.0) contrast was measured while injecting steady hyperpolarizing (hyp) or depolarizing (dep) current. The baseline membrane potential is plotted versus the peak of the depolarizing light response or the trough of the hyperpolarizing light response (averaged over 10 msec; gray stripe). For the ON cell, both the depolarizing response and hyperpolarizing response have apparent reversal positive to Vrest (approximately –20 mV). For the OFF cell, the depolarizing response reverses positive to Vrest (–40 mV), whereas the hyperpolarizing response reverses negative to Vrest (–100 mV).Numbers below the trace indicate membrane potential (in millivolts) before the stimulus in the depolarized (bold) and hyperpolarized condition. Dashed lines indicate linear regression. For the OFF cell, the recording electrode contained QX-314. B, White noise response was measured in a control condition (con) or while injecting steady hyperpolarizing current (hyp). For membrane NL function, the arrow indicates the direction of the effect of hyperpolarizing current on the hyperpolarizing light response (negative values of input axis). The effect of hyperpolarizing current on the membrane NL function was consistent with indirect inhibition in an ON cell but direct inhibition in an OFF cell (see Results). For the OFF cell, the control curve was measured with depolarizing current to enhance the effect of hyperpolarizing current. In both cells, hyperpolarizing current caused a rightward shift in the spike NL function, increasing output rectification.Insets show the corresponding L filter, which was normalized after injecting current to match the control peak amplitude (see Mateials and Methods). sp, Spikes.
We tested whether ON and OFF cells differed in their pattern of estimated reversal for inhibition: reversal positive to Vrest (four of four ON and zero of nine OFF cells) or negative to Vrest (zero of four ON and nine of nine OFF cells). A χ2 test of independence showed a significant effect (p < 0.01). From the best cells (i.e., most data points and greatest stability), we estimate the following reversal potentials for the hyperpolarizing response: ON cell, –20.4 ± 6.4 (mean ± SEM; n = 3); and OFF cell, –95.0 ± 6.5 (n = 7). ON and OFF cells showed a similar reversal for the depolarizing response: ON cell, –11.4 ± 0.6 mV; and OFF cell, –20.8 ± 11.0. We observed the same pattern of results when we injected current and measured the depolarizing and hyperpolarizing responses to a 1 Hz step response (n = 2 ON cells and 2 OFF cells; data not shown). Input resistances of ON cells (27.1 ± 6.1 MΩ; n = 5) and OFF cells (29.8 ± 4.7 MΩ;n = 9) did not differ significantly and were similar to cat Y (α) cells (31.3 MΩ; O'Brien et al., 2002). These data are consistent with distinct mechanisms for inhibition in ON and OFF cells; an ON cell hyperpolarizes because of the decrease of an excitatory conductance, whereas an OFF cell hyperpolarizes because of the increase of an inhibitory conductance. For the inhibition of an OFF cell, the estimated reversal (approximately −95 mV) likely represents a mix of an increased inhibitory conductance and a decreased excitatory conductance.
To further confirm the basic observation regarding different mechanisms for inhibition in an ON and OFF cell, we performed a similar experiment using white noise. We used standard electrodes (i.e., without QX-314) so we could measure the effect on spiking. For an ON cell, negative current increased the hyperpolarizing response (i.e., left side of the membrane NL function; n = 2; Fig.4B), whereas for an OFF cell, negative current decreased the hyperpolarizing response (n = 3; Fig.4B). Thus, these measurements confirm that the reversal potential for hyperpolarizing light responses is positive to Vrest for the ON cell but negative to Vrest for the OFF cell.
Polarizing the cell altered rectification of spiking responses
For an ON cell, hyperpolarizing current caused an increase in rectification at low contrast in the spike NL function (n = 2; Fig. 4B). This rectification in spikes occurred even though the membrane NL function remained nearly linear. Similarly, for the OFF cell, hyperpolarizing current caused an increase in rectification in the spike NL function (n = 3; Fig. 4B). A similar result was observed in an OFF cell when measuring responses to brief flashes of various contrast; the rectification in spike output at low contrast was reduced by injecting depolarizing current and raising the maintained discharge (n = 4; data not shown). Thus, simply altering the Vrest of a cell by injecting current could strongly influence rectification in the spike output of the cell. The increased rectification in spike output at slightly hyperpolarized potentials suggests that there does not exist a strong adaptive mechanism to bring the maintained spike rate to the same level regardless of a small (<5 mV) change in membrane potential.
Evidence that the hyperpolarizing response of an ON cell depends on a high basal rate of glutamate release
For an ON cell, both hyperpolarizing and depolarizing light responses have nearly the same estimated reversal potential (Fig.4A); this suggests that the response to light and dark of an ON cell modulates the same conductance. Presumably this conductance is driven primarily by the glutamate release of the ON bipolar cell. Glutamate release would have to be high, nearly in the middle of its operating range, so that peak hyperpolarizing responses attributable to stopping glutamate release would equal peak depolarizing responses to doubling glutamate release (Figs. 2, 3).
To test for a high tonic level of glutamate release, we measured the response in the membrane potential of an ON cell at several points after tonically hyperpolarizing the ON bipolar cell with the agonist of its metabotropic glutamate receptor (mGluR6), l-AP-4 (25–50 μm; Shiells et al., 1981; Slaughter and Miller, 1981).l-AP-4 hyperpolarized the membrane potential and reduced the variance of the membrane potential (Fig. 5) (Bloomfield and Dowling, 1985; Cohen, 1998). Across cells, l-AP-4 hyperpolarized the membrane from –59.1 ± 2.5 mV (mean ± SEM) to –64.3 ± 3.0 mV (decrease of 5.2 ± 1.4 mV;n = 5; p < 0.01); at wash, the membrane returned to –58.6 ± 4.3 mV.l-AP-4 reduced the variance from 1.34 ± 0.43 mV2 to 0.09 ± 0.02 mV2 (decrease of 88 ± 5%;n = 5; p < 0.001); at wash, the variance returned to 1.07 ± 0.43 mV2. The hyperpolarization coupled with a reduction in variance is consistent with a reduction in presynaptic transmitter release.
Fig. 5.
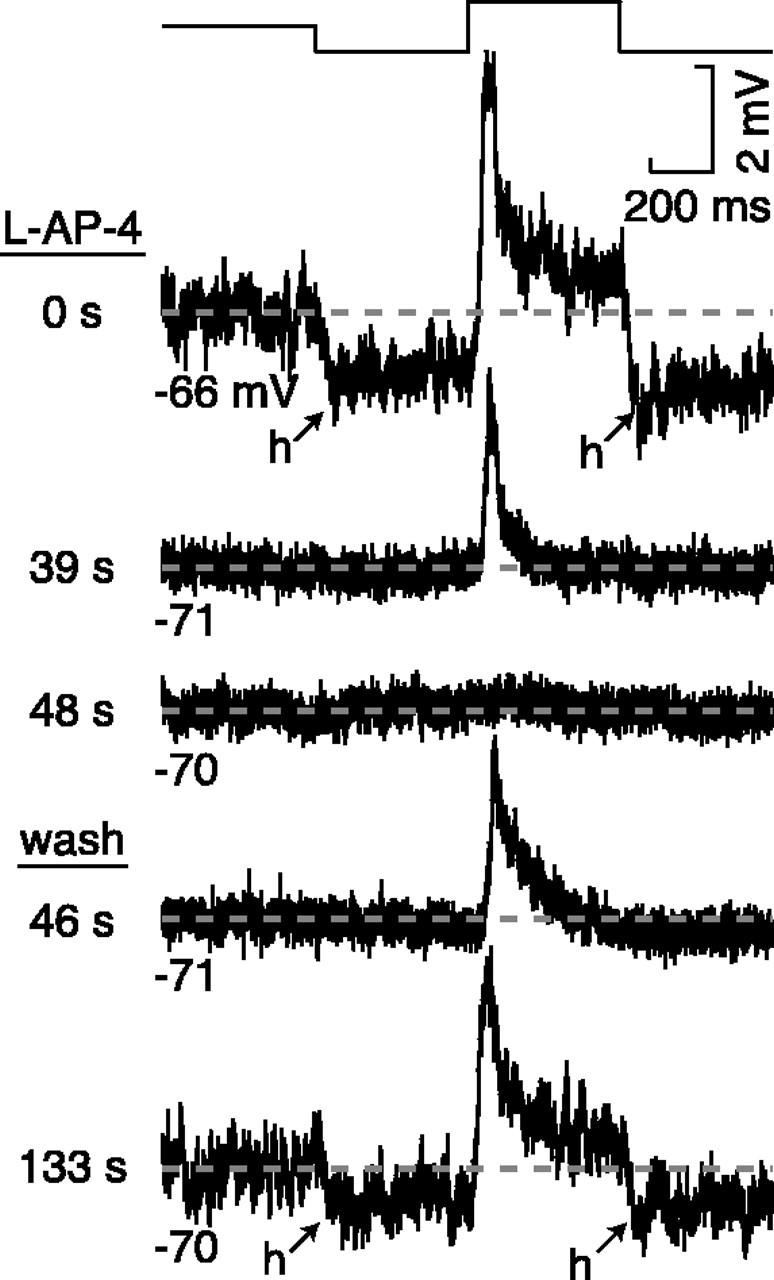
Evidence that the hyperpolarizing response of an ON cell depends on high basal glutamate release. Thetrace shows 500 msec of mean luminance followed by 1.5 cycles of a step response (full contrast). Initially (39 s), l-AP-4 reduced the membrane variance at mean luminance and eliminated the hyperpolarizing response to dark (h). Next (48 s),l-AP-4 eliminated the depolarizing response to light. The recovery during wash was in the opposite order; first (46 s) the depolarizing response recovered, and then (133 s) the variance increased, and the hyperpolarizing response returned. Apparently the hyperpolarizing response depends on basal glutamate release (which causes increased membrane variance at mean luminance) so that an excitatory signal can be withdrawn. The recording electrode contained QX-314 so that membrane variance could be assessed independent of spiking.
To test whether the hyperpolarizing response to dark depends on a high tonic level of glutamate release, we measured the time course of the block of hyperpolarizing versus depolarizing light responses. If the hyperpolarizing light response depends on the suppression of a high level of basal glutamate release, this response should be blocked before the depolarizing response, which does not depend on basal release. In fact, this was observed, and during the wash, the depolarizing response reappeared before the hyperpolarizing response (Fig. 5). In general, the hyperpolarizing response to dark was present only when there was high variance in the membrane potential at mean luminance. This implies that the hyperpolarizing response of an ON ganglion cell depends on a reduction in the high basal release of glutamate of the ON bipolar cell.
Evidence that an OFF cell is phasically inhibited by the ON pathway
For an OFF cell, the hyperpolarizing light response depends on direct inhibition at light onset (Figs. 4). This suggests that, unlike the ON pathway, the basal rate of OFF bipolar cell glutamate release is low and cannot itself be much inhibited. Instead, direct inhibition at light onset suggests that the OFF ganglion cell is directly inhibited by an ON amacrine cell. We tested this by measuring how direct inhibition in an OFF cell was affected by blocking the ON pathway withl-AP-4.
When the ON pathway was blocked, the hyperpolarizing response in an OFF cell remained but decreased in amplitude (Fig.6A). However, the nature of the hyperpolarization changed from direct inhibition (reversal of approximately –100mV) to indirect inhibition (i.e., decreased excitation; reversal of ∼0mV); the effect ofl-AP-4 reversed at wash (Fig.6A). l-AP-4 caused the reversal for inhibition to switch from negative to Vrestto positive to Vrest (four of five cells, χ2 test of independence,p < 0.01); in one cell, l-AP-4 caused the slope to become flat (i.e., a reversal could not be estimated). From four OFF cells, we estimate the following reversal potentials for the hyperpolarization to brightening: control condition, –92.7 ± 11.3 mV (mean ± SEM); andl-AP-4, +17.4 ± 19.6 mV. The reversal for the depolarization to darkening was unaffected by L-AP-4: control, –6.1 ± 15.9 mV; and l-AP-4, –13.2 ± 12.3 mV. A straightforward explanation for these results is that direct inhibition during light increment in an OFF cell is driven by an ON amacrine cell. With the ON pathway inhibition blocked, the remaining hyperpolarization at light onset apparently depends on reducing the basal rate of glutamate from the OFF bipolar cell.l-AP-4 also suppresses the glutamate release of the OFF bipolar terminal (Awatramani and Slaughter, 2001). However, this alternative action cannot explain the effects on depolarizing and hyperpolarizing responses shown here (see Discussion).
Fig. 6.
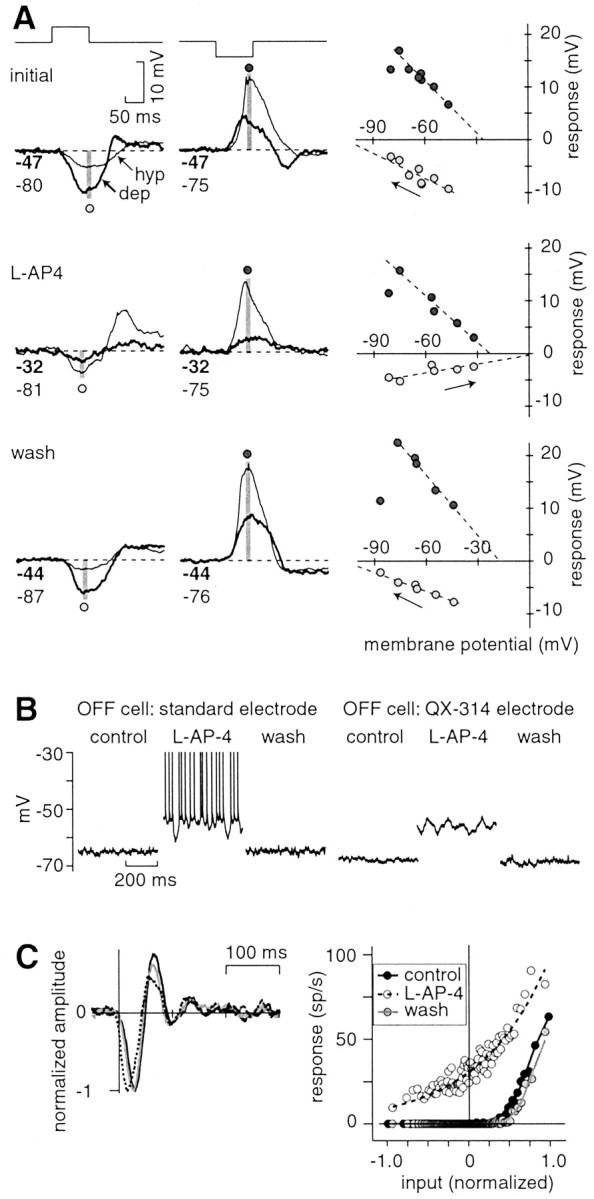
The ON pathway inhibits an OFF cell phasically to a light flash and tonically at mean luminance. A, The response of an OFF cell was measured to a 100 msec bright or dark spot (full contrast). Initially, the hyperpolarizing (hyp) response had an apparent reversal negative to Vrest(approximately –100 mV). During l-AP-4, the hyperpolarizing response was altered; it became smaller and had an apparent reversal positive to Vrest (∼0 mV). The effect of l-AP-4 reversed after washing. In all three conditions, the depolarizing (dep) response had similar apparent reversal (between –30 and –20 mV). Lines indicate a linear regression. The leftward point for the depolarizing response was not included in the fit; at the most hyperpolarized point, the depolarizing response to dark was delayed, so the amplitude in the time window (gray stripe) was reduced. Numbers below the traceindicate baseline potential (in millivolts) before the stimulus in the depolarized (bold) and hyperpolarized condition. The recording electrode contained QX-314. B,l-AP-4 depolarized an OFF cell and increased its spike rate. l-AP-4 caused an increase in membrane variance, even in the absence of spiking (QX-314 electrode). C, For the white noise response, the spike L filter and NL function change in the presence of l-AP-4 (standard electrode). In the presence ofl-AP-4, the spike L filter became faster and less biphasic; the NL function became more linear at low contrast (less rectified), because the baseline spike rate increases from 0 to 30 Hz. L filters are normalized to their peak response (and NL functions are scaled accordingly; see Materials and Methods). sp, Spikes.
Evidence that an OFF cell is tonically inhibited by the ON pathway
When l-AP-4 was applied, an OFF cell tonically depolarized from –62 ± 2.1 mV (mean ± SEM) to –54.7 ± 2.8 mV (standard electrode, n = 3; QX-314 electrode,n = 7; Fig. 6B). When an OFF cell was tonically depolarized, the noise in the membrane potential increased, opposite to the effect observed in an ON cell (Fig. 6B), and there was an increase in input resistance (29 ± 14%; n = 6; p< 0.10, trend). For a cell recorded with a standard electrode, the spike rate also increased from 5.5 ± 4.0 to 19.5 ± 8.0 Hz (n = 3). A “burstiness” was observed in the spikes in the initial period after l-AP-4 (Fig.6B). As a consequence of the increased spike rate,l-AP-4 reduced rectification in the NL function; thus an OFF cell could effectively respond to low contrasts (n = 3; Fig. 6C).
Discussion
Different circuits for ON and OFF
Our experiments suggest distinct circuits for ON and OFF cells (Fig. 7); the circuit diagrams refer to the receptive field “center” response to changes in light over the dendritic tree. The ON cell response is relatively straightforward: the basal release rate of glutamate of an ON bipolar cell is high and can be increased in response to brightening and decreased in response to darkening (Figs. 4, 5). In this sense, it simply follows the output of glutamate from the cone, except for a sign reversal (attributable to the metabotropic glutamate receptor at the dendrite of the ON bipolar cell). In addition, the ON bipolar cell excites an ON amacrine cell that provides “feedforward” inhibition to the ON ganglion cell. Thus, the reversal potential for the depolarizing response would be between the reversals for the excitatory conductance (∼0 mV) and inhibitory conductance (approximately –80 mV). We estimate the reversal at the soma to be approximately –20 mV (Fig. 4). At the dendrites, where synapses are located, the reversal potential is probably more negative than –20 mV (see Materials and Methods); however, a more negative reversal in the dendrites (e.g., –30 mV) would also suggest mixed excitation and feedforward inhibition. In rabbit and salamander ganglion cells, the depolarizing spot response also reversed between –40 and –20 mV (Flores-Herr et al., 2001; Roska and Werblin, 2001; Pang et al., 2002).
Fig. 7.

Circuit models for ON and OFF pathways.Left, The ON cell depolarizing response arises from a combination of excitation (cone → ON bipolar → ON ganglion) and feedforward inhibition (cone → ON bipolar → ON amacrine → ON ganglion); the reversal potential would be in between the reversal potentials of the two conductances. The ON cell hyperpolarizing response arises from the withdrawal of the synaptic inputs; this requires that the basal rate of glutamate release from the ON bipolar cell is high at rest. As evidence for this, ON cell depolarizing and hyperpolarizing light responses had a similar reversal potential, suggesting modulation up or down of a single conductance (Figs. 4, 5).Right, The OFF cell depolarizing response arises from a pathway that is parallel to the ON cell (i.e., a combination of excitation and feedforward inhibition). However, basal release of transmitter is apparently low at rest, so a strong hyperpolarizing response cannot be generated by the withdrawal of basal glutamate release. Instead, an additional input, involving cross talk from the ON pathway, is required (cone → ON bipolar → ON amacrine → OFF ganglion). As evidence for this inhibitory pathway, the OFF cell hyperpolarizing light response arose from direct inhibition (Fig. 4) and was blocked by l-AP-4 (Fig. 6). l-AP-4 also caused an OFF cell to depolarize in a tonic manner (Fig.6B), suggesting that the ON amacrine cell provides tonic inhibition at mean luminance.
The OFF cell circuit is slightly more complex than the ON circuit (Fig.7). An OFF cone bipolar cell has a low basal rate of glutamate release that can only increase in response to darkening (Fig. 4); this pathway also involves feedforward inhibition via an OFF amacrine cell, in parallel with the ON circuit (Fig. 4). However, an additional amacrine cell, driven by the ON pathway, directly inhibits the OFF ganglion in response to brightening (Fig. 6). A surprising aspect of ON and OFF circuits is the asymmetric cross talk between the two pathways; only the OFF pathway requires cross talk from the ON pathway.
In addition to phasic inhibition at light onset, the ON pathway tonically inhibits the OFF ganglion cell at mean luminance (Fig. 6).l-AP-4 caused an OFF cell to depolarize, increase its spike rate, and become bursty (i.e., increased variance of membrane voltage) even in the absence of spiking (Massey et al., 1983; Bolz et al., 1984;Wassle et al., 1986). Because l-AP-4 also increased input resistance in most cells, we conclude that normally an ON amacrine cell directly inhibits the OFF ganglion cell dendrite. However, we cannot rule out a tonic inhibition onto the OFF bipolar terminal. Indeed, the bursty resting voltage of the ganglion cell in the presence of l-AP-4 suggests altered presynaptic glutamate release (Fig. 6B); the burstiness probably does not reflect a voltage-dependent intrinsic property of the ganglion cell, because depolarizing currents did not produce burstiness (Fig.4A). At present, we cannot determine whether the phasic and tonic inhibitions from the ON pathway arise from one amacrine cell type or two.
The circuit diagram provides a simple explanation for our data based on differences in ON and OFF synaptic inputs. ON and OFF cells appear to express similar intrinsic properties (O'Brien et al., 2002), but we cannot completely rule out their contribution to differences in ON and OFF sensitivities (Velte and Masland, 1999; Chen and Diamond, 2002),
Different inhibitory mechanisms for ON and OFF
Previously, we observed that ON and OFF cells have different mechanisms for inhibition; an ON cell receives indirect inhibition (i.e., reduced excitation), reducing a conductance that reverses positive to Vrest, whereas an OFF cell receives direct inhibition, increasing a conductance that reverses negative to Vrest (Demb et al., 2001a,b). However, these previous experiments were performed either under a pharmacological condition in which spiking amacrine cells were blocked or else with relatively complex motion stimuli. We repeated the basic experiment using contrast flashes and white noise and confirmed our earlier findings (Fig. 4). Distinct mechanisms for inhibition also occur in rabbit; the OFF α cell receives direct inhibition from the ON pathway at light onset, whereas the ON α cell does not receive direct inhibition from the OFF pathway at light offset (B. Roska, personal communication). Cat X and Y cells showed a similar ON–OFF asymmetry in vivo. l-AP-4 blocked all response components of ON cells, but l-AP-4 blocked only the inhibitory component of an OFF cell (Chen and Linsenmeier, 1989). This supports the asymmetric cross talk between pathways, wherein the ON pathway inhibits the OFF cell but not vice versa (Chen and Linsenmeier, 1989; but see Cohen, 1998).
Temporal processing in ON and OFF
The linear component of the L–NL analysis reflects the impulse response function of a cell (given a fixed mean luminance and contrast). ON and OFF cells expressed opposite-signed but otherwise similar impulse responses (Fig. 2). Thus, under our conditions (photopic, high-contrast white noise) presynaptic inputs to ON and OFF ganglion cells temporally filter the stimulus in a similar way. In response to a discrete light pulse, the impulse response of a cell will shorten its integration time as contrast increases because of contrast adaptation; this will shorten the time to peak at high contrast relative to low contrast (Fig. 3). On average, the time to peak response at high contrast was shorter in ON cells (43.7 ± 2.5 msec) than OFF cells (57.0 ± 6.3 msec, mean ± SEM;p < 0.10, trend; Fig. 3). There were additional ON–OFF asymmetries in the waveform of the response to a 100 msec light pulse (Fig. 4). Thus, in general, ON and OFF cells express unique temporal properties, and these probably reflect asymmetries in the expression of contrast and light adaptations (Chander and Chichilnisky, 2001; Kim and Rieke, 2001; Chichilnisky and Kalmar, 2002).
Relationship between ON and OFF asymmetries in physiology and morphology
In several species (human, monkey, rat, and guinea pig) at a given retinal location, the dendritic area of an ON brisk-transient cell is ∼40% larger than the area of an OFF brisk-transient cell (i.e., ON vs OFF parasol or α cell; Peichl, 1989; Dacey and Petersen, 1992;Tauchi et al., 1992; Chichilnisky and Kalmar, 2002; Y.-H. Kao and J. Demb, unpublished observations). In monkey and guinea pig, an ON cell is more sensitive at low contrast (Figs. 2, 3) (Chichilnisky and Kalmar, 2002). Thus, it appears that within the brisk-transient system, an ON cell shows high contrast sensitivity and low spatial resolution, whereas an OFF cell shows lower contrast sensitivity and higher spatial resolution. This difference, within the brisk-transient system, would parallel the classic trade-off between the brisk-transient channel (high contrast sensitivity and low spatial resolution) and the brisk-sustained channel (low contrast sensitivity and high spatial resolution).
Alternative explanation for the action of L-AP-4
Group III metabotropic glutamate receptors are located on both the ON bipolar dendrite and the ON and OFF bipolar axon terminal (Brandstätter et al., 1996). l-AP-4 directly suppresses glutamate release from OFF bipolar terminals, especially at lower release rates (Awatramani and Slaughter, 2001; Higgs et al., 2002). However, we consider it unlikely that this direct action on the OFF bipolar terminal could explain our results in an OFF ganglion cell, because l-AP-4 did not reduce the depolarizing response to light decrement of the OFF cell (Fig. 6A). Thus, we think it most likely that l-AP-4 mainly hyperpolarized the ON bipolar cell, which led to reduced inhibition from an ON amacrine cell onto an OFF ganglion cell.
Implications for vision
The response to white noise resembles the response to natural stimuli (Meister and Berry, 1999; Reinagel and Reid, 2000; Reinagel, 2001; van Hateren et al., 2002). Thus, on the basis of the white noise response, we propose that under natural viewing conditions, an ON cell would respond well at low contrast, whereas an OFF cell would respond poorly (Fig. 2) (Chichilnisky and Kalmar, 2002). We reached a similar conclusion by measuring the response to brief contrast flashes; an ON cell could signal both increments and decrements, whereas an OFF cell could signal only decrements (Fig. 3). Low sensitivity in an OFF cell depends partly on its low maintained discharge, shown here in vitro and elsewhere in vivo (Cleland et al., 1973;Kaplan et al., 1987; Troy and Robson, 1992; Passaglia et al., 2001). The low maintained discharge of an OFF cell would be further reduced at the next synaptic stage, because an LGN relay cell only conveys ∼40% of the spikes from its retinal afferent (Kaplan et al., 1987).
Our results suggest a basis for the perceptual asymmetry in detecting a low-contrast increment or decrement. At threshold, a human observer is relatively more sensitive to a decrement (Short, 1966; Krauskopf, 1980;Bowen et al., 1989, 1992). We found that at low contrast, a decrement generates a signal in both the ON pathway (significant decrease in spikes) and the OFF pathway (significant increase in spikes), whereas an increment generates a signal only in the ON pathway (significant increase in spikes). Thus, perceptual sensitivity could be higher for the decrement, because it is signaled by both ON and OFF pathways rather than only a single pathway. Under intraocular l-AP-4 injection, a monkey showed mild impairment for detecting a low-contrast decrement, suggesting that the ON pathway normally contributes to this perceptual decision (Dolan and Schiller, 1994).
Footnotes
This work was supported by National Eye Institute Grants T32-EY07035 and RO1-EY08124. We thank Dr. E. J. Chichilnisky, Dr. Michael Freed, Dr. Edward Pugh Jr, and Dr. Peter Sterling for comments on this manuscript.
Correspondence should be addressed to Dr. Jonathan Demb, 123 Anatomy/Chemistry Building, University of Pennsylvania School of Medicine, Philadelphia, PA 19104-6058. E-mail:demb@retina.anatomy.upenn.edu.
References
- 1.Ashmore JF, Copenhagen DR. An analysis of transmission from cones to hyperpolarizing bipolar cells in the retina of the turtle. J Physiol (Lond) 1983;340:569–597. doi: 10.1113/jphysiol.1983.sp014781. [DOI] [PMC free article] [PubMed] [Google Scholar]
- 2.Awatramani GB, Slaughter MM. Intensity-dependent, rapid activation of presynaptic metabotropic glutamate receptors at a central synapse. J Neurosci. 2001;21:741–749. doi: 10.1523/JNEUROSCI.21-02-00741.2001. [DOI] [PMC free article] [PubMed] [Google Scholar]
- 3.Baccus SA, Meister M. Fast and slow contrast adaptation in retinal circuitry. Neuron. 2002;36:909–919. doi: 10.1016/s0896-6273(02)01050-4. [DOI] [PubMed] [Google Scholar]
- 4.Belgum JH, Dvorak DR, McReynolds JS. Sustained synaptic input to ganglion cells of mudpuppy retina. J Physiol (Lond) 1982;326:91–108. doi: 10.1113/jphysiol.1982.sp014179. [DOI] [PMC free article] [PubMed] [Google Scholar]
- 5.Benardete EA, Kaplan E. The dynamics of primate M retinal ganglion cells. Vis Neurosci. 1999;16:355–368. doi: 10.1017/s0952523899162151. [DOI] [PubMed] [Google Scholar]
- 6.Bloomfield SA, Dowling JE. Roles of aspartate and glutamate in synaptic transmission in rabbit retina. II. Inner plexiform layer. J Neurophysiol. 1985;53:714–725. doi: 10.1152/jn.1985.53.3.714. [DOI] [PubMed] [Google Scholar]
- 7.Bolz J, Wassle H, Thier P. Pharmacological modulation of on and off ganglion cells in the cat retina. Neuroscience. 1984;12:875–885. doi: 10.1016/0306-4522(84)90176-3. [DOI] [PubMed] [Google Scholar]
- 8.Bowen RW, Pokorny J, Smith VC. Sawtooth contrast sensitivity: decrements have the edge. Vision Res. 1989;29:1501–1509. doi: 10.1016/0042-6989(89)90134-x. [DOI] [PubMed] [Google Scholar]
- 9.Bowen RW, Pokorny J, Smith VC, Fowler MA. Sawtooth contrast sensitivity: effects of mean illuminance and low temporal frequencies. Vision Res. 1992;32:1239–1247. doi: 10.1016/0042-6989(92)90218-8. [DOI] [PubMed] [Google Scholar]
- 10.Brainard DH. The psychophysics toolbox. Spat Vis. 1997;10:433–436. [PubMed] [Google Scholar]
- 11.Brandstätter JH, Koulen P, Kuhn R, van der Putten H, Wässle H. Compartmental localization of a metabotropic glutamate receptor (mGluR7): two different active sites at a retinal synapse. J Neurosci. 1996;16:4749–4756. doi: 10.1523/JNEUROSCI.16-15-04749.1996. [DOI] [PMC free article] [PubMed] [Google Scholar]
- 12.Brown SP, Masland RH. Spatial scale and cellular substrate of contrast adaptation by retinal ganglion cells. Nat Neurosci. 2001;4:44–51. doi: 10.1038/82888. [DOI] [PubMed] [Google Scholar]
- 13.Chander D, Chichilnisky EJ. Adaptation to temporal contrast in primate and salamander retina. J Neurosci. 2001;21:9904–9916. doi: 10.1523/JNEUROSCI.21-24-09904.2001. [DOI] [PMC free article] [PubMed] [Google Scholar]
- 14.Chen EP, Linsenmeier RA. Centre components of cone-driven retinal ganglion cells: differential sensitivity to 2-amino-4-phosphonobutyric acid. J Physiol (Lond) 1989;419:77–93. doi: 10.1113/jphysiol.1989.sp017862. [DOI] [PMC free article] [PubMed] [Google Scholar]
- 15.Chen S, Diamond JS. Synaptically released glutamate activates extrasynaptic NMDA receptors on cells in the ganglion cell layer of rat retina. J Neurosci. 2002;22:2165–2173. doi: 10.1523/JNEUROSCI.22-06-02165.2002. [DOI] [PMC free article] [PubMed] [Google Scholar]
- 16.Chichilnisky EJ. A simple white noise analysis of neuronal light responses. Network. 2001;12:199–213. [PubMed] [Google Scholar]
- 17.Chichilnisky EJ, Kalmar RS. Functional asymmetries in ON and OFF ganglion cells of primate retina. J Neurosci. 2002;22:2737–2747. doi: 10.1523/JNEUROSCI.22-07-02737.2002. [DOI] [PMC free article] [PubMed] [Google Scholar]
- 18.Cleland BG, Levick WR, Sanderson KJ. Properties of sustained and transient ganglion cells in the cat retina. J Physiol (Lond) 1973;228:649–680. doi: 10.1113/jphysiol.1973.sp010105. [DOI] [PMC free article] [PubMed] [Google Scholar]
- 19.Cohen ED. Interactions of inhibition and excitation in the light-evoked currents of X type retinal ganglion cells. J Neurophysiol. 1998;80:2975–2990. doi: 10.1152/jn.1998.80.6.2975. [DOI] [PubMed] [Google Scholar]
- 20.Connors BW, Prince DA. Effects of local anesthetic QX-314 on the membrane properties of hippocampal pyramidal neurons. J Pharmacol Exp Ther. 1982;220:476–481. [PubMed] [Google Scholar]
- 21.Dacey DM, Petersen MR. Dendritic field size and morphology of midget and parasol ganglion cells of the human retina. Proc Natl Acad Sci USA. 1992;89:9666–9670. doi: 10.1073/pnas.89.20.9666. [DOI] [PMC free article] [PubMed] [Google Scholar]
- 22.Demb JB. Multiple mechanisms for contrast adaptation in the retina. Neuron. 2002;36:781–783. doi: 10.1016/s0896-6273(02)01100-5. [DOI] [PubMed] [Google Scholar]
- 23.Demb JB, Haarsma L, Freed MA, Sterling P. Functional circuitry of the retinal ganglion cell's nonlinear receptive field. J Neurosci. 1999;19:9756–9767. doi: 10.1523/JNEUROSCI.19-22-09756.1999. [DOI] [PMC free article] [PubMed] [Google Scholar]
- 24.Demb JB, Zaghloul K, Haarsma L, Sterling P. Bipolar cells contribute to nonlinear spatial summation in the brisk-transient (Y) ganglion cell in mammalian retina. J Neurosci. 2001a;21:7447–7454. doi: 10.1523/JNEUROSCI.21-19-07447.2001. [DOI] [PMC free article] [PubMed] [Google Scholar]
- 25.Demb JB, Zaghloul K, Sterling P. Cellular basis for the response to second-order motion cues in Y retinal ganglion cells. Neuron. 2001b;32:711–721. doi: 10.1016/s0896-6273(01)00484-6. [DOI] [PubMed] [Google Scholar]
- 26.Devries SH, Baylor DA. Mosaic arrangement of ganglion cell receptive fields in rabbit retina. J Neurophysiol. 1997;78:2048–2060. doi: 10.1152/jn.1997.78.4.2048. [DOI] [PubMed] [Google Scholar]
- 27.Dolan RP, Schiller PH. Effects of ON channel blockade with 2-amino-4-phosphonobutyrate (APB) on brightness and contrast perception in monkeys. Vis Neurosci. 1994;11:23–32. doi: 10.1017/s095252380001107x. [DOI] [PubMed] [Google Scholar]
- 28.Enroth-Cugell C, Robson JG. The contrast sensitivity of retinal ganglion cells of the cat. J Physiol (Lond) 1966;187:517–552. doi: 10.1113/jphysiol.1966.sp008107. [DOI] [PMC free article] [PubMed] [Google Scholar]
- 29.Flores-Herr N, Protti DA, Wassle H. Synaptic currents generating the inhibitory surround of ganglion cells in the mammalian retina. J Neurosci. 2001;21:4852–4863. doi: 10.1523/JNEUROSCI.21-13-04852.2001. [DOI] [PMC free article] [PubMed] [Google Scholar]
- 30.Freed MA, Sterling P. The ON-α ganglion cell of the cat retina and its presynaptic cell types. J Neurosci. 1988;8:2303–2320. doi: 10.1523/JNEUROSCI.08-07-02303.1988. [DOI] [PMC free article] [PubMed] [Google Scholar]
- 31.Higgs MH, Romano C, Lukasiewicz PD. Presynaptic effects of group III metabotropic glutamate receptors on excitatory synaptic transmission in the retina. Neuroscience. 2002;115:163–172. doi: 10.1016/s0306-4522(02)00381-0. [DOI] [PubMed] [Google Scholar]
- 32.Hochstein S, Shapley RM. Linear and nonlinear spatial subunits in Y cat retinal ganglion cells. J Physiol (Lond) 1976;262:265–284. doi: 10.1113/jphysiol.1976.sp011595. [DOI] [PMC free article] [PubMed] [Google Scholar]
- 33.Kaplan E, Purpura K, Shapley RM. Contrast affects the transmission of visual information through the mammalian lateral geniculate nucleus. J Physiol (Lond) 1987;391:267–288. doi: 10.1113/jphysiol.1987.sp016737. [DOI] [PMC free article] [PubMed] [Google Scholar]
- 34.Keat J, Reinagel P, Reid RC, Meister M. Predicting every spike: a model for the responses of visual neurons. Neuron. 2001;30:803–817. doi: 10.1016/s0896-6273(01)00322-1. [DOI] [PubMed] [Google Scholar]
- 35.Kier CK, Buchsbaum G, Sterling P. How retinal microcircuits scale for ganglion cells of different size. J Neurosci. 1995;15:7673–7683. doi: 10.1523/JNEUROSCI.15-11-07673.1995. [DOI] [PMC free article] [PubMed] [Google Scholar]
- 36.Kim KJ, Rieke F. Temporal contrast adaptation in the input and output signals of salamander retinal ganglion cells. J Neurosci. 2001;21:287–299. doi: 10.1523/JNEUROSCI.21-01-00287.2001. [DOI] [PMC free article] [PubMed] [Google Scholar]
- 37.Kolb H, Nelson R. OFF-alpha and OFF-beta ganglion cells in cat retina: II. Neural circuitry as revealed by electron microscopy of HRP stains. J Comp Neurol. 1993;329:85–110. doi: 10.1002/cne.903290107. [DOI] [PubMed] [Google Scholar]
- 38.Krauskopf Discrimination and detection of changes in luminance. Vision Res. 1980;20:671–677. doi: 10.1016/0042-6989(80)90091-7. [DOI] [PubMed] [Google Scholar]
- 39.Lankheet MJ, Molenaar J, van de Grind WA. Frequency transfer properties of the spike generating mechanism of cat retinal ganglion cells. Vision Res. 1989;29:1649–1661. doi: 10.1016/0042-6989(89)90147-8. [DOI] [PubMed] [Google Scholar]
- 40.Levitt JB, Schumer RA, Sherman SM, Spear PD, Movshon JA. Visual response properties of neurons in the LGN of normally reared and visually deprived macaque monkeys. J Neurophysiol. 2001;85:2111–2129. doi: 10.1152/jn.2001.85.5.2111. [DOI] [PubMed] [Google Scholar]
- 41.Marmarelis PZ, Marmarelis VZ. Analysis of physiological systems: the white-noise approach. Plenum; New York: 1978. [Google Scholar]
- 42.Massey SC, Redburn DA, Crawford ML. The effects of 2-amino-4-phosphonobutyric acid (APB) on the ERG and ganglion cell discharge of rabbit retina. Vision Res. 1983;23:1607–1613. doi: 10.1016/0042-6989(83)90174-8. [DOI] [PubMed] [Google Scholar]
- 43.Meister M, Berry MJ., II The neural code of the retina. Neuron. 1999;22:435–450. doi: 10.1016/s0896-6273(00)80700-x. [DOI] [PubMed] [Google Scholar]
- 44.O'Brien BJ, Isayama T, Richardson R, Berson DM. Intrinsic physiological properties of cat retinal ganglion cells. J Physiol (Lond) 2002;538:787–802. doi: 10.1113/jphysiol.2001.013009. [DOI] [PMC free article] [PubMed] [Google Scholar]
- 45.Pang JJ, Gao F, Wu SM. Relative contributions of bipolar cell and amacrine cell inputs to light responses of ON, OFF and ON-OFF retinal ganglion cells. Vision Res. 2002;42:19–27. doi: 10.1016/s0042-6989(01)00258-9. [DOI] [PubMed] [Google Scholar]
- 46.Passaglia CL, Enroth-Cugell C, Troy JB. Effects of remote stimulation on the mean firing rate of cat retinal ganglion cells. J Neurosci. 2001;21:5794–5803. doi: 10.1523/JNEUROSCI.21-15-05794.2001. [DOI] [PMC free article] [PubMed] [Google Scholar]
- 47.Peichl L. Alpha and delta ganglion cells in the rat retina. J Comp Neurol. 1989;286:120–139. doi: 10.1002/cne.902860108. [DOI] [PubMed] [Google Scholar]
- 48.Pelli DG. The VideoToolbox software for visual psychophysics: transforming numbers into movies. Spat Vis. 1997;10:437–442. [PubMed] [Google Scholar]
- 49.Reinagel P. How do visual neurons respond in the real world? Curr Opin Neurobiol. 2001;11:437–442. doi: 10.1016/s0959-4388(00)00231-2. [DOI] [PubMed] [Google Scholar]
- 50.Reinagel P, Reid RC. Temporal coding of visual information in the thalamus. J Neurosci. 2000;20:5392–5400. doi: 10.1523/JNEUROSCI.20-14-05392.2000. [DOI] [PMC free article] [PubMed] [Google Scholar]
- 51.Rieke F. Temporal contrast adaptation in salamander bipolar cells. J Neurosci. 2001;21:9445–9454. doi: 10.1523/JNEUROSCI.21-23-09445.2001. [DOI] [PMC free article] [PubMed] [Google Scholar]
- 52.Roska B, Werblin F. Vertical interactions across ten parallel, stacked representations in the mammalian retina. Nature. 2001;410:583–587. doi: 10.1038/35069068. [DOI] [PubMed] [Google Scholar]
- 53.Sakai HM, Naka K. Signal transmission in the catfish retina. IV. Transmission to ganglion cells. J Neurophysiol. 1987;58:1307–1328. doi: 10.1152/jn.1987.58.6.1307. [DOI] [PubMed] [Google Scholar]
- 54.Schiller PH. Central connections of the retinal ON and OFF pathways. Nature. 1982;297:580–583. doi: 10.1038/297580a0. [DOI] [PubMed] [Google Scholar]
- 55.Schiller PH. The ON and OFF channels of the visual system. Trends Neurosci. 1992;15:86–92. doi: 10.1016/0166-2236(92)90017-3. [DOI] [PubMed] [Google Scholar]
- 56.Schiller PH, Sandell JH, Maunsell JH. Functions of the ON and OFF channels of the visual system. Nature. 1986;322:824–825. doi: 10.1038/322824a0. [DOI] [PubMed] [Google Scholar]
- 57.Sherk H, Horton JC. Receptive field properties in the cat's area 17 in the absence of on-center geniculate input. J Neurosci. 1984;4:381–393. doi: 10.1523/JNEUROSCI.04-02-00381.1984. [DOI] [PMC free article] [PubMed] [Google Scholar]
- 58.Shiells RA, Falk G, Naghshineh S. Action of glutamate and aspartate analogues on rod horizontal and bipolar cells. Nature. 1981;294:592–594. doi: 10.1038/294592a0. [DOI] [PubMed] [Google Scholar]
- 59.Short AD. Decremental and incremental visual thresholds. J Physiol (Lond) 1966;185:646–654. doi: 10.1113/jphysiol.1966.sp008007. [DOI] [PMC free article] [PubMed] [Google Scholar]
- 60.Slaughter MM, Miller RF. 2-Amino-4-phosphonobutyric acid: a new pharmacological tool for retina research. Science. 1981;211:182–185. doi: 10.1126/science.6255566. [DOI] [PubMed] [Google Scholar]
- 61.Smirnakis SM, Berry MJ, Warland DK, Bialek W, Meister M. Adaptation of retinal processing to image contrast and spatial scale. Nature. 1997;386:69–73. doi: 10.1038/386069a0. [DOI] [PubMed] [Google Scholar]
- 62.Tauchi M, Morigiwa K, Fukuda Y. Morphological comparisons between outer and inner ramifying alpha cells of the albino rat retina. Exp Brain Res. 1992;88:67–77. doi: 10.1007/BF02259129. [DOI] [PubMed] [Google Scholar]
- 63.Troy JB, Lee BB. Steady discharges of macaque retinal ganglion cells. Vis Neurosci. 1994;11:111–118. doi: 10.1017/s0952523800011159. [DOI] [PubMed] [Google Scholar]
- 64.Troy JB, Robson JG. Steady discharges of X and Y retinal ganglion cells of cat under photopic illuminance. Vis Neurosci. 1992;9:535–553. doi: 10.1017/s0952523800001784. [DOI] [PubMed] [Google Scholar]
- 65.van Hateren JH, Ruttiger L, Sun H, Lee BB. Processing of natural temporal stimuli by macaque retinal ganglion cells. J Neurosci. 2002;22:9945–9960. doi: 10.1523/JNEUROSCI.22-22-09945.2002. [DOI] [PMC free article] [PubMed] [Google Scholar]
- 66.Velte TJ, Masland RH. Action potentials in the dendrites of retinal ganglion cells. J Neurophysiol. 1999;81:1412–1417. doi: 10.1152/jn.1999.81.3.1412. [DOI] [PubMed] [Google Scholar]
- 67.Victor JD. The dynamics of the cat retinal X cell centre. J Physiol (Lond) 1987;386:219–246. doi: 10.1113/jphysiol.1987.sp016531. [DOI] [PMC free article] [PubMed] [Google Scholar]
- 68.Wassle H, Schafer-Trenkler I, Voigt T. Analysis of a glycinergic inhibitory pathway in the cat retina. J Neurosci. 1986;6:594–604. doi: 10.1523/JNEUROSCI.06-02-00594.1986. [DOI] [PMC free article] [PubMed] [Google Scholar]
- 69.Weber AJ, Stanford LR. Synaptology of physiologically identified ganglion cells in the cat retina: a comparison of retinal X- and Y-cells. J Comp Neurol. 1994;343:483–499. doi: 10.1002/cne.903430310. [DOI] [PubMed] [Google Scholar]