

Abstract
The neurotrophic factors of the nerve growth factor family (neurotrophins) have been shown to promote neuronal survival after brain injury and in various models of neurodegenerative conditions. However, it has not been determined whether neurotrophin treatment results in the maintenance of function of the rescued cells. Here we have used the retrograde degeneration of geniculate neurons as a model system to evaluate neuronal rescue and sparing of function after administration of brain-derived neurotrophic factor (BDNF). Death of geniculate neurons was induced by a visual cortex lesion in adult rats, and exogenous BDNF was delivered to the axotomized geniculate cells via anterograde transport after injection into the eye. By microelectrode recordings from the geniculate in vivo we have measured several physiological parameters such as contrast threshold, spatial resolution (visual acuity), signal-to-noise ratio, temporal resolution, and response latency. In control lesioned animals we found that geniculate cell dysfunction precedes the onset of neuronal death, indicating that an assessment of neuronal number per se is not predictive of functional performance. The administration of BDNF resulted in a highly significant cell-saving effect up to 2 weeks after the cortical damage and maintained nearly normal physiological responses in the geniculate. This preservation of function in adult axotomized neurons suggests possible therapeutic applications of BDNF.
Keywords: BDNF, anterograde transport, neuronal death, retrograde degeneration, lateral geniculate nucleus, functional sparing
Introduction
The family of mammalian neurotrophins comprises nerve growth factor (NGF), brain-derived neurotrophic factor (BDNF), neurotrophin-3 (NT-3), and NT-4 (Lewin and Barde, 1996). These factors exert their actions on target cells through the binding to two classes of transmembrane receptors: the p75 neurotrophin receptor and the members of the Trk family of receptor tyrosine kinases (TrkA, TrkB, and TrkC) (Kaplan and Miller, 2000;Patapoutian and Reichardt, 2001). Because of their ability to support neuronal survival, the neurotrophins have been proposed as therapeutic agents for the treatment of brain injury and disease (Blesch et al., 1998; Mufson et al., 1999; Kordower et al., 2000). Indeed, there is ample evidence that the application of specific neurotrophins can rescue select populations of central neurons from injury-induced death. For example, intraocular delivery of BDNF protects retinal ganglion cells after optic nerve section (Mansour-Robaey et al., 1994; Klocker et al., 1998; Chen and Weber, 2001; Cheng et al., 2002), and NGF is a powerful trophic factor for axotomized basal forebrain cholinergic neurons (Hefti, 1986; Williams et al., 1986; Tuszynski et al., 1996). In most such studies, protection from neuronal death is documented at a purely morphological level. It remains to be determined whether the neuroprotective effects of neurotrophins are accompanied by sparing of function of the damaged cells. This is a fundamental issue to address because neuroprotection is useless if the rescued neurons do not function normally afterward (Dumas and Sapolsky, 2001). To this aim one needs a model of neurodegeneration in which physiological measurements can be reliably performed.
The good knowledge of the physiology of the visual system makes it an ideal system to evaluate sparing of function after a neuronal insultin vivo. We and others have described the massive neuronal death in the dorsal lateral geniculate nucleus (dLGN) induced by visual cortex ablation in mammals (Perry and Cowey, 1979; Agarwala and Kalil, 1998; Al-Abdulla et al., 1998; Cowey et al., 1999; Caleo et al., 2002). This process of death is apoptotic based on both ultrastructural and biochemical criteria (Al-Abdulla et al., 1998; Martin et al., 2001;Caleo et al., 2002). We have shown recently that the delivery of BDNF into the eye prevents the degeneration of half of the axotomized geniculate neurons in neonatal rats (Caleo et al., 2000). The effect of BDNF is mediated via uptake by retinal ganglion cells, anterograde transport along the optic nerve, and release to the postsynaptic geniculate neurons (Caleo et al., 2000). Here we test whether similar rescue effects are present in adult animals, in which BDNF was also demonstrated to travel anterogradely along the optic nerve (Caleo et al., 2000). We have used a cortical lesion in adult rats that induces the almost complete loss of geniculate projection neurons within 2 weeks (Agarwala and Kalil, 1998; Al-Abdulla et al., 1998; Caleo et al., 2002). By recording visual evoked potentials (VEPs) from the lateral geniculate nucleus in vivo we have measured several parameters such as contrast threshold, spatial resolution (visual acuity), temporal resolution, signal-to-noise ratio, and response latency. We have first evaluated the time course of the changes in geniculate physiology induced by visual cortex ablation to determine whether functional changes precede, follow, or coincide with the anatomical changes. Second, we have assessed the ability of BDNF (injected intraocularly with different regimens) to protect geniculate neurons from death and dysfunction.
Materials and Methods
Animal treatment and experimental protocol
The procedures used in this study were approved by the Italian Ministry of Health. A total of 42 adult Long–Evans rats (320–450 gm body weight) were used. Eleven animals were left untreated and used as normal controls. The remaining 31 underwent a visual cortex lesion. Five animals were recorded within a few hours of the cortical damage, and another five were analyzed 3 d later. Twenty-one animals were recorded 2 weeks postoperatively. Of these, four received bilateral intraocular injections of recombinant human BDNF (15 μg per eye; 1.5 μl of a 10 μg/μl solution in PBS) at the time of the lesion. Six animals were given three bilateral doses of BDNF (15 μg per eye) at days 0, 5, and 10 after surgery. This amount of intraocular BDNF has been shown previously to be effective in inducing a postsynaptic response in the geniculate cells (Caleo et al., 2000). Control lesions consisted either of lesioned untreated rats (n = 8) or lesioned rats that received one bilateral intraocular dose of cytochrome c (a protein with physicochemical properties similar to BDNF; 15 μg in PBS) immediately after the lesion (n = 3). After surgery animals were allowed to recover in their cages and then reared in a normal light/dark cycle withad libitum access to food and water.
Visual cortex ablation. Animals were placed in a stereotaxic apparatus under deep avertin anesthesia (1 ml/100 gm body weight, i.p.). A hole was made in the skull overlying visual cortex, the dura was removed, and the cortex was ablated with a needle connected to a vacuum pump (Caleo et al., 2002). Only animals in which the depth of the lesion reached the white matter and in which cortical areas Oc1, Oc2M, and Oc2L (Sefton and Dreher, 1995) were entirely ablated were included in our sample. After suction, the cut flap of bone was placed over the lesion, and antibiotics were locally applied before the skin was sutured. To minimize variability in the extent of the lesion between experimental groups, both control and BDNF-treated animals were operated in each surgical session. Animals were first lesioned and then randomly assigned to either the control or BDNF-treated group.
Intraocular injections. Under deep avertin anesthesia the animals were binocularly injected into the vitreous using a microinjector connected to a glass pipette (30–40 μm external diameter). Injections were made at the ora serrata and in correspondence with the nasal pole of the eye so that any damage to the retina would be confined to the monocular representation of the visual field.
Quantification of anterograde transport of radio-iodinated BDNF
One adult Sprague Dawley rat weighing 225 gm was used for quantification of anterograde transport of BDNF. BDNF was radiolabeled with lactoperoxidase (von Bartheld, 2001), resulting in an incorporation of 92% and a specific activity of 104 cpm/pg. The rat was anesthetized intraperitoneally with ketamine and xylazine at 40 and 5 mg/kg, respectively, and injected with 1 μg125I-BDNF in a volume of 8 μl in the posterior chamber of the right eye using a disposable insulin syringe (von Bartheld, 2001). The rat was allowed to recover and was anesthetized again after 6 hr. The animal was perfused with 4% paraformaldehyde through the heart, postfixed for 1 hr, and both eyes, the optic nerves, and the brain was dissected. Comparable structures of the right and left half of the brain were further dissected, and all tissues (eyes, optic nerves, olfactory bulbs, forebrain, midbrain, superior colliculi, and inferior colliculi) were counted separately in a gamma counter (1470 Wizard, Wallac). Eyes were counted for 1 min, all brain structures were counted for 10 min, and all gamma counts are expressed as “cpm.” Brain tissues were collected in 70% ethanol and dehydrated in a series of graded ethanols to remove free iodine. After dehydration, all brain parts were counted again in the gamma counter.
Electrophysiological analysis
Animals were anesthetized with urethane (Sigma, St. Louis, MO; 20% solution in saline; 0.7 ml/100 gm body weight, i.p.) and placed in a stereotaxic frame. Additional doses of urethane (0.07 ml/100 g) were given to keep the level of anesthesia stable throughout the experiment. Body temperature was monitored continuously and maintained at 37°C by a thermostat-controlled electric blanket. Oxygen was also administered continuously. Both eyes were fixed by means of adjustable metal rings surrounding the external portion of the eye bulb. After exposure of the cerebral surface, a micropipette (tip resistance = 2 MΩ) filled with 3 m NaCl was inserted into the brain to reach the dLGN. Stereotaxic coordinates were 2.6 mm anterior and 3.6 mm lateral from lambda. Several physiological landmarks could be identified as the electrode penetrated the brain, and these served as guides in locating the dLGN. Passage through the cell layers of the hippocampus was marked by bursts of spikes of high amplitude. The first evoked visual activity was typically encountered at a depth ranging between 3.6 and 4 mm from the pial surface. By flashing the beam of a small flashlight directly into the contralateral eye, we evoked a characteristic “swish” activity that reflects the discharges of optic tract fibers, lying dorsally to the dLGN. The electrode was further advanced to map the responses of single geniculate cells. In initial experiments, we determined that recording sites were within the dLGN using histological controls. The tip of the recording pipette was brushed gently with a saturated solution of DiI (Molecular Probes, Eugene, OR) in absolute ethanol, and the electrode was lowered to record geniculate activity. The animals were perfused transcardially with 4% paraformaldehyde, and the brains were dissected. Coronal sections through the thalamus examined with epifluorescence clearly showed DiI deposits inside the dLGN (see Fig.1A).
Fig. 1.

A, Fluorescence photomicrograph of a coronal section through the dLGN. The position of the recording microelectrode is marked by a DiI deposit located in the dorsal portion of the nucleus. The section has been lightly counterstained with Hoechst dye. D, Dorsal; L, lateral. Scale bar, 300 μm. B, Typical progression of the RF centers of single geniculate units along a micropipette track. Thecircles indicate the RF centers, and thenumbers within the circles indicate the sequence in which these neurons were encountered as the electrode was moved dorsoventrally. The cells were recorded at an interdistance of 100 μm from each other. Optic disk position is indicated by anasterisk. VM, Vertical meridian.C, Example of a geniculate steady-state VEP. The stimulus was a horizontal sine wave grating (spatial frequency, 0.1 c/deg; contrast, 90%; mean luminance, 15 cd/m2) reversed sinusoidally in contrast at 5 Hz. D, Retinotopy of geniculate VEPs. Recordings from the same penetration depicted inB and performed in correspondence to the single unit with RF 3. The visual stimulus has been windowed to a vertical stripe subtending 10° of visual angle and placed at different visual field azimuths. It is clear that there is a visual field azimuth yielding maximal response and corresponding to the RF position at which the VEP was recorded. VEP amplitude rapidly falls off for non-optimal stimulus positions, becoming indistinguishable from noise for windows centered farther then 20° from the RF position. Data have been fitted with a Gaussian curve. An identical behavior is observed when the visual stimulus is windowed to a horizontal stripe of 10° presented at different elevations. In this case, the VEP response vanishes when the horizontal stripe is shifted farther than 20° (either up or down in the visual field) from the RF position (data not shown in the figure).
For single-cell recording, signals were amplified 25,000-fold, bandpass filtered (500–5000 Hz), and visualized on an oscilloscope. Receptive fields (RFs) of single units were mapped onto a tangent screen by using hand-moved light spots of various sizes. VEPs were recorded at a location corresponding to cells driven by the contralateral eye and whose RFs were within 60° of the vertical meridian and in the upper visual field. The signal was amplified (10,000-fold), bandpass filtered (0.1–120 Hz), digitized, and averaged (60–200 events in packs of 10–20 events each). Partial averages from single packs were used to establish response reliability (Pizzorusso et al., 1997;Porciatti et al., 1999). Visual stimuli were gratings of various spatial frequencies and contrast generated by a VSG2/5 card (Cambridge Research Systems, Rochester, UK) on a display (Sony Multiscan G500) that was positioned 20–30 cm in front of the rat's eyes to include the central visual field. The mean luminance was 15 cd/m2. Contrast was defined as C =Lmax − Lmin/Lmax +Lmin, where Lmax and Lmin are the maximum and minimum luminance, respectively.
Steady-state VEPs. VEP recordings in steady-state mode (Pizzorusso et al., 1997) were used to measure spatial resolution, contrast threshold, and temporal resolution. Steady-state VEPs were recorded in response to gratings with sinusoidal modulation of contrast at different temporal frequencies. The visual response was measured as the amplitude (microvolts) of the second harmonic of the stimulation frequency (4–6 Hz for visual acuity and contrast threshold assessment, 2–16 Hz for temporal resolution studies), calculated after Fourier analysis of the signal (Fagiolini et al., 1997; Pizzorusso et al., 1997). Noise was taken as the average of the amplitudes of at least three VEP responses with both eyes closed. Response noise was checked periodically during the experiment.
For each electrode position within the dLGN we established the region of the visual field yielding VEPs of maximal amplitude (VEP receptive field) (Porciatti et al., 1999). To this aim we recorded a series of responses to sine wave grating stimuli windowed to either a vertical or horizontal stripe of 10° × 90° and presented at different visual field azimuths and elevations, respectively (Huang et al., 1999;Porciatti et al., 1999). Spatial integration of the microelectrode was inferred independently by the VEP amplitude dependence on window size. Typically, steady-state VEP amplitude saturated for a window 30° wide centered on the VEP receptive field.
Visual acuity was assessed after presentation of gratings of variable spatial frequencies alternating at 4–6 Hz (90% contrast). In the same temporal frequency range (4–6 Hz) we analyzed contrast threshold in response to 0.1 cycles per degree (c/deg) gratings. Temporal resolution was measured with gratings of 0.1 c/deg and 90% contrast. Acuity, temporal resolution, and contrast threshold were taken as the highest spatial frequency, highest temporal frequency, and lowest contrast, respectively, that evoked a VEP response greater than the mean value of the noise. These measures were remarkably consistent between different penetrations within the same dLGN. For signal-to-noise analysis, we took the mean VEP amplitude evoked by stimulation with an optimal stimulus grating (0.1–0.2 c/deg, 70–90% contrast, frequency of alternation 4–6 Hz) divided by the average noise level. Signal-to-noise ratio was calculated for each threshold determination in the different tracks of each recorded animal. This resulted in three to seven signal-to-noise ratio data points for each rat. Values of the signal-to-noise ratio from all animals in a given experimental group were pooled together, and this cumulated set of data was used for statistical comparisons.
Transient VEPs. We recorded transient VEPs to estimate latency of visual drive in the dLGN. Transient VEPs were recorded in response to the abrupt contrast reversal of a square-wave grating (spatial frequency 0.1 c/deg, contrast 90%) at the frequency that evokes maximal VEP amplitude in the rat (0.5 Hz) (Pizzorusso et al., 1997). At least 60 responses were averaged.
Immunohistochemistry
After the electrophysiological recording, each animal was perfused through the heart with PBS followed by fixative containing 4% paraformaldehyde in 0.1 m phosphate buffer, pH 7.4. Brains were dissected, postfixed for 2 hr in the same fixative, rinsed in buffer, and cryoprotected in 30% sucrose. Coronal brain sections were cut with a freezing microtome and collected in serial order through the entire dLGN. For NeuN immunostaining the sections underwent a blocking step (10% horse serum and 0.3% Triton X-100 in PBS), followed by incubation with a mouse monoclonal primary antibody (1:500; Chemicon, Temecula, CA) for 16–24 hr at room temperature. Bound antibodies were detected by incubating sections with biotinylated horse anti-mouse IgG (1:200; Vector Laboratories, Burlingame, CA), followed by incubation in Vectastain ABC kit (1:100 solution; Vector) and nickel-enhanced diaminobenzidine reaction.
Stereological evaluation of neuronal survival
Full details of the cell-counting procedure are given in Caleo et al. (2002). We used a modified version of the “dissector” method called optical fractionator (Coggeshall and Lekan, 1996; West, 1999). All counts were performed according to a blind procedure. The analysis was performed using the Stereo Investigator software (Microbrightfield, Colchester, VT) and a Zeiss microscope. Serial sections through the dLGN were cut at the nominal depth of 50 μm and immunostained with the anti-NeuN antibody as described above. The actual section thickness after the immunohistochemical procedure ranged between 24 and 28 μm. Four equally spaced sections were randomly selected for counting. In each of these sections, the dLGN boundary was drawn at low magnification, and its area was measured to estimate the total volume of the nucleus. Immunopositive cells were counted using a 40× objective in three-dimensional counting boxes (80 × 80 × 20 μm) selected in a systematically random manner. Appropriate guard volumes (3 μm thick) were used to avoid artifacts at the surface of the sections. A number of fields ranging between 94 and 166 were sampled for each animal. The total number of stained cells was estimated by multiplying the mean number of cells per counting box by the ratio of the volume of the nucleus to the volume of the counting box. All estimations had a coefficient of error <0.11 (calculated according to Gundersen's formula) (Gundersen and Jensen, 1987). Survival was expressed as the percentage of NeuN-immunopositive cells counted on the lesioned side with respect to those present on the contralateral unlesioned side.
Statistical analysis
Differences between two groups have been assessed witht test. Differences between three groups were evaluated with one-way ANOVA followed by Tukey's test for data normally distributed, and with Kruskal–Wallis one-way ANOVA with Dunn's post hoctest for data non-normally distributed. Level of significance wasp < 0.05.
Results
Geniculate recordings
The dorsal surface of the geniculate was unambiguously identified in each microelectrode penetration by recording the characteristic optic tract swish activity evoked by flash stimulation of the contralateral eye. As the electrode was advanced progressively through the nucleus, RFs of single units were mapped onto a tangent screen by using hand-moved light spots of adjustable size. A typical progression of RF positions is schematically represented in Figure1B. As reported previously by Montero et al. (1968) and Reese and Jeffery (1983), advancement of the microelectrode in the dorsoventral direction corresponded to a downward shift in the visual field of the RF centers of single geniculate cells. VEP recordings were performed at a depth ranging between 400 and 700 μm from the dorsal surface of the nucleus, and at a location corresponding to single units driven by the contralateral eye and whose RFs were located within 60° from the vertical meridian and in the upper visual field.
An example of the waveform of steady-state VEPs recorded in the geniculate in response to gratings counterphased at 5 Hz is shown in Figure 1C. The waveform is approximately sinusoidal and has a temporal periodicity twice the stimulus temporal frequency, in keeping with the typical behavior of the pattern-reversal VEP. The VEP response is abolished completely by the stereotaxic infusion of 10 mm muscimol into the geniculate (n = 2 animals; data not shown), thus confirming the postsynaptic origin of the field potential record. Figure1D reports the dependence of VEP amplitude on stimulus position in the visual field. From such data and our RF mapping in the same penetrations (Fig. 1B), we determined that our VEP response summates the activity of neurons located within a radius of ∼200–250 μm from the microelectrode tip position (n = 4 normal animals) (Fig.1D and legend).
Removal of the corticofugal input per se does not alter VEP responses in the geniculate
Visual cortex ablation deprives the geniculate of its largest afferent pathway originating in cortical layer VI. Thus, an evaluation of the changes in geniculate physiology after visual cortex lesion might potentially include an effect attributable to simple elimination of the cortical feedback to the dLGN. To identify possible alterations in VEPs caused by disconnection of the corticofugal loop, we have compared VEP responses before and immediately after a complete visual cortex lesion. In five animals, contrast threshold, visual acuity, temporal resolution, signal-to-noise ratio, and response latency were measured initially by intrageniculate VEP recordings. The microelectrode was then withdrawn, and the ipsilateral visual cortex (areas 17, 18, and 18a) was removed completely by aspiration. The recording electrode was then reinserted into the brain to reach the exact same position within the dLGN, and the physiological measures were repeated within a few hours of the cortical damage. Representative results of these experiments are reported in Figure2 for both contrast threshold and visual acuity determinations. The two graphs report the dependence of VEP amplitude on spatial frequency and contrast of the visual stimulus. A progressive decline in the field potential amplitude is observed by progressively increasing spatial frequency of the stimulus and reducing its contrast. The lowest contrast value and the highest spatial frequency where a reliable response could still be obtained were 4% and 0.9 c/deg, respectively, in this animal (Fig.2A,B, arrows). It is clear from these examples that neither spatial resolution nor contrast sensitivity is affected by acute visual cortex ablation. On average, geniculate acuity after lesion was 0.87 ± 0.03 (SE) c/deg and not significantly different from the normal value of 0.91 ± 0.04 (SE) c/deg estimated in untreated animals (t test,p = 0.6). Similarly, contrast threshold was 5.3 ± 1.3% (SE) after acute visual cortex ablation and virtually identical to the value obtained in normal animals [5.7 ± 0.6% (SE);t test, p = 0.74]. Other tested parameters (signal-to-noise ratio, median = 4.9 and 25–75% interquartile ranges, 4.3–8; temporal resolution, 12 ± 0.5 Hz; response latency, 47 ± 29 msec) were also within the normal range. We conclude that our physiological parameters reflect geniculate activity independent of the integrity of the corticofugal input.
Fig. 2.
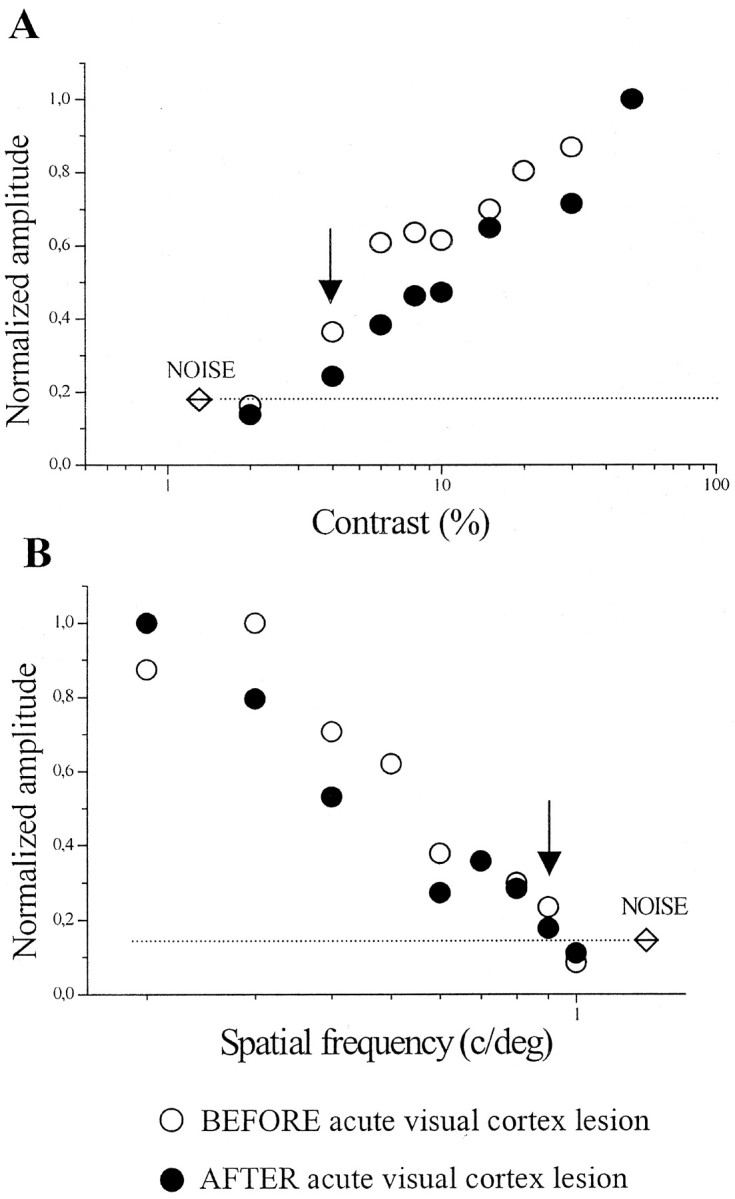
Effects of acute visual cortex lesion on contrast threshold and visual acuity. A, Variation of VEP amplitude with contrast of the stimulus grating. Eachpoint has been obtained by averaging data from three measures. An identical contrast threshold (last point above noise level; indicated by an arrow) is obtained in the same animal before (○) and 2 hr after (●) a complete ablation of the occipital cortex. Visual stimulus: horizontal sine wave grating of variable contrast, reversed sinusoidally at 4 Hz, spatial frequency 0.1 c/deg. B, VEP amplitude as a function of spatial frequency for a normal geniculate (○) and the same geniculate 2 hr after (●) removal of the cortex. Both curves reach the noise level at 1 c/deg. Visual stimulus: horizontal sine wave grating of variable spatial frequency, reversed sinusoidally at 4 Hz, contrast 90%.
Electrophysiological changes precede neuronal loss: neuronal numbers do not predict functional performance
We have evaluated the time course of the changes in geniculate physiology induced by visual cortex ablation to determine whether geniculate dysfunction precedes the anatomical loss of neurons. It is reported in the literature that after visual cortex ablation in adult rodents, cell death in the dLGN ensues after a delay period of 3 d (Agarwala and Kalil, 1998). We have confirmed these findings using unbiased stereological techniques. Three days after lesion, the percentage of NeuN-positive cells counted in the lesioned geniculate was 99.1% (±10.2% SE) of those present on the contralateral unoperated side (n = 5 rats) (Fig.3A–C). Despite an unaltered number of neurons, VEP recordings in these animals revealed striking changes in physiology. As shown in Figure 3, D andE, respectively, a consistent increase in contrast threshold and a reduction of visual acuity could be observed. Contrast threshold was 16.3 ± 2.4% at 3 d and significantly increased with respect to normal (t test, p < 0.001). Geniculate acuity was also significantly impaired (t test;p < 0.001). Other measured parameters such as signal-to-noise ratio, temporal resolution, and response latency were unaffected, however. Median signal-to-noise ratio was 5.3 (25–75%; interquartile ranges, 3.9–10.7) and undistinguishable from normal (Mann–Whitney rank sum test; p = 0.3). High temporal frequency cutoff (12.9 ± 0.4 Hz) and latency values (48 ± 4 msec) were also superimposable on those of normal control animals (t test; p = 0.82 and p = 0.85, respectively). These data indicate that specific alterations in response properties precede the death of the axotomized geniculate neurons. Moreover, the data demonstrate that normal neuron number does not necessarily translate into intact function. These data emphasize the importance of physiological assays in assessing the efficacy of neuroprotective strategies (Dumas and Sapolsky, 2001).
Fig. 3.

Early physiological changes precede the loss of geniculate neurons. A, B, Coronal sections through the geniculate immunostained for neurons using anti-NeuN antibodies. The geniculate of an animal in which the ipsilateral visual cortex was ablated 3 d earlier (B) is grossly normal and not readily distinguishable from the geniculate of an intact animal (A). D, Dorsal; L, lateral. Scale bar, 200 μm. C, Stereological quantification of neuronal survival 3 d after lesion. The histogram represents mean ± SE of the percentage of neurons counted on the lesioned side with respect to those present in the contralateral, intact dLGN (n = 5 rats).D, E, Summary of contrast sensitivity (D) and visual acuity data (E) in normal rats and rats recorded 3 d after visual cortex lesion. Each circle represents the value obtained in one animal. Triangles indicate the mean. Error bars indicate SE and, when not seen, are within the symbol.
Anterograde transport of radio-iodinated BDNF
Our previous studies have shown rapid effects in the lateral geniculate nucleus and superior colliculus after injections of microgram amounts of BDNF in the adult rat eye (Caleo et al., 2000), and small amounts of retinal BDNF are known to be transported selectively from the eye to their retinal targets in the early postnatal rat brain (Spalding et al., 2002). However, the selectivity of axonal transport, efficiency, and the amounts transported after pharmacological doses of BDNF are not known. Therefore, we measured the amounts of BDNF transported from the adult rat eye by quantifying the spread and transport efficiency of radiolabeled BDNF.
The amount of radioactivity remaining in the injected eye was 15 million cpm, amounting to ∼150 ng, or 15% of the estimated 1 μg injected. This may reflect expected loss of protein attributable to diffusion, leakage, and turnover in the eye within the 6 hr period after injection. The amount of radioactivity in the left (contralateral) eye was negligible, with 9900 cpm or 0.066% of the amount injected into the right eye, indicating that there was very little systemic leakage. The counts per minute in the right optic nerve (10 mm length) were 550 cpm; those in the left optic nerve (10 mm length) were 18 cpm. The radioactivity in the right olfactory bulb was 73 cpm, and in the left olfactory bulb it was 87 cpm. The amount of radioactivity in the right forebrain (including the dLGN) was 1038 cpm, and in the left forebrain (including the dLGN) it was 2137 cpm. The dissected left superior colliculus contained 388 cpm, and the right superior colliculus contained 44 cpm. As controls, the inferior colliculi were measured; they contained 25 cpm (right) and 32 cpm (left). After further dehydration in 100% ethanol, the amounts of radioactivity decreased by ∼30%, e.g., in the left superior colliculus from 388 to 280 cpm, and similar reductions were seen in all tissues, including those with background label.
These data allow the following conclusions. (1) A minimal amount of ∼2000 cpm (∼20 pg BDNF protein) was transported specifically within 6 hr from the eye to the brain (including optic nerve, dLGN, and superior colliculus). This is comparable with the amounts of BDNF transported in previous studies in which only 10–100 ng BDNF (10- to 100-fold lesser amount) was injected, yet 8–80 pg accumulated in the optic tectum alone (von Bartheld et al., 1996) or in the entire brain (Spalding et al., 2002). This may indicate that the transport capacity of BDNF saturates with ∼50–100 ng of BDNF injected in the eye. (2) Even with large amounts of BDNF (1 μg instead of 10–100 ng) injected in the eye, there is very little, if any, diffusion to adjacent structures such as the contralateral eye, contralateral optic nerve, or ipsilateral olfactory bulb, and the background in the brain was relatively low. (3) The large majority of the transported radioactivity was apparently internalized protein rather than free iodine or small degradation products, because most of the radioactivity did not wash out in the dehydration step.
These findings confirm efficient internalization of BDNF in RGCs and anterograde transport of BDNF to retinorecipient structures in the adult rat. In addition, specificity of BDNF accumulation is not compromised by the delivery of microgram amounts of BDNF into the eye.
Neuroprotective effects of anterograde BDNF: anatomy
In a previous paper we showed that the intraocular delivery of BDNF reduces by 50% the number of pyknotic cells in the dLGN of neonatal rats subjected to visual cortex lesion (Caleo et al., 2000). Here we extend these results to adult animals, where geniculate cell death occurs over a more protracted time course. Two regimens of BDNF administration were tested. In the first protocol, BDNF (15 μg) was delivered bilaterally into the eye at days 0, 5, and 10 after the cortical ablation (n = 6 animals). In a second protocol, BDNF was given into both eyes immediately after the damage (n = 4). All animals were allowed to survive for 2 weeks after the lesion. At this time point, 36.5 ± 1.4% (SE) of the geniculate neurons were left in the injured dLGN of control uninjected animals (Fig. 4). As demonstrated previously, these spared cells are mainly inhibitory interneurons not projecting to the cortex (Al-Abdulla et al., 1998;Martin et al., 2001). One single bilateral administration of cytochromec at the time of the lesion was completely ineffective in altering the course of dLGN cell death (no significant difference in survival with respect to lesioned untreated rats; t test;p > 0.05). In contrast, BDNF delivery resulted in a visible increase in neuronal survival (Fig.4C,D). Indeed, both the single and the multiple BDNF administration produced a highly significant cell-saving effect (Kruskal–Wallis one way ANOVA, p = 0.002; post hoc Dunn's test, p < 0.05). The statistical analysis also indicates that one single BDNF dose is as effective as three BDNF injections in blocking cell death (post-ANOVA Dunn's test,p > 0.05). On average, 61.9 and 62.8% of the geniculate neurons survived in animals with three BDNF doses and one BDNF dose, respectively (Fig. 4E).
Fig. 4.

Intraocular administration of BDNF prevents the death of geniculate neurons. A–D, Coronal sections through the dLGN immunostained with anti-NeuN antibodies. At postoperative day 14, the geniculate of control lesioned animals (B) is shrunken, and the number of dLGN neurons is reduced dramatically with respect to normal (A). Many more neurons survive in animals with either three BDNF injections (C) or one single BDNF injection (D). D, Dorsal;L, lateral. Scale bar, 300 μm. E, Scatter plot showing survival data in the various experimental groups. For each animal, the total number of dLGN neurons has been estimated by unbiased stereology on the side ipsilateral to the lesion and on the contralateral control side. Each circle represents survival in one animal. The lesion group (left) includes both untreated lesioned rats and lesioned rats that received intravitreal injections of cytochrome c.Triangles indicate the mean value for each experimental group; error bars indicate SE and, when not seen, are within the symbol.
Neuroprotective effects of anterograde BDNF: physiology
All of the BDNF-treated and the uninjected lesioned animals were recorded at 2 weeks to evaluate functional properties in the injured geniculate. It was clear from these recordings that the physiological responses in the geniculate of control lesioned animals were dramatically altered and that the BDNF administration resulted in a substantial improvement of all the parameters tested. Representative examples of the physiological measures obtained in control and BDNF-injected rats are reported in Figure5. Figure 5A shows the contrast threshold curve in an uninjected lesioned animal. The VEP response decreases monotonically in amplitude with decreasing contrast and is at noise level for contrast values <30%. Figure 5Billustrates the dependence of VEP amplitude on stimulus contrast for a lesioned animal receiving a single BDNF dose at day 0. In this animal, a reliable response can still be obtained at 10% contrast. Figure 5,C and D, reports examples of visual acuity determinations. For the control lesioned animal, it is possible to evoke a response only for spatial frequencies in the range 0.1–0.3 c/deg (Fig. 5C). Even with maximum contrast (90%) and optimal frequency of alternation (4–6 Hz), no signal can be recorded for spatial frequencies beyond 0.3 c/deg. The results obtained in the BDNF-treated rats are dramatically different as shown in the representative example of Figure 5D. It can be seen that the spatial resolution is greatly improved, and the noise level is reached for spatial frequencies higher than 0.7 c/deg.
Fig. 5.

Typical contrast threshold and visual acuity curves in control lesioned (top) and lesioned (bottom) rats with a single injection of BDNF. In each graph, an arrow indicates the last point above noise level (marked by a dotted line) that was taken as the threshold in that animal. It is evident from these examples that both contrast threshold and spatial resolution are improved by the BDNF treatment.
The graphs of Figure 5 illustrate another difference between lesioned animals with and without BDNF treatment. It can be easily observed that the ratio between maximal amplitude and noise level (signal-to-noise ratio) tends to be lower in uninjected lesioned animals than in rats treated with BDNF. This difference is highly consistent and related to the absolute number of surviving geniculate neurons in each experimental group (see below and Discussion).
A summary of the physiological results collected in normal, control lesioned, and BDNF-injected lesioned rats is reported in Figure6. Because all of the physiological measures in the lesioned, cytochrome c-injected animals overlap with those of uninjected, lesioned animals (no significant difference; t test, p ≥ 0.27 for all comparisons), the data from these two groups have been pooled together. Similarly, there were no significant differences in the functional properties of animals with single and multiple BDNF injections (t test, p ≥ 0.25 for all parameters). Thus, data from the two BDNF-treated groups were also pooled.
Fig. 6.

Contrast threshold (A), visual acuity (B), signal-to-noise (C), and temporal resolution (D) in the various experimental groups. The control lesioned group (LES) includes lesioned, untreated animals and lesioned animals that received intraocular injections of cytochrome c. BDNF-treated group (LES+BDNF) pools data from animals with repeated or single doses of BDNF. In A, B, andD, single data points and mean ± SE are shown. InC, non-normally distributed signal-to-noise ratio data are summarized with a box chart. The horizontal lines in the box denote the 25th, 50th, and 75th percentile values. The error bars denote the 5th and 95th percentile values.
In the case of contrast sensitivity (Fig. 6A), control lesioned rats display a significantly higher threshold compared with both normal rats and BDNF-treated, lesioned animals (Kruskal– Wallis ANOVA, p < 0.001; post hoc Dunn's test, p < 0.05). However, values in the latter two groups do not differ significantly from each other (post-ANOVA Dunn's test, p > 0.05). Thus, intraocular BDNF treatment preserves a nearly normal contrast sensitivity in axotomized geniculate cells. Spatial resolution data are shown in Figure 6B. Geniculate acuity in the BDNF-injected rats is intermediate between the two clusters formed by normal animals and control lesions, being significantly different from both latter groups (one-way ANOVA, p < 0.001; post hocTukey test, p < 0.05). Signal-to-noise ratio (Fig.6C) was calculated for each animal and microelectrode track as the VEP amplitude under optimal stimulus conditions divided by the average VEP response with both eyes closed (see Materials and Methods). We found a median value of 5.25 in normal animals that dropped to 2.95 in control lesioned animals and reached 4.1 in lesioned animals treated with BDNF (Fig. 6C). Statistical testing demonstrates a significant decrease of the signal-to-noise ratio in the control lesioned group (Kruskal–Wallis ANOVA, p < 0.001;post hoc Dunn's test, normal and BDNF lesioned rats differ from control lesioned, p < 0.05), whereas normal rats and lesioned rats treated with BDNF do not show significant differences (post-ANOVA Dunn's test, p > 0.05). We also compared high temporal frequency cutoff values in the three experimental groups (Fig. 6D). In normal animals, the curve relating VEP amplitude to frequency of alternation of the stimulus grating shows a maximum at ∼4–6 Hz (data not shown). The field response decreases progressively with increasing temporal frequency to reach a mean cutoff of 12.9 ± 0.4 Hz (SE). ANOVA indicates that mean cutoff in control lesioned animals is lower than, but not significantly different from, normal animals and BDNF-injected lesioned rats (one-way ANOVA,p = 0.14) (Fig. 6D).
We finally measured response latency in the different groups by recording transient VEPs in response to abrupt reversal (0.5 Hz) of a square-wave stimulus grating. In both normal and lesioned rats, the VEP waveform consists of an early small negative component peaking at ∼50 msec (that we have called N1) and two later waves, P1 and N2, with latencies of ∼100 and 200 msec, respectively (Fig.7A). We found that the latency of each component was not affected by either lesion or BDNF treatment (Fig. 7B–D).
Fig. 7.

A, Representative example of a transient VEP recorded in the dLGN contralateral to the stimulated eye of a normal animal showing three major waves (N1,P1, and N2) with different latencies. The visual stimulus was a horizontal square-wave grating (spatial frequency 0.1 c/deg, 90% contrast, mean luminance 15 cd/m2, 75° × 96° field size) reversed in contrast at 0.5 Hz. B–D, The histograms represent mean and SE of the latency of each major VEP component in the various animal groups. Latencies do not differ significantly between the groups (one-way ANOVA; N1 and P1 latency, p = 0.6; N2 latency, p = 0.99). For each histogram,n = 7–8 rats.
Discussion
An extensive body of work has established that BDNF is a powerful survival factor for several populations of damaged central neurons (Morse et al., 1993; Mansour-Robaey et al., 1994; Klocker et al., 1998;Hammond et al., 1999). However, whether the neuroprotective actions of BDNF also translate into sparing of function has remained unknown. To assess protection from dysfunction one needs a model of neurodegeneration in which physiological measurements can be performed reliably. Here we have chosen the degeneration of geniculate neurons as a model system to evaluate neuronal rescue and sparing of function after administration of BDNF. Our main finding is that BDNF delivery preserves for up to 2 weeks the normal physiological responses of geniculate cells after axotomy.
Methodological considerations
The physiological responses of dLGN neurons have been measured via VEPs, which have proven to be a very sensitive tool for evaluating visual function in both normal and pathological conditions (Fagiolini et al., 1997; Pizzorusso et al., 1997; Porciatti et al., 1999, 2000). VEPs represent the integrated response of a pool of geniculate neurons. We have shown that infusion of muscimol (an agonist of GABAA receptors) into the geniculate completely eliminates all VEP responses, indicating the postsynaptic origin of the signal recorded. The choice of using VEPs for testing geniculate function is justified by the fact that electrophysiological changes at the level of VEPs mirror closely alterations in single-cell response properties [see for example Fagiolini et al. (1997); compare data fromHuang et al. (1999) and Hanover et al. (1999)]. We have not analyzed the responses of single geniculate units after cortical ablation, because this proved to be extremely low yield in the degenerating dLGN, whereas single-unit analysis requires extensive sampling because of the great number of functionally distinct types of cells present in the rat dLGN (Fukuda et al., 1979; Hale et al., 1979).
Any change in geniculate physiology from removal of the visual cortex might include an effect induced by the simple disconnection of the massive cortical afferent pathway to the dLGN. The functional effects of interrupting the corticofugal loop are subtle and still controversial (Molotchnikoff et al., 1984; Murphy and Sillito, 1987;Marrocco et al., 1996; Rivadulla et al., 2002). We have demonstrated that all of our physiological measures are independent of the integrity of the cortical feedback (Fig. 2). For this experiment we have used an acute lesion protocol instead of a pharmacological silencing of the cortical neurons. In fact, it was important to block effectively all inputs from an area of visual cortex comparable with that ablated in the experimental group (a surface of ∼24 mm2 of cortical tissue). The finding that after acute damage all the measured parameters are within the normal range allows us to conclude that neither the corticofugal input nor rapid, axotomy-induced changes in cell response properties affect the VEP signal.
Early dysfunction of axotomized geniculate cells
Unequivocal physiological changes were observed in the geniculate ipsilateral to the lesion 3 d postoperatively. At this time, no degeneration of neurons has occurred yet. Therefore, our functional analysis detects early disturbances that are later followed by neuronal death. In particular, a consistent impairment in visual acuity and contrast sensitivity could be detected. This may be explained by an early dysfunction of the geniculate units tuned to the high spatial frequency and low contrast range, respectively, that represent only a minor fraction of the pool of geniculate cells (Lennie and Perry, 1981).
The finding of a precocious functional change in the absence of manifest signs of cell death has another important implication. It demonstrates that maintenance of function cannot be inferred from normal neuron number. Therefore, anatomical rescue from death does not guarantee sparing at the physiological level. It follows that the criteria for demonstrating neuroprotection by any therapeutic intervention must include functional endpoints (Dumas and Sapolsky, 2001).
Neuroprotective actions of BDNF
We have shown previously that the intravitreal administration of BDNF reduces cell death in the geniculate of cortically damaged P7 rats (Caleo et al., 2000). In the same paper we have shown that this effect of BDNF depends on anterograde axonal transport but not on local BDNF effects in the retina, i.e., the induction of a secondary trophic signal for geniculate cells (Caleo et al., 2000). The present data indicate that the same mechanisms of BDNF neuroprotection operate in the adult animal. Radiolabeled BDNF is rapidly taken up by retinal ganglion cells and transported anterogradely to postsynaptic neurons in retinal target fields. Systemic diffusion of BDNF throughout the brain was minimal, ruling out the possibility that the effects of BDNF on dLGN neurons are attained via systemic leakage. Exogenous neurotrophins enter the anterograde axonal transport pathway presumably after passage through the Golgi system and packaging in large dense-core vesicles (Butowt and von Bartheld, 2001).
Using unbiased stereology, we have shown that ∼80% more geniculate neurons survive at 2 weeks in animals treated with BDNF with respect to control lesions. Interestingly, there were no significant differences in survival between one single injection and three BDNF injections spaced by 5 d. The failure to achieve enhanced survival through the provision of additional BDNF doses has been reported in previous studies (Mansour-Robaey et al., 1994; Vejsada et al., 1994; Chen and Weber, 2001) and may be explained by at least two distinct mechanisms. First, axotomy rapidly and dramatically downregulates cell responsiveness to neurotrophic factor stimulation, probably by reducing the levels of trophic receptors at the plasma membrane (Meyer-Franke et al., 1998; Shen et al., 1999). Second, exposure of central neurons to BDNF results in a decrease of TrkB mRNA and protein levels, therefore contributing to the reduction of trophic responsiveness (Frank et al., 1996; Knusel et al., 1997; Sommerfeld et al., 2000). Whether BDNF delivered to the dLGN via a retrograde route from the cortex is able to rescue axotomized geniculate neurons was not determined in the present study. Another TrkB ligand, NT-4, is more likely involved in retrograde support of geniculate cells (Riddle et al., 1995).
The most novel aspect of this study is the demonstration of an amelioration of physiological deficits after injury and BDNF treatment. There are many examples in the literature in which protection from death is not accompanied by maintenance of function, as assessed at the most integrative level of behavior (Dumas and Sapolsky, 2001). For example, after an excitotoxic insult to the hippocampus, overexpression of either the anti-apoptotic protein Bcl-2 or the glucose transporter Glut-1 reduces neuronal loss to the same extent. However, only Glut-1 preserves hippocampal function as determined by spatial memory tests (McLaughlin et al., 2000). Similarly, infusion of caspase inhibitors prevents neuronal death in the hippocampus after traumatic brain injury but does not spare maze performance (Clark et al., 2000). Thus, preservation of function does not necessarily follow rescue at the anatomical level, and a necessary step in evaluating a neuroprotective strategy is to assess its physiological consequences. This is particularly true for BDNF, which in addition to its trophic role has been reported to act as a potent neuroexcitant in various brain areas (Kafitz et al., 1999) and may influence normal activity patterns (Lodovichi et al., 2000).
We have shown that contrast sensitivity, visual acuity, and signal-to-noise ratio are all dramatically impaired in control lesioned rats 2 weeks after surgery. In lesioned BDNF-treated rats, these parameters were much less impaired. The maintenance of a nearly normal spatial resolution and contrast threshold after BDNF treatment is likely to be ascribed to the sparing of geniculate cells that have small receptive fields and are tuned to low contrast values. Signal-to-noise ratio, which represents an index of the quality of the visual response, was also preserved by BDNF. Interestingly, the decrease in the signal-to-noise ratio that we observed experimentally in the control lesioned animals corresponds to that predicted theoretically on the assumption that its value depends on the square root of the number of neurons recruited by the visual stimulus. That is, taking into account a signal-to-noise ratio of 5.25 in normal animals, and considering a reduction to 36.5% of normal in the number of geniculate neurons, one ends up with a predicted signal-to-noise value of 3.2 for the lesioned animals that is in close agreement with the median measured value of 2.95. When the same calculation is applied to BDNF-treated animals, in which ∼62% of the geniculate neurons survive, a predicted ratio of 4.1 is obtained that perfectly matches the experimental median value. These considerations add some weight to the conclusion that most of the neurons rescued by BDNF are also functionally spared. Finally, it may appear surprising that the latency of the visual response was not affected by the massive death of dLGN neurons. However, in the rat, retinal fibers contact both geniculate relay neurons and interneurons (Sefton and Dreher, 1995), which are not affected by visual cortex injury (Al-Abdulla et al., 1998; Martin et al., 2001). Therefore, the presence of an intact synaptic input from the retina to geniculate interneurons may explain unaltered latency of visual drive in the dLGN.
The maintenance of at least some specific physiological parameters in injured central neurons after anterograde provision of BDNF suggests possible therapeutic applications of BDNF. It has been proposed that specific defects in the trafficking of neurotrophins within the brain are implicated in the pathogenesis of neurodegenerative disorders (Mufson et al., 1999; Cooper et al., 2001). For example, a shortage in the anterograde supply of BDNF from the cortex to striatal targets may lead to striatal cell death in Huntington's disease (Zuccato et al., 2001). An exogenous supply of trophic substances may compensate for the loss of endogenously transported factors and therefore have therapeutic potential in the diseased brain (Mufson et al., 1999). This strategy obviously requires a deeper understanding of the mechanisms involved in uptake, transport, and release of trophic factors for targeting them to the relevant destinations (von Bartheld et al., 2001).
Footnotes
This work was supported by a grant (P48/2000) from the International Institute for Research in Paraplegia (Geneva, Switzerland) on behalf of the Sandoz Family Foundation, and National Institutes of Health Grant TW 05700. Regeneron Pharmaceuticals (Tarrytown, NY) kindly provided recombinant human BDNF. We thank D. O. Frost, A. Cellerino, and T. Pizzorusso for critical reading of this manuscript. We are grateful to C. Orsini for writing the programs for acquisition and analysis of electrophysiological data, and to G. C. Cappagli and C. Palla for excellent technical assistance.
Correspondence should be addressed to Matteo Caleo, Istituto di Neuroscienze del Consiglio Nazionale delle Ricerche, via G. Moruzzi 1, 56100 Pisa, Italy. E-mail: caleo@in.pi.cnr.it.
References
- 1.Agarwala S, Kalil RE. Axotomy-induced neuronal death and reactive astrogliosis in the lateral geniculate nucleus following a lesion of the visual cortex in the rat. J Comp Neurol. 1998;392:252–263. doi: 10.1002/(sici)1096-9861(19980309)392:2<252::aid-cne7>3.0.co;2-1. [DOI] [PubMed] [Google Scholar]
- 2.Al-Abdulla NA, Portera-Cailliau C, Martin LJ. Occipital cortex ablation in adult rat causes retrograde neuronal death in the lateral geniculate nucleus that resembles apoptosis. Neuroscience. 1998;86:191–209. doi: 10.1016/s0306-4522(98)00014-1. [DOI] [PubMed] [Google Scholar]
- 3.Blesch A, Grill RJ, Tuszynski MH. Neurotrophin gene therapy in CNS models of trauma and degeneration. Prog Brain Res. 1998;117:473–484. doi: 10.1016/s0079-6123(08)64033-9. [DOI] [PubMed] [Google Scholar]
- 4.Butowt R, von Bartheld CS. Sorting of internalized neurotrophins into an endocytic transcytosis pathway via the Golgi system: ultrastructural analysis in retinal ganglion cells. J Neurosci. 2001;21:8915–8930. doi: 10.1523/JNEUROSCI.21-22-08915.2001. [DOI] [PMC free article] [PubMed] [Google Scholar]
- 5.Caleo M, Menna E, Chierzi S, Cenni MC, Maffei L. Brain-derived neurotrophic factor is an anterograde survival factor in the rat visual system. Curr Biol. 2000;10:1155–1161. doi: 10.1016/s0960-9822(00)00713-2. [DOI] [PubMed] [Google Scholar]
- 6.Caleo M, Cenni MC, Costa M, Menna E, Zentilin L, Giadrossi S, Giacca M, Maffei L. Expression of BCL-2 via adeno-associated virus vectors rescues thalamic neurons after visual cortex lesion in the adult rat. Eur J Neurosci. 2002;15:1271–1277. doi: 10.1046/j.1460-9568.2002.01962.x. [DOI] [PubMed] [Google Scholar]
- 7.Chen H, Weber AJ. BDNF enhances retinal ganglion cell survival in cats with optic nerve damage. Invest Ophthalmol Vis Sci. 2001;42:966–974. [PubMed] [Google Scholar]
- 8.Cheng L, Sapieha P, Kittlerova P, Hauswirth WW, Di Polo A. TrkB gene transfer protects retinal ganglion cells from axotomy-induced death in vivo. J Neurosci. 2002;22:3977–3986. doi: 10.1523/JNEUROSCI.22-10-03977.2002. [DOI] [PMC free article] [PubMed] [Google Scholar]
- 9.Clark RS, Kochanek PM, Watkins SC, Chen M, Dixon CE, Seidberg NA, Melick J, Loeffert JE, Nathaniel PD, Jin KL, Graham SH. Caspase-3 mediated neuronal death after traumatic brain injury in rats. J Neurochem. 2000;74:740–753. doi: 10.1046/j.1471-4159.2000.740740.x. [DOI] [PubMed] [Google Scholar]
- 10.Coggeshall RE, Lekan HA. Methods for determining numbers of cells and synapses: a case for more uniform standards of review. J Comp Neurol. 1996;364:6–15. doi: 10.1002/(SICI)1096-9861(19960101)364:1<6::AID-CNE2>3.0.CO;2-9. [DOI] [PubMed] [Google Scholar]
- 11.Cooper JD, Salehi A, Delcroix JD, Howe CL, Belichenko PV, Chua-Couzens J, Kilbridge JF, Carlson EJ, Epstein CJ, Mobley WC. Failed retrograde transport of NGF in a mouse model of Down's syndrome: reversal of cholinergic neurodegenerative phenotypes following NGF infusion. Proc Natl Acad Sci USA. 2001;98:10439–10444. doi: 10.1073/pnas.181219298. [DOI] [PMC free article] [PubMed] [Google Scholar]
- 12.Cowey A, Stoerig P, Williams C. Variance in transneuronal retrograde ganglion cell degeneration in monkeys after removal of striate cortex: effects of size of the cortical lesion. Vision Res. 1999;39:3642–3652. doi: 10.1016/s0042-6989(99)00097-8. [DOI] [PubMed] [Google Scholar]
- 13.Dumas TC, Sapolsky RM. Gene therapy against neurological insults: sparing neurons versus sparing function. Trends Neurosci. 2001;24:695–700. doi: 10.1016/s0166-2236(00)01956-1. [DOI] [PubMed] [Google Scholar]
- 14.Fagiolini M, Pizzorusso T, Porciatti V, Cenni M, Maffei L. Transplant of Schwann cells allows normal development of the visual cortex of dark-reared rats. Eur J Neurosci. 1997;9:102–112. doi: 10.1111/j.1460-9568.1997.tb01358.x. [DOI] [PubMed] [Google Scholar]
- 15.Frank L, Ventimiglia R, Anderson K, Lindsay RM, Rudge JS. BDNF down-regulates neurotrophin responsiveness, TrkB protein and TrkB mRNA levels in cultured rat hippocampal neurons. Eur J Neurosci. 1996;8:1220–1230. doi: 10.1111/j.1460-9568.1996.tb01290.x. [DOI] [PubMed] [Google Scholar]
- 16.Fukuda Y, Sumitomo I, Sugitani M, Iwama K. Receptive-field properties of cells in the dorsal part of the albino rat's lateral geniculate nucleus. Jpn J Physiol. 1979;29:283–307. doi: 10.2170/jjphysiol.29.283. [DOI] [PubMed] [Google Scholar]
- 17.Gundersen HJ, Jensen B. The efficiency of systematic sampling and its prediction. J Microsc. 1987;147:229–263. doi: 10.1111/j.1365-2818.1987.tb02837.x. [DOI] [PubMed] [Google Scholar]
- 18.Hale PT, Sefton AJ, Dreher B. A correlation of receptive field properties with conduction velocity of cells in the rat's retino-geniculo-cortical pathway. Exp Brain Res. 1979;35:425–442. doi: 10.1007/BF00236762. [DOI] [PubMed] [Google Scholar]
- 19.Hammond EN, Tetzlaff W, Mestres P, Giehl KM. BDNF, but not NT-3, promotes long-term survival of axotomized adult rat corticospinal neurons in vivo. NeuroReport. 1999;10:2671–2675. doi: 10.1097/00001756-199908200-00043. [DOI] [PubMed] [Google Scholar]
- 20. Hanover JL, Huang ZJ, Tonegawa S, Stryker MP. Brain-derived neurotrophic factor overexpression induces precocious critical period in mouse visual cortex. J Neurosci 19 1999. RC40(1–5). [DOI] [PMC free article] [PubMed] [Google Scholar]
- 21.Hefti F. Nerve growth factor promotes survival of septal cholinergic neurons after fimbrial transections. J Neurosci. 1986;6:2155–2162. doi: 10.1523/JNEUROSCI.06-08-02155.1986. [DOI] [PMC free article] [PubMed] [Google Scholar]
- 22.Huang ZJ, Kirkwood A, Pizzorusso T, Porciatti V, Morales B, Bear MF, Maffei L, Tonegawa S. BDNF regulates the maturation of inhibition and the critical period of plasticity in mouse visual cortex. Cell. 1999;98:739–755. doi: 10.1016/s0092-8674(00)81509-3. [DOI] [PubMed] [Google Scholar]
- 23.Kafitz KW, Rose CR, Thoenen H, Konnerth A. Neurotrophin-evoked rapid excitation through TrkB receptors. Nature. 1999;401:918–921. doi: 10.1038/44847. [DOI] [PubMed] [Google Scholar]
- 24.Kaplan DR, Miller FD. Neurotrophin signal transduction in the nervous system. Curr Opin Neurobiol. 2000;10:381–391. doi: 10.1016/s0959-4388(00)00092-1. [DOI] [PubMed] [Google Scholar]
- 25.Klocker N, Cellerino A, Bahr M. Free radical scavenging and inhibition of nitric oxide synthase potentiates the neurotrophic effects of brain-derived neurotrophic factor on axotomized retinal ganglion cells in vivo. J Neurosci. 1998;18:1038–1046. doi: 10.1523/JNEUROSCI.18-03-01038.1998. [DOI] [PMC free article] [PubMed] [Google Scholar]
- 26.Knusel B, Gao H, Okazaki T, Yoshida T, Mori N, Hefti F, Kaplan DR. Ligand-induced down-regulation of Trk messenger RNA, protein and tyrosine phosphorylation in rat cortical neurons. Neuroscience. 1997;78:851–862. doi: 10.1016/s0306-4522(96)00616-1. [DOI] [PubMed] [Google Scholar]
- 27.Kordower JH, Isacson O, Leventhal L, Emerich DF. Cellular delivery of trophic factors for the treatment of Huntington's disease: is neuroprotection possible? Prog Brain Res. 2000;127:414–430. [PubMed] [Google Scholar]
- 28.Lennie P, Perry VH. Spatial contrast sensitivity of cells in the lateral geniculate nucleus of the rat. J Physiol (Lond) 1981;315:69–79. doi: 10.1113/jphysiol.1981.sp013733. [DOI] [PMC free article] [PubMed] [Google Scholar]
- 29.Lewin GR, Barde YA. Physiology of the neurotrophins. Annu Rev Neurosci. 1996;19:289–317. doi: 10.1146/annurev.ne.19.030196.001445. [DOI] [PubMed] [Google Scholar]
- 30.Lodovichi C, Berardi N, Pizzorusso T, Maffei L. Effects of neurotrophins on cortical plasticity: same or different? J Neurosci. 2000;20:2155–2165. doi: 10.1523/JNEUROSCI.20-06-02155.2000. [DOI] [PMC free article] [PubMed] [Google Scholar]
- 31.Mansour-Robaey S, Clarke DB, Wang YC, Bray GM, Aguayo AJ. Effects of ocular injury and administration of brain-derived neurotrophic factor on survival and regrowth of axotomized retinal ganglion cells. Proc Natl Acad Sci USA. 1994;91:1632–1636. doi: 10.1073/pnas.91.5.1632. [DOI] [PMC free article] [PubMed] [Google Scholar]
- 32.Marrocco RT, McClurkin JW, Alkire MT. The influence of the visual cortex on the spatiotemporal response properties of lateral geniculate nucleus cells. Brain Res. 1996;737:110–118. doi: 10.1016/0006-8993(96)00660-9. [DOI] [PubMed] [Google Scholar]
- 33.Martin LJ, Kaiser A, Yu JW, Natale JE, Al-Abdulla NA. Injury-induced apoptosis of neurons in adult brain is mediated by p53-dependent and p53-independent pathways and requires Bax. J Comp Neurol. 2001;433:299–311. doi: 10.1002/cne.1141. [DOI] [PubMed] [Google Scholar]
- 34.McLaughlin J, Roozendaal B, Dumas T, Gupta A, Ajilore O, Hsieh J, Ho D, Lawrence M, McGaugh JL, Sapolsky R. Sparing of neuronal function postseizure with gene therapy. Proc Natl Acad Sci USA. 2000;97:12804–12809. doi: 10.1073/pnas.210350097. [DOI] [PMC free article] [PubMed] [Google Scholar]
- 35.Meyer-Franke A, Wilkinson GA, Kruttgen A, Hu M, Munro E, Hanson MG, Jr, Reichardt LF, Barres BA. Depolarization and cAMP elevation rapidly recruit TrkB to the plasma membrane of CNS neurons. Neuron. 1998;21:681–693. doi: 10.1016/s0896-6273(00)80586-3. [DOI] [PMC free article] [PubMed] [Google Scholar]
- 36.Molotchnikoff S, Tremblay F, Lepore F. The role of the visual cortex in response properties of lateral geniculate cells in rats. Exp Brain Res. 1984;53:223–232. doi: 10.1007/BF00238152. [DOI] [PubMed] [Google Scholar]
- 37.Montero VM, Brugge JF, Beitel RE. Relation of the visual field to the lateral geniculate body of the albino rat. J Neurophysiol. 1968;31:221–236. doi: 10.1152/jn.1968.31.2.221. [DOI] [PubMed] [Google Scholar]
- 38.Morse JK, Wiegand SJ, Anderson K, You Y, Cai N, Carnahan J, Miller J, DiStefano PS, Altar CA, Lindsay RM, Alderson RF. Brain-derived neurotrophic factor (BDNF) prevents the degeneration of medial septal cholinergic neurons following fimbria transection. J Neurosci. 1993;13:4146–4156. doi: 10.1523/JNEUROSCI.13-10-04146.1993. [DOI] [PMC free article] [PubMed] [Google Scholar]
- 39.Mufson EJ, Kroin JS, Sendera TJ, Sobreviela T. Distribution and retrograde transport of trophic factors in the central nervous system: functional implications for the treatment of neurodegenerative diseases. Prog Neurobiol. 1999;57:451–484. doi: 10.1016/s0301-0082(98)00059-8. [DOI] [PubMed] [Google Scholar]
- 40.Murphy PC, Sillito AM. Corticofugal feedback influences the generation of length tuning in the visual pathway. Nature. 1987;329:727–729. doi: 10.1038/329727a0. [DOI] [PubMed] [Google Scholar]
- 41.Patapoutian A, Reichardt LF. Trk receptors: mediators of neurotrophin action. Curr Opin Neurobiol. 2001;11:272–280. doi: 10.1016/s0959-4388(00)00208-7. [DOI] [PubMed] [Google Scholar]
- 42.Perry VH, Cowey A. The effects of unilateral cortical and tectal lesions on retinal ganglion cells in rats. Exp Brain Res. 1979;35:85–95. doi: 10.1007/BF00236786. [DOI] [PubMed] [Google Scholar]
- 43.Pizzorusso T, Fagiolini M, Porciatti V, Maffei L. Temporal aspects of contrast visual evoked potentials in the pigmented rat: effect of dark rearing. Vision Res. 1997;37:389–395. doi: 10.1016/s0042-6989(96)00172-1. [DOI] [PubMed] [Google Scholar]
- 44.Porciatti V, Pizzorusso T, Maffei L. The visual physiology of the wild type mouse determined with pattern VEPs. Vision Res. 1999;39:3071–3081. doi: 10.1016/s0042-6989(99)00022-x. [DOI] [PubMed] [Google Scholar]
- 45.Porciatti V, Bonanni P, Fiorentini A, Guerrini R. Lack of cortical contrast gain control in human photosensitive epilepsy. Nat Neurosci. 2000;3:259–263. doi: 10.1038/72972. [DOI] [PubMed] [Google Scholar]
- 46.Reese BE, Jeffery G. Crossed and uncrossed visual topography in dorsal lateral geniculate nucleus of the pigmented rat. J Neurophysiol. 1983;49:877–885. doi: 10.1152/jn.1983.49.4.877. [DOI] [PubMed] [Google Scholar]
- 47.Riddle DR, Lo DC, Katz LC. NT-4 mediated rescue of lateral geniculate neurons from effects of monocular deprivation. Nature. 1995;378:189–191. doi: 10.1038/378189a0. [DOI] [PubMed] [Google Scholar]
- 48.Rivadulla C, Martinez LM, Varela C, Cudeiro J. Completing the corticofugal loop: a visual role for the corticogeniculate type 1 metabotropic glutamate receptor. J Neurosci. 2002;22:2956–2962. doi: 10.1523/JNEUROSCI.22-07-02956.2002. [DOI] [PMC free article] [PubMed] [Google Scholar]
- 49.Sefton AJ, Dreher B. Visual system. In: Paxinos G, editor. The rat nervous system. Academic; New York: 1995. pp. 833–898. [Google Scholar]
- 50.Shen S, Wiemelt AP, McMorris FA, Barres BA. Retinal ganglion cells lose trophic responsiveness after axotomy. Neuron. 1999;23:285–295. doi: 10.1016/s0896-6273(00)80780-1. [DOI] [PubMed] [Google Scholar]
- 51.Sommerfeld MT, Schweigreiter R, Barde YA, Hoppe E. Down-regulation of the neurotrophin receptor TrkB following ligand binding. Evidence for an involvement of the proteasome and differential regulation of TrkA and TrkB. J Biol Chem. 2000;275:8982–8990. doi: 10.1074/jbc.275.12.8982. [DOI] [PubMed] [Google Scholar]
- 52.Spalding KL, Tan MM, Hendry IA, Harvey AR. Anterograde transport and trophic actions of BDNF and NT-4/5 in the developing rat visual system. Mol Cell Neurosci. 2002;19:485–500. doi: 10.1006/mcne.2001.1097. [DOI] [PubMed] [Google Scholar]
- 53.Tuszynski MH, Roberts J, Senut MC, U HS, Gage FH. Gene therapy in the adult primate brain: intraparenchymal grafts of cells genetically modified to produce nerve growth factor prevent cholinergic neuronal degeneration. Gene Ther. 1996;3:305–314. [PubMed] [Google Scholar]
- 54.Vejsada R, Sagot Y, Kato AC. BDNF-mediated rescue of axotomized motor neurones decreases with increasing dose. NeuroReport. 1994;5:1889–1892. doi: 10.1097/00001756-199410000-00012. [DOI] [PubMed] [Google Scholar]
- 55.von Bartheld CS. Tracing with radiolabeled neurotrophins. Methods Mol Biol. 2001;169:195–216. doi: 10.1385/1-59259-060-8:195. [DOI] [PubMed] [Google Scholar]
- 56.von Bartheld CS, Byers MR, Williams R, Bothwell M. Anterograde transport of neurotrophins and axodendritic transfer in the developing visual system. Nature. 1996;379:830–833. doi: 10.1038/379830a0. [DOI] [PubMed] [Google Scholar]
- 57.von Bartheld CS, Wang X, Butowt R. Anterograde axonal transport, transcytosis, and recycling of neurotrophic factors: the concept of trophic currencies in neural networks. Mol Neurobiol. 2001;24:1–28. doi: 10.1385/MN:24:1-3:001. [DOI] [PubMed] [Google Scholar]
- 58.West MJ. Stereological methods for estimating the total number of neurons and synapses: issues of precision and bias. Trends Neurosci. 1999;22:51–61. doi: 10.1016/s0166-2236(98)01362-9. [DOI] [PubMed] [Google Scholar]
- 59.Williams LR, Varon S, Peterson GM, Wictorin K, Fischer W, Bjorklund A, Gage FH. Continuous infusion of nerve growth factor prevents basal forebrain neuronal death after fimbria fornix transection. Proc Natl Acad Sci USA. 1986;83:9231–9235. doi: 10.1073/pnas.83.23.9231. [DOI] [PMC free article] [PubMed] [Google Scholar]
- 60.Zuccato C, Ciammola A, Rigamonti D, Leavitt BR, Goffredo D, Conti L, MacDonald ME, Friedlander RM, Silani V, Hayden MR, Timmusk T, Sipione S, Cattaneo E. Loss of huntingtin-mediated BDNF gene transcription in Huntington's disease. Science. 2001;293:493–498. doi: 10.1126/science.1059581. [DOI] [PubMed] [Google Scholar]