

Abstract
Neural stem cells can generate in vitroprogenitors of the three main cell lineages found in the CNS. The signaling pathways underlying the acquisition of differentiated phenotypes in these cells are poorly understood. Here we tested the hypothesis that Ca2+ signaling controls differentiation of neural precursors. We found low-frequency global and local Ca2+ transients occurring predominantly during early stages of differentiation. Spontaneous Ca2+signals in individual precursors were not synchronized with Ca2+ transients in surrounding cells. Experimentally induced changes in the frequency of local Ca2+signals and global Ca2+ rises correlated positively with neurite outgrowth and the onset of GABAergic neurotransmitter phenotype, respectively. NMDA receptor activity was critical for alterations in neuronal morphology but not for the timing of the acquisition of the neurotransmitter phenotype. Thus, spontaneous Ca2+ signals are an intrinsic property of differentiating neurosphere-derived precursors. Their frequency may specify neuronal morphology and acquisition of neurotransmitter phenotype.
Keywords: neural precursors, neuronal differentiation, calcium signaling, neurospheres, NMDA receptors, GABA
Introduction
Neurons and glial cells, the main cell types of the mammalian CNS, arise from a common stem cell (for review, see McKay, 1997). Neural stem cells from embryonic or adult brain proliferate in vitro in response to epidermal growth factor (EGF) and fibroblast growth factor-2 (FGF-2) to produce clusters of cells termed neurospheres (Reynolds and Weiss, 1992; Ciccolini and Svendsen, 1998; Gritti et al., 1999; Ciccolini, 2002). In such in vitro conditions, neural stem cells self-renew and retain the ability to generate multiple cell types over long periods of time (Reynolds and Weiss, 1996). Thus, neurospheres represent an attractive and simplified system for studying how cell multiplicity and cell specification are achieved during mammalian neural development. In addition, neurosphere-derived precursors retain a stable karyotype, and numerous studies have indicated that cells derived from such cultures survive transplantation and, to some extent, can differentiate and form connections with cells of the host brain (Svendsen and Smith, 1999). Therefore, neurosphere cultures may have a clinical relevance representing a possible alternative to fetal tissue in the therapy of neurodegenerative diseases. However, progress toward the clinical use of such a system has been hampered by the limited yield of mature neurons obtained after transplantation of neurosphere-derived neural precursors. This highlights the importance of investigating the mechanisms responsible for neuronal specification in this system.
Although many growth and neurotrophic factors can influence neuronal differentiation, several lines of evidence suggest that Ca2+ represents a key regulator of this process. Changes in the intracellular Ca2+concentration as a result of spontaneous or signal-regulated events have been shown to initiate specific cellular programs that are important, for example, in differentiation of skeletal and heart muscle (Berridge et al., 1998). Ca2+ is a versatile intracellular messenger that can mediate divergent local and global responses in the same cell (Bootman et al., 2001). It is established that Ca2+ is a key regulator of cell specification in the developing nervous system. For example, in embryonic Xenopus spinal neurons, two types of spontaneous events have been characterized both in vitro and in vivo: fast-rising global Ca2+ spikes with characteristics of action potentials, and slower Ca2+ transients, termed waves, generated in the growth cone region (Gu et al., 1994). Information encoded in the frequency of Ca2+ spikes controls neurotransmitter expression and potassium channel maturation, whereas Ca2+ waves regulate neurite extension (Gu and Spitzer, 1995; Gomez and Spitzer, 1999). Some of these effects of Ca2+ are mediated by the regulation of the phosphorylation of structural proteins (Lautermilch and Spitzer, 2000); others, like the acquisition of neurotransmitter phenotype, may require gene transcription (Spitzer et al., 2000).
In the present study, we characterized spontaneous Ca2+ signals in differentiating neurosphere-derived precursors and their effects on specific aspects of neuronal morphology and differentiation. These data, together with the well established functions of spontaneous events identified in other experimental systems, suggest that specific Ca2+ signaling patterns play a key role in the differentiation of neural precursor cells.
Materials and Methods
Culture of primary embryonic striatal cells. Striata from embryonic day 14 (E14) CD1 albino mouse embryos (plug day = 1.0) (Charles River, Calco, Italy) were dissected and transferred into ice-cold culture medium consisting of DMEM/F12 (1:1) (Invitrogen, San Diego, CA; ICN Biochemicals, Cleveland, OH), glucose (0.6%), glutamine (2 mm), NaHCO3 (3 mm), HEPES buffer (5 mm) (all from Sigma, St. Louis, MO), and 2% B27 supplement (Invitrogen) (hereafter referred to as growth medium). The tissue was gently triturated with a fire-polished Pasteur pipette, and 106 cells were plated at a density of 2 × 10⁵ cells per milliliter in T25 Corning culture flasks in growth medium. EGF (Sigma) and FGF-2 (R & D Systems, Minneapolis, MN) were added at a concentration of 20 ng/ml each. Half of the medium was replaced every 4 d with fresh medium containing the same concentration of growth factors.
Antibodies. The following antibodies were used at the indicated dilution: mouse monoclonal antibody to nestin (PharMingen; 1:1000 dilution); mouse monoclonal antibody to β tubulin type III (TuJ1) (Sigma; 1:1000); rabbit polyclonal antibody to glial fibrillary acidic protein (GFAP) (Dako; 1:500); rabbit polyclonal antibody to GABA (Sigma; 1:500); mouse monoclonal antibody to galactocerebroside C (Gal-C) [kind gift of Dr. Neil Scolding (Bristol, UK); 1:10]; mouse monoclonal antibody to bromodeoxyuridine (BrdU) (Amersham; 1:100).
Differentiation of neurosphere-derived precursors. Neurospheres were rinsed in growth medium and mechanically triturated through a fire-polished Pasteur pipette. Cells (2 × 10⁵) were plated onto poly-l-lysine-coated coverslips in culture medium containing 1% fetal calf serum and FGF-2 (2 ng/ml) and returned to the incubator. Cells were left in differentiating conditions for up to 10 d. The cell phenotype was determined immunocytochemically at different days after plating (DAP) using antibodies to TuJ1, nestin, and GFAP.
Cells were treated with various agents to either enhance or inhibit the Ca2+ signals. High K+ treatment was achieved by adjusting the KCl concentration in the culture medium to 50 mm. Low Ca2+ medium was obtained by replacing CaCl2 contained in the DMEM/F12 with MgCl2. For inhibition of NMDA receptors, APV (100 μm; Sigma) was added to the medium.
Immunocytochemistry. Cells were fixed in 4% paraformaldehyde in PBS containing 4% sucrose for 10 min, rinsed several times in PBS, permeabilized in NP40 (0.5% in PBS) for 5 min, and blocked in goat serum (1.5% in PBS) for 30 min; all were performed at room temperature. After fixation, cells were incubated with primary antibodies overnight at 4°C. GABA and BrdU were detected using biotin-conjugated secondary antibodies and Cy3-conjugated streptavidin (Vector Laboratories, Burlingame, CA). All other primary antibodies were detected using goat FITC-conjugated secondary antibodies (Vector). For BrdU staining, BrdU (10 μm) was added to differentiating neural precursors 1 d after plating. Twenty-four hours later, the cells were washed with culture medium and fixed in 100% ice-cold methanol at −20°C. After an additional 20 min, the cells were washed in PBS once, exposed to HCl (2m) for 20 min at 37°C, and rinsed twice with Borate buffer (0.1 m). Cells were incubated with BrdU antibody for 2 hr at 37°C and then left overnight at 4°C.
Neurite measurements and statistical analysis. At DAP 1, differentiating precursors were exposed to KCl (50 mm), low Ca2+conditions, or APV or left untreated (see Results). After 24 hr, cells were fixed, and the proportion of neurons in the culture was analyzed by immunocytochemistry using TuJ1 antibodies. The immunostained neurons were imaged with a Bio-Rad 1024 confocal microscope (Bio-Rad, Hemel Hempsted, UK). Photographs of isolated neurons in culture were taken, and the number of branches and the neurite length were measured using NIH Image. The means and SEs of at least three independent experiments were calculated, and statistical significance tests (ANOVA withpost hoc Newman–Keuls) were performed using a statistical package (Graphpad Prism, San Diego, CA).
Ca2+ imaging. The cells were loaded with Fluo3 by incubation with 2 μm Fluo3-AM for 30 min at room temperature (20–22°C) in an extracellular medium (EM) containing (in mm): 140 NaCl, 3 KCl, 1 MgCl2, 2 CaCl2, 10 HEPES, 10 glucose. After loading with Fluo3-AM, the cells were washed with EM and incubated for a further 20 min to allow complete deesterification of the dye. Ca2+ imaging was performed with Noran Oz (Noran, Bicester, UK) and UltraView (PerkinElmer Life Sciences, Cambridge, UK) confocal microscopes, using image sizes of 256 × 256 pixels and acquisition rates of 0.5–7.5 frames per second. Fluo3 was excited with a 488 nm line of an argon ion laser, and the emitted light >505 was detected. Ca2+ concentration was calculated from the Fluo3 fluorescence emission using a self-ratio equation as described previously (Cheng et al., 1993) assuming aKd of 810 nm(Thomas et al., 2000). The Ca2+ imaging data in the present study were obtained at 20–22°C.
Cell classification. In some experiments, imaged cells were classified as neurons or glial cells on the basis of morphological characteristics. Phase-bright cells, with small oval cell bodies and one or two thin, not highly branched (typically not longer than two to three cell diameters) processes were considered as neurons. A representative picture of such neurons is given in the phase-contrast image in Figure 1 (top right image). The accuracy by which these criteria allow the identification of neurons was verified in a double-blind test in which cells at DAP 2 and 5 were fixed and immunostained with TuJ1 antibodies as described above. For each field, photographs were taken under illumination with both transmitted and fluorescent light. Cells were first scored as neuronal or glial according to the above-mentioned criteria; the exact identity of the cells was then assessed by examination of the corresponding immunofluorescence photograph. At DAP 2, none of the cells scored as neurons were immunopositive for Gal-C, and only a small fraction (∼1%) were identified as GFAP-immunoreactive astrocytes. The majority of the cells (∼60%) scored as neurons were TuJ1 positive; ∼30–40% were nestin positive and thus are likely to be immature (not yet TuJ1 positive) neuronal precursors. At DAP 5, >90% of the cells classified as neurons stained for TuJ1, consistent with the expression of this marker as the cells matured.
Fig. 1.
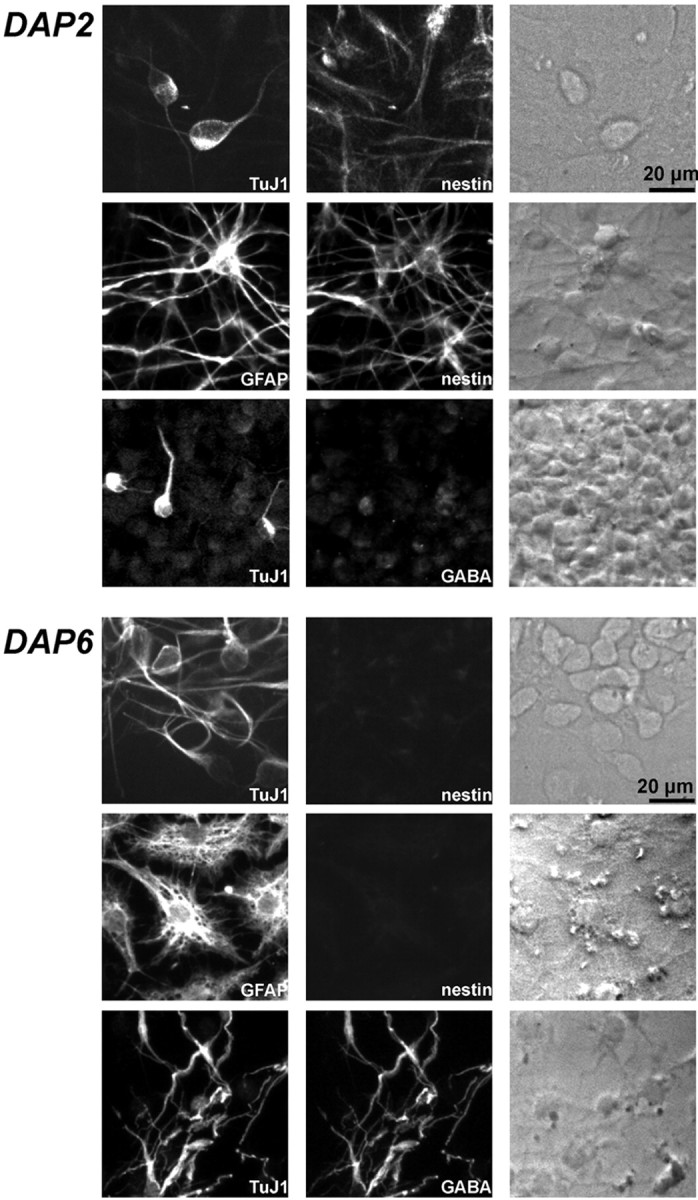
Expression of differentiation markers in cultured neurosphere-derived precursors. The panels show examples of double immunostaining identifying neurons (TuJ1 immunoreactive) and nestin-immunoreactive precursors (top row), astrocytes (GFAP immunoreactive) and precursors (middle row), and neurons and GABA-immunopositive cells (bottom row) in neurosphere-derived cultures grown for 7 d in the presence of EGF and FGF-2 and differentiated for an additional 2 d (DAP 2) and 6 d (DAP 6). Phase-contrast photographs of each field are shown in the right-hand column.
Categorizing Ca2+ transients. Ca2+ transients were classified as global when the fluorescence increased in the whole cell body. Localized Ca2+ transients refer to spatially restricted Ca2+ increases with amplitudes that were three times greater than the SD of the baseline noise. Throughout this study, localized Ca2+events were analyzed only in cells with neuronal morphology.
Results
Spontaneous Ca2+ events during neural precursor differentiation: global and localized transients
Neurosphere cultures were obtained by growing in vitroE14 mouse striatal cells in the presence of both EGF and FGF-2. At the E14 stage, the vast majority of neurosphere-derived cells are undifferentiated (Ciccolini and Svendsen, 1998) and express nestin, a cytoskeleton protein found mainly in neural precursors (Lendahl et al., 1990). During plating onto a substrate, neurosphere-derived precursors differentiate into both glial and neuronal cells. Two days after plating, the majority of the cells expressed both nestin and the astrocytic marker GFAP (Fig. 1), whereas cells expressing TuJ1 were few at DAP 2 (2.77 ± 0.65%). The percentage of neurons increased between DAP 3 and 6 to 16.8 ± 4.1% (Fig. 1), whereas the total number of cells did not change (data not shown). At DAP 2, the majority of TuJ1-immunoreactive cells did not express nestin or GABA (Fig. 1), whereas by DAP 6, GABA neurotransmitter was expressed in virtually all neurons (Fig. 1). These results indicate that in our system neurosphere-derived precursors undergo differentiation between DAP 1 and DAP 6, as indicated by downregulation of nestin expression. Neurogenesis occurs mainly between DAP 2 and 6 when expression of GABA is detected in all neurons.
We investigated whether spontaneous Ca2+ transients occurred during neural precursor differentiation. DAP 1 neurosphere-derived precursor cells were loaded with Fluo3, and Ca2+ transients were recorded for 30 min with a confocal microscope. In addition, neural precursors were defined as glial or neuronal cells on the basis of morphological criteria (see Material and Methods for a detailed description). Spontaneous Ca2+ signals were observed in both glial and neuronal cells. Two main types of spontaneous Ca2+ events were found in differentiating precursors: global Ca2+ transients, which engulfed the whole cell body, and localized events, in which Ca2+ increases were limited to a subcellular region, usually a process (Fig.2). Global events were characterized by a sudden (generally lasting <3 min) and conspicuous increase of the intracellular Ca2+ concentration (Fig. 2, regions 4 and 6) or irregular and smaller increases of the intracellular Ca2+concentration (often <200 nm). The local Ca2+ signals were of variable amplitude and duration. Although they occurred occasionally in cell bodies (Fig.2, region 2), they were most often observed in cellular processes (Fig. 2, regions 3 and 5). Similar types of spontaneous Ca2+ signals were found when cells were imaged either at room temperature or at 37°C (data not shown).
Fig. 2.

Examples of spontaneous local and global Ca2+ signals in neurosphere-derived precursors 1 d after induction of differentiation. Aa, Confocal image showing a field of cells loaded with Fluo3. Thenumbered circles indicate the subcellular regions from which Ca2+ changes were analyzed. Examples of the observed local and global Ca2+ signals are depicted in Ab. The traces in B show the time course of calcium signals from the correspondingly numbered regions inAa. The arrowheads beneath thetraces in B indicate the particular Ca2+ signals shown in Ab.
We next characterized global and local Ca2+ events at different days after plating to investigate whether their properties were modified during neural precursor differentiation. Neurosphere-derived precursors were imaged for 10 min at room temperature 3 hr after induction of differentiation (DAP 0) and at DAP 1, 2, and 5 (i.e., 24, 48, and 120 hr after differentiation was induced). For each day, we noted the number of spontaneously active cells in addition to the characteristics of the global and local Ca2+ signals. We observed that the percentage of cells displaying global Ca2+ signals peaked between DAP 1 and 2 and then declined (Fig. 3A). The frequencies of the global signals reduced (Fig. 3B), and their amplitudes showed a significant increase (Fig. 3C) as the cells differentiated.
Fig. 3.
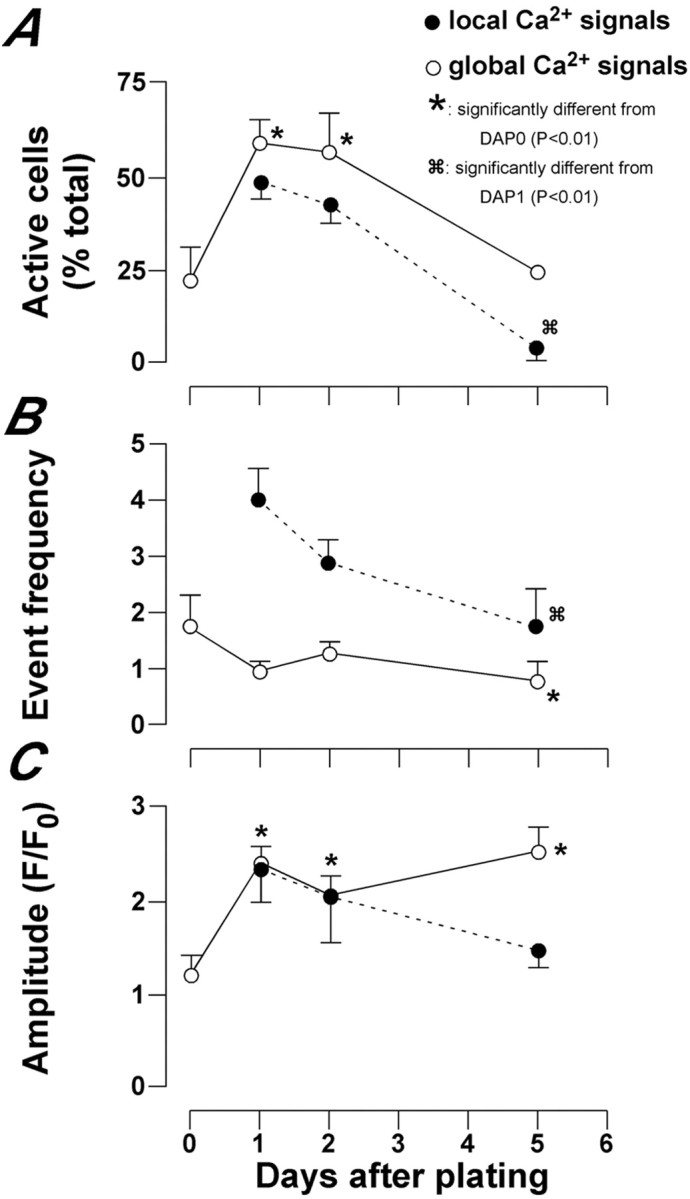
The occurrence of both global and local events decreases during differentiation. The graphs indicate the number of active cells (A), the frequency of events (number of events per cell or branch during a 10 min recording) (B), and the amplitude of the Ca2+ signals for both global and local responses after induction of differentiation (C). Please note that the local Ca2+ responses were measured from cells with neuronal morphology only. The global responses reflect glial and neuronal signals pooled, to show the decline of Ca2+ transients throughout the culture. The data represent the mean ± SEM of at least three independent experiments with an average of 69 cells analyzed for each time point.
The local Ca2+ signals were analyzed from DAP 1, by which time the cells had already extended processes. As in the case of global Ca2+ signals, we found that the percentage of cells displaying local Ca2+ transients and the frequency of such events were greater during the first 2 d of development (Fig.3A,B). The amplitude of local Ca2+ signals did not alter significantly. The overall pattern from these data is that both the global and local spontaneous Ca2+ signals were observed more frequently at early stages of neural precursor differentiation.
Throughout the study, the local Ca2+events were analyzed only in neuronal cells; however, we did examine the activity of global Ca2+ signals in both neuronal and glial cells. The data presented in Figure 3 showing that global Ca2+ signaling declined in all the cells reflect the pooled activities of the glial and neuronal cells. When global events were analyzed separately in glial and neuronal cells, we found that the spontaneous global Ca2+ signals declined almost in parallel in the two cell populations. The only significant difference between these cell types was observed at DAP 5 when 24.7 ± 8.5% of glial cells and 5 ± 5% of neurons were showing spontaneous global calcium signals.
We examined whether changes in the expression of functional channels and receptors involved in generating Ca2+signals were responsible for the decline in spontaneous events. The response of neuronal and glial cells to depolarization with KCl (60 mm), caffeine (40 mm), and glutamate (100 μm) was tested at various days after induction of differentiation. Depolarization using KCl evoked acute Ca2+ signals in almost all identified neurons and the majority of glial cells at all stages of differentiation (Fig.4A). The amplitude of the KCl-induced Ca2+ signals in glial cells did not alter appreciably, whereas the response of the neurons increased substantially from DAP 1 to DAP 8, and then rose dramatically at DAP 10. Caffeine, on the other hand, evoked similar amplitude Ca2+ signals at all stages, with little difference between neurons and glial cells (Fig. 4B). However, caffeine was the most unreliable agonist in that the proportion of responsive cells varied considerably between days, and many cells failed to respond (Fig.4B,c). The effect of glutamate was also rather variable, but there was a clear trend for an increasing number of neurons to be glutamate responsive with time in culture (Fig.4C). In summary, the neurons seem to become increasingly competent at Ca2+ signaling as differentiation proceeds. Therefore, the loss of spontaneous Ca2+ signals is not attributable to the neurons lacking the ability to generate Ca2+ signals, but rather results from the incidence of spontaneous events declining as the neurons and glial cells mature.
Fig. 4.

Changes in Ca2+ signaling capacity of differentiating neurons and glial cells.A–C indicate responses of neuronal (gray bars) and glial cells (white bars) to acute stimulation with KCl (A), caffeine (B), and glutamate (C). Mean ± SEM data are shown inAa–Cb. The numberson the bars in Aa, Ba, andCa indicate the fraction of responsive cells, with the denominator indicating the number of cells analyzed. The peak amplitude data were calculated using responsive cells only. Thetraces in Ac–Cc show examples of the responses of single neuronal and glial cells at the earliest (DAP 2) and latest (DAP 10) time points tested. The traces were chosen randomly from matched experiments.
Modulating the frequency of spontaneous Ca2+ events
The observation that the frequency and the number of spontaneous events peaked at early stages of neural precursor differentiation, when neurogenesis occurs, prompted us to investigate whether spontaneous Ca2+ signaling plays a role in neuronal specification. To investigate this hypothesis, we manipulated the culture conditions during neural precursor differentiation to interfere with Ca2+ signaling.
The origin of spontaneous Ca2+ events in differentiating neural precursors is still an object of discussion. In amphibian spinal neurons, it has been proposed that some spontaneous events originate from Ca2+ entry through voltage-dependent Ca2+ channels and that Ca2+ release from intracellular stores contributes to their amplitude (Gu et al., 1994). Therefore, we examined the effect of modulating Ca2+entry on spontaneous Ca2+ events.
After dissociation, neurosphere-derived cells were plated on poly-l-lysine-coated coverslips in differentiating conditions as described above. On DAP 1, the cells were exposed to three different conditions: low extracellular Ca2+ (∼100 μm), 50 mm KCl, or untreated (control). During the course of this study, the various treatments were always applied 24 hr after the initial plating on coverslips so that there was no interference with the cells before they were fully adhered.
We found that incubation in low extracellular Ca2+ medium (for ≥24 hr) completely inhibited the occurrence of all types of spontaneous Ca2+ signal from DAP 2 onward (data not shown). In contrast, the control and KCl-treated cells continued to display spontaneous Ca2+ events. The effect of KCl treatment was to enhance the propensity of the cells to show spontaneous local and global Ca2+signals at all stages of differentiation. For global signals, this was evident most significantly in the frequency of events (Fig.5A,a) and the amplitude of the signals (Fig.5A,b) at various stages. The proportion of active cells at DAP 5 was also enhanced by KCl (Fig.5A,c), but this was caused primarily by the activity of cells with astrocytic morphology (Fig.5B,C). Although depolarization increased the frequency and amplitude of global Ca2+ signals, it did not prevent the trend that the neurons within the culture became increasingly quiescent with respect to global Ca2+ signals. The number of active neurons declined even in the presence of KCl (Fig.5B). The sustained effect of KCl on the frequency of events (Fig.5A,a) was caused by the activity of glial cells.
Fig. 5.

Membrane depolarization enhances global Ca2+ signals. Aa–Acillustrate the effect of 50 mm KCl on the characteristics of global Ca2+ signals at different days after induction of differentiation. Event frequency(Aa) indicates the number of events per cell or branch during a 10 min recording. The graph in Billustrates that the number of neurons showing global Ca2+ signals declined with or without KCl treatment. The data shown represent the mean ± SEM of at least three independent experiments in which an average of 154 cells were analyzed for each time point. The images in C illustrate an example of a global Ca2+ signal in a cell with astrocytic morphology at DAP 5. Images of the same cell are shown at 15 sec intervals, with time running from left toright and top tobottom.
KCl had an even greater effect in enhancing the propensity of the neuronal cells to show local Ca2+ signals. This effect was observed in terms of proportion of active cells (Fig.6A), frequency of local Ca2+ signals (Fig. 6B), and event amplitude (Fig. 6C). These data indicate that multiple aspects of the local and global Ca2+ signals in the cells acquiring neuronal phenotype could be upregulated using KCl.
Fig. 6.
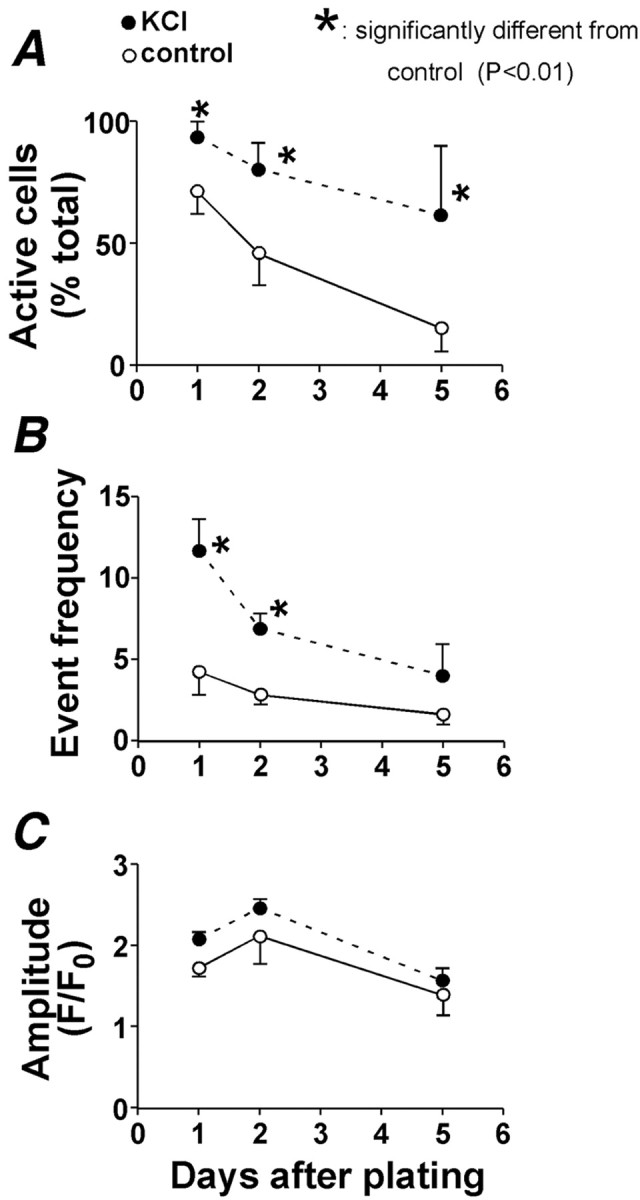
Membrane depolarization enhances local Ca2+ signals. A–Cillustrate the effect of 50 mm KCl on the characteristics of local Ca2+ signals at different days after induction of differentiation. Event frequency(B) indicates the number of local Ca2+ signals observed during a 10 min recording. The data shown represent the mean ± SEM of at least three independent experiments in which an average of 76 cells were analyzed for each time point.
The enhancement of local, but not global, Ca2+ signals by KCl was dependent on NMDA receptor activity. In DAP 1 cells, application of KCl increased the occurrence of local Ca2+ signals from control values of 3.9 ± 0.9 to 12.2 ± 1.6 events per branch during a 10 min recording (data from at least 15 branches). The NMDA receptor antagonist APV applied together with KCl reduced the incidence of local Ca2+ transients back to control levels (5 ± 0.9 events per branch; data from 18 branches). APV had no effect on the occurrence of global signals. In addition, APV did not alter the generation of local or global Ca2+ signals when applied in the absence of KCl (data not shown). In control conditions, the majority (>75%) of local Ca2+ signals occurred preferentially at the most distal region of a neurite. When cells were exposed to KCl, the Ca2+ signals still originated preferentially in distal neuritic regions, but they were also detectable in more proximalregions because of a greater spreading of the events (data not shown). Therefore, depolarization not only promoted the frequency and amplitude of local Ca2+ signals, but it also increased their spatial extent. The enhanced spreading of the local Ca2+ signals was also dependent on NMDA receptor activity. In control and KCl + APV conditions, the average spreading of local Ca2+ signals was 3.2 ± 0.3 and 2.7 ± 0.2 μm, respectively. In contrast, in the presence of KCl alone, the average length of each event was 5.8 ± 0.4 μm.
The frequency of spontaneous Ca2+ signals correlates with acquisition of neurotransmitter phenotype and neurite length
By differentiating the precursor cells in the conditions described above, we were able to either inhibit (low Ca2+ medium) or enhance (KCl) the spontaneous Ca2+ signals relative to control conditions. We therefore used these experimental conditions to examine the effect of spontaneous Ca2+signals on the development of neuronal morphology and neurotransmitter phenotype.
Importantly, 24 hr exposure to these treatments did not cause a change in the rate of neural precursor proliferation or survival. To investigate the effect of the various treatments on cell proliferation, we first analyzed the number of dividing cells in control, KCl, and low calcium-treated cultures. At DAP 2, after 24 hr of differentiation in the presence of BrdU, we found similar BrdU incorporation rates across the different conditions (Table 1), indicating that the modification of neuronal phenotypes observed was not caused by a change in neural progenitor proliferation. To rule out the possibility that the applied treatments specifically affected the proliferation of neurons, we analyzed the cell division of neurons during the exposure to the different conditions by examining TuJ1 and BrdU costaining. These data demonstrate that only ∼4% of the neuronal population had divided during the 24 hr exposure to the different conditions and that KCl or low calcium treatments did not cause a significant variation in the number of BrdU-immunopositive neurons compared with control conditions (Table 1). Throughout the study we used TuJ1 to identify neurons. Because TuJ1 is a neuronal marker expressed in postmitotic cells, our data also show that most of the neurons (∼96%) found at DAP 2 exited the cell cycle before being exposed to the various treatments.
Table 1.
Effect of KCl (50 mm) and low Ca2+treatments on cell proliferation and death in the neuronal precursor cultures
| Control | KCl 50 mm | Low Ca2+ | |
|---|---|---|---|
| Cells staining with TuJ1, i.e., proportion of neurons in the culture (5) | 3.7 ± 0.9 | 3.2 ± 0.6 | 2.4 ± 0.1 |
| Cells that incorporated BrdU (5) | 20.5 ± 6.2 | 23.4 ± 7.9 | 15 ± 6.3 |
| Neurons that incorporated BrdU (4) | 3.3 ± 1.1 | 4 ± 0.7 | 5.2 ± 0.8 |
| Cells staining with DAPI (4) | 7.7 ± 1.6 | 10.5 ± 1.9 | 7.6 ± 1.5 |
| Cells displaying pyknotic nuclei (3) | 3.2 ± 1.1 | 4.1 ± 1.4 | 2.9 ± 1.0 |
The table shows the percentage of cells staining with the markers described in the left-most column or showing pyknotic nuclei. Neurosphere-derived precursors were plated onto poly-l-lysine-coated coverslips. The indicated treatments and BrdU were added 24 hr after plating. Cells were analysed after an additional 24 hours. The values represent the means ± SEM. The values in parentheses indicate the number of experiments. For each experiment at least two fields of cells, each containing on average 80 cells, were analysed. DAPI and Hoechst concentration were used at concentrations of 1 mg/ml. DAPI was added to live cells 5–10 min before scoring the coverslips. Hoechst was added to fixed cells and left for 40–60 min.
To investigate the possibility that the different conditions might affect cell death, we analyzed whether cell viability varied across the different conditions by dye (DAPI) exclusion. In addition, we investigated the number of pyknotic nuclei found in control cultures and in cultures exposed to KCl or low calcium for 24 hr. Both assays revealed no significant change in cell death across the different conditions (Table 1). Together with the observations that neuronal and total cell numbers are not affected by the various treatments, these data demonstrate that the eventual changes in neuronal phenotype observed after interfering with calcium signals are caused by calcium modulation of neuronal differentiation rather than changes in survival or proliferation rates.
When control and KCl-treated cultures were analyzed at DAP 5, we found that most of the neurons were GABA immunoreactive in either condition (Fig. 7). However, at DAP 2 the number of GABA-expressing cells increased significantly after KCl treatment, both in the presence and in the absence of APV, and decreased to almost negligible levels after exposure to low Ca2+ medium (Fig.8). At DAP 2, there was no significant difference in the proportion of neurons (identified by TuJ1 expression) found in control and treated cultures. These data indicate that enhancing global Ca2+ signaling did not influence the type of neurotransmitter phenotype acquired during neural precursor differentiation. However, increasing the frequency of the global Ca2+ signals accelerated the acquisition of GABAergic phenotype.
Fig. 7.

Effect of KCl treatment on GABA expression. Neurosphere-derived neurons were analyzed for TuJ1 and GABA expression at 2 d (A, DAP 2) and 5 d (B, DAP 5) after induction of differentiation. The Hoechst fluorescence is shown to indicate the position of the cell nuclei.
Fig. 8.

KCl and low Ca2+ modulate GABA expression. A shows a quantitative analysis of the number of TuJ1 and GABA double-immunopositive neurons found at DAP 2 in neurosphere cultures differentiating in the indicated conditions. The data represent mean ± SEM of at least three independent experiments. * p < 0.001, significantly different from control; + p < 0.05, significantly different from control. B shows examples of immunofluorescence recorded from cells treated as shown.
We next investigated whether Ca2+ signals affected neuronal morphology. Cultures differentiating in the presence of low Ca2+, KCl, KCL + APV, and control conditions were fixed at DAP 2. The neurons were identified by TuJ1 immunostaining. The number of branch points and the lengths of neurites were measured on neurons found in fields of comparable cell density. Differentiation of cells in the low Ca2+conditions significantly decreased the neurite length, compared with control cultures (Fig.9A,B). In contrast, the neuronal processes were significantly longer in KCl-treated cultures than in control (Fig. 9). The KCl-induced change in neuronal morphology was mediated by NMDA receptor activation. As illustrated in Figure 9C, the presence of the NMDA receptor blocker APV abolished the effect of KCl on neurite length. A similar pattern was observed when cells were analyzed after a 4 d exposure to the different treatments. The neurites of KCl-treated DAP 5 cells were 260 ± 34% longer than DAP 5 neurons grown in control conditions. Therefore, the effects of altering the frequency of spontaneous Ca2+ signals on neurite morphology were rapidly initiated in the differentiating cells and maintained as the cells matured.
Fig. 9.
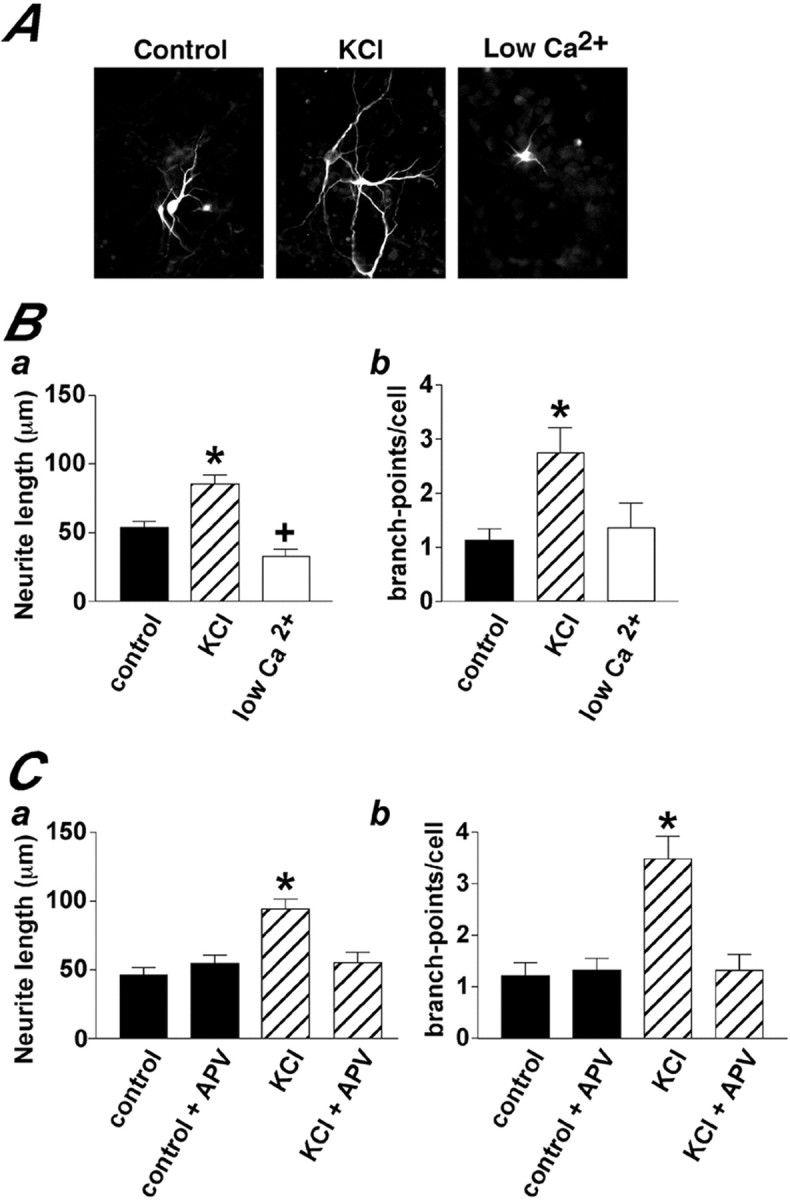
KCl and low Ca2+ modulate neuronal morphology. A shows examples of TuJ1-immunoreactive neurons found in cultures exposed for 24 hr to KCl, low Ca2+, or control conditions. *p < 0.01, significantly different from control;+p < 0.05, significantly different from control. B shows a quantitative summary of the effects of KCl and low Ca2+ conditions on neurite length and branch points. C illustrates the abolition of KCl-induced changes in neuronal morphology by the NMDA receptor blocker APV. The data represent mean ± SEM of at least three independent experiments.
These data indicate that the frequency of local Ca2+ signals correlated with neurite extension and neurite branching. Changes in neurite morphology, but not acquisition of neurotransmitter phenotype, required NMDA receptor activation.
Discussion
In this study, we show that spontaneous Ca2+ signaling is an intrinsic characteristic of differentiating neurosphere-derived precursors. We used two different methods of altering the occurrence of spontaneous Ca2+ signals to examine their effect on neuronal development. Our results indicate that Ca2+ signaling is a mediator of neural precursor differentiation and may regulate the maturation of the neuronal phenotype. Because Ca2+ is a ubiquitous second messenger, these observations may indicate that modulation of the intracellular Ca2+concentration represents a common target for factors and signals that regulate neural precursor differentiation.
Spontaneous Ca2+ oscillations occur in many different neuronal types and at different stages of maturation (Sorimachi et al., 1990; Yuste et al., 1992; Wong et al., 1995; Owens et al., 2000; Liljelund et al., 2000). They have been implicated in the regulation of several aspects of neuronal differentiation such as migration (Komuro and Rakic, 1996), neuronal wiring (Feller et al., 1996), and neuronal differentiation (Gomez et al., 1995; Gu and Spitzer, 1995; Carey and Matsumoto, 1999). Consistent with a role in the acquisition of neuronal phenotype, we found that in our system spontaneous Ca2+ signals were frequent at early stages of differentiation (i.e., DAP 2) (Figs. 2, 6). In addition, interference with Ca2+ signaling at this early stage correlated with changes in the neuronal morphology and neurotransmitter expression (Figs. 7-9). In developing amphibian neurons, these two particular aspects of neuronal differentiation are regulated by the frequency and the site of generation of spontaneous Ca2+ signals: low-frequency spikes control the development of GABA expression and higher-frequency growth cone-localized Ca2+ waves regulate neurite extension (Gu and Spitzer, 1995). Although our results do not allow a functional discrimination between different types of Ca2+ signals, they show that also in neurosphere-derived precursors, Ca2+transients can be either localized to a specific cellular region or engulf the whole cell body. In addition to their subcellular location, localized and global signals found in neurosphere-derived precursors show differences in frequency and amplitude that parallel the differences observed between waves and spikes in Xenopusspinal cord neurons. Consistent with results obtained in amphibian spinal cord neurons, our analysis shows a positive correlation between GABA expression and frequency of spontaneous events.
One possible mechanism by which Ca2+transients could affect GABA receptor expression is the promotion of gene transcription. Several lines of evidence support such a hypothesis. There is a correlation between Ca2+ signaling and the level of glutamic acid decarboxylase transcripts (Watt et al., 2000). In cerebellar granule cells, it has been suggested that Ca2+ ions entering through voltage-gated channels modulate expression of GABA receptor δ subunit through activation of CaM kinases (Gault and Siegel, 1997). We also found that the activation of voltage-gated channels by KCl was sufficient to promote GABA expression and that NMDA receptor activity was not required (Fig. 8).
Although our results concur with those from Xenopus spinal cord neurons in terms of a correlation between the frequency of Ca2+ signals and the acquisition of GABA expression, the effect of spontaneous Ca2+signals on neurite length appears to be different. In our neurosphere-derived precursors, conditions that abolish Ca2+ signals (i.e., low Ca2+ medium) do not induce an increase in neurite length. Indeed, neurons from cultures exposed to low Ca2+ conditions exhibit shorter neurites than cells in control conditions (Fig. 9). Moreover, membrane depolarization, which increases the frequency of Ca2+ signals, increases neurite length and the number of branch points.
This different effect of Ca2+ in the two systems may be attributable to several factors other than cell type and species differences. In our experiments, neurons were grown on an astrocytic cell layer that may affect their morphology, for example, by releasing factors into the culture medium. Our results show that the NMDA receptor blocker APV decreases neurite length in KCl-treated cultures but not in control conditions (Fig. 9), indicating that NMDA receptor-mediated neurite extension is operating in depolarizing conditions. It is plausible that KCl induced NMDA receptor activation by promoting the release of glutamate or growth factors into the medium (Blondel et al., 2000). It is also possible that the molecular machinery underlying neurite extension varies during differentiation, and Ca2+ signals may have different effects depending on the particular stage of differentiation. Amphibian neurons exhibit a Ca2+-sensitive period during the 12 hr after plating in which low Ca2+ conditions cause an increase in neurite length (Holliday et al., 1991). During this time frame, periodic Ca2+ elevations inhibit neurite extension by promoting calcineurin activation and affecting the phosphorylation state of cytoskeletal proteins (Lautermilch and Spitzer, 2000). Because in our system neurons were exposed to low Ca2+ 24 hr after plating, it is possible that at this stage different mechanisms preside over neurite extension and are affected differently by Ca2+signals. This suggestion is supported by the observation that the effect of membrane depolarization on neurite length was unaffected by inhibitors of calcineurin (our unpublished observations). Furthermore, it is not always easy to predict the consequence of a rise in Ca2+ levels on growth cone behavior. Large rises can cause growth cone collapse, whereas more modest signals can either slow or promote neurite outgrowth (Spitzer et al., 2000).
Besides affecting differentiation of neuronal cells, spontaneous Ca2+ signals may play a general role in the differentiation of other precursor cells. Indeed, spontaneous Ca2+ oscillations were observed in developing myocytes (Ferrari and Spitzer, 1999), non-neuronal neural crest cells (Carey and Matsumoto, 1999), and endodermal cells (Sauer et al., 1998), indicating that Ca2+transients are a hallmark of developing precursors and not an exclusive property of differentiating neurons. Different types of Ca2+ signals are present at different stages of differentiation (Owens and Kriegstein, 1998; Owens et al., 2000), and the molecular machinery dictating Ca2+ homeostasis changes during neural precursor development (Maric et al., 2000). These observations suggest that Ca2+ transients may participate in different signaling events at different stages of development.
In summary, our data show that complex patterns of spontaneous Ca2+ signals can be recorded in differentiating neurosphere-derived precursor cells. Despite their heterogeneity, these events can be grouped loosely into local and global Ca2+ signals. These two types of Ca2+ signal appear to control different aspects of neuronal precursor development, with the NMDA receptor-dependent local Ca2+ signals primarily controlling neurite morphology and the global events regulating acquisition of neurotransmitter phenotype. Although such Ca2+ signals persist for many days, they become less frequent as the neurons mature. The Ca2+ signals in neuronal cells can be enhanced or inhibited by altering the culture conditions to promote or inhibit Ca2+ entry. Such modulation of Ca2+ signaling has significant effects on the acquisition of neurotransmitter phenotype and cellular morphology at early (i.e., DAP 2) and late (i.e., DAP 5) stages of neurosphere-derived precursor differentiation.
Footnotes
This work was supported by the Biotechnology and Biological Sciences Research Council. M.D.B. gratefully acknowledges the support of a Royal Society Fellowship. F.C. gratefully acknowledges the support of a Merck Sharp and Dohme Fellowship.
Correspondence should be addressed to Dr. Martin D. Bootman, Laboratory of Molecular Signalling, The Babraham Institute, Babraham, Cambridge CB2 4AT, UK. E-mail: martin.bootman@bbsrc.ac.uk.
F. Ciccolini's present address: Department of Neurobiology, Interdisciplinary Center for Neurosciences, University of Heidelberg, Im Neuenheimer Feld 364, 69120 Heidelberg, Germany.
J. Sudhoelter's present address: Centre of Physiology, University of Goettingen, Goettingen, Germany.
References
- 1.Berridge MJ, Bootman MD, Lipp P. Calcium—a life and death signal. Nature. 1998;395:645–648. doi: 10.1038/27094. [DOI] [PubMed] [Google Scholar]
- 2.Blondel O, Collin C, Mc Carran WJ, Zhu S, Zamostiano R, Gozes I, Brenneman DE, Mc Kay RDG. A glia-derived signal regulating neuronal differentiation. J Neurosci. 2000;20:8012–8020. doi: 10.1523/JNEUROSCI.20-21-08012.2000. [DOI] [PMC free article] [PubMed] [Google Scholar]
- 3.Bootman MD, Lipp P, Berridge MJ. The organisation and functions of local Ca2+ signals. J Cell Sci. 2001;114:2213–2222. doi: 10.1242/jcs.114.12.2213. [DOI] [PubMed] [Google Scholar]
- 4.Carey MB, Matsumoto SG. Spontaneous calcium transients are required for neuronal differentiation of murine neural crest. Dev Biol. 1999;215:289–313. doi: 10.1006/dbio.1999.9433. [DOI] [PubMed] [Google Scholar]
- 5.Cheng H, Lederer WJ, Cannell MB. Calcium sparks elementary events underlying excitation-contraction coupling in heart muscle. Science. 1993;262:740–744. doi: 10.1126/science.8235594. [DOI] [PubMed] [Google Scholar]
- 6.Ciccolini F. Identification of two distinct types of multipotent neural precursors that appear sequentially during CNS development. Mol Cell Neurosci. 2001;17:895–907. doi: 10.1006/mcne.2001.0980. [DOI] [PubMed] [Google Scholar]
- 7.Ciccolini F, Svendsen CN. Fibroblast growth factor 2 (FGF-2) promotes acquisition of epidermal growth factor (EGF) responsiveness in mouse striatal precursor cells: identification of neural precursors responding to both EGF and FGF-2. J Neurosci. 1998;18:7869–7880. doi: 10.1523/JNEUROSCI.18-19-07869.1998. [DOI] [PMC free article] [PubMed] [Google Scholar]
- 8.Feller MB, Wellis DP, Stellwagen D, Werblin FS, Shatz CJ. Requirement for cholinergic synaptic transmission in the propagation of spontaneous retinal waves. Science. 1996;272:1182–1187. doi: 10.1126/science.272.5265.1182. [DOI] [PubMed] [Google Scholar]
- 9.Ferrari MB, Spitzer NC. Calcium signaling in the developing Xenopus myotome. Dev Biol. 1999;213:269–282. doi: 10.1006/dbio.1999.9387. [DOI] [PubMed] [Google Scholar]
- 10.Gault LM, Siegel RE. Expression of the GABAA receptor δ subunit is selectively modulated by depolarization in cultured rat cerebellar granule neurons. J Neurosci. 1997;17:2391–2399. doi: 10.1523/JNEUROSCI.17-07-02391.1997. [DOI] [PMC free article] [PubMed] [Google Scholar]
- 11.Gomez TM, Spitzer NC. In vivo regulation of axon extension and pathfinding by growth-cone calcium transients. Nature. 1999;397:350–355. doi: 10.1038/16927. [DOI] [PubMed] [Google Scholar]
- 12.Gomez T, Snow DW, Letourneau PC. Characterisation of spontaneous calcium transients in nerve growth cones and their effect on growth cone migration. Neuron. 1995;14:1233–1246. doi: 10.1016/0896-6273(95)90270-8. [DOI] [PubMed] [Google Scholar]
- 13.Gritti A, Frolichsthal-Schoeller P, Galli R, Parati EA, Cova L, Pagano SF, Bjornson CR, Vescovi AL. Epidermal and fibroblast growth factors behave as mitogenic regulators for a single multipotent stem cell-like population from the subventricular region of the adult mouse forebrain. J Neurosci. 1999;19:3287–3297. doi: 10.1523/JNEUROSCI.19-09-03287.1999. [DOI] [PMC free article] [PubMed] [Google Scholar]
- 14.Gu X, Spitzer NC. Distinct aspects of neuronal differentiation encoded by frequency of spontaneous neuronal Ca2+ transients. Nature. 1995;375:784–787. doi: 10.1038/375784a0. [DOI] [PubMed] [Google Scholar]
- 15.Gu X, Olson EC, Spitzer NC. Spontaneous neuronal calcium spikes and waves during early differentiation. J Neurosci. 1994;14:6325–6335. doi: 10.1523/JNEUROSCI.14-11-06325.1994. [DOI] [PMC free article] [PubMed] [Google Scholar]
- 16.Holliday J, Adams RJ, Sejnowski TJ, Spitzer NC. Calcium-induced release of calcium regulates differentiation of cultured spinal neurons. Neuron. 1991;7:787–796. doi: 10.1016/0896-6273(91)90281-4. [DOI] [PubMed] [Google Scholar]
- 17.Komuro H, Rakic P. Intracellular Ca2+ fluctuations modulate the rate of neuronal migration. Neuron. 1996;17:275–285. doi: 10.1016/s0896-6273(00)80159-2. [DOI] [PubMed] [Google Scholar]
- 18.Lautermilch NJ, Spitzer NC. Regulation of calcineurin by growth cone calcium waves controls neurite extension. J Neurosci. 2000;20:315–325. doi: 10.1523/JNEUROSCI.20-01-00315.2000. [DOI] [PMC free article] [PubMed] [Google Scholar]
- 19.Lendahl U, Zimmerman LB, McKay RD. CNS stem cells express a new class of intermediate filament protein. Cell. 1990;60:585–595. doi: 10.1016/0092-8674(90)90662-x. [DOI] [PubMed] [Google Scholar]
- 20.Liljelund P, Netzeband JG, Gruol DL. L-type calcium channels mediate calcium oscillation in early postnatal Purkinje neurons. J Neurosci. 2000;20:7394–7403. doi: 10.1523/JNEUROSCI.20-19-07394.2000. [DOI] [PMC free article] [PubMed] [Google Scholar]
- 21.Maric D, Maric I, Barker JL. Developmental changes in cell calcium homeostasis during neurogenesis of the embryonic rat cerebral cortex. Cereb Cortex. 2000;10:561–573. doi: 10.1093/cercor/10.6.561. [DOI] [PubMed] [Google Scholar]
- 22.McKay R. Stem cells in the central nervous system. Science. 1997;276:66–71. doi: 10.1126/science.276.5309.66. [DOI] [PubMed] [Google Scholar]
- 23.Owens DF, Kriegstein AR. Patterns of intracellular calcium fluctuation in precursor cells of the neocortical ventricular zone. J Neurosci. 1998;18:5374–5388. doi: 10.1523/JNEUROSCI.18-14-05374.1998. [DOI] [PMC free article] [PubMed] [Google Scholar]
- 24.Owens DF, Flint AC, Dammermann RS, Kriegstein AR. Calcium dynamics of neocortical ventricular zone cells. Dev Neurosci. 2000;22:25–33. doi: 10.1159/000017424. [DOI] [PubMed] [Google Scholar]
- 25.Reynolds BA, Weiss S. Generation of neurons and astrocytes from isolated cells of the adult mammalian central nervous system. Science. 1992;255:1707–1710. doi: 10.1126/science.1553558. [DOI] [PubMed] [Google Scholar]
- 26.Reynolds BA, Weiss S. Clonal and population analyses demonstrate that an EGF-responsive mammalian embryonic CNS precursor is a stem cell. Dev Biol. 1996;175:1–13. doi: 10.1006/dbio.1996.0090. [DOI] [PubMed] [Google Scholar]
- 27.Sauer H, Hofmann C, Waternberg M, Wobus AM, Hescheler J. Spontaneous calcium oscillation in embryonic stem cell-derived primitive endodermal cells. Exp Cell Res. 1998;238:13–22. doi: 10.1006/excr.1997.3809. [DOI] [PubMed] [Google Scholar]
- 28.Sorimachi M, Morita Y, Nakamura H. Possible regulation of the cytosolic-free calcium concentration by Na+ spikes in immature Purkinje cells. Neurosci Lett. 1990;111:333–338. doi: 10.1016/0304-3940(90)90284-g. [DOI] [PubMed] [Google Scholar]
- 29.Spitzer NC, Lautermilch NJ, Smith RD, Gomez TM. Coding of neuronal differentiation by calcium transients. BioEssays. 2000;22:811–817. doi: 10.1002/1521-1878(200009)22:9<811::AID-BIES6>3.0.CO;2-G. [DOI] [PubMed] [Google Scholar]
- 30.Svendsen CN, Smith AG. New prospects for human stem-cell therapy in the nervous system. Trends Neurosci. 1999;22:357–364. doi: 10.1016/s0166-2236(99)01428-9. [DOI] [PubMed] [Google Scholar]
- 31.Thomas D, Tovey SC, Collins TJ, Bootman MD, Berridge MJ, Lipp P. A comparison of fluorescent indicators and their use in measuring elementary and global Ca2+ signals. Cell Calcium. 2000;28:213–223. doi: 10.1054/ceca.2000.0152. [DOI] [PubMed] [Google Scholar]
- 32.Watt SD, Gu X, Smith RD, Spitzer NC. Specific frequencies of spontaneous Ca2+ transients upregulate GAD 67 transcripts in embryonic spinal neurons. Mol Cell Neurosci. 2000;16:376–387. doi: 10.1006/mcne.2000.0871. [DOI] [PubMed] [Google Scholar]
- 33.Wong ROL, Chernjavsky A, Smith SJ, Shatz CJ. Early functional neural networks in the developing retina. Nature. 1995;374:716–718. doi: 10.1038/374716a0. [DOI] [PubMed] [Google Scholar]
- 34.Yuste R, Peinado A, Katz LC. Neuronal domains in developing neocortex. Science. 1992;257:665–669. doi: 10.1126/science.1496379. [DOI] [PubMed] [Google Scholar]