

Abstract
Gene expression microarrays provide a powerful new tool for studying complex processes such as brain aging. However, inferences from microarray data are often hindered by multiple comparisons, small sample sizes, and uncertain relationships to functional endpoints. Here we sought gene expression correlates of aging-dependent cognitive decline, using statistical profiling of gene microarrays in well powered groups of young, mid-aged, and aged rats (n= 10 per group). Animals were trained on two memory tasks, and the hippocampal CA1 region of each was analyzed on an individual microarray (one chip per animal). Aging- and cognition-related genes were identified by testing each gene by ANOVA (for aging effects) and then by Pearson's test (correlating expression with memory). Genes identified by this algorithm were associated with several phenomena known to be aging-dependent, including inflammation, oxidative stress, altered protein processing, and decreased mitochondrial function, but also with multiple processes not previously linked to functional brain aging. These novel processes included downregulated early response signaling, biosynthesis and activity-regulated synaptogenesis, and upregulated myelin turnover, cholesterol synthesis, lipid and monoamine metabolism, iron utilization, structural reorganization, and intracellular Ca2+ release pathways. Multiple transcriptional regulators and cytokines also were identified. Although most gene expression changes began by mid-life, cognition was not clearly impaired until late life. Collectively, these results suggest a new integrative model of brain aging in which genomic alterations in early adulthood initiate interacting cascades of decreased signaling and synaptic plasticity in neurons, extracellular changes, and increased myelin turnover-fueled inflammation in glia that cumulatively induce aging-related cognitive impairment.
Keywords: bioinformatics, gene expression, memory, synaptic plasticity, myelin, inflammation
Introduction
Brain aging processes are enormously complex phenomena that affect multiple systems, cell types, and cellular pathways, and eventually induce cognitive decline and increased risk of Alzheimer's disease (AD) (Landfield et al., 1992;Tanzi and Bertram, 2001). Several biological processes have been associated with normal brain aging and neurodegenerative conditions, including inflammatory responses (Rogers et al., 1996; Murray and Lynch, 1998; Hauss-Wegrzyniak et al., 2000; Andreasson et al., 2001;Finch et al., 2002; Gemma et al., 2002; Wyss-Coray and Mucke, 2002), oxidative stress (Carney et al., 1991; Butterfield et al., 1999;Bickford et al., 2000; Nicolle et al., 2001; Wang et al., 2001), reduced mitochondrial function (Nicotera and Orrenius, 1998; Wallace, 2001), and altered Ca2+ regulation (Landfield and Pitler, 1984; Michaelis et al., 1984; Gibson and Peterson, 1987; Khachaturian, 1989; Disterhoft et al., 1993; Franklin and Johnson, 1994; Lipton and Rosenberg, 1994; Foster and Norris, 1997;Nicotera and Orrenius, 1998; Verkhratsky and Toescu, 1998).
The triggers and consequences of these putative brain aging mechanisms are not well understood, although several are accompanied by altered gene expression (Rogers et al., 1996; Finch and Tanzi, 1997; Chen et al., 2000; Lee et al., 2000; Nicolle et al., 2001). Moreover, specific gene mutations are directly involved in age-dependent neurodegenerative disease (for review, see Price and Sisodia, 1998; Selkoe, 2001;Tanzi and Bertram, 2001). Consequently, gene microarray technology, which can monitor the parallel expression of thousands of genes (Schena et al., 1996; Lockhart and Barlow, 2001), appears to be a powerful new tool for investigating the complex processes of brain aging (Lee et al., 2000; Jiang et al., 2001).
Nonetheless, microarray approaches pose significant resource and bioinformatics problems. With only a few exceptions (Pletcher et al., 2002), microarray studies have not used the formal statistical analyses and sample sizes (power) necessary to estimate expected false positives or detect moderate changes in expression. Thus, given the large multiple-comparison error anticipated in microarray analyses (Miller et al., 2001), both false positive (type I) and false negative (type II) errors are often high. As corollaries, the statistical reliability of microarray results is often clouded, and many potentially important processes have likely been overlooked (Watson et al., 2000; Miller et al., 2001; Becker, 2002). Additionally, it has frequently been difficult to assess which of many hundreds of observed gene alterations are potentially relevant to functional endpoints.
Here we used the advantages of microarray analyses to identify novel brain aging processes with potential relevance to cognitive decline. We addressed the key problems of reliability, sensitivity, and functional relevance noted above by using adequately powered statistical profiling and a strategy of correlating the expression of each gene with a defined functional endpoint (memory performance). Several studies have previously found links between specific genes and plasticity or memory (Gall et al., 1990; Steward et al., 1998; Guzowski et al., 2000; Silva et al., 2000; Cavallaro et al., 2001; Kandel, 2001; Luo et al., 2001,2002; Nicolle et al., 2001). However, this appears to be the first study to correlate massively parallel expression microarrays with behavior across individual subjects. Collectively, the data suggest a new integrative model in which cascades of neuronal and glial processes interact cumulatively to induce aging-related cognitive impairment.
Materials and Methods
Subjects and behavioral testing
All procedures involving rats were performed in accordance with the guidelines set forth by the Institutional Animal Care and Use Committee. Male Fischer 344 rats aged 4 months (young,n = 10), 14 months (mid-aged, n = 10), and 24 months (aged, n = 10) were used in these studies. Animals were trained sequentially on two tasks, first in the Morris spatial water maze (SWM) and then in the object memory task (OMT). Overall, the training/testing sequence lasted 7 d, and hippocampal tissue was collected 24 hr later. Training or testing occurred on each day except for the second and third day of the 7 d sequence.
Morris spatial water maze
Methods used here for cognition assessment in the SWM, a task sensitive to both hippocampal function and aging, have been described previously (Norris and Foster, 1999). Briefly, rats were trained in a black tank, 1.7 m in diameter, that was filled with water (27 ± 2°C). Behavioral data were acquired with a Columbus Instruments tracking system. After habituation to the pool, animals were given cue training with a visible platform (five blocks of three trials, maximum of 60 sec per trial, 20 sec intertrial interval, and a 15 min interval between blocks). Rats remained in home cages under warm air after each block. Cue training was massed into a single day, and the criterion for learning was finding the platform on four of the last six trials. For all animals that met this criterion, spatial discrimination training was initiated 3 d later in which the escape platform was hidden beneath the water but remained in the same location relative to the distal cues in the room. Fifteen minutes after the end of spatial training, a 1 min duration free-swim probe trial with the platform absent was administered, during which crossings over the former platform site (platform crossings) were recorded to test acquisition, followed by a refresher training block. Retention for platform location was again tested 24 hr later using a second 1 min free-swim probe trial.
Object memory task
The OMT is also both sensitive to hippocampal function and affected by aging but is less dependent on physical strength and endurance (Markowska et al., 1998). On the afternoon of the final spatial maze probe trial, animals were administered a habituation session (15 min) in the empty mesh cage to be used for the OMT (63.5 × 63.5 cm). OMT training began 24 hr after habituation and consisted of a 15 min acquisition session during which two three-dimensional objects were placed at opposite sides of the cage, followed by two 15 min retention test sessions at 1 and 24 hr after training. During the acquisition session, the cage contained two sample objects (A and B), and the time spent actively exploring each object was recorded. After 1 hr, the rat was reintroduced into the cage, and the time spent exploring a novel object, C, relative to the familiar object, B, was recorded. On the 24 hr test, familiar object A was reintroduced and object B was replaced by a second novel object, D. Objects were randomized across individuals, and timed measures of exploration were used to calculate a memory discrimination index (DI) as follows: DI = (N −F)/T, where N is time spent exploring the novel object, F is time spent exploring the familiar object, and T is total time spent exploring the two objects. More time spent exploring the novel object (higher DI) is considered to reflect greater memory retention for the familiar object.
Tissue collection
Twenty-four hours after completion of the OMT testing, animals were anesthetized with CO2 gas and decapitated. The brains were rapidly removed and immersed in ice-cold, oxygenated artificial CSF consisting of (in mm): 124 NaCl, 2 KCl, 1.25 KH2PO4, 2 MgSO4, 0.5 CaCl2, 26 NaHCO3, and 10 dextrose. Hippocampi were removed, and the CA1 region from one hippocampus per animal was dissected by hand under a stereomicroscope. The CA1 tissue block from each animal was placed in a microcentrifuge tube and flash frozen in dry ice for RNA isolation. Microarray analyses were performed on hippocampal CA1 tissues from each of the same behaviorally characterized 30 animals (one chip per animal), but one chip was lost for technical reasons, leaving a data set of 29 microarrays (young = 9; mid-aged = 10; aged = 10). Each U34A rat chip (Affymetrix, Santa Clara, CA) contained 8799 probe sets (gene representations).
RNA isolation and Affymetrix GeneChip processing
Total RNA was isolated using the TRIzol reagent and following the manufacturer's RNA isolation protocol (Invitrogen, #15596). One milliliter of TRIzol solution was added to each tube containing the frozen tissue block, and the tissue was homogenized by 10 passages through an 18.5 ga syringe needle. After centrifugation, the RNA was precipitated from the aqueous layer, washed, and dissolved in RNase-free water. RNA concentration and integrity were assessed by spectrophotometry and gel electrophoresis. The RNA samples were stored at −80°C.
Gene expression analyses were performed using the Affymetrix GeneChip System. The labeling of RNA samples, rat GeneChip (RG-U34A) hybridization, and array scanning were performed according to the Affymetrix GeneChip Expression Analysis Manual (r.4.0, 2000). Each animal's CA1 subfield RNA was processed and run on a separate rat gene chip. Briefly, an average yield of 40 μg of biotin-labeled cRNA target was obtained from 5 μg of total RNA from each CA1 sample, of which 20 μg of cRNA was applied to one chip. The hybridization was run overnight in a rotating oven (Affymetrix) at 45°C. The chips were then washed and stained on a fluidics station (Affymetrix) and scanned at a resolution of 3 μm in a confocal scanner (Agilent Affymetrix GeneArray Scanner).
Microarray data analysis
Microarray suite software (MAS 4.0, Affymetrix) calculated the overall noise of the image (Qraw), which was highly similar across arrays in all three age groups (young: 21.81 ± 1.55; mid-aged: 21.25 ± 2.24; aged: 20.66 ± 2.06; NS). “All probe set scaling” was used to set overall intensities of different arrays to an arbitrary target central intensity of 1500. There was no significant difference in the scaling factor across ages (young: 1.58 ± 0.14; mid-aged: 1.46 ± 0.20; aged: 1.63 ± 0.16, NS).
The algorithms used to determine average difference expression (ADE) scores (expression level) and presence/absence calls are described in the Microarray Suite 4.0 Manual and formed the basis for determining expression (relative abundance) of transcripts and whether a particular transcript was reliably detectable, respectively.
Statistical analysis
The presence/absence calls and ADE scores for all probe sets on all 29 arrays were then copied from the MAS pivot table to an Excel 9.0 (Microsoft, SR-1) workbook. The data transformations, filtering, and most statistical analyses of our gene identification algorithm (see Results) were performed within Excel. Statistical tests were performed using a combination of Excel (Microsoft, v.9, SR-1) and SigmaStat (SPSS, v.2).
Absence calls. Each probe set on each chip had a “present,” a “marginal,” or an “absence” call. We considered a probe set present for the purposes of our analysis if, within at least one age group, it showed a present or marginal call in at least 40% of the chips.
Minimum–maximum. For the purposes of one phase of the filtering procedure (see Results), each probe set was normalized according to the formula:
| Equation 1 |
where x is ADE score, Xmin is the mean for the age group with the lowest ADE score, and Xmax is the mean for the age group with the largest ADE score. Thus, normalized mean values varied between 0 (lowest) and 1 (highest) for each probe set.
Standardization (Z-score). For the purpose of obtaining means within functional categories and graphing, data were normalized using the Z-score method:
| Equation 2 |
where X is the mean, and SD(x) is the SD of ADE across all age groups for an individual probe set.
Functional categorization by gene ontology. We used two methods for categorizing identified genes. One method assigned genes to broad functional categories that we defined on the basis of gene functions derived from literature searches (see Results), and one method relied on the category assignments in the gene ontology (GO) system. The Gene Ontology Consortium (www.geneontology.org/doc/GO.doc.html) maintains a controlled vocabulary database of functional descriptions for genes. These are divided into three families: biological process, cellular component, and molecular function. We searched the NetAffx site (www.affymetrix.com/analysis/index.affx) for GO terms associated with all unique known gene name/symbols (3789) for the entire RG-U34A chip and were able to associate 3540 of them with GO terms (GO numbers). We used the total list of GO terms within the biological process and molecular function categories to build custom GO functional trees (outlines) that reflected only the functional attributes (and their parent attributes) for the genes that were rated present in our study. The number of times a GO term (or group of terms) appeared at each sub-level of the GO tree was counted, and hierarchical sums were calculated (of the number of occurrences at or below each sub-branch). A similar procedure was performed separately for statistically identified upregulated and downregulated aging-dependent genes. To assess relative over- or underrepresentation of GO functional terms associated with identified genes, we used the binomial statistic. The ratio of “significantly increased (or decreased)/entire chip” formed the basis of the binomial statistic. For testing the null hypothesis, it was assumed that the ratio of identified aging-dependent genes to all genes at each functional level of the tree was similar to the ratio for the entire chip and that deviations of the binomial statistic (at p ≤ 0.05) from that proportion reflected significant over- or underrepresentation of identified genes at that level of the GO tree (Pletcher et al., 2002).
Results
Behavioral results
During cue training in the SWM, all animals were able to locate the visible escape platform (the criterion used for adequate sensorimotor performance) and were then trained on the hidden platform spatial task. During acquisition, aged animals learned the task more slowly (longer latencies) than mid-aged or young but performed similarly to young and mid-aged animals on the 1 hr probe retention test (data not shown). However, an aging-dependent decrease in 24 hr retention, as measured by platform crossings (one-way ANOVA;p ≤ 0.01), was observed on the 24 hr retention probe trial (Fig. 1). Post hocanalysis indicated that young and mid-aged animals exhibited more platform crossings relative to aged animals on this test but did not differ from each other. In the OMT, aged animals performed as well as young or mid-aged on the 1 hr retention test (data not shown), but there was a significant age-related decline in recall (one-way ANOVA;p ≤ 0.001, for the main effect of age) on the 24 hr test (Fig. 1). At 24 hr, young and mid-aged groups were significantly different from the aged group but not from one another (young vs aged:p < 0.001; mid-aged vs aged: p < 0.05; young vs mid-aged: NS, Tukey's post hoc test).
Fig. 1.

Age-dependent impairment of memory performance. Aged animals exhibited significantly reduced performance on 24 hr memory retention on both the SWM and OMT tasks in comparison with either young or mid-aged animals (one-way ANOVA and Tukey'spost hoc). The young and mid-aged animals did not differ from each other on either task. On the SWM task, higher platform crossings (PC) reflects greater retention of the spot where the platform was previously located. For the OMT, a higher discrimination index (DI) reflects greater retention of the previously explored object and resultant increased exploration of the novel object (see Materials and Methods). *p < 0.01; **p≤ 0.001.
Gene identification algorithm
To identify aging and cognition-related genes (ACRGs) while managing multiple comparison error, we used a multistep gene identification algorithm comprising a priori filtering, ANOVA, and correlation testing (Fig. 2). The filtering was aimed at reducing the total comparisons by excluding unnecessary or less interesting gene probes. Because the number of expected false positives equals the p value percentage of the total number of comparisons tested (tests of individual genes), reducing total comparisons is useful for managing false positive error. That is, if 10,000 genes are tested at the p < 0.05 level of significance, 500 (5%) can be expected to be positive by chance alone (Miller et al., 2001). Such high false positives can rival or obscure true positives and thereby detract from statistical confidence. Therefore, reducing the number of total comparisons on the basis of clearly specified a priori filters can be statistically advantageous.
Fig. 2.

Filtering and statistical test algorithm for identifying aging- and cognition-related genes (ACRGs). The initial set of 8799 gene probe sets contained on the HG-U34A gene chip was reduced according to a priori filters before statistical testing to decrease multiple comparisons and expected false positives. Gene probe sets were removed if they were called absent (1a), if they were ESTs (1b), or if the difference between the young and aged groups did not comprise at least 75% of the maximal normalized age differences (1c). Each of the remaining 1985 (gene) probe sets was then tested by ANOVA across the three age groups (n = 9–10 per group) to determine whether it changed significantly with aging (2). Each of the 233 genes that changed significantly with age (p ≤ 0.025) was then tested across all animals (n = 29) for significant behavioral correlation with the OMT and SWM 24 hr retention values (Pearson's;p ≤ 0.025). Age-dependent genes that correlated with either or both tasks were identified as primary ACRGs. Additionally, 11 genes that were not correlated behaviorally were included as ACRGs (3b) because their age-dependent alterations were significant at a much higher confidence level (ANOVA;p ≤ 0.001).
Data filtering step
We reduced the total gene probe sets to be tested according to three a priori filters (Fig. 2,1a–c). First, all probe sets rated “absent” (4118) by our criteria (see Materials and Methods) were excluded. (However, it should be emphasized that a substantial number of low-abundance neuronal molecules that are known to be expressed in hippocampus, including many ion channels and membrane receptors, were rated absent in this study.) Second, all present transcript sets representing unannotated “expressed sequence tags” (ESTs) (1213) and control probe sets (60) also were excluded. Although ESTs contain true positives, they add comparisons to be managed without providing further insight into known pathways (ESTs are being analyzed separately in a similar analysis). Third, we reasoned that genes that changed with aging at the mid-aged point and then reversed would be less reliable biomarkers of “progressive aging” than genes that changed by mid-age and stabilized or changed further in the aged group. Therefore, we also excluded genes in which the young and the aged groups were not different by at least 75% of the maximal difference among groups. This criterion excluded an additional 1483 probe sets (Fig. 2). (It should be noted that although such “reversing” genes may not be as useful as monotonically altered genes for biomarkers, they might reflect important initiating mechanisms that are subsequently offset by compensatory changes. Therefore, the set of ANOVA-significant genes excluded from analysis by this filter is included on-line). These filters retained 1985 gene probes. If the original 8799 gene probes had all been tested at, for example, the p≤ 0.025 α level, ∼220 false positives would have been expected (2.5% of 8799). However, by using defined a priori filters to decrease the total genes tested, we reduced the absolute number of expected false positives by >75% (to ∼50). Thus, this approach represents a useful adjunct to rigorous statistical corrections for multiple comparison error (Bonferroni correction) (Benjamini et al., 2001; Miller et al., 2001).
Group statistical testing step (ANOVA)
In this second main step of the algorithm (Fig. 2, 2), each of the retained 1985 gene probes was tested by one-way ANOVA across the three age groups (n = 9–10 per group) for a significant effect of aging using a relatively rigorous pvalue (p ≤ 0.001). To estimate the fraction of observed total positives expected to be false because of multiple comparison error, we used a modified version of the false discovery rate (FDR = expected false positives/observed positives) (Benjamini et al., 2001). At p ≤ 0.001, 2 false positives are expected in 1985 comparisons (i.e., 0.001 × 1985), but 77 total positives were observed. Thus, the FDR was 2 of 77 = 0.026, indicating that only 2.6% of the 77 observed total positives should be positive by chance alone and that any single positive result had a 2.6% chance of being a false positive. This FDR compares very favorably with the p ≤ 0.05 α level conventionally accepted for statistical significance and shows that the sample sizes used provided adequate statistical power and sensitivity to detect many more positives than would be expected by chance alone.
On the basis of this favorable FDR, we operationally defined these 77 ANOVA-positive genes (at p ≤ 0.001) as a subset of genes that changed with aging with high statistical reliability. Nonetheless, there are also important advantages to identifying larger sets of genes using less stringent p values, even at the expense of some statistical confidence. One advantage is fewer false negatives (less type II error). Furthermore, the lower stringency is partly offset by the increased confidence gained via detection of co-regulation among larger numbers of functionally related genes (Mirnics et al., 2000). Finally, a third advantage is that a more comprehensive picture of the associated processes/pathways is generated by larger sets of genes. Consequently, we also assessed the FDR using three less stringent p values: p ≤ 0.05,p ≤ 0.025, and p ≤ 0.01. Atp ≤ 0.05, 348 genes were found positive, but 99 were expected to be false positives, yielding an FDR of 99 of 348 = 0.29. At p ≤ 0.025, 50 false positives are expected in 1985 tests, but 233 total positives were found, yielding an FDR of 50 of 233 = 0.21. At p ≤ 0.01, ∼20 genes should be found positive by chance alone among the 1985 transcripts tested, but 145 positives were observed, yielding an FDR of 20 of 145 = 0.14. To balance the competing advantages of a stringent and a relaxedp value, we selected the genes obtained at thep ≤ 0.025 as the primary set of aging biomarkers for use in the next step of the analysis, the behavioral correlation. Thisp value level provided an intermediate FDR (0.21) and number of genes (233) for functional analysis. (However, all genes that changed at p ≤ 0.05 are posted on the web site.)
Cognitive performance correlation step (Pearson's test)
In the next step (Fig. 2, 3a,b), we used Pearson's test (p ≤ 0.025) to test for correlation of each of the 233 age-dependent biomarker genes with memory performance. Across all 29 animals, the expression level of each gene was tested for correlation with cognitive performance in both the OMT and SWM. However, these correlation tests were not fully independent of the previous ANOVA test that selected the aging-dependent genes to be tested (i.e., genes that changed with aging would be more likely to show a chance correlation with performance, because the latter also changed with aging). Thus, it was not feasible to calculate an independent FDR estimating false positives among the behavioral correlation results. Despite this, however, correlated genes clearly seemed more likely to be relevant to cognitive decline than noncorrelated genes. Additionally, given the decrease in cognition with age, genes downregulated with aging could only correlate positively, and genes upregulated with aging could only correlate negatively, with performance. Consequently, one-tailed tests were used.
Gene expression was also tested for correlation with performance within the aged group alone. This approach can reveal expression fluctuations associated with different degrees of impairment in animals of the same age. (In addition, because this correlation is relatively independent of the aging variable, it allows an FDR to be calculated.) Each aging biomarker gene was tested for correlation with 24 hr memory performance on the OMT in the aged group. The OMT was selected over the SWM for this test because it showed a more appropriate dispersion of performance among aged animals. Correlation tests limited to subjects in the aged group (n = 10) of course had considerably less power than tests across all three groups (n = 29), and therefore the criterion for significance was set atp ≤ 0.05.
Aging- and cognition-related genes
Of the 233 genes found to differ with aging at thep ≤ 0.025 level, 161 (69%) also correlated significantly (at the p ≤ 0.025 level) with either the OMT or SWM across all age groups. These genes were defined as the primary set of ACRGs. Of these 161, 84 (51%) were correlated with both tasks. Of the 161 genes that were correlated significantly with memory performance on at least one task, 64 (∼40%) were downregulated with aging (and positively correlated with performance) and 97 (∼60%) were upregulated with aging (and negatively correlated with performance). Of the core subset of 77 genes identified at the higher confidence level (p ≤ 0.001), 66 (86%) were among the 161 correlated with behavioral performance on at least one task, and of these, 49 (74%) were correlated with both tasks. Eleven of these 77 genes were not correlated with behavior atp < 0.025, but because of their higher reliability as aging markers were included with the 161 ACRGs (for a total of 172 ACRGs) in the functional categorization step (see below). Of these 172, we were unable to functionally categorize 6 transcripts, and 20 other transcripts also were deleted as duplicate gene representations, leaving a total of 146 primary ACRGs. In addition, 8 of 65 (12%) of the downregulated ACRGs but 25 of 81 (31%) of the upregulated ACRGs were correlated with retention performance on the OMT within the aged group only (indicated by asterisks in all tables). The overall FDR in the aged group-only correlation for ACRGs was 0.25. Examples of the correlation patterns with performance across all 29 animals for five ACRGs highly correlated in each direction are shown in Figure3.
Fig. 3.

Correlation of gene expression and OMT performance across all animals. Five representative examples of high positive correlations with OMT scores among genes that decreased with aging (A) and five examples of high negative correlations among genes that increased with aging (B). Standardized expression values are shown on the left y-axis and standardized OMT performance scores (DI) are plotted on the x-axis. Some points are obscured by overlapping values for expression or retention. OMT retention performance increases with increasingly positive (leftward) values of the graph. Note the clustering of gene expression values for aged animals toward the low performance (right) side.
Functional categorization
We assigned the 146 primary ACRGs to functional categories by two approaches. In the first approach, we used extensive literature searches in PubMed and other databases, including SwissProt, Trembl, NetAffx, GeneCards, Pfam, and InterPro to characterize each ACRG and assign it a broad functional category. Many of the same categories appeared to fit multiple ACRGs. In the second approach, we relied on the GO database. Although the GO system provides information that can be used to quantify over- or underrepresentation of identified genes relative to total microarray genes within a functional category (see Materials and Methods), it does not provide a functional designation for all genes. Therefore, our functional interpretations relied primarily on the first approach. Using the first approach, we identified 7 downregulated and 10 upregulated functional categories of ACRGs (Table 1). Some categories are broader than others, and some headings are modified by parenthetical characteristics that apply to a majority of ACRGs in that category. Of course, many of the genes fit within multiple categories.
Table 1.
Categories of ACRGs
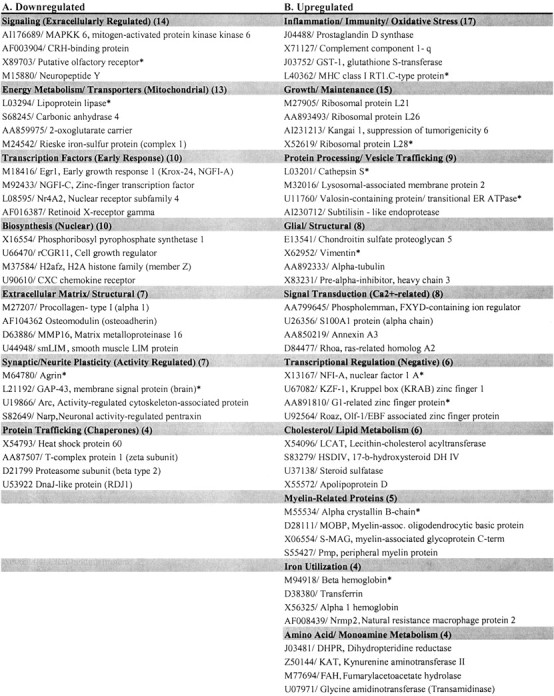 |
Four examples of ACRGs with GenBank numbers and brief descriptions in each of 7 downregulated and 10 upregulated functional categories to which ACRGs were assigned. Total ACRGs in each category are shown in parentheses. All ACRGs with full data on mean ± SEM expression, ANOVA p values, and correlated behavioral tasks are shown in Tables 3 and 4 at www.jneurosci.org. Asterisks indicate correlated with memory in the aged group alone.
Four ACRG examples for each category identified by the first approach are shown in Table 1. The examples were selected in each category first from ACRGs correlated with both tasks and then by lowest ANOVA p value. Selected levels within the GO biological process and GO molecular function categories (to which ACRGs were assigned through the GO system) are shown in Table2. The full set of 146 primary ACRGs identified here, and their assigned categories through the first classification approach, are shown in on-line Tables 3 and 4 (those correlated with both behavioral tasks are listed at the top of each category and ranked by ANOVA p value for aging changes). The set of all potential aging biomarker genes (those that changed with aging by ANOVA at p ≤ 0.05 but did not meet ACRG criteria) is posted in on-line Table 5 available atwww.jneurosci.org).
Table 2.
Results of Genome Ontology (GO) analyses for ACRGs
 |
Only selected levels are shown (with GO identification numbers in parentheses). A, GO biological process. B, GO molecular function. Total, the total number of associations on the entire chip; the number of associations among upregulated (Up) and downregulated (Down) ACRGs. Red, Significantly underrepresented; green, significantly overrepresented; blue, significant in both downregulated and upregulated categories.
Categories of downregulated genes
Multiple genes related to energy metabolism, particularly to mitochondrial function and the electron transport chain (Rieske's iron-sulfur protein, NADH dehydrogenase) were downregulated with aging (Table 1A, on-line Table 3). Similarly, many more energy metabolic genes, including those involved in catabolism of glucogenic amino acids, were downregulated with aging (on-line Table 5A).
One of the most intriguing downregulated categories comprised ACRGs related to activity-dependent synaptic/neurite plasticity (agrin, Gap-43, Narp, Arc, Vgf) (Table 1A, on-line Table 3), many of which have been linked previously to synaptogenesis, neurite remodeling, plasticity, or memory (Biewenga et al., 1996; Steward et al., 1998; Guzowski et al., 2000; Bezakova et al., 2001; French et al., 2001). However, Gap-43 appears to be one of the few, or possibly the only, of these yet reported to change with aging and AD (Coleman et al., 1991). Importantly, several of these genes (agrin, Narp) are also significant components of the extracellular matrix (ECM). Because other major ECM elements including collagen IA, were also downregulated (Table 1A), the results suggest genomically mediated erosion or reorganization of the ECM.
Many other neural activity-dependent genes, including immediate early response genes (IEGs) in the transcription (Egr1, NGFI-C) and signaling (MAPKK6) categories were downregulated ACRGs (Table 1A, on-line Table 3). In addition, multiple ACRGs important for biosynthesis (nucleoporin, histone H2AZ) and protein trafficking (chaperones: Hsp60, DnaJ-like homolog) were also downregulated with aging as were specific neuronal marker and signaling genes (receptors, neuropeptide Y) (Table1A, on-line Table 3). Decreased chaperone capacity could have substantial implications for protein aggregation and vulnerability to AD.
Categories of upregulated genes
Not unexpectedly, many upregulated ACRGs were associated with glial functions, inflammation, immunity, and oxidative stress (Table1B, on-line Table 4). However, several unanticipated findings included extensive upregulation of genes encoding proteins for myelin synthesis and cholesterol and lipid metabolism (Table 1B, on-line Table 4). Several genes important for lipid β-oxidation and free fatty acid (FFA) catabolism (carnitine palmitoyltransferase, acyl-CoA oxidase) (on-line Tables 4, 5B), the primary pathway for FFA catabolism, were upregulated. The increase in myelin synthesis programs could entail elevated lipid turnover. Recent studies show that stimulation of myelin synthesis programs in oligodendrocytes is associated with induction of genes for both myelin proteins and lipogenic pathways (Nagarajan et al., 2001).
Consistent with the upregulation of myelin-related proteins, moreover, was the increased expression of genes related to protein/vesicle trafficking, including SNARE (N-ethylmaleimide-sensitive factor attachment protein receptor) proteins (Table 1B, on-line Table 4). Although several of these molecules are associated with neuronal vesicle transport and fusion, they are also known to play a major role in transport of myelin vesicles in oligodendrocytes (Madison et al., 1999). In addition, myelin is normally degraded to FFAs through the endosomal–lysosomal pathway and cathepsin S, which also was upregulated (Table 1B, Protein Processing), is particularly important in the processing of antigenic myelin fragments (Nixon et al., 2000; Dickinson, 2002). Notably, lysosomal alterations appear to be important in aging and AD (Bi et al., 2000; Nixon et al., 2000).
Expression was also upregulated for multiple genes encoding enzymes related to metabolism of the ketogenic/glucogenic amino acids, tyrosine, phenylalanine, and tryptophan (DHPR, KAT, FAH) (Table 1B, Amino Acid), which can be used for either energy metabolism or lipogenesis. Moreover, upregulation of DHPR, which catalyzes the formation of a critical cofactor (tetrahydrobiopterin) for tyrosine and monoamine synthesis, together with concomitant upregulation of MAO-B (on-line Table 5), suggests greater monoamine turnover. Another unexpected observation was a consistent upregulation of genes involved in iron utilization or storage [globins, transferrin, Nramp2 (Table1B); ferritin (on-line Table 5B]. This may be related to increased oxygen utilization, oxidative stress, or inflammatory responses in activated glia, because iron accumulation is associated with multiple age-related neurodegenerative conditions.
As noted, there also was massive upregulation of genes encoding major histocompatibility complex (MHC) class I antigen presenting molecules, as well as numerous other inflammatory/immune/oxidative stress molecules [GST (Table 1B, on-line Tables 4, 5B)]. ACRGs in the inflammation category exhibited some of the most robust monotonic changes with aging seen in this study (most were significant at or below the p ≤ 0.001 criterion) (on-line Table 4). In addition, the DHPR product, tetrahydrobiopterin, is also an essential cofactor for nitric oxide synthase (Boyhan et al., 1997); therefore, oxyradicals formed from increased nitric oxide could play a major role in inflammatory neuronal damage (Calingasan and Gibson, 2000; Bal-Price and Brown, 2001).
Astrocyte reactivity and other glial markers are well recognized to increase in the aged rodent and human hippocampus (Landfield et al., 1992; Finch and Tanzi, 1997), and the present data confirm upregulation of several glial marker genes [vimentin, GFAP (Table 1B, on-line Table 4)]. Furthermore, genes for extracellular components of astroglial scars [proteoglycans, fibronectin (Table 1B, on-line Tables 4, 5B)] also were upregulated.
Several signal transduction genes related to calcium-regulating or G-protein-coupled pathways also were upregulated ACRGs (Table 1B, on-line Table 4). In particular, S100A1 modulates Ca2+-induced Ca2+ release (Treves et al., 1997; Fulle et al., 2000), and phosphatidylinositol 4-kinase (PI 4-kinase) catalyzes a key step in IP3 production. Phospholemman (Table 1B), which regulates ion exchange, inhibits the Na+/Ca2+exchanger (Zhang et al., 2003), and the mitochondrial voltage-dependent anion channel (VDAC), which plays a central role in apoptosis, also appears to mediate Ca2+ flux into mitochondria (Gincel et al., 2001). Genes for other Ca2+-binding proteins [S100A4 (on-line Tables 4, 5B)] and annexin, a Ca2+-dependent, membrane-binding molecule (Table 1B), also were upregulated ACRGs.
In addition, there was wide upregulation of ACRGs related to growth and protein synthesis (Table 1B, on-line Table 4). This upregulation may be linked to the apparently major activation of MHC, proteoglycan, and myelin synthesis in glial compartments. The algorithm also identified a number of upregulated transcription factors, including KZF-1, Roaz, and members of the NFI family (Table 1B, Transcriptional Regulation), which can function as broadly acting negative transcriptional regulators.
Gene ontology: downregulated biological process ACRGs (Table 2A)
In the GO analysis, there was a significant overrepresentation of G-protein coupled processes among downregulated ACRGs, indicating that a greater number of genes in this category decreased with aging than would be expected relative to the experiment-wide proportion of genes that decreased with age. This agrees with previous work describing decreased G-protein activity with age in vivo (Roth et al., 1995) or in vitro (Blalock et al., 1999). An overrepresentation of downregulated ACRGs was also found in categories related to developmental process, second messenger signaling, and electron transport. Conversely, downregulated ACRGs in the categories of lipid metabolism (particularly lipid biosynthesis) and protein metabolism were significantly underrepresented. These results are consistent with the large numbers of downregulated ACRGs in the energy, signaling, and synaptic plasticity categories in the first categorization approach and the upregulation of lipid and protein processing ACRGs (Table 1B).
Gene ontology: upregulated biological process ACRGs (Table 2A)
For genes upregulated with age, there was a significant overrepresentation of ACRGs in stress response and inflammatory categories. Conversely, upregulated ACRGs in several other categories were significantly underrepresented, including carbohydrate and phosphate metabolism. These results also are generally consistent with the upregulation of inflammatory/immune ACRGs and the downregulation of energy ACRGs identified through the first categorization (Table 1).
Gene ontology: molecular function categories (Table 2B)
Downregulated ACRGs in categories of lipases, carbohydrate kinases, monooxygenases and oxidoreductases, and transcription factors were overrepresented. Upregulated ACRGs related to defense/immunity, vesicle transport, cytokine function, growth factor secretion, serine protease activity, and heavy metal binding also were significantly overrepresented.
Relationship to fold change
The large majority of microarray analyses to date have used fold-change criteria to identify changes in expression. However, apart from the statistical issues raised by these approaches (Miller et al., 2001), the 1.7- to twofold change detection criteria commonly used are relatively insensitive, particularly for identifying the moderate changes that might be expected in normal biological processes such as aging. On the basis of mean fold-changes between the young and aged groups, <15% of our results would have been detected by the twofold-change criterion used in many microarray studies (on-line Tables 3, 4). Furthermore, the rank order of group mean fold-change correlated only very modestly (r2 = ∼0.20) with that ofp values on the ANOVA for all ACRGs.
Age course of gene expression changes
Importantly, using an experimental design with three age groups elucidated the general chronological patterns of age-dependent change (Fig. 4). ACRGs could be classified by whether 75% of the maximal change occurred between the young and mid-aged groups (Yng to Mid), the mid-aged and aged groups (Mid to Age), or the young and aged groups (Monotonic).
Fig. 4.

Age course of genes altered with aging.A, Chronological aging patterns for the mean expression values of all genes in the five representative functional categories containing the most ACRGs downregulated with aging (Table 1A, on-line Table 3). The expression of each gene was standardized (see Materials and Methods) before category mean values were calculated. Additionally, ACRGs were classified on the basis of the two age points between which 75% of the expression change occurred. Note that most categories of downregulated ACRGs exhibited ≥75% mean change by the mid-aged point (Yng to Mid), tending to level off between the mid-aged and aged groups. However, many downregulated genes also showed a more monotonic pattern (Yng to Age). No category showed a predominantly mid to aged pattern of change. Pie chart inset: Relative distribution of chronological patterns of change for all individual downregulated ACRGs. B, Chronological aging patterns for the mean expression changes of all genes in the five largest functional categories of upregulated ACRGs (Table 1B, on-line Table 4). Calculations and nomenclature as in Figure 4A. Note that in comparison with downregulated genes (A), more upregulated genes (B) exhibited continuing change between mid life and late life (e.g., a monotonic pattern) (pie chart insets).
Many downregulated ACRGs, in particular, exhibited their greatest mean change in expression between the young and mid-aged points. Less than 50% showed a monotonic pattern (Fig. 4A, pie chart inset). In contrast, >50% of upregulated ACRGs showed a monotonic age course, with change beginning between the young and mid-aged points and continuing to increase between the mid-aged and aged points (Fig.4B, pie chart inset). Interestingly, only a few scattered upregulated or downregulated genes showed a predominantly mid to aged change pattern (Fig. 4A,B, pie charts). Thus, nearly all genomic alterations began before midlife, and many, particularly among upregulated ACRGs, continued to advance between midlife and late life.
Strongest correlations with memory performance
To determine which processes were most closely correlated with memory performance, we calculated the percentage of genes in each of our functional categories that were correlated significantly (atp ≤ 0.025) with both memory tests. We reasoned that because each test is subject to its own error and contributions from noncognitive performance factors, genes that correlated with both tasks were more likely to be associated consistently with cognitive processes.
More upregulated (42) than downregulated (29) ACRGs were correlated with both behavioral tasks. Among downregulated functional categories, those with the highest percentages of ACRGs correlated with both tasks were the energy (9 of 13, 69%), protein trafficking (3 of 4, 75%), and biosynthesis (5 of 10, 50%) categories (on-line Table 3). Among upregulated categories, those with the highest percentages of ACRGs correlated with both tasks were the inflammation/immunity/oxidative (13 of 17, 76%), signal transduction (Ca2+-related) (6 of 8, 75%), and myelin-related (3 of 5, 60%) categories (on-line Table 4). However, subsets within larger categories in some cases showed a notably higher percentage than the overall category [(on-line Table 3) ECM subset of the ECM/structural category, 3 of 5 or 60%]. The criterion of highest percentage ACRGs correlated with retention within the aged group alone was used to identify two additional categories, the downregulated synaptic plasticity (activity regulated) category (43%) (on-line Table 3) and the upregulated protein processing/vesicle trafficking category (44%) (on-line Table 4).
Discussion
Novel processes associated with functional brain aging
The present studies used well powered statistical analyses and a strategy of correlating gene expression profiles with behavioral endpoints to identify a wide range of aging- and cognition-related genes. Some of the identified ACRGs were associated with processes that have been implicated previously in brain aging or AD, including inflammation, oxidative stress, glial activation, mitochondrial/metabolic dysfunction, protein processing, and some growth factors. However, many other ACRGs identified here have not been previously linked to normal brain aging or cognitive decline and therefore appear to be novel biomarkers of functional brain aging. The processes associated with these novel ACRGs included downregulation of synaptic structural plasticity, extracellular matrix formation/turnover, activity-regulated signaling, and transcription, biosynthesis, and protein chaperone functions (Table 1A, Fig.4A), and concomitant upregulation of myelin turnover, cholesterol synthesis/transport, lipid metabolism, vesicle trafficking, cytoskeletal reorganization, iron utilization, tyrosine/tryptophan/monoamine metabolism, protein synthesis, transcriptional regulation (negative), and signal transduction (especially involving Ca2+ regulation, e.g., phospholemman, PI 4-kinase, S100A1, annexin A3). Although a few scattered molecules within several of these novel categories of ACRGs have been found previously to change with brain aging (e.g., c-Fos, Gap-43, KAT, some chaperones), the present findings of co-regulation among numerous related genes provide essentially the first evidence implicating many of these larger functional processes in normal brain aging and cognitive decline.
Implications for theories of brain aging
Brain expression of a number of genes is known to change with aging (Finch and Tanzi, 1997; Lee et al., 2000). However, the present data indicate that many more genes and gene programs than previously thought may be altered. Additionally, the present studies indicate that reasonably high statistical confidence can be associated with this evidence of widespread alterations in expression, particularly for co-regulated ACRGs. Importantly, nearly all of the expression alterations began before midlife (Fig. 4) and therefore appear to be regulated rather than nonspecific responses to generalized senescent deterioration of the brain. Furthermore, few if any of these pre-midlife changes seem to reflect early developmental changes, given that most continued to advance after midlife. ACRGs also were identified by correlation with cognitive decline that did not develop until late life. Finally, the young group, at 4 months of age, was fully mature.
Genomic regulation by itself does not constitute sufficient evidence that brain aging is “programmed” or evolutionarily selected. Instead, altered regulation could be a response to subtle early random damage (e.g., molecular errors, oxidative stress) or reflect pleiotropic genomic effects that are adaptively controlled until adulthood (Austad, 1999). Nonetheless, the wide extent of genomic orchestration of brain aging seen in early adulthood here will have to be addressed by aging theories.
Functional implications
By the criteria for strongest correlation (highest percentage ACRGs correlated with both tasks or with performance in the aged group), the categories of energy metabolism, protein trafficking, biosynthesis, a subset of ECM, and synaptic plasticity (downregulated) (Table 1A, on-line Table 3), and of inflammation, signal transduction (Ca2+-related), myelin, and protein/vesicle trafficking (upregulated) (Table 1B, on-line Table 4) were most closely correlated with cognitive impairment. Taken together, these functionally correlated categories appear to reflect patterns of metabolic and biosynthetic involution and reduced synaptogenesis in neurons, in parallel with elevated myelin turnover, phagocytosis, and inflammation in glia. Although correlation alone does not demonstrate causation, it fulfills a key prediction of a causal relationship (i.e., that two causally linked variables will covary) and consequently can substantially focus the search for causal factors. Thus the functionally correlated age-dependent processes identified here likely represent particularly good candidates for factors that impact memory decline. At the least, they clearly represent potentially valuable early biomarkers of functional brain aging. Because the genomic alterations apparently precede measurable cognitive impairment (compare Figs. 1, 4), however, any deleterious cognitive impact of these expression changes presumably depends on cumulative actions between mid and late life.
In addition, several of the observed expression changes may have implications for functions other than cognition. For example, reductions in mitochondrial/biosynthetic functions and protein folding/chaperoning (Table 1A, on-line Table 3) or increases in oxidative stress, inflammation, and Ca2+signaling (Table 1B, on-line Table 4) could be associated with increased vulnerability to apoptosis. In particular, the increased expression of the mitochondrial VDAC (Table 4) seems to have major implications for release of apoptogenic proteins.
Behavioral arousal and activity-regulated genes
Many of the downregulated ACRGs are IEGs that are highly responsive to neural activity, stress, and arousal and are correlated with synaptic plasticity (Gall et al., 1990; Steward et al., 1998;Guzowski et al., 2000; French et al., 2001). Aspects of memory consolidation are also arousal-dependent (McGaugh, 2000). Thus, because the training procedures are highly arousing, expression of some activity-regulated ACRGs may well have remained elevated 24 hr after the last retention test, when brain samples were collected. This suggests that age differences and correlation with memory for these ACRGs may be detectable only under arousing but not baseline conditions.
Myelin turnover as an inflammatory trigger
Clearly, a critical unresolved question is what triggers the widespread neuroinflammatory response seen in brain aging and AD. Although oxidative stress is one important possibility (Gemma et al., 2002), a new candidate mechanism, demyelination, is suggested by the findings here that genes for myelin and cholesterol synthesis were upregulated in normal brain aging (Table 1B, on-line Table 4). That is, because upregulation of myelin synthesis programs in adult animals is often stimulated by demyelination (Kristensson et al., 1986), the myelin program activation seen here might well be a compensatory response to an underlying demyelinating process. Myelin fragments are extremely potent antigens for triggering autoimmunity and thus could account for the major increases observed in MHC antigen-presenting molecules, cytokines, and other inflammation/phagocytic-related factors (Table 1B, on-line Tables 4, 5B). Furthermore, because elevation of some proinflammatory cytokines (e.g., IL-18) (on-line Table 4) can induce hypomyelination (Corbin et al., 1996), inflammation might well exacerbate the initial demyelinating process, thereby creating an accelerating positive feedback loop between demyelination and inflammation. A similar low-grade demyelination (with or without compensatory activation of myelin programs) could also account for the hypomyelination that accompanies human brain aging (Golomb et al., 1995). Additionally, the increased cholesterol synthesis/transport accompanying myelin synthesis might contribute separately to functional decline, because cholesterol metabolism has recently been implicated in AD (Puglielli et al., 2001; Petanceska et al., 2002). Thus we suggest that a chronic demyelinating process and activation of myelin and cholesterol synthesis may act as triggers for inflammation in the aged brain.
Neuronal triggers of demyelination
This suggestion, in turn, raises the question of what might initiate the demyelinating process. Interestingly, both reduced mitochondrial function (Kalman et al., 1997) and reduced neuronal activity (Demerens et al., 1996) are sufficient to induce demyelination. Widespread evidence was found here of decreased mitochondrial function (Table 1A, on-line Table 3). In addition, genes for GluR5–2 and KAT, which both favor synaptic inhibition (Vignes et al., 1998; Moroni, 1999), were upregulated ACRGs (Table 4), and the product of KAT, kynurenic acid, increases with aging (Finn et al., 1991; Moroni, 1999). Electrophysiological data also support the conclusion that glutamatergic and adrenergic transmission are decreased with aging (Barnes, 1994; Bickford et al., 2000). Conceivably, either reduced energy metabolism or neuronal activity could trigger demyelination, perhaps by impairing synaptogenesis or axonal maintenance, but other pathways are obviously possible.
Ca2+ regulation
Elevated intracellular Ca2+concentrations can also reduce neuronal activity by activating inhibitory Ca2+-dependent conductances, and several Ca2+-regulating genes were upregulated ACRGs, including phospholemman (Zhang et al., 2003), PI 4-kinase, and S100A1, which interacts with the ryanodine receptor (RyR) to increase Ca2+-induced Ca2+ release (Treves et al., 1997; Fulle et al., 2000). Intracellular Ca2+ release also has been found to be enhanced in some AD models (Ito et al., 1994;Mattson et al., 2000). In addition, although many Ca2+ channel subunits were rated “not present” (see Results, Data filtering), L-type Ca2+ channel availability appears increased with aging (Thibault and Landfield, 1996), and the L-type Ca2+ channel is closely coupled to the RyR (Chavis et al., 1996). Together, these changes could amplify Ca2+ influx and release in aged hippocampal neurons, thereby dampening neuronal responsiveness and synaptic plasticity (Disterhoft et al., 1993; Foster and Norris, 1997;Thibault et al., 2001).
New model of functional brain aging
A more comprehensive and complex picture of functional brain aging emerges from these microarray analyses. On the basis of this overview, we suggest a new integrative model of aging-related cognitive decline (Fig. 5). In this model, alterations in neuronal activity or metabolism inhibit neurite growth that, in turn, triggers a demyelination process and an inflammatory cascade. Together, these neuronal and glial processes eventually impair memory. The sequential cascades hypothesized in Figure 5, of course, represent only one of numerous possible models. Nonetheless, because these microarray analyses identified many novel potential cause and effect interactions in aging, tests of the proposed mechanisms, whether they reject or support the hypotheses, should greatly clarify basic processes of brain aging and identify potential new targets for therapeutic interventions.
Fig. 5.
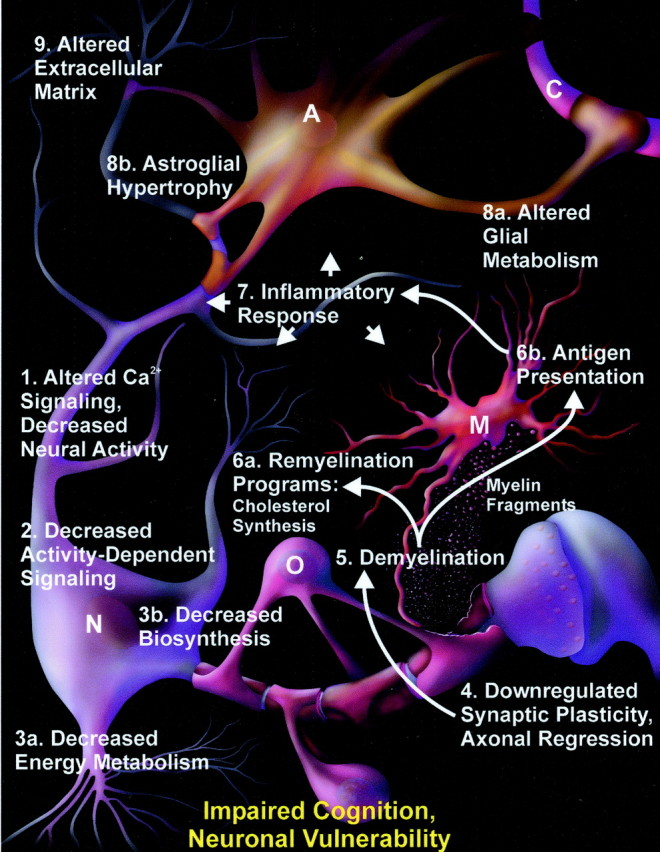
Integrative model of brain aging. Numbers represent one putative sequence of events leading to aging-related cognitive impairment. Arrows indicate hypothesized causal interactions for the inflammatory cascade component. Altered Ca2+and synaptic signaling (1) in neurons (N) reduce neural activity responses, which then activate genomic alterations that downregulate activity-dependent signaling pathways (2) and induce general neuronal, metabolic, and biosynthetic involution (3a,b). These involutional changes induce other transcriptional alterations that downregulate the capacity for neurite outgrowth, synaptogenesis, and maintenance of extracellular structure (4). The weakening of extracellular structure and axonal regression trigger an initial demyelination process (5) that in turn activates remyelinating programs and associated cholesterol biosynthesis/transport (6a) in oligodendrocytes (O). Concurrently, myelin fragments are endocytosed by glia and degraded to antigenic epitopes that stimulate innate autoimmunity and antigen presentation (6b) in microglia (M). These autoimmune responses then activate a glial-mediated inflammatory cascade (7) in microglia (M) and astrocytes (A), associated with altered glial metabolism (8a) and glucose uptake from capillaries (C) and astrocytic hypertrophy (8b). The increasing inflammatory and glial activation induce additional extracellular matrix transformation and neuronal erosion (9) and exacerbate demyelination. The accumulating inflammatory damage (7) and extracellular changes (9) eventually interact with decreased neuronal activity (1) and synaptic plasticity (4) to impair cognition and increase neuronal vulnerability (bottom).
E.M.B. and K.-C.C. contributed equally to this work.
This work was supported in part by National Institute on Aging Grants AG04542, AG10836, AG18228, and AG14979 and by National Institute of Mental Health Grant MH59891. We thank Kelley Secrest for excellent contributions to this manuscript and Arnold Stromberg and Xuejun Peng for valuable statistical discussion.
Correspondence should be addressed to Dr. Philip W. Landfield, University of Kentucky, Department of Molecular and Biomedical Pharmacology, MS-305, UKMC, Lexington, KY 40536-0298. E-mail:pwland@uky.edu.
References
- 1.Andreasson KI, Savonenko A, Vidensky S, Goellner JJ, Zhang Y, Shaffer A, Kaufmann WE, Worley PF, Isakson P, Markowska AL. Age-dependent cognitive deficits and neuronal apoptosis in cyclooxygenase-2 transgenic mice. J Neurosci. 2001;21:8198–8209. doi: 10.1523/JNEUROSCI.21-20-08198.2001. [DOI] [PMC free article] [PubMed] [Google Scholar]
- 2.Austad SN. Why we age: what science is discovering about the body's journey through life. Wiley; Indianapolis: 1999. [Google Scholar]
- 3.Bal-Price A, Brown GC. Inflammatory neurodegeneration mediated by nitric oxide from activated glia-inhibiting neuronal respiration, causing glutamate release and excitotoxicity. J Neurosci. 2001;21:6480–6491. doi: 10.1523/JNEUROSCI.21-17-06480.2001. [DOI] [PMC free article] [PubMed] [Google Scholar]
- 4.Barnes CA. Normal aging: regionally specific changes in hippocampal synaptic transmission. Trends Neurosci. 1994;17:13–18. doi: 10.1016/0166-2236(94)90029-9. [DOI] [PubMed] [Google Scholar]
- 5.Becker KG (2002) Deciphering the gene expression profile of long-lived Snell mice. In: http://sageke.sciencemag.org [DOI] [PubMed]
- 6.Benjamini Y, Drai D, Elmer G, Kafkafi N, Golani I. Controlling the false discovery rate in behavior genetics research. Behav Brain Res. 2001;125:279–284. doi: 10.1016/s0166-4328(01)00297-2. [DOI] [PubMed] [Google Scholar]
- 7.Bezakova G, Rabben I, Sefland I, Fumagalli G, Lomo T. Neural agrin controls acetylcholine receptor stability in skeletal muscle fibers. Proc Natl Acad Sci USA. 2001;98:9924–9929. doi: 10.1073/pnas.171539698. [DOI] [PMC free article] [PubMed] [Google Scholar]
- 8.Bi X, Yong AP, Zhou J, Gall CM, Lynch G. Regionally selective changes in brain lysosomes occur in the transition from young adulthood to middle age in rats. Neuroscience. 2000;97:395–404. doi: 10.1016/s0306-4522(00)00021-x. [DOI] [PubMed] [Google Scholar]
- 9.Bickford PC, Gould T, Briederick L, Chadman K, Pollock A, Young D, Shukitt-Hale B, Joseph J. Antioxidant-rich diets improve cerebellar physiology and motor learning in aged rats. Brain Res. 2000;866:211–217. doi: 10.1016/s0006-8993(00)02280-0. [DOI] [PubMed] [Google Scholar]
- 10.Biewenga JE, Schrama LH, Gispen WH. Presynaptic phosphoprotein B-50/GAP-43 in neuronal and synaptic plasticity. Acta Biochim Pol. 1996;43:327–338. [PubMed] [Google Scholar]
- 11.Blalock EM, Porter NM, Landfield PW. Decreased G-protein-mediated regulation and shift in calcium channel types with age in hippocampal cultures. J Neurosci. 1999;19:8674–8684. doi: 10.1523/JNEUROSCI.19-19-08674.1999. [DOI] [PMC free article] [PubMed] [Google Scholar]
- 12.Boyhan A, Smith D, Charles IG, Saqi M, Lowe PN. Delineation of the arginine- and tetrahydrobiopterin-binding sites of neuronal nitric oxide synthase. Biochem J. 1997;323:131–139. doi: 10.1042/bj3230131. [DOI] [PMC free article] [PubMed] [Google Scholar]
- 13.Butterfield DA, Howard B, Yatin S, Koppal T, Drake J, Hensley K, Aksenov M, Aksenova M, Subramaniam R, Varadarajan S, Harris-White ME, Pedigo NW, Jr, Carney JM. Elevated oxidative stress in models of normal brain aging and Alzheimer's disease. Life Sci. 1999;65:1883–1892. doi: 10.1016/s0024-3205(99)00442-7. [DOI] [PubMed] [Google Scholar]
- 14.Calingasan NY, Gibson GE. Dietary restriction attenuates the neuronal loss, induction of heme oxygenase-1 and blood-brain barrier breakdown induced by impaired oxidative metabolism. Brain Res. 2000;885:62–69. doi: 10.1016/s0006-8993(00)02933-4. [DOI] [PubMed] [Google Scholar]
- 15.Carney JM, Starke-Reed PE, Oliver CN, Landum RW, Cheng MS, Wu JF, Floyd RA. Reversal of age-related increase in brain protein oxidation, decrease in enzyme activity, and loss in temporal and spatial memory by chronic administration of the spin-trapping compound N-tert-butyl-alpha-phenylnitrone. Proc Natl Acad Sci USA. 1991;88:3633–3636. doi: 10.1073/pnas.88.9.3633. [DOI] [PMC free article] [PubMed] [Google Scholar]
- 16.Cavallaro S, Schreurs BG, Zhao W, D'Agata V, Alkon DL. Gene expression profiles during long-term memory consolidation. Eur J Neurosci. 2001;13:1809–1815. doi: 10.1046/j.0953-816x.2001.01543.x. [DOI] [PubMed] [Google Scholar]
- 17.Chavis P, Fagni L, Lansman JB, Bockaert J. Functional coupling between ryanodine receptors and L-type calcium channels in neurons. Nature. 1996;382:719–722. doi: 10.1038/382719a0. [DOI] [PubMed] [Google Scholar]
- 18.Chen KC, Blalock EM, Thibault O, Kaminker P, Landfield PW. Expression of alpha 1D subunit mRNA is correlated with L-type Ca2+ channel activity in single neurons of hippocampal “zipper” slices. Proc Natl Acad Sci USA. 2000;97:4357–4362. doi: 10.1073/pnas.070056097. [DOI] [PMC free article] [PubMed] [Google Scholar]
- 19.Coleman PD, Rogers KE, Flood DG. The neuropil and GAP-43/B-50 in normally aging and Alzheimer's disease human brain. Prog Brain Res. 1991;89:263–269. doi: 10.1016/s0079-6123(08)61727-6. [DOI] [PubMed] [Google Scholar]
- 20.Corbin JG, Kelly D, Rath EM, Baerwald KD, Suzuki K, Popko B. Targeted CNS expression of interferon-gamma in transgenic mice leads to hypomyelination, reactive gliosis, and abnormal cerebellar development. Mol Cell Neurosci. 1996;7:354–370. doi: 10.1006/mcne.1996.0026. [DOI] [PubMed] [Google Scholar]
- 21.Demerens C, Stankoff B, Logak M, Anglade P, Allinquant B, Couraud F, Zalc B, Lubetzki C. Induction of myelination in the central nervous system by electrical activity. Proc Natl Acad Sci USA. 1996;93:9887–9892. doi: 10.1073/pnas.93.18.9887. [DOI] [PMC free article] [PubMed] [Google Scholar]
- 22.Dickinson DP. Cysteine peptidases of mammals: their biological roles and potential effects in the oral cavity and other tissues in health and disease. Crit Rev Oral Biol Med. 2002;13:238–275. doi: 10.1177/154411130201300304. [DOI] [PubMed] [Google Scholar]
- 23.Disterhoft JF, Moyer JR, Jr, Thompson LT, Kowalska M. Functional aspects of calcium-channel modulation. Clin Neuropharmacol. 1993;16[Suppl 1]:S12–24. doi: 10.1097/00002826-199316001-00003. [DOI] [PubMed] [Google Scholar]
- 24.Finch CE, Tanzi RE. Genetics of aging. Science. 1997;278:407–411. doi: 10.1126/science.278.5337.407. [DOI] [PubMed] [Google Scholar]
- 25.Finch CE, Morgan T, Rozovsky I, Xie Z, Weindruch R, Prolla T. Microglia and aging in the brain. In: Streit WJ, editor. Microglia in the degenerating and regenerating CNS. Springer; New York: 2002. pp. 275–305. [Google Scholar]
- 26.Finn SF, Hyman BT, Storey E, Miller JM, Beal MF. Effects of aging on quinolinic acid lesions in rat striatum. Brain Res. 1991;562:276–280. doi: 10.1016/0006-8993(91)90631-5. [DOI] [PubMed] [Google Scholar]
- 27.Foster TC, Norris CM. Age-associated changes in Ca(2+)-dependent processes: relation to hippocampal synaptic plasticity. Hippocampus. 1997;7:602–612. doi: 10.1002/(SICI)1098-1063(1997)7:6<602::AID-HIPO3>3.0.CO;2-G. [DOI] [PubMed] [Google Scholar]
- 28.Franklin JL, Johnson EM., Jr Elevated intracellular calcium blocks programmed neuronal death. Ann NY Acad Sci. 1994;747:195–204. doi: 10.1111/j.1749-6632.1994.tb44410.x. [DOI] [PubMed] [Google Scholar]
- 29.French PJ, O'Connor V, Jones MW, Davis S, Errington ML, Voss K, Truchet B, Wotjak C, Stean T, Doyere V, Maroun M, Laroche S, Bliss TV. Subfield-specific immediate early gene expression associated with hippocampal long-term potentiation in vivo. Eur J Neurosci. 2001;13:968–976. doi: 10.1046/j.0953-816x.2001.01467.x. [DOI] [PubMed] [Google Scholar]
- 30.Fulle S, Pietrangelo T, Mariggio MA, Lorenzon P, Racanicchi L, Mozrzymas J, Guarnieri S, Zucconi-Grassi G, Fano G. Calcium and fos involvement in brain-derived Ca(2+)-binding protein (S100)-dependent apoptosis in rat phaeochromocytoma cells. Exp Physiol. 2000;85:243–253. [PubMed] [Google Scholar]
- 31.Gall C, Lauterborn J, Isackson P, White J. Seizures, neuropeptide regulation, and mRNA expression in the hippocampus. Prog Brain Res. 1990;83:371–390. doi: 10.1016/s0079-6123(08)61263-7. [DOI] [PubMed] [Google Scholar]
- 32.Gemma C, Mesches MH, Sepesi B, Choo K, Holmes DB, Bickford PC. Diets enriched in foods with high antioxidant activity reverse age-induced decreases in cerebellar β-adrenergic function and increases in proinflammatory cytokines. J Neurosci. 2002;22:6114–6120. doi: 10.1523/JNEUROSCI.22-14-06114.2002. [DOI] [PMC free article] [PubMed] [Google Scholar]
- 33.Gibson GE, Peterson C. Calcium and the aging nervous system. Neurobiol Aging. 1987;8:329–343. doi: 10.1016/0197-4580(87)90072-8. [DOI] [PubMed] [Google Scholar]
- 34.Gincel D, Zaid H, Shoshan-Barmatz V. Calcium binding and translocation by the voltage-dependent anion channel: a possible regulatory mechanism in mitochondrial function. Biochem J. 2001;358:147–155. doi: 10.1042/0264-6021:3580147. [DOI] [PMC free article] [PubMed] [Google Scholar]
- 35.Golomb J, Kluger A, Gianutsos J, Ferris SH, de Leon MJ, George AE. Nonspecific leukoencephalopathy associated with aging. Neuroimaging Clin N Am. 1995;5:33–44. [PubMed] [Google Scholar]
- 36.Guzowski JF, Lyford GL, Stevenson GD, Houston FP, McGaugh JL, Worley PF, Barnes CA. Inhibition of activity-dependent arc protein expression in the rat hippocampus impairs the maintenance of long-term potentiation and the consolidation of long-term memory. J Neurosci. 2000;20:3993–4001. doi: 10.1523/JNEUROSCI.20-11-03993.2000. [DOI] [PMC free article] [PubMed] [Google Scholar]
- 37.Hauss-Wegrzyniak B, Vannucchi MG, Wenk GL. Behavioral and ultrastructural changes induced by chronic neuroinflammation in young rats. Brain Res. 2000;859:157–166. doi: 10.1016/s0006-8993(00)01999-5. [DOI] [PubMed] [Google Scholar]
- 38.Ito E, Oka K, Etcheberrigaray R, Nelson TJ, McPhie DL, Tofel-Grehl B, Gibson GE, Alkon DL. Internal Ca2+ mobilization is altered in fibroblasts from patients with Alzheimer disease. Proc Natl Acad Sci USA. 1994;91:534–538. doi: 10.1073/pnas.91.2.534. [DOI] [PMC free article] [PubMed] [Google Scholar]
- 39.Jiang CH, Tsien JZ, Schultz PG, Hu Y. The effects of aging on gene expression in the hypothalamus and cortex of mice. Proc Natl Acad Sci USA. 2001;98:1930–1934. doi: 10.1073/pnas.98.4.1930. [DOI] [PMC free article] [PubMed] [Google Scholar]
- 40.Kalman B, Lublin FD, Alder H. Impairment of central and peripheral myelin in mitochondrial diseases. Mult Scler. 1997;2:267–278. doi: 10.1177/135245859700200602. [DOI] [PubMed] [Google Scholar]
- 41.Kandel ER. The molecular biology of memory storage: a dialogue between genes and synapses. Science. 2001;294:1030–1038. doi: 10.1126/science.1067020. [DOI] [PubMed] [Google Scholar]
- 42.Khachaturian ZS. The role of calcium regulation in brain aging: reexamination of a hypothesis. Aging (Milano) 1989;1:17–34. doi: 10.1007/BF03323872. [DOI] [PubMed] [Google Scholar]
- 43.Kristensson K, Holmes KV, Duchala CS, Zeller NK, Lazzarini RA, Dubois-Dalcq M. Increased levels of myelin basic protein transcripts in virus-induced demyelination. Nature. 1986;322:544–547. doi: 10.1038/322544a0. [DOI] [PMC free article] [PubMed] [Google Scholar]
- 44.Landfield PW, Pitler TA. Prolonged Ca2+-dependent afterhyperpolarizations in hippocampal neurons of aged rats. Science. 1984;226:1089–1092. doi: 10.1126/science.6494926. [DOI] [PubMed] [Google Scholar]
- 45.Landfield PW, Thibault O, Mazzanti ML, Porter NM, Kerr DS. Mechanisms of neuronal death in brain aging and Alzheimer's disease: role of endocrine-mediated calcium dyshomeostasis. J Neurobiol. 1992;23:1247–1260. doi: 10.1002/neu.480230914. [DOI] [PubMed] [Google Scholar]
- 46.Lee CK, Weindruch R, Prolla TA. Gene-expression profile of the ageing brain in mice. Nat Genet. 2000;25:294–297. doi: 10.1038/77046. [DOI] [PubMed] [Google Scholar]
- 47.Lipton SA, Rosenberg PA. Excitatory amino acids as a final common pathway for neurologic disorders. N Engl J Med. 1994;330:613–622. doi: 10.1056/NEJM199403033300907. [DOI] [PubMed] [Google Scholar]
- 48.Lockhart DJ, Barlow C. Expressing what's on your mind: DNA arrays and the brain. Nat Rev Neurosci. 2001;2:63–68. doi: 10.1038/35049070. [DOI] [PubMed] [Google Scholar]
- 49.Luo Y, Long JM, Spangler EL, Longo DL, Ingram DK, Weng N. Identification of maze learning-associated genes in rat hippocampus by cDNA microarray. J Mol Neurosci. 2001;17:397–404. doi: 10.1385/JMN:17:3:397. [DOI] [PubMed] [Google Scholar]
- 50.Luo Y, Long JM, Lu C, Chan SL, Spangler EL, Mascarucci P, Raz A, Longo DL, Mattson MP, Ingram DK, Weng N. A link between maze learning and hippocampal expression of neuroleukin and its receptor gp78. J Neurochem. 2002;80:354–361. doi: 10.1046/j.0022-3042.2001.00707.x. [DOI] [PubMed] [Google Scholar]
- 51.Madison DL, Krueger WH, Cheng D, Trapp BD, Pfeiffer SE. SNARE complex proteins, including the cognate pair VAMP-2 and syntaxin-4, are expressed in cultured oligodendrocytes. J Neurochem. 1999;72:988–998. doi: 10.1046/j.1471-4159.1999.0720988.x. [DOI] [PubMed] [Google Scholar]
- 52.Markowska AL, Mooney M, Sonntag WE. Insulin-like growth factor-1 ameliorates age-related behavioral deficits. Neuroscience. 1998;87:559–569. doi: 10.1016/s0306-4522(98)00143-2. [DOI] [PubMed] [Google Scholar]
- 53.Mattson MP, LaFerla FM, Chan SL, Leissring MA, Shepel PN, Geiger JD. Calcium signaling in the ER: its role in neuronal plasticity and neurodegenerative disorders. Trends Neurosci. 2000;23:222–229. doi: 10.1016/s0166-2236(00)01548-4. [DOI] [PubMed] [Google Scholar]
- 54.McGaugh JL. Memory—a century of consolidation. Science. 2000;287:248–251. doi: 10.1126/science.287.5451.248. [DOI] [PubMed] [Google Scholar]
- 55.Michaelis ML, Johe K, Kitos TE. Age-dependent alterations in synaptic membrane systems for Ca2+ regulation. Mech Ageing Dev. 1984;25:215–225. doi: 10.1016/0047-6374(84)90142-8. [DOI] [PubMed] [Google Scholar]
- 56.Miller RA, Galecki A, Shmookler-Reis RJ. Interpretation, design, and analysis of gene array expression experiments. J Gerontol A Biol Sci Med Sci. 2001;56:B52–57. doi: 10.1093/gerona/56.2.b52. [DOI] [PubMed] [Google Scholar]
- 57.Mirnics K, Middleton FA, Marquez A, Lewis DA, Levitt P. Molecular characterization of schizophrenia viewed by microarray analysis of gene expression in prefrontal cortex. Neuron. 2000;28:53–67. doi: 10.1016/s0896-6273(00)00085-4. [DOI] [PubMed] [Google Scholar]
- 58.Moroni F. Tryptophan metabolism and brain function: focus on kynurenine and other indole metabolites. Eur J Pharmacol. 1999;375:87–100. doi: 10.1016/s0014-2999(99)00196-x. [DOI] [PubMed] [Google Scholar]
- 59.Murray CA, Lynch MA. Evidence that increased hippocampal expression of the cytokine interleukin-1 β is a common trigger for age- and stress-induced impairments in long-term potentiation. J Neurosci. 1998;18:2974–2981. doi: 10.1523/JNEUROSCI.18-08-02974.1998. [DOI] [PMC free article] [PubMed] [Google Scholar]
- 60.Nagarajan R, Svaren J, Le N, Araki T, Watson M, Milbrandt J. EGR2 mutations in inherited neuropathies dominant-negatively inhibit myelin gene expression. Neuron. 2001;30:355–368. doi: 10.1016/s0896-6273(01)00282-3. [DOI] [PubMed] [Google Scholar]
- 61.Nicolle MM, Gonzalez J, Sugaya K, Baskerville KA, Bryan D, Lund K, Gallagher M, McKinney M. Signatures of hippocampal oxidative stress in aged spatial learning-impaired rodents. Neuroscience. 2001;107:415–431. doi: 10.1016/s0306-4522(01)00374-8. [DOI] [PubMed] [Google Scholar]
- 62.Nicotera P, Orrenius S. The role of calcium in apoptosis. Cell Calcium. 1998;23:173–180. doi: 10.1016/s0143-4160(98)90116-6. [DOI] [PubMed] [Google Scholar]
- 63.Nixon RA, Cataldo AM, Mathews PM. The endosomal-lysosomal system of neurons in Alzheimer's disease pathogenesis: a review. Neurochem Res. 2000;25:1161–1172. doi: 10.1023/a:1007675508413. [DOI] [PubMed] [Google Scholar]
- 64.Norris CM, Foster TC. MK-801 improves retention in aged rats: implications for altered neural plasticity in age-related memory deficits. Neurobiol Learn Mem. 1999;71:194–206. doi: 10.1006/nlme.1998.3864. [DOI] [PubMed] [Google Scholar]
- 65.Petanceska SS, DeRosa S, Olm V, Diaz N, Sharma A, Thomas-Bryant T, Duff K, Pappolla M, Refolo LM. Statin therapy for Alzheimer's disease: will it work? J Mol Neurosci. 2002;19:155–161. doi: 10.1007/s12031-002-0026-2. [DOI] [PubMed] [Google Scholar]
- 66.Pletcher SD, Macdonald SJ, Marguerie R, Certa U, Stearns SC, Goldstein DB, Partridge L. Genome-wide transcript profiles in aging and calorically restricted Drosophila melanogaster. Curr Biol. 2002;12:712–723. doi: 10.1016/s0960-9822(02)00808-4. [DOI] [PubMed] [Google Scholar]
- 67.Price DL, Sisodia SS. Mutant genes in familial Alzheimer's disease and transgenic models. Annu Rev Neurosci. 1998;21:479–505. doi: 10.1146/annurev.neuro.21.1.479. [DOI] [PubMed] [Google Scholar]
- 68.Puglielli L, Konopka G, Pack-Chung E, Ingano LA, Berezovska O, Hyman BT, Chang TY, Tanzi RE, Kovacs DM. Acyl-coenzyme A: cholesterol acyltransferase modulates the generation of the amyloid beta-peptide. Nat Cell Biol. 2001;3:905–912. doi: 10.1038/ncb1001-905. [DOI] [PubMed] [Google Scholar]
- 69.Rogers J, Webster S, Lue LF, Brachova L, Civin WH, Emmerling M, Shivers B, Walker D, McGeer P. Inflammation and Alzheimer's disease pathogenesis. Neurobiol Aging. 1996;17:681–686. doi: 10.1016/0197-4580(96)00115-7. [DOI] [PubMed] [Google Scholar]
- 70.Roth GS, Joseph JA, Mason RP. Membrane alterations as causes of impaired signal transduction in Alzheimer's disease and aging. Trends Neurosci. 1995;18:203–206. doi: 10.1016/0166-2236(95)93902-a. [DOI] [PubMed] [Google Scholar]
- 71.Schena M, Shalon D, Heller R, Chai A, Brown PO, Davis RW. Parallel human genome analysis: microarray-based expression monitoring of 1000 genes. Proc Natl Acad Sci USA. 1996;93:10614–10619. doi: 10.1073/pnas.93.20.10614. [DOI] [PMC free article] [PubMed] [Google Scholar]
- 72.Selkoe DJ. Clearing the brain's amyloid cobwebs. Neuron. 2001;32:177–180. doi: 10.1016/s0896-6273(01)00475-5. [DOI] [PubMed] [Google Scholar]
- 73.Silva AJ, Elgersma Y, Costa RM. Molecular and cellular mechanisms of cognitive function: implications for psychiatric disorders. Biol Psychiatry. 2000;47:200–209. doi: 10.1016/s0006-3223(99)00294-2. [DOI] [PubMed] [Google Scholar]
- 74.Steward O, Wallace CS, Lyford GL, Worley PF. Synaptic activation causes the mRNA for the IEG arc to localize selectively near activated postsynaptic sites on dendrites. Neuron. 1998;21:741–751. doi: 10.1016/s0896-6273(00)80591-7. [DOI] [PubMed] [Google Scholar]
- 75.Tanzi RE, Bertram L. New frontiers in Alzheimer's disease genetics. Neuron. 2001;32:181–184. doi: 10.1016/s0896-6273(01)00476-7. [DOI] [PubMed] [Google Scholar]
- 76.Thibault O, Landfield PW. Increase in single L-type calcium channels in hippocampal neurons during aging. Science. 1996;272:1017–1020. doi: 10.1126/science.272.5264.1017. [DOI] [PubMed] [Google Scholar]
- 77.Thibault O, Hadley R, Landfield PW. Elevated postsynaptic [Ca2+]i and L-type calcium channel activity in aged hippocampal neurons: relationship to impaired synaptic plasticity. J Neurosci. 2001;21:9744–9756. doi: 10.1523/JNEUROSCI.21-24-09744.2001. [DOI] [PMC free article] [PubMed] [Google Scholar]
- 78.Treves S, Scutari E, Robert M, Groh S, Ottolia M, Prestipino G, Ronjat M, Zorzato F. Interaction of S100A1 with the Ca2+ release channel (ryanodine receptor) of skeletal muscle. Biochemistry. 1997;36:11496–11503. doi: 10.1021/bi970160w. [DOI] [PubMed] [Google Scholar]
- 79.Verkhratsky A, Toescu EC. Calcium and neuronal ageing. Trends Neurosci. 1998;21:2–7. doi: 10.1016/s0166-2236(97)01156-9. [DOI] [PubMed] [Google Scholar]
- 80.Vignes M, Clarke VR, Parry MJ, Bleakman D, Lodge D, Ornstein PL, Collingridge GL. The GluR5 subtype of kainate receptor regulates excitatory synaptic transmission in areas CA1 and CA3 of the rat hippocampus. Neuropharmacology. 1998;37:1269–1277. doi: 10.1016/s0028-3908(98)00148-8. [DOI] [PubMed] [Google Scholar]
- 81.Wallace DC. A mitochondrial paradigm for degenerative diseases and ageing. Novartis Found Symp. 2001;235:247–263. doi: 10.1002/0470868694.ch20. [DOI] [PubMed] [Google Scholar]
- 82.Wang J, Green PS, Simpkins JW. Estradiol protects against ATP depletion, mitochondrial membrane potential decline and the generation of reactive oxygen species induced by 3-nitroproprionic acid in SK-N-SH human neuroblastoma cells. J Neurochem. 2001;77:804–811. doi: 10.1046/j.1471-4159.2001.00271.x. [DOI] [PubMed] [Google Scholar]
- 83.Watson SJ, Meng F, Thompson RC, Akil H. The “chip” as a specific genetic tool. Biol Psychiatry. 2000;48:1147–1156. doi: 10.1016/s0006-3223(00)01080-5. [DOI] [PubMed] [Google Scholar]
- 84.Wyss-Coray T, Mucke L. Inflammation in neurodegenerative disease—a double-edged sword. Neuron. 2002;35:419–432. doi: 10.1016/s0896-6273(02)00794-8. [DOI] [PubMed] [Google Scholar]
- 85.Zhang XQ, Qureshi A, Song J, Carl LL, Tian Q, Stahl RC, Carey DJ, Rothblum LI, Cheung JY. Phospholemman modulates Na+/Ca2+ exchange in adult rat cardiac myocytes. Am J Physiol Heart Circ Physiol. 2003;284:H225–233. doi: 10.1152/ajpheart.00698.2002. [DOI] [PubMed] [Google Scholar]