

Abstract
The ability to see at night relies on the transduction of single photons by the rod photoreceptors and transmission of the resulting signals through the retina. Using paired patch-clamp recordings, we investigated the properties of the first stage of neural processing of the rod light responses: signal transfer from rods to bipolar and horizontal cells. Bypassing the relatively slow phototransduction process and directly modulating the rod voltage or current allowed us to characterize signal transfer over a wide range of temporal frequencies. We found that the rod to second-order cell synapse acts as a bandpass filter, preferentially transmitting signals with frequencies between 1.5 and 4 Hz while attenuating higher and lower frequency inputs. The similarity of the responses in different types of postsynaptic cell and the properties of miniature EPSCs (mEPSCs) recorded in OFF bipolar cells suggest that most of the bandpass filtering is mediated presynaptically. Modeling of the network of electrically coupled rod photoreceptors suggests that spread of the signal through the network contributed to the observed high-pass filtering but not to the low-pass filtering. Attenuation of low temporal frequencies at the first retinal synapse sharpens the temporal resolution of the light response; attenuation of high temporal frequencies removes voltage noise in the rod that threatens to swamp the light response.
Keywords: rod photoreceptor, signal processing, synapse, bipolar cell, horizontal cell, salamander retina
Introduction
On a dark night our visual system detects incident photons with reliability close to limits set by statistical fluctuations in photon absorption and noise in the rod photoreceptors (for review, see Rieke and Baylor, 1998). This exquisite sensitivity is crucial for normal night vision, much of which occurs at light levels at which individual rods rarely receive photons. Thus, our ability to see at night relies on the transduction of single photons by the rods and reliable transmission of the resulting signals through the retina. A good deal is known about how rods transduce individual photons (Baylor et al., 1979; Pugh and Lamb, 1993); comparatively little is known about how the retinal circuitry extracts information from the rod responses. Here we describe the properties of the first stage of retinal processing: signal transfer from rods to bipolar and horizontal cells.
In the dark, vertebrate rods are relatively depolarized and continuously release glutamate. Absorption of a photon hyperpolarizes the rod and reduces the rate of transmitter release, causing ON bipolar cells to depolarize and OFF bipolar and horizontal cells to hyperpolarize. In amphibian rods, absorption of a single photon hyperpolarizes the synaptic terminal 50–200 μV for several seconds (Fain, 1975; Capovilla et al., 1987). Both the small size and the long duration of the rod response raise issues for synaptic transmission. First, the small responses arrive at the synaptic terminal embedded in substantial high-frequency voltage noise (Baylor et al., 1980), making reliable transmission challenging. Second, extraction of temporal information requires selective transmission of the early part of the slow rod response.
Removal of noise and extraction of temporal information form the basis for theoretical arguments that low temporal frequencies with intrinsically poor temporal resolution and high temporal frequencies that are dominated by noise should be attenuated during signal transfer from rods to second-order cells (Bialek and Owen, 1990; Rieke et al., 1991). Thus theoretically the rod responses should be bandpass filtered during transmission. In both amphibians (Ashmore and Falk, 1980;Schnapf and Copenhagen, 1982) and mammals (Berntson and Taylor, 2000;Euler and Masland, 2000; Field and Rieke, 2002), the dim flash responses of bipolar cells are considerably briefer than those of rods, providing good evidence for attenuation of low frequencies (Schnapf and Copenhagen, 1982; Bialek and Owen, 1990). Evidence for attenuation of high frequencies is not nearly as strong.
We investigated the kinetics of rod to bipolar and rod to horizontal signal transfer using paired patch-clamp recordings. This approach bypassed the relative slow phototransduction process and permitted measurement of the gain of signal transfer across a wide range of temporal frequencies. We found that signal transfer from rods to second-order cells acts as a bandpass filter with a peak gain near 3 Hz. Several observations suggest that much of the filtering is mediated by presynaptic mechanisms. Modeling indicated that filtering of the signal as it travels through the network of electrically coupled rods could explain some but not all of the observed kinetics of transmission.
Materials and Methods
Dissection and slicing. Larval tiger salamanders (Ambystoma tigrinum) (Charles Sullivan, Nashville TN) were handled according to protocols approved by the Administrative Panel on Laboratory Animal Care at the University of Washington. Salamanders were dark adapted overnight, and the dissection was performed using infrared illumination (>850 nm), infrared-visible converters (BE Meyers, Redmond, WA), and night vision goggles (ITT Night Vision, Roanoke, VA). The eyes were removed and hemisected, and the front half of each eye was discarded. The back half of each eye was cut in two, placed in HEPES-buffered Ames' solution (HEPES-Ames'; see below), and stored at 4°C in a light-tight container until use. All experiments were at room temperature (20–22°C).
For slicing, the retina was gently removed from the eyecup and embedded in low gelling-temperature agar (3% w/v in HEPES-Ames'; Agarose type VII-A, Sigma #A-0701). The embedded tissue was bathed in chilled HEPES-Ames' solution and cut into 300-μm-thick slices using a vibrating microtome (Leica, VT1000S). Slices were transferred to a recording chamber containing 5 kU DNase (final concentration ∼6 kU/ml) and held in place with a platinum ring.
Recording and light stimuli. Slices were visualized on an upright microscope (Nikon, FN600) equipped with a 60× water immersion objective. Slices were illuminated with infrared light (>950 nm) and visualized on a video monitor connected to an infrared camera (COHU model 4815, San Diego, CA). Whole-cell (Hamill et al., 1981) and perforated-patch (Horn and Marty, 1988) recordings were made using Axopatch 200B amplifiers (Axon Instruments, Foster City, CA). Pipettes were pulled from borosilicate glass and cut to a constant length. Pipettes were positioned under the objective using a programmable manipulator (Sutter Instruments, Novato, CA); for paired recordings this permitted one electrode to be changed without disrupting the other. The recorded responses were filtered at 300 Hz (eight-pole Bessel low pass) and sampled at 1 kHz (ITC16 Interface, Instrutech, Long Island, NY). Command potentials and data acquisition were controlled by custom Igor Pro (Wavemetrics, Lake Oswego, OR) and C software.
Pipette resistances, measured in standard solutions, were between 8 and 12 MΩ. Series resistance during recording was typically ∼70 MΩ and was not compensated. These series resistances produced 5–10 mV errors in the holding potential in addition to low-pass filtering the time-varying command potentials. Because our focus was on kinetics of signal transfer, low-pass filtering posed the largest potential problem; however, this filtering occurred at much higher frequencies than those used to probe synaptic transmission (the slowest charging time constant for a rod was 4 msec) and thus did not significantly influence measurements of the gain of signal transfer at temporal frequencies <50 Hz.
Paired patch-clamp recordings were made between rods and bipolar or horizontal cells. Rods were identified by their characteristic morphology. Bipolar and horizontal cells were identified on the basis of the morphology and the polarity and shape of their light responses. In early experiments, we confirmed the cell identification by including 0.1 mm calcein or rhodamine in the pipette solution and visualizing the morphology of the cell under fluorescence at the end of an experiment. We did not attempt to separate bipolar cells into classes other than ON and OFF.
Light from a light-emitting diode (LED) with a peak output at 470 nm was focused on the slice through a 20× objective used as the microscope condenser. Light stimuli uniformly illuminated a circular area 650 μm in diameter centered on the recorded cells. Light intensities measured at the preparation are given in the Figure legends. The intensity and timing of light from the LED were controlled by computer.
Solutions. Retinas were sliced and stored in HEPES-Ames' solution (Sigma, St. Louis, MO) containing 10 mm HEPES and 5 mm NaCl and no NaHCO3. During recording, slices were superfused continuously with bicarbonate ringer containing (in mm) 110 NaCl, 30 NaHCO3, 2 KCl, 1.6 MgCl2, 1.5 CaCl2, 0.01 EDTA, 10 d-glucose, supplemented with Basal Medium Eagle amino acids and vitamins (Sigma) diluted 400-fold. The pH was 7.4 when equilibrated with 5% CO2/95% O2. For whole-cell recordings pipettes were filled with (in mm): 115 K-aspartate, 10 KCl, 0.5 CaCl2, 5N-methyl-d-glucamine–N-hydroxyethylene-diaminetriacetate, 10 HEPES, 1 MgATP, 0.1 MgGTP, pH 7.2. For perforated-patch recordings, 1 mg/ml amphotericin-B was added to the internal solution, and the pipette tips were filled with amphotericin-free solution. All solutions had an osmotic strength of ∼260 mOsm. The liquid junction potential was between −8 and −10 mV and has not been corrected.
Data analysis. Data was analyzed in Igor Pro (Wavemetrics) and Excel (Microsoft, Redmond, WA). B2 Spice (Beige Bag Software, Ann Arbor, MI) was used to model electrical coupling in the rod network.
Results
Previous studies characterizing the kinetics of signal transfer compared the light responses of rods and second-order cells (Schnapf and Copenhagen, 1982; Bialek and Owen, 1990). The rod light response, however, contains only low temporal frequencies (see Fig. 9); thus this approach gives a limited view of how signal transfer depends on temporal frequency. To characterize signal transfer over a wider frequency range, we bypassed the slow transduction process by using paired patch-clamp techniques to manipulate the rod voltage or current directly while measuring the postsynaptic response.
Fig. 9.

Bandpass filtering accounts for most of the change in kinetics in rods and second-order cells. A, Normalized responses in a rod (light trace) and an ON bipolar cell (dark trace) elicited by a 10 msec duration full-field flash producing ∼11 photoisomerizations per rod. The timing of the flash is shown in the top trace. The responses shown are the average of five responses.B, Predicted second-order retinal cell response (dark trace) constructed by passing the average response from 11 rods elicited by the same stimulus as in A (light trace) through the bandpass filter modeled in Figure 3C.
Bipolar and horizontal cell responses to steps in rod voltage
We began by measuring synaptic currents in ON and OFF bipolar and horizontal cells elicited by a step in rod potential. These experiments probed the ability of the rod to second-order cell synapse to convey rapidly changing presynaptic signals. Although these stimuli were not physiological, they highlighted several important properties of the synapse.
Figure 1A shows responses of voltage-clamped ON and OFF bipolar cells to a series of presynaptic voltage steps. Depolarizing the rod from a holding potential of −60 mV produced transient outward currents in ON bipolar cells that were nearly symmetrical in their development and decay, peaking ∼100 msec after the voltage step and crossing baseline after ∼200 msec (Fig. 1A) (n = 6). In OFF bipolar (Fig. 1A) (n = 6) and horizontal (data not shown; n = 2) cells, the same voltage steps generated inward currents that were also transient, but much less symmetrical than those of the ON bipolar cells. Responses in OFF bipolar and horizontal cells peaked ∼25 msec after the voltage step and returned to baseline after ∼300 msec. These kinetic differences (Fig. 1B) are expected given that OFF bipolar and horizontal cells express fast ionotropic glutamate receptors, whereas ON bipolar cells express slow metabotropic receptors (Kim and Miller, 1993).
Fig. 1.
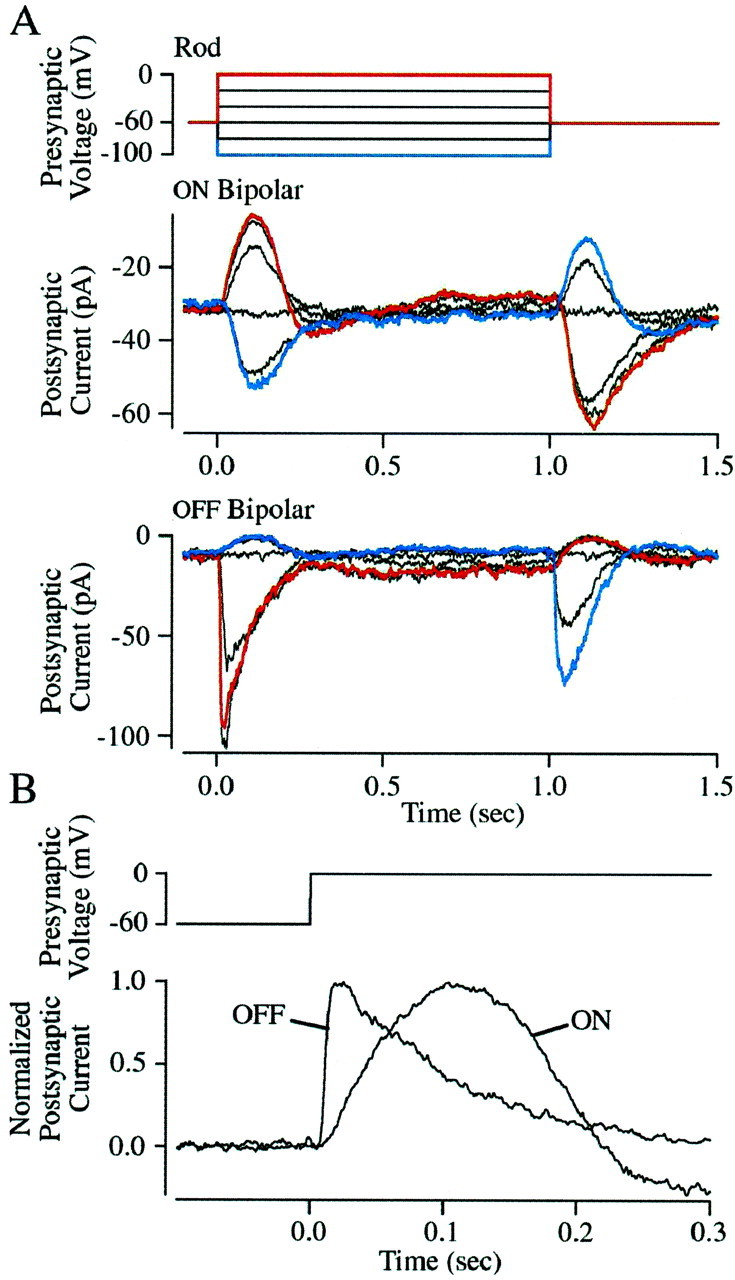
Presynaptic and postsynaptic kinetics.A, Postsynaptic current responses recorded in an ON and an OFF bipolar cell elicited by a family of presynaptic voltage steps. The presynaptic stimulus is shown in the top panel. Responses elicited by steps to 0 and −100 mV are highlighted in red and blue. The ON bipolar responses are the average of 10 stimulus presentations and the OFF bipolar responses are the average of 5. All of the cells were held at −60 mV. B, Comparison of the time course of the ON and OFF bipolar cell responses elicited by presynaptic voltage steps to 0 mV. Both responses were normalized to have amplitudes of +1.
Unlike the responses elicited by presynaptic depolarization, the kinetics of the responses to presynaptic hyperpolarization were similar in the different types of postsynaptic cells. Hyperpolarizing the patched rod usually (in 12 of 14 recordings) generated an inward current in ON bipolar cells and an outward current in OFF bipolar (Fig.1A) and horizontal cells. In each case the postsynaptic response peaked ∼100 msec after the step in rod voltage and returned to baseline after ∼300 msec. The similarity in kinetics suggests that under these conditions a step in signal transfer not involving the postsynaptic receptors limited the speed of the response.
The persistence of transmission when the rod was hyperpolarized from −60 mV indicated that multiple rods contributed to the postsynaptic responses. The polarity of the responses to presynaptic hyperpolarization indicates that glutamate release was suppressed. At −60 mV, glutamate release from the rods should be minimal (Attwell et al., 1987; Belgum and Copenhagen, 1988; Witkovsky et al., 1997), and thus hyperpolarization should have little effect on release from the patched rod. Nonetheless, presynaptic hyperpolarization elicited a postsynaptic response. This can be explained by the spread of the presynaptic signal from the recorded rod to neighboring rods via gap junctions (for review, see Attwell, 1986). The neighboring rods should maintain a potential closer to −40 mV and release glutamate continuously (Trifonov, 1968; Dowling and Ripps, 1973). Spread of hyperpolarization from the patched rod should suppress glutamate release from the surrounding rods, accounting for the recorded response. A similar spread of signals among coupled rods occurs in the retina under normal conditions (Copenhagen and Owen, 1976; Schwartz, 1976).
The experiments of Figure 1 indicate that the postsynaptic receptors can shape responses to presynaptic stimuli but do not resolve whether this shaping is an important effect under physiological conditions. Experiments described in the next section characterize the kinetics of signal transfer under more physiological conditions.
Bipolar and horizontal cell responses to sinusoidal modulation of the rod voltage
To determine how the gain of signal transfer depended on temporal frequency, we modulated the rod voltage sinusoidally while measuring the postsynaptic current. Sinusoidal modulations were made about the rods normal dark potential of −40 mV. These experiments provided a quantitative description of how changes in rod voltage were transferred to bipolar and horizontal cells.
Figure 2A illustrates the experimental procedure and basic result. Postsynaptic responses elicited by a series of presynaptic sinusoidal stimuli with frequencies between 0.25 and 16 Hz were recorded. Five cycles of a sinusoid 10 mV in amplitude centered around −40 mV were applied to the rod while the postsynaptic cell was held at −60 mV. The average postsynaptic response was calculated from the last four cycles of the sinewave. As expected, in ON bipolar cells (Fig. 2B) presynaptic depolarization produced an outward (hyperpolarizing) postsynaptic current, and presynaptic hyperpolarization produced an inward (depolarizing) current. The same presynaptic stimuli produced responses of the opposite polarity in OFF bipolar and horizontal cells (Fig. 2C).
Fig. 2.

Presynaptic sinewaves. A, Postsynaptic current responses recorded in an ON bipolar cell elicited by presynaptic sinewaves centered around −40 mV. The presynaptic stimulus is shown in the top panel. The frequency of the sinewave used to elicit each response is indicated to the left. Each trace is the average of three stimulus presentations. B, The cycle average (black traces) of the postsynaptic response in an ON bipolar cell. The cycle average was calculated by averaging the response at each frequency elicited by the four cycles between the gray markers on the stimulus wave in A. In this cell the cycle average was well fit by a sinewave (thick gray traces). Data are from the same cell as in A. Not all of the stimulus frequencies shown in B are in A. C, The cycle average of postsynaptic responses in a horizontal cell elicited by presynaptic sinewaves. Stimulus frequencies are the same as inB. Both postsynaptic cells were held at −60 mV; the ON bipolar cell had a resting current of −114 pA (with the rod held at −40 mV), and the horizontal cell had a resting current of −200 pA. Note that the time axis in each trace has been normalized by the stimulus period to facilitate comparison.
Responses elicited in ON bipolar cells were usually sinusoidal and symmetrical around the holding current (n = 8) (Fig.2B). However, the majority of the responses elicited in OFF bipolar (n = 3) and horizontal cells (n = 9) were not sinusoidal. In these cells the inward current produced by presynaptic depolarization was larger than the outward current produced by hyperpolarization (Fig. 2C) (1 of 12 responses was sinusoidal). When the amplitude of the presynaptic stimulus was decreased from 10 to 5 mV, OFF bipolar and horizontal cell responses were more likely (two of four recordings) to be sinusoidal. The different shapes of the responses in ON bipolar cells and OFF bipolar and horizontal cells are likely caused by differences in the postsynaptic receptors because each cell type presumably encounters a similar change in transmitter concentration. We did not find substantial differences in the gain of signal transfer to different postsynaptic cells: the maximum response amplitude was 44 ± 10 pA in ON bipolars (mean ± SEM; n = 6), 41 ± 24 pA in OFF bipolars (n = 3), and 48 ± 9 pA in horizontal cells (n = 9).
It is clear from Figure 2 that the amplitude and the phase of the responses change with frequency. As the frequency of the rod stimulus was increased from 0.25 to ∼3 Hz, the amplitude of the postsynaptic response increased. Increasing the stimulus frequency further, however, caused the amplitude of the postsynaptic response to decrease. Thus signal transfer acted as a bandpass filter. In each recorded second-order cell the gain of signal transfer peaked between 1.5 and 4 Hz. At the lowest frequencies the postsynaptic response led the presynaptic stimulus (Fig. 2B,C). Increasing the frequency caused a rightward shift in the responses, with the phase of the response changing from a lead to a lag near 2.5 Hz. These attributes were found in all 24 rod to second-order cell recordings. A few recordings were made with the postsynaptic cell current-clamped rather than voltage-clamped. Aside from a slightly larger phase lag, the frequency dependence of signal transfer was nearly identical in these recordings.
The amplitude and phase of the sinusoidal postsynaptic responses were determined from sinewave fits (Fig. 2B, gray traces). For the nonsinusoidal responses, the amplitude of the response was determined from the size of the current excursion elicited, and the phase shift was determined from the time at which the postsynaptic current reached its peak. Figure3, A and B, shows collected measurements of amplitude and phase for each cell type. The peak gain of signal transfer in all three cell types fell in a narrow range of frequencies, between 2.5 and 3.5 Hz, with the ON bipolar, horizontal, and OFF bipolar cells peaking at ∼2.5, 3, and 3.5 Hz, respectively. The attenuation of low frequencies (<2 Hz) was similar in each cell type; thus all shared similar high-pass filtering. The attenuation of high frequencies (>2 Hz) showed more variability between cell types (Fig. 3A), presumably because of postsynaptic differences (see Discussion). This variability in high-frequency attenuation seems to account for the difference in the peak of the bandpass in the different postsynaptic cells. The phase shift was also more similar across cell types at low frequencies than at high frequencies. In all cell types the postsynaptic responses exhibited phase leads that first increased and then decreased at the lowest frequencies (Fig. 3B). The increase in phase lead at low frequencies was highly significant when results were pooled across cells (Fig. 3E) (p < 0.01).
Fig. 3.

Bandpass of synaptic transmission.A, Normalized response amplitude versus frequency plots of postsynaptic responses recorded in OFF bipolar (▴), horizontal (■), and ON bipolar (●) cells. B, Phase shift versus frequency plots of the postsynaptic responses. Symbols are the same as in A. A positive phase shift indicates that the postsynaptic response led the presynaptic stimulus, whereas a negative value indicates that the response lagged the stimulus. Values inA and B are mean ± SD.C, The bandpass of synaptic transmission from rods to second-order retina cells was well fit by a series of three low-pass filters (LP1–3) and one high-pass filter (HP). The low-pass filters were modeled as a resistor (R) in series with a capacitor (C), and the high-pass filter was modeled as two resistors (R1 andR2) in series with an inductor (L). The fits in D andE were obtained with time constants (τ =R*C) of 35 msec for LP1 and LP2, a time constant of 15 msec for LP3, and values of 32 Ω, 1 Ω, and 1.2 H, respectively, for R1,R2, and L. Normalized response amplitude versus frequency plot (D, black dots) and phase versus frequency plot (E) of the average postsynaptic responses across the three cell types is shown. The smooth gray lines represents the fit of the data with the model diagrammed in C.
To estimate the number of mechanisms that might be involved in signal transfer from rod to second-order cells, we fit the average bandpass of transmission with a model using high- and low-pass filters (Fig.3C). A good fit to the data was obtained with a model containing a minimum of three low-pass filters and a single high-pass filter. The increase in phase lead seen at the lowest frequencies (Fig.3B) suggested that the high-pass filter should be modeled as the electrical equivalent of two resistors in series with an inductor (see below). The low-pass filters were modeled as a resistor in series with a capacitor. The parameters of the low- and high-pass filter stages were varied to simultaneously fit the amplitude versus frequency and the phase versus frequency plots (Fig.3D,E).
The experiments illustrated in Figures 2 and 3 indicate that signal transfer from rods to second-order cells acts as a bandpass filter, preferentially transmitting sinusoidal modulations of the rod voltage with frequencies near 3 Hz. As for the responses to hyperpolarizing voltage steps in Figure 1, the filtering properties between rods and each type of second-order cell were similar. This similarity suggests that presynaptic rather than postsynaptic mechanisms dominate the kinetics of signal transfer.
Bipolar and horizontal cell responses to presynaptic frequency sweeps and impulses
In addition to probing synaptic transmission with presynaptic steps and sinewaves of a single frequency, we probed the kinetics of transmission using sinewaves with a time-varying frequency (frequency sweeps) and presynaptic impulses (Fig.4). Frequency sweeps were 5–10 mV in amplitude, lasted either 10 or 30 sec, and had a maximal frequency of 16 Hz. As for single-frequency sinewaves (Fig. 2), the responses of ON bipolar cells were roughly symmetrical around the baseline current (Fig. 4A), and those of horizontal cells were rectifying (data not shown), with larger inward currents. No recordings were made from OFF bipolar cells with this stimulus.
Fig. 4.

Probing the bandpass of synaptic transmission using other presynaptic stimuli. A, Postsynaptic current response recorded in an ON bipolar cell elicited by a presynaptic sinewave that increased linearly in frequency. The presynaptic frequency sweep lasted 30 sec, was 10 mV in amplitude, was centered around −40 mV, and had a maximum frequency of 16 Hz. The top axis indicates the frequency of the presynaptic stimulus, and the bottom axis indicates time. Postsynaptic current (B) and voltage (C) responses in a horizontal cell and current responses in an ON bipolar cell (D, black traces) elicited by 20 msec duration presynaptic voltage steps to −130 mV from a holding potential of −40 mV are shown. The presynaptic stimulus is shown at the top of each panel. These impulse responses were well fit by a sinewave that decays in amplitude (gray traces; see Results for equation). The frequency of the fit decaying sinewave is indicated. Postsynaptic cells were held at −60 mV in B andD.
In both ON bipolar and horizontal cells the size of the postsynaptic response increased as the frequency increased from 0 to 2 Hz. The postsynaptic response peaked between 2 and 4 Hz and then decreased dramatically as the frequency increased from 4 to 16 Hz (Fig.4A). In fact, the amplitude of the response near 16 Hz was not much larger than the background noise in the postsynaptic cell. A similar frequency dependence was observed when the sinewave increased (n = 7) or decreased (n = 3) in frequency and when the phase of the presynaptic sinewave was changed by 180o. A peak gain signal transfer for frequencies between 2 and 4 Hz agrees well with the peak measured with single-frequency sinewaves (Fig. 3D).
The bandpass filtering described above predicts that the postsynaptic response to a presynaptic impulse should be an oscillation at the preferred frequency for signal transfer, i.e., 2–4 Hz. To test this prediction we stepped the rod voltage for 20 msec from −40 to −130 mV while recording the postsynaptic response (Fig. 4B); smaller or briefer presynaptic voltage steps produced less robust postsynaptic responses. In voltage-clamped OFF bipolar (n = 4) and horizontal (n = 4) cells, this stimulus first elicited a brief and generally small transient outward current, the expected result of suppression of glutamate release. This initial transient was followed by damped sinusoidal oscillations (Fig. 4B). Similar oscillations, but of the opposite polarity, were elicited in ON bipolar cells (n = 5) (Fig. 4D). Oscillations were also observed with the postsynaptic cell under current clamp (Fig.4C).
To compare the frequency of these oscillations with the bandpass of transmission as measured with sinusoidal presynaptic stimuli, the impulse responses were fit with a sinewave that decays in amplitude:
Here A0 is the offset current or voltage, A1 is the initial amplitude of the sinewave, t is the time, τd is the time constant of the decay in amplitude, f is the frequency of the decaying sinewave, and Φ is the phase of the response. In 12 of 13 cells the postsynaptic responses elicited by the presynaptic impulse were well fit by this equation. The frequency of the postsynaptic oscillations averaged 2.7 ± 0.5 Hz (mean ± SD), in good agreement with the peak frequency of the bandpass filter inferred from sinusoidal presynaptic stimuli (Fig. 3D).
Contribution of the rod network to signal transfer
The experiments described above show that signal transfer from rods to second-order cells acts as a bandpass filter. Because spread of signals through the rod network influences the postsynaptic responses (Fig. 1A), transmitter release from neighboring rods could contribute to the observed bandpass. To estimate the contribution of the rod network to the kinetics of signal transfer, we modeled the response of the network to signals injected into a single rod.
Rod signals are altered as they travel through the network of electrically coupled rods in amphibian and reptilian retinas (Copenhagen and Owen, 1976; Schwartz, 1976; Detwiler et al., 1978,1980; Torre and Owen, 1983). Interestingly, the rod network acts as a high-pass temporal filter, attenuating and speeding signals as they travel through the network. This high-pass filtering is generated by a hyperpolarization-activated current (Ih) in the rod inner segment (Attwell and Wilson, 1980; Owen and Torre, 1983). Membrane hyperpolarization opens Ih, producing an inward current that counteracts the hyperpolarization. BecauseIh activates with a time constant of several hundred milliseconds (Bader et al., 1982; Demontis et al., 1999), it has a more pronounced impact on slow changes in voltage than on fast changes.
Figure 5 illustrates the model used to investigate the filtering properties of the rod network. Salamander rods form a roughly square array, with each rod electrically coupled to the four rods around it (Fig. 5A) (for review, see Attwell, 1986). Cones were not included in the model because the strength of rod–rod coupling is ∼10 times greater than rod–cone coupling (Attwell et al., 1984). The model assumed that slicing removed half of the network; the orientation of the slice relative to the rod array made little difference in the output of the model (data not shown).
Fig. 5.

Modeling the rod network. A, Diagram of the rod network (adapted from Attwell, 1986). The rods (filled circles) are organized into a square array with the cones (open circles) between the rods. Lines between cells indicate electrical coupling. In this model the rod array was cut horizontally. The black circle is the primary rod to which the voltage signal is applied. The red, orange, green, and blue circles are the second, third, fourth, and fifth rods, respectively, downstream from the primary rod. The stimulus applied to the primary rod was 10 mV in amplitude centered around −40 mV. The stimulus frequency varied from 0.1 to 16 Hz. The resting potential of the other rods in the network was −40 mV.B–E, RC circuit model of the rod membrane. B, Diagram of the model RC circuit. The rod membrane is modeled as capacitor (Cm) in parallel with a resistor (Rm). Each rod in the array is connected to neighboring rods through a coupling resistance (Rc). The values of the circuit elements used in this model areRc = 300 MΩ,Rm = 0.5 GΩ, andCm = 26 pF. C, Modeled voltage signal in each cell type resulting from a 2 Hz sinewave applied to the primary rod. D, Plot of amplitude of the voltage change in each cell versus frequency. E, Plot of the phase of the voltage change in each cell versus frequency.F–I, RL circuit model of the rod membrane (Owen and Torre, 1983; Torre and Owen, 1983).F, In this model the rod membrane is modeled as an inductor (L) in series with a resistor (R2), both of which are in parallel with a second resistor (R1). As in the RC model, each rod is connected to neighboring rods through a resistor (Rc). The values of the elements in this model are RC = 360 MΩ, L = 0.5 GH,R1 = 710 MΩ, andR2 = 3.3 GΩ (Owen and Torre, 1983).G, Modeled voltage signal in each cell type resulting from a 2 Hz sinewave applied to the primary rod. H, Plot of amplitude of the voltage change in each cell versus frequency.I, Plot of the phase of the voltage change in each cell versus frequency. Colors are consistent throughout the figure. Note that although the rods straight above the primary rod have three downstream cells, those horizontal or diagonal from the primary rod have only two downstream cells. Although the data shown in this figure are only from the rods that have two downstream cells, our final model included the contribution made by the rods with three downstream cells.
Rod–rod coupling (Rc) was assumed to be purely resistive. The rod itself was modeled as either a capacitor in parallel with a resistor (RC circuit) (Fig. 5B) or an inductor in series with a resistor, both of which are in parallel with a second resistor (RL circuit) (Fig. 5F) to consider the effects of Ih. The voltage of the “primary” rod, representing the experimentally recorded rod, was modulated using stimuli identical to those used in the paired recordings in Figure 2, with the addition of a lower frequency stimulus; the voltage of the primary rod was modulated sinusoidally at frequencies between 0.1 and 16 Hz, with a sinusoid 10 mV in amplitude centered around −40 mV. Although the voltage changes simulated in Figure 5 are from rods 1, 2, 3, and 4 connections downstream from the primary rod, the final model included contributions from the rods up to eight connections from the primary rod; the model predicted essentially no voltage change in more distant rods. These voltage changes were then passed through a simple model for transmitter release.
Modeling rod membrane as an RC circuit
Although the physiology shows that the rod network acts as a high-pass filter, one normally thinks of cells as low-pass filters because of their membrane time constant. Thus, we first modeled the rod as an RC circuit (Fig. 5B). The values of the capacitor (Cm) and the resistor (Rm) were 26 pF (average measured from 57 rods) and 0.5 GΩ (Rieke and Schwartz, 1996). The rod–rod coupling resistance (Rc) had a value of 300 MΩ (Attwell 1986) (Fig. 5B).
In this model, the amplitude of the voltage modulations fell by a factor of ∼2 for each connection (Fig. 5C), as expected from the voltage divider formed by the rod input resistance (Rm) and the coupling resistance (Rc). The voltage modulations showed little frequency dependence (Fig. 5D). Significant phase lags in the signals in the surrounding rods were introduced by the low-pass filtering, with the lag increasing with frequency and with distance from the primary rod (Fig. 5E). When the time constant of the cell was increased, by increasing eitherRm orCm, rods downstream of the primary rod showed smaller voltage changes and larger phase shifts relative to the primary rod. Conversely, when the time constant of the cell was decreased, downstream rods showed larger voltage changes and smaller phase shifts. Increasing the coupling resistance also caused a more rapid decrease in the voltage signal with distance.
Modeling rod membrane as an RL circuit
To estimate how Ih and the associated high-pass filtering of the rod network contributed to the measured bandpass filtering, the rod membrane was modeled as an RL circuit (Fig. 5F). The inductive component attributable to Ih was described as a resistance of 710 MΩ (R1) in parallel with a resistance of 3.3 GΩ (R2) in series with an inductance of 0.5 GH (L) (Owen and Torre, 1983).
As in the RC model, voltage changes fell by a factor of ∼2 across each connection at low frequencies (Fig. 5G). The amplitude of the signal in the rods downstream of the primary rod, however, changed with frequency, with low frequencies attenuated (Fig.5H). This frequency dependence is the result of the low impedance of the inductor at low frequencies, which inhibits the spread of signals in the network. In contrast to the RC model, in the RL model responses of downstream rods had phase leads that were larger with distance from the primary rod and that first increased and then decreased with frequency (Fig. 5I). This peak in the frequency versus phase curve is reminiscent of the phase shifts in signal transfer from rods to second-order cells (Fig. 3E), suggesting that one of the components of transmission is electrically equivalent to an RL circuit.
Model for transmitter release
The final step in our model to assess the influence of the rod network on rod to second-order cell signal transfer was to convert the modeled voltage change in each rod to transmitter release. Voltage changes were first converted to changes in intracellular calcium ([Ca2+]) using an expression fit to fluorescence measurements from synaptic terminals of isolated rods (Rieke and Schwartz, 1996):
where V is the rod voltage in millivolts. The calcium concentration was then converted to transmitter release assuming release scaled linearly (Witkovsky et al., 1997) or as the square (Belgum and Copenhagen, 1988) of the calcium concentration. Finally, the change in release was summed across the rod network (Fig.6). This model assumes that the second-order cells receive equal input from all of the modeled rods, as expected from the size of the bipolar and horizontal receptive fields in salamander retina (Hare and Owen, 1990). The model also assumes that calcium and transmitter release instantaneously track changes in rod voltage, allowing us to determine how much the network alone could contribute to the measured kinetics of signal transfer.
Fig. 6.

Transmitter release modeled from the rod network. Predicted release for network models with the rod membrane modeled as an RC (A–C) or an RL circuit (D–F). Release was either assumed to scale linearly with the calcium concentration ([Ca2+]) (A, D) or as the square of [Ca2+] (B, E). The predicted waveform of release for frequencies between 0.25 and 16 Hz is shown with the time axis normalized by the stimulus period to facilitate comparison. The amplitude of the release predicted by each model is shown as a function of frequency (C,F), with the open squares showing the amplitude of release when linearly dependent on [Ca2+] and with the closed circles showing the amplitude of release when dependent on the square of [Ca2+]. The dotted trace is the fit of the measured bandpass of transmission from Figure3D.
The impact of the rod membrane modeled as an RC or an RL circuit on the kinetics of transmitter release, and hence signal transfer, is summarized in Figure 6. For both models the release predicted for a squared relation (Fig. 6B,E) was less sinusoidal than the predicted release for a linear relation (Fig.6A,D). The measured postsynaptic responses in ON bipolar cells (Fig. 2B), where the kinetics of the postsynaptic receptors are less likely to influence the response, are sinusoidal, suggesting that release might depend linearly or near linearly on rod [Ca2+]. The phase shifts of the modeled release with frequency were much smaller than observed, indicating that a step other than spread of the presynaptic signal through the rod network produced the observed phase dependence of signal transfer.
To compare modeled release with the measured bandpass of transmission, the amplitude of modeled release at each frequency was normalized by the maximum (Fig. 6C,F). In both circuit models the rod network was predicted to have a larger effect when release scaled linearly with [Ca2+]. Although modeling predicts that low-pass filtering by the membrane time constant of the rod does not contribute substantially to the measured filtering in signal transfer (Fig. 6C), high-pass filtering conferred by Ih could account for as much as half of the measured high-pass filtering if release depended linearly on [Ca2+] and as much as 25–30% if release depended on the square (Fig.6F).
Evidence that bandpass filtering is mediated presynaptically
The bandpass filtering illustrated in Figures 2 and 3 could be mediated, in principle, either presynaptically or postsynaptically. The similarity in the filtering between rods and the three different types of postsynaptic cells—ON and OFF bipolars and horizontals—suggests that presynaptic mechanisms predominate. The time course and rate of mEPSCs recorded in OFF bipolars provided further evidence for this conclusion.
Discrete inward currents were apparent in a subset of the recorded OFF bipolar cells (Fig. 7A) (3 of 11 cells). The frequency dependence of signal transfer from rods to these OFF bipolar cells was similar to that in Figure 3. These discrete events were suppressed by steady illumination, their rate was altered transiently by changes in rod voltage, and they had a reversal potential near 0 mV. On the basis of these characteristics we identified the events as mEPSCs (Maple et al., 1994). The mEPSCs had a total duration of <10 msec, indicating that OFF bipolar cells can respond rapidly to changes in transmitter release. A similar conclusion can be reached from experiments in which the rod was stepped from −60 mV to a more depolarized potential. Such voltage steps produced fast responses in both OFF bipolar (Fig.1A,B) and horizontal cells (data not shown), indicating that in both of these cell types the postsynaptic machinery is capable of responding quickly to rapid changes in transmitter release. Thus the kinetics of the postsynaptic receptors do not appear to contribute significantly to the attenuation of high frequencies during signal transfer.
Fig. 7.

Bandpass filtering cannot be explained by postsynaptic mechanisms. A, Response of an OFF bipolar cell to step depolarization of a rod from −60 to −40 mV. The noisy traces show two individual responses; the brief inward currents are mEPSCs. B, Histograms of the current minima from 17 trials like those in A. Histograms for rod voltages of −60 and −40 mV are plotted. Current minima were identified as recorded data points with amplitudes smaller than the adjacent points (1 msec sampling interval, bandwidth 0–300 Hz). Only sections of data recorded >400 msec after the voltage step were used.
The mEPSC rate also indicates that the attenuation of low temporal frequencies in signal transfer is dominated by presynaptic mechanisms. Depolarization of the rod caused a transient increase in the mEPSC rate (Fig. 7A), which is reflected in the transient postsynaptic response recorded in OFF bipolar cells (Fig. 1A). Several hundred milliseconds after the voltage step, the rate of mEPSCs appears to return to a level close to that before the step (Fig.7A). This was confirmed by comparing histograms of the current minima in OFF bipolar cells with the rod held at −60 and −40 mV (Fig. 7B). The histograms are quite similar, indicating that neither the rate nor the size of the mEPSCsdepended strongly on the steady-state rod voltage. Thus, the low-frequency attenuation that we find in signal transfer from rods to second-order cells is likely attributable to the insensitivity of the rate of transmitter release from the rod synapse to low-frequency changes in rod voltage. Several presynaptic mechanisms could account for this insensitivity (see Discussion).
Spontaneous oscillations
Occasionally (in ∼5/100 experiments) we found retinas that exhibited sustained spontaneous oscillations. Examples of these oscillations are shown in Figure8A. Oscillations were recorded in rods (n = 3), ON (n = 3) and OFF (n = 2) bipolar cells, and ganglion cells (n = 5) and occurred over a narrow range of frequencies, between 1.8 and 2.4 Hz (2.2 ± 0.2 Hz; mean ± SD). In the rods the oscillations were quite small, with amplitudes of only a few picoamperes, whereas in ON and OFF bipolar cells they had on average an amplitude of 21 pA (SD = 11.5). This increase in amplitude from rods to bipolar cells is consistent with previous measures of the gain of rod–bipolar signal transfer (Ashmore and Falk, 1980; Attwell et al., 1987; Capovilla et al., 1987; Belgum and Copenhagen, 1988; Witkovsky et al., 1997). Oscillations in ganglion cells had amplitudes of 12.5 ± 5.5 pA (mean ± SD).
Fig. 8.

Spontaneous oscillations in the salamander retina.A, Spontaneous current oscillations in a rod, an ON bipolar cell, and a retinal ganglion cell. The rod and ON bipolar cell traces were recorded simultaneously. In both of these cells the frequency of the oscillations was 2.3 Hz. The oscillations in the ganglion cell were 2.4 Hz. The oscillations in the rod, ON bipolar cell, and ganglion cell were centered around −96, −169, and −50 pA, respectively. B, Oscillations in an ON bipolar cell are suppressed by dim light. Current recordings were measured from an ON bipolar cell before, during, and after dim illumination, producing approximately three photoisomerizations per rod per second. The oscillations before and after illumination had frequencies of 2.2 and 2.1 Hz and were centered around −24 and −39 pA, respectively. The resting current during illumination was −25 pA. All cells were held at −60 mV.
In paired recordings, the spontaneous oscillations in the presynaptic and postsynaptic cells had the same frequency and were phase locked (n = 4). Generally when one cell in the retina was found to oscillate, all other cells in the retina from which recordings were made were also found to oscillate spontaneously. The recording conditions used in these experiments were identical to those used in the others, and thus it is unclear why a few retinas exhibited this behavior whereas most did not.
Oscillations of various frequencies have been documented at many levels in the visual system. Among these are sustained spontaneous oscillations in the membrane voltage of retinal neurons with frequencies similar to those shown here (Normann and Pochobradsky, 1976). As in this previous study, we found that oscillations were suppressed by illumination. Figure 8B shows an example of inhibition of spontaneous oscillations by light in an ON bipolar cell. Steady illumination delivering as few as three photons per rod per second was sufficient to eliminate the oscillatory behavior. The oscillations recovered fully (n = 4) after the light was turned off. Oscillations could also be transiently suppressed by flashes delivering ∼15 photons per rod (data not shown; n = 7).
The presence of spontaneous oscillations in the rods themselves and the low light levels required to suppress them suggested that they were generated by mechanisms intrinsic to the rods. Cone signals can be relayed to rods through gap junctions; however, the light levels used here to suppress oscillations produce moderate responses in the rods, but essentially no response in cones (Perry and McNaughton, 1991). No other cells are known to provide input to the rods. Indeed, modeling work suggests that imbalances in voltage-activated conductances can cause rods to oscillate spontaneously in this frequency range (Kamiyama et al., 1996).
Discussion
Our understanding of synaptic transmission is based primarily on studies of synapses of spiking cells, which transmit large, rapid changes in voltage produced by action potentials. The situation at the amphibian rod synapse is very different, because the signal resulting from a single photon is ∼1000× smaller and 1000× longer lasting than an action potential. This suggests that separation of signal from noise is more important at the rod synapse than rapid transmission of changes in rod voltage. The work described here shows that the kinetics of signal transfer from rods to second-order cells in the salamander retina differs substantially from expectations based on synapses made by spiking cells. In particular, both low and high temporal frequencies in the rod signals are attenuated during signal transfer. Below we discuss several mechanisms that might contribute to filtering at the rod synapse and its functional role in processing the rod light responses.
Mechanisms controlling kinetics of synaptic transmission
Signal transfer from rods to second-order cells attenuated temporal frequencies <1.5 and >4 Hz. Two observations indicate that presynaptic rather than postsynaptic mechanisms dominate both the low-pass and high-pass components of signal transfer. First, the kinetics of signal transfer from rods to ON bipolar, OFF bipolar, and horizontal cells were similar, despite substantial differences in the postsynaptic machinery. Second, the rate of mEPSCs in OFF bipolar cells was insensitive to steady-state changes in rod voltage.
The dominant role of presynaptic mechanisms in shaping postsynaptic responses differs from previous work on cone signals. In turtle, cone-driven light responses in ON bipolar cells are slower than those in OFF bipolars (Ashmore and Copenhagen, 1980), likely a result of delays inherent to the second-messenger cascade linking metabotropic glutamate receptors and cation channels in ON bipolars (Kim and Miller, 1993, their Fig. 1). Furthermore, in mammalian retina the kinetics of the responses of different types of OFF bipolar cells to depolarizing steps in cone voltage differ because of differences in receptor desensitization (DeVries, 2000). Although we also find that depolarizing steps in rod voltage elicit responses with different kinetics in ON bipolar and OFF bipolar and horizontal cells (Fig.1A), with more physiologically relevant stimuli these kinetic differences are essentially obscured by presynaptic mechanisms (Fig. 3A,B).
Modeling indicated that spread of the presynaptic signal through the rod network could account for 25–50% of the attenuation of low-frequency changes in rod voltage. We attribute the remaining high-pass filtering to the properties of the rod output synapse. One presynaptic mechanism that could contribute is negative feedback control of transmitter release. Such a feedback could be provided by Ca2+-dependent inactivation of voltage-activated Ca2+ channels (Kobayashi and Tachibana, 1995; von Gersdorff and Matthews, 1996) or by modulation of the voltage dependence of the Ca2+current by pH (Barnes and Bui, 1991; Barnes et al., 1993; DeVries, 2001) or Cl− (Thoreson et al., 1997). Either mechanism could counter changes in transmitter release by making compensatory changes in the Ca2+ current, thus rendering the rate of transmitter release insensitive to the steady-state rod voltage. The impact of such a feedback on the kinetics of signal transfer would depend on the delay with which the feedback acted. The observed low-frequency attenuation between rod and second-order cells would require a feedback delay of several hundred milliseconds.
Although our model suggests that a significant portion of low-frequency attenuation could be caused by signal spread through the rod network, the same was not true for high-frequency attenuation. Instead, the rod output synapse seemed to account for essentially all of this low-pass filtering. Low-pass filtering is unexpected from studies of synaptic transmission in spiking cells. In these cells, colocalization of the presynaptic Ca2+ channels with the exocytotic machinery assures fast transmission, because the time required for Ca2+ to diffuse to the release site is <1 msec (for review, see Neher, 1998). As a consequence, the delay between invasion of an action potential into the presynaptic terminal and vesicle fusion is at most a few milliseconds. This time scale is much too short to account for the low-pass filtering of signals at the rod synapse, which has a time constant of ∼200 msec.
The dynamics of the presynaptic Ca2+signal controlling transmitter release could mediate low-pass filtering at the rod synapse. Unlike spiking cells, for which transmitter release is thought to require Ca2+ concentrations reached only near the mouth of an open Ca2+ channel (∼100 μm) (Neher, 1998), exocytosis from the rod synapse can be stimulated by Ca2+ concentrations as low as 2–4 μm (Rieke and Schwartz, 1996). Therefore, close proximity of Ca2+ channels and vesicle fusion sites is not essential for release from the rod synaptic terminal. Indeed, because a small fraction of the Ca2+channels of the rod are open at physiological voltages (Bader et al., 1982), most vesicle fusion sites are far from an open Ca2+ channel. If transmitter release in salamander rods is dominated by Ca2+diffusing from open Ca2+ channels to distant release sites, the postsynaptic response would be insensitive to high-frequency changes in presynaptic voltage. This model does not preclude rapid release of transmitter after nonphysiological depolarizations that open most of the Ca2+channels. Consistent with this view, bipolar cells, which like rods contain ribbon-type synapses, show several modes of transmitter release, with continuous vesicle cycling for voltages where Ca2+ influx is slow and rapid and synchronous release for large depolarizations that open most of the Ca2+ channels (von Gersdorff and Matthews, 1994; Lagnado et al., 1996; Rouze and Schwartz, 1998).
Functional importance of bandpass filtering
Information about the visual scene is encoded by the times at which photons are absorbed by the rods. Arrival times, however, are blurred by the slow kinetics of phototransduction and obscured by noise introduced during this process. In the absence of noise, the slow kinetics could be compensated and photon arrival times recovered. Rod noise limits the accuracy of this process. Thus extracting the photon arrival times from the rod signals involves attenuating both low temporal frequencies that carry little timing information and high temporal frequencies that are dominated by noise (Bialek and Owen, 1990; Rieke et al., 1991).
Noise dominates the electrical signals of the rod at temporal frequencies >2–4 Hz (Baylor et al., 1980; Vu et al., 1997). The observed low-pass filtering in signal transfer attenuates these frequencies and thus serves to separate signal and noise in the rod responses. In mouse retina, an additional mechanism, a thresholding nonlinearity at the rod-to-rod bipolar synapse, serves to transmit single photon signals but not noise (Field and Rieke, 2002). Electrical coupling between rods makes a similar strategy ineffective in amphibian retina because noise from adjacent rods is mixed before single photon responses reach the rod synaptic terminal.
The light responses of bipolar and horizontal cells are considerably briefer than those of the rods from which they receive input (Schnapf and Copenhagen, 1982; Bialek and Owen, 1990) (Fig.9A). This difference in kinetics is similar in bipolar and horizontal cells and thus cannot be attributed to amacrine feedback to the bipolar terminal. Indeed, the bandpass filtering during synaptic transmission that we characterize here can account for the “lion's share” of the change in kinetics (Fig. 9). The overall shape of the light response recorded from second-order cells (Fig. 9A) could be reproduced by passing the light response of the rod through our model of the kinetics of synaptic transfer (Fig. 9B). Both the recorded and predicted second-order cell responses peaked during the rising phase of the rod response and were nearly half the duration of the rod response. Thus, filtering during signal transfer extracts temporal information by preferentially transmitting the rising phase of the slow rod response.
Footnotes
This work was supported by National Institutes of Health Grants EY-11850 (F.R.) and EY-06993 (C.A.G.). We thank Greg Field, Kerry Kim, and Maria McKinley for helpful discussions, and Eric Martinson for excellent technical assistance.
Correspondence should be addressed to Fred Rieke, Department of Physiology and Biophysics, Box 357290, University of Washington, Seattle, WA 98195. E-mail:rieke@u.washington.edu.
References
- 1.Ashmore JF, Copenhagen DR. Different postsynaptic events in two types of retinal bipolar cell. Nature. 1980;288:84–86. doi: 10.1038/288084a0. [DOI] [PubMed] [Google Scholar]
- 2.Ashmore JF, Falk G. Responses of rod bipolar cells in the dark-adapted retina of the dogfish, Scyliorhinus canicula. J Physiol (Lond) 1980;300:115–150. doi: 10.1113/jphysiol.1980.sp013155. [DOI] [PMC free article] [PubMed] [Google Scholar]
- 3.Attwell D. The Sharpey-Schafer lecture: ion channels and signal processing in the outer retina. Quart J Exp Physiol. 1986;71:497–536. [PubMed] [Google Scholar]
- 4.Attwell D, Wilson M. Behaviour of the rod network in the tiger salamander retina mediated by membrane properties of individual rods. J Physiol (Lond) 1980;309:287–315. doi: 10.1113/jphysiol.1980.sp013509. [DOI] [PMC free article] [PubMed] [Google Scholar]
- 5.Attwell D, Wilson M, Wu SM. A quantitative analysis of interactions between photoreceptors in the salamander (Ambystoma) retina. J Physiol (Lond) 1984;352:703–737. doi: 10.1113/jphysiol.1984.sp015318. [DOI] [PMC free article] [PubMed] [Google Scholar]
- 6.Attwell D, Borges S, Wu SM, Wilson M. Signal clipping by the rod output synapse. Nature. 1987;328:522–524. doi: 10.1038/328522a0. [DOI] [PubMed] [Google Scholar]
- 7.Bader CR, Bertrand D, Schwartz EA. Voltage-activated and calcium-activated currents studied in solitary rod inner-segments from the salamander retina. J Physiol (Lond) 1982;331:253–284. doi: 10.1113/jphysiol.1982.sp014372. [DOI] [PMC free article] [PubMed] [Google Scholar]
- 8.Barnes S, Bui Q. Modulation of calcium-activated chloride current via pH-induced changes of calcium channel properties in cone photoreceptors. J Neurosci. 1991;11:4015–4023. doi: 10.1523/JNEUROSCI.11-12-04015.1991. [DOI] [PMC free article] [PubMed] [Google Scholar]
- 9.Barnes S, Merchant V, Mahmud F. Modulation of transmission gain by protons at the photoreceptor output synapse. Proc Natl Acad Sci USA. 1993;90:10081–10085. doi: 10.1073/pnas.90.21.10081. [DOI] [PMC free article] [PubMed] [Google Scholar]
- 10.Baylor DA, Lamb TD, Yau KW. Responses of retinal rods to single photons. J Physiol (Lond) 1979;288:613–634. [PMC free article] [PubMed] [Google Scholar]
- 11.Baylor DA, Matthews G, Yau KW. Two components of electrical dark noise in toad retinal rod outer segments. J Physiol (Lond) 1980;309:591–621. doi: 10.1113/jphysiol.1980.sp013529. [DOI] [PMC free article] [PubMed] [Google Scholar]
- 12.Belgum JH, Copenhagen DR. Synaptic transfer of rod signals to horizontal and bipolar cells in the retina of the toad (Bufo marinus). J Physiol (Lond) 1988;396:225–245. doi: 10.1113/jphysiol.1988.sp016960. [DOI] [PMC free article] [PubMed] [Google Scholar]
- 13.Berntson A, Taylor WR. Response characteristics and receptive field widths of on-bipolar cells in the mouse retina. J Physiol (Lond) 2000;524:879–889. doi: 10.1111/j.1469-7793.2000.00879.x. [DOI] [PMC free article] [PubMed] [Google Scholar]
- 14.Bialek W, Owen WG. Temporal filtering in retinal bipolar cells. Elements of an optimal computation? Biophys J. 1990;58:1227–1233. doi: 10.1016/S0006-3495(90)82463-2. [DOI] [PMC free article] [PubMed] [Google Scholar]
- 15.Capovilla M, Hare WA, Owen WG. Voltage gain of the signal transfer from retinal rods to bipolar cells in the tiger salamander. J Physiol (Lond) 1987;391:125–140. doi: 10.1113/jphysiol.1987.sp016730. [DOI] [PMC free article] [PubMed] [Google Scholar]
- 16.Copenhagen DR, Owen WG. Coupling between rod photoreceptors in the vertebrate retina. Nature. 1976;260:57–59. doi: 10.1038/260057a0. [DOI] [PubMed] [Google Scholar]
- 17.Demontis GC, Longoni B, Barcaro U, Cervetto L. Properties and functional roles of hyperpolarization-gated currents in guinea-pig retinal rods. J Physiol (Lond) 1999;515:813–828. doi: 10.1111/j.1469-7793.1999.813ab.x. [DOI] [PMC free article] [PubMed] [Google Scholar]
- 18.Detwiler PB, Hodgkin AL, McNaughton PA. A surprising property of electrical spread in the network of rods in the turtle's retina. Nature. 1978;274:562–565. doi: 10.1038/274562a0. [DOI] [PubMed] [Google Scholar]
- 19.Detwiler PB, Hodgkin AL, McNaughton PA. Temporal and spatial characteristics of the voltage response of rods in the retina of the snapping turtle. J Physiol (Lond) 1980;300:213–250. doi: 10.1113/jphysiol.1980.sp013159. [DOI] [PMC free article] [PubMed] [Google Scholar]
- 20.DeVries SH. Bipolar cells use kainate and AMPA receptors to filter visual information into separate channels. Neuron. 2000;28:847–856. doi: 10.1016/s0896-6273(00)00158-6. [DOI] [PubMed] [Google Scholar]
- 21.DeVries SH. Exocytosed protons feedback to suppress the Ca2+ current in mammalian cone photoreceptors. Neuron. 2001;32:1107–1117. doi: 10.1016/s0896-6273(01)00535-9. [DOI] [PubMed] [Google Scholar]
- 22.Dowling JE, Ripps H. Neurotransmission in the distal retina: the effect of magnesium on horizontal cell activity. Nature. 1973;242:101–103. doi: 10.1038/242101a0. [DOI] [PubMed] [Google Scholar]
- 23.Euler T, Masland RH. Light-evoked responses of bipolar cells in a mammalian retina. J Neurophysiol. 2000;83:1817–1829. doi: 10.1152/jn.2000.83.4.1817. [DOI] [PubMed] [Google Scholar]
- 24.Fain GL. Quantum sensitivity of rods in the toad retina. Science. 1975;187:838–841. doi: 10.1126/science.1114328. [DOI] [PubMed] [Google Scholar]
- 25.Field GD, Rieke F. Nonlinear signal transfer from mouse rods to bipolar cells and implications for visual sensitivity. Neuron. 2002;34:773–785. doi: 10.1016/s0896-6273(02)00700-6. [DOI] [PubMed] [Google Scholar]
- 26.Hamill OP, Marty A, Neher E, Sakmann B, Sigworth FJ. Improved patch-clamp techniques for high-resolution current recording from cells and cell-free membrane patches. Pflügers Arch. 1981;391:85–100. doi: 10.1007/BF00656997. [DOI] [PubMed] [Google Scholar]
- 27.Hare WA, Owen WG. Spatial organization of the bipolar cell's receptive field in the retina of the tiger salamander. J Physiol (Lond) 1990;421:223–245. doi: 10.1113/jphysiol.1990.sp017942. [DOI] [PMC free article] [PubMed] [Google Scholar]
- 28.Horn R, Marty A. Muscarinic activation of ionic currents measured by a new whole-cell recording method. J Gen Physiol. 1988;92:145–159. doi: 10.1085/jgp.92.2.145. [DOI] [PMC free article] [PubMed] [Google Scholar]
- 29.Kamiyama Y, Ogura T, Usui S. Ionic current model of the vertebrate rod photoreceptor. Vision Res. 1996;36:4059–4068. doi: 10.1016/s0042-6989(96)00178-2. [DOI] [PubMed] [Google Scholar]
- 30.Kim HG, Miller RF. Properties of synaptic transmission from photoreceptors to bipolar cells in the mudpuppy retina. J Neurophysiol. 1993;69:352–360. doi: 10.1152/jn.1993.69.2.352. [DOI] [PubMed] [Google Scholar]
- 31.Kobayashi K, Tachibana M. Ca2+ regulation in the presynaptic terminals of goldfish retinal bipolar cells. J Physiol (Lond) 1995;483:79–94. doi: 10.1113/jphysiol.1995.sp020569. [DOI] [PMC free article] [PubMed] [Google Scholar]
- 32.Lagnado L, Gomis A, Job C. Continuous vesicle cycling in the synaptic terminal of retinal bipolar cells. Neuron. 1996;17:957–967. doi: 10.1016/s0896-6273(00)80226-3. [DOI] [PubMed] [Google Scholar]
- 33.Maple BR, Werblin FS, Wu SM. Miniature excitatory postsynaptic currents in bipolar cells of the tiger salamander retina. Vision Res. 1994;34:2357–2362. doi: 10.1016/0042-6989(94)90281-x. [DOI] [PubMed] [Google Scholar]
- 34.Neher E. Vesicle pools and Ca2+ microdomains: new tools for understanding their roles in neurotransmitter release. Neuron. 1998;20:389–399. doi: 10.1016/s0896-6273(00)80983-6. [DOI] [PubMed] [Google Scholar]
- 35.Normann RA, Pochobradsky J. Oscillations in rod and horizontal cell membrane potential: evidence for feed-back to rods in the vertebrate retina. J Physiol (Lond) 1976;261:15–29. doi: 10.1113/jphysiol.1976.sp011546. [DOI] [PMC free article] [PubMed] [Google Scholar]
- 36.Owen WG, Torre V. High-pass filtering of small signals by retinal rods. Biophys J. 1983;41:325–339. doi: 10.1016/S0006-3495(83)84444-0. [DOI] [PMC free article] [PubMed] [Google Scholar]
- 37.Perry RJ, McNaughton PA. Response properties of cones from the retina of the tiger salamander. J Physiol (Lond) 1991;433:561–587. doi: 10.1113/jphysiol.1991.sp018444. [DOI] [PMC free article] [PubMed] [Google Scholar]
- 38.Pugh EN, Lamb TD. Amplification and kinetics of the activation steps in phototransduction. Biochim Biophys Acta. 1993;1141:111–149. doi: 10.1016/0005-2728(93)90038-h. [DOI] [PubMed] [Google Scholar]
- 39.Rieke F, Baylor DA. Single-photon detection by rod cells of the retina. Rev Mod Phys. 1998;70:1027–1036. [Google Scholar]
- 40.Rieke F, Schwartz EA. Asynchronous transmitter release: control of exocytosis and endocytosis at the salamander rod synapse. J Physiol (Lond) 1996;493:1–8. doi: 10.1113/jphysiol.1996.sp021360. [DOI] [PMC free article] [PubMed] [Google Scholar]
- 41.Rieke F, Owen WG, Bialek W. Optimal filtering in the salamander retina. In: Touretzky D, Moody J, editors. Advances in neural information processing systems, Ed 3. Morgan Kaufmann; San Mateo, CA: 1991. pp. 377–383. [Google Scholar]
- 42.Rouze NC, Schwartz EA. Continuous and transient vesicle cycling at a ribbon synapse. J Neurosci. 1998;18:8614–8624. doi: 10.1523/JNEUROSCI.18-21-08614.1998. [DOI] [PMC free article] [PubMed] [Google Scholar]
- 43.Schnapf JL, Copenhagen DR. Differences in the kinetics of rod and cone synaptic transmission. Nature. 1982;296:862–864. doi: 10.1038/296862a0. [DOI] [PubMed] [Google Scholar]
- 44.Schwartz EA. Electrical properties of the rod syncytium in the retina of the turtle. J Physiol (Lond) 1976;257:379–406. doi: 10.1113/jphysiol.1976.sp011374. [DOI] [PMC free article] [PubMed] [Google Scholar]
- 45.Thoreson WB, Nitzan R, Miller RF. Reducing extracellular Cl− suppresses dihydropyridine-sensitive Ca2+ currents and synaptic transmission in amphibian photoreceptors. J Neurophysiol. 1997;77:2175–2190. doi: 10.1152/jn.1997.77.4.2175. [DOI] [PubMed] [Google Scholar]
- 46.Torre V, Owen WG.High-pass filtering of small signals by the rod network in the retina of the toad, Bufo marinus. Biophys J 411983305–324.0 [DOI] [PMC free article] [PubMed] [Google Scholar]
- 47.Trifonov IU.Study of synaptic transmission between photoreceptor and horizontal cell using electrical stimulations of the retina. Biofizika 131968809–917.0 [PubMed] [Google Scholar]
- 48.von Gersdorff H, Matthews G.Dynamics of synaptic vesicle fusion and membrane retrieval in synaptic terminals. Nature 3671994735–739.0 [DOI] [PubMed] [Google Scholar]
- 49.von Gersdorff H, Matthews G. Calcium-dependent inactivation of calcium current in synaptic terminals of retinal bipolar cells. J Neurosci. 1996;16:115–122. doi: 10.1523/JNEUROSCI.16-01-00115.1996. [DOI] [PMC free article] [PubMed] [Google Scholar]
- 50.Vu TQ, McCarthy ST, Owen WG. Linear transduction of natural stimuli by dark-adapted and light-adapted rods of the salamander, Ambystoma tigrinum. J Physiol (Lond) 1997;15:193–204. doi: 10.1111/j.1469-7793.1997.193bc.x. [DOI] [PMC free article] [PubMed] [Google Scholar]
- 51.Witkovsky P, Schmitz Y, Akopian A, Krizaj D, Tranchina D. Gain of rod to horizontal cell synaptic transfer: relation to glutamate release and a dihydropyridine-sensitive calcium current. J Neurosci. 1997;17:7297–7306. doi: 10.1523/JNEUROSCI.17-19-07297.1997. [DOI] [PMC free article] [PubMed] [Google Scholar]