

Abstract
The spatiotemporal dynamics of the sensory response in layer 2/3 of primary somatosensory cortex evoked by a single brief whisker deflection was investigated by simultaneous voltage-sensitive dye (VSD) imaging and whole-cell (WC) voltage recordings in the anesthetized rat combined with reconstructions of dendritic and axonal arbors of L2/3 pyramids. Single and dual WC recordings from pyramidal cells indicated a strong correlation between the local VSD population response and the simultaneously measured subthreshold postsynaptic potential changes in both amplitude and time course. The earliest VSD response was detected 10–12 msec after whisker deflection centered above the barrel isomorphic to the stimulated principal whisker. It was restricted horizontally to the size of a single barrel-column coextensive with the dendritic arbor of barrel-column-related pyramids in L2/3. The horizontal spread of excitation remained confined to a single barrel-column with weak whisker deflection. With intermediate deflections, excitation spread into adjacent barrel-columns, propagating twofold more rapidly along the rows of the barrel field than across the arcs, consistent with the preferred axonal arborizations in L2/3 of reconstructed pyramidal neurons. Finally, larger whisker deflections evoked excitation spreading over the entire barrel field within ∼50 msec before subsiding over the next ∼250 msec. Thus the subthreshold cortical map representing a whisker deflection is dynamic on the millisecond time scale and strongly depends on stimulus strength. The sequential spatiotemporal activation of the excitatory neuronal network in L2/3 by a simple sensory stimulus can thus be accounted for primarily by the columnar restriction of L4 to L2/3 excitatory connections and the axonal field of barrel-related pyramids.
Keywords: barrel cortex, layer 2/3, voltage-sensitive dye, imaging, in vivo, sensory response
Introduction
Determining the spatiotemporal structure of sensory responses in the neocortex is essential to understand how sensory information is processed in the cortical network and how it eventually drives a motor response or contributes to behavior and cognitive function. The rodent somatosensory barrel cortex is particularly well suited to this endeavor because each whisker on the snout of a rat is represented in the somatotopic map by a layer 4 barrel (Woolsey and Van der Loos, 1970), which can be visualized in living brain slices (Agmon and Connors, 1991; Petersen and Sakmann, 2000, 2001). Electrical stimulation of a layer 4 barrel in vitro evokes a time-dependent excitation that is limited laterally to the stimulated barrel-column (Petersen and Sakmann, 2001). Excitation could propagate within layer 2/3 when inhibition was blocked, suggesting that the balance between excitation and inhibition is a crucial determinant in governing the spatial extent of signals in barrel cortex. However, the neocortex in vivo is likely to be in a different state than in vitro because of the presence of neuromodulators and long-range synaptic connections. We were therefore motivated to identify the anatomical and functional factors that govern sensory stimulus representation in barrel cortex at a cellular level in vivo. Toward this goal, we recorded subthreshold and suprathreshold whisker-evoked responses from morphologically identified neurons in the context of the ensemble spatiotemporal dynamics.
Although high temporal resolution is obtained with extracellular or intracellular electrical recording, the spatial resolution is necessarily limited by the number of recording electrodes (Petersen and Diamond, 2000). High spatial resolution of the extent of whisker-evoked barrel cortex activity was first investigated by measuring 2-deoxyglucose uptake (Durham and Woolsey, 1977). Spatial information about single whisker-evoked barrel cortex activity in vivohas also been derived from optical imaging of intrinsic reflectance changes (Grinvald et al., 1986; Masino and Frostig, 1996) and functional magnetic resonance imaging (Yang et al., 1996). These techniques have provided compelling evidence for responses centered on barrels in the somatosensory cortex. However, the disadvantage of these techniques is that the time course of the responses is substantially slower than the changes in the electrical activity pattern of the neurons.
Voltage-sensitive dye (VSD) imaging of sensory-evoked responsesin vivo (Grinvald et al., 1984) has provided a technique offering both high spatial and high temporal resolution of neocortical responses in the barrel cortex (Orbach et al., 1985; Grinvald et al., 1986; London et al., 1989; Kleinfeld and Delaney, 1996; Takashima et al., 2001). Recently new “blue” voltage-sensitive dyes with fluorescence that is excited at wavelengths remote from the hemoglobin spectrum have been developed, thus allowing higher resolution imaging of cortical responses that are not contaminated by heart beat pulsation and hemodynamic changes (Shoham et al., 1999). Here we correlate the ensemble sensory-evoked electrical activity imaged using the blue dye with direct measurement of membrane potential changes in individual layer 2/3 pyramidal neurons, which we subsequently anatomically reconstructed. We investigate how a simple stimulus is represented on the cortical surface in time and space. The results suggest that the subthreshold synaptic input to L2/3 on deflection of a single whisker is changing rapidly in the millisecond time scale across the cortical surface. Synaptic activity can last from tens to hundreds of milliseconds and can vary in extent from a single column to multiple columns across the entire barrel field. We identify the dendritic and axonal arbors of L2/3 pyramids as morphological determinants of this dynamic behavior.
Materials and Methods
Surgical procedures and dye staining. Wistar rats aged postnatal day 21–28 were anesthetized with urethane (1–2 gm/kg) or halothane (1.5% during surgery, reduced to 0.5–1% during recording). Paw withdrawal, whisker movement, and eye blink reflexes were mostly absent. Reflexes were tested regularly during the surgical procedures, and additional urethane (20% original dose) was administered in cases in which reflexes began to recover. Rats were placed in a stereotaxic apparatus with a heating blanket to maintain the rectally measured body temperature at 37°C. Silver electrodes to monitor EEG were inserted between the bone and the dura over the right primary somatosensory barrel field (relative to bregma: posterior 3 mm and lateral 5 mm) with a reference electrode over the cerebellum. After a metal chamber was attached with dental cement, a 3 × 3 mm craniotomy was performed on the left hemisphere over primary somatosensory barrel cortex centered relative to bregma at posterior 2.5 mm and lateral 5.5 mm. Extreme care was taken at all times not to damage the cortex, especially during the removal of the dura. Voltage-sensitive dye RH1691 (Shoham et al., 1999; Derdikmann et al., 2000) was dissolved at 0.1 mg/ml in Ringer's solution containing (in mm): 135 NaCl, 5 KCl, 5 HEPES, 1.8 CaCl2, 1 MgCl2. To obtain an even staining of the medial portion of the posterior barrel cortex, this dye solution was topically applied to the exposed cortex and allowed to diffuse into the cortex over a 2 hr period. The cortex was subsequently washed for 15 min to remove unbound dye and then covered with 1% agar dissolved in Ringer's solution, and a glass coverslip was placed on top. The coverslip was shaped to extend a little wider than the craniotomy, allowing access for whole-cell (WC) recording electrodes from both left and right. The animal was subsequently transferred to the experimental setup where electrocardiogram (ECG) electrodes were inserted under the skin of the forearms. In some experiments requiring the application of drugs to the cortical surface, no agar was placed on top of the cortex, and instead a sealed chamber with perfusion lines was attached.
Imaging voltage-sensitive dye signals. The detailed procedures for VSD imaging, related problems, and their solutions have been described previously in detail (Grinvald et al., 1999; Shoham et al., 1999). Voltage-sensitive dye signals are small and require specialized camera equipment with the major signal artifacts arising from heart beat pulsation. To improve signal-to-noise ratios, all imaging data were acquired triggered to the ECG signal, and alternate sweeps were either with or without stimulation. This allows an unstimulated average sweep containing only heart beat artifacts to be subtracted from stimulated sweeps (Grinvald et al., 1984; Orbach et al., 1985). The subtracted signals had two obvious components, a heart beat-related signal and a bleaching component, both of which were considerably smaller than the typical amplitude of the VSD responses. Voltage-sensitive dye signals were imaged from a focal plane ∼300 μm below the pia by a Fuji Deltaron HR 1700 [Fuji, Tokyo, Japan; modified for in vivo VSD imaging following Shoham et al. (1999)] with a differential amplification camera gain setting of 64, and frames were collected every 2.4 msec. To collect epifluorescent light efficiently from a large area (3.3 × 3.3 mm), a tandem lens setup was used as described by Ratzlaff and Grinvald (1991) with a 50 mm f stop = 0.95 specimen lens and a 135 mm f = 2 camera lens. The Fuji Deltaron has a detector array of 128 × 128 pixels, and thus each pixel receives light from a 26 × 26 μm region. Excitation light from a 100 W halogen lamp was filtered with a 630 ± 15 nm bandpass filter, reflected onto the cortex by a 650 nm dichroic filter, and the epifluorescent image was collected after a 665 nm long-pass filter. Individual whiskers were deflected for a 2 msec duration by a computer-controlled piezoelectric wafer attached to the whisker at a distance 10 mm from the rat snout. The amplitude of the deflection was under computer control, and sensory responses were evoked with deflections ranging from 0.6 to 6°. Between 10 and 20 sweeps were collected and averaged to reduce sweep-to-sweep variability of evoked responses and to average out the spontaneous ongoing activity (Arieli et al., 1995), which under our conditions is often as large as the evoked activity. The spatiotemporal dynamics of the whisker-evoked responses could be analyzed during an experiment using custom-written routines in IgorPro (Wavemetrics, Lake Oswego, OR) and aligned with the blood vessel pattern, allowing targeted whole-cell recordings from specific regions of the barrel cortex.
Whole-cell recordings. Whole-cell pipettes were advanced through the agar and into the neocortex with a positive-pressure 200 mmHg until the electrode tip was close to the location targeted for whole-cell recording. The positive pressure was subsequently reduced to 30 mmHg, and the pipette was advanced in steps of 2 μm until the resistance of the pipette increased suddenly, indicating contact with a cell. Suction was subsequently applied until a gigaseal was formed, and then the whole-cell configuration was established by slowly ramping the pressure to increasingly negative values. Whole-cell pipettes had resistances of 5 MΩ filled with a solution containing (in mm): 135 potassium gluconate, 4 KCl, 10 HEPES, 10 phosphocreatine, 4 MgATP, and 0.3 Na3GTP (adjusted to pH 7.2 with KOH). Biocytin (2 mg/ml) was included in the intracellular solution to allow the morphology of the neurons to be analyzed. Whole-cell electrophysiological measurements were made with Axopatch 200 amplifiers (Axon Instruments, Foster City, CA). The membrane potential was filtered at 2 kHz and digitized at 10 kHz in a sweep-based manner by ITC-16 (Instrutech Corporation, Long Island, NY) under the control of HEKA Pulse software running on an Apple Macintosh computer. Off-line analysis of electrophysiological data and alignment with imaging data were performed using custom-written routines in IgorPro.
Morphological reconstruction of biocytin-stained neurons. At the end of the experiment, during which a neuron had been filled with biocytin through the whole-cell recording, the rat was transcardially perfused with PBS followed by 4% paraformaldehyde. After overnight fixation, 100-μm-thick brain slices were cut in a plane tangential to the pia. The slices were washed with PBS (100 mmsodium phosphate, pH 7.2) five times over a period of 2 hr. The slices containing layer 4 were subsequently incubated at 35°C until clear staining of barrels was observed (0.5–5 hr) in PBS containing (in mg/ml): 0.3 cytochrome c, 0.3 catalase, and 0.5 diaminobenzidine (DAB). Slices were again washed five times with PBS over a period of 2 hr. Endogenous peroxidases were then quenched by a 5 min incubation with 1% H2O2. The slices were subsequently rinsed in PBS five times over a period of 2 hr. Slices were conjugated with avidin-biotinylated horseradish peroxidase following the manufacturer's instructions (ABC-Elite, Vector stains). Slices were then washed five times over a period of 2 hr with PBS, and subsequently biocytin-stained neurons were visualized under a reaction with 0.5 mg/ml DAB and 0.01% H2O2. When the neuronal processes were clearly visible, the reaction was stopped by washing with PBS. Finally the slices were mounted on slides using moviol. Dendritic and axonal processes were subsequently reconstructed in three dimensions using Neurolucida software (Microbrightfield, Colchester, VT). Further morphological analysis was performed by custom-written routines in IgorPro.
Results
Voltage-sensitive dye imaging reflects the membrane potential of layer 2/3 pyramidal neurons
The spatiotemporal dynamics of whisker-driven sensory responses were analyzed using a combination of voltage-sensitive dye imaging and whole-cell recordings from layer 2/3 of rat barrel cortex (Fig.1). Urethane or halothane anesthesia was maintained throughout the experiments. EEG and ECG recordings monitored the condition of the animal (Fig. 1B). The neocortical surface, when illuminated with green light (535 nm), shows the blood vessel patterns (Fig. 1D), which are subsequently used as landmarks to target whole-cell recordings to specific locations in the functional barrel cortex map identified during the experiment. Sensory signals were evoked by brief deflection of a mystacial whisker attached to a computer-controlled piezoelectric wafer (Fig. 1C). Fluorescence from the voltage-sensitive dye RH1691 was imaged at 2.4 msec with each of the 128 × 128 detector pixels receiving light from a 26 × 26 μm area. The image data were subsequently normalized off-line to the nonuniform fluorescence intensity of the imaged cortex and displayed as ΔF/F0. Single frames of image data of sensory-evoked responses (Fig. 1E,gray scale) were found to contain spatial noise, including horizontal streaks associated with the known imperfections of the Fuji Deltatron camera. Therefore, for display purposes all VSD images were Gaussian filtered with a 75 μm radius (Fig.1F). This smoothing was applied solely for display purposes, and all numerical analysis was performed on the original data set. Finally, single or dual whole-cell recordings from identified layer 2/3 pyramidal neurons were targeted to specific regions of interest within the imaged region to allow a quantitative comparison of membrane potential and the simultaneously measured local voltage-sensitive dye signal (Fig. 1I).
Fig. 1.
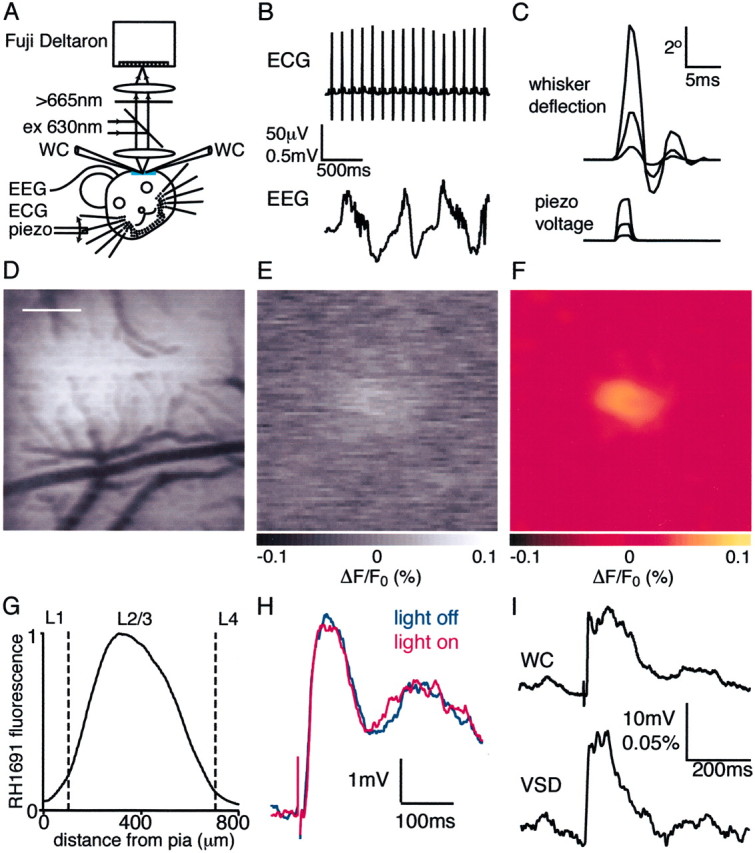
Simultaneous whole-cell and voltage-sensitive dye recording in vivo. A, The medial portion of the posterior somatosensory barrel cortex was stained with voltage-sensitive dye RH1691. The VSD signal was imaged with a Fuji Deltaron camera simultaneously with single or dual whole-cell recordings. B, The animal was continually monitored by ECG and EEG measurements. ECG measurements are of importance because the largest imaging artifacts are caused by heart beat-related pulsation. By triggering image acquisition relative to a known phase of the ECG, such artifacts can be subtracted.C, Whiskers were deflected by a piezo under computer control. High-speed filming allowed the quantification of whisker deflections evoked at three different stimulation strengths used in this study. D, The blood vessel pattern is imaged in the experimental setup (just before VSD imaging) under green illumination (535 nm) with the Fuji Deltaron camera. The pattern of these blood vessels is subsequently used for targeting whole-cell recordings within the functional map of barrel cortex derived from the voltage-sensitive dye imaging. Scale bar, 500 μm. E, A single frame of the imaged VSD signal collected 14.4 msec after a 2 msec single whisker deflection. The raw data from the camera have been normalized to the prestimulus fluorescence (ΔF/F0). Thegray scale ranges from a −0.1% (black) to 0.1% (white) fractional change, with no response giving a gray pixel. F, The same VSD image as before but now shown on the yellow-hot color scale after Gaussian filtering (radius of 75 μm). Image smoothing was used exclusively for clarity of image presentation. All quantitative analyses of the VSD signals were performed on the original data set.G, Depth penetration of RH1691 measured in coronal brain slices. H, Photodynamic damage appeared negligible under our experimental conditions. The response amplitude and kinetics were unchanged within the noise limits in this averaged series of 100 sweeps for each condition with excitation light alternately on or off.I, Average of 10 sweeps showing the change in membrane potential of a layer 2/3 pyramidal neuron (WC) evoked by the whisker deflection compared with the simultaneously recorded voltage-sensitive dye signal (VSD) quantified from a 200 × 200 μm region of interest around the neuron.
Voltage-sensitive dye signals originate primarily from layer 2/3
As a first step to understanding the laminar sources of the VSD signals imaged in vivo, we measured the depth of penetration of the voltage-sensitive dye using similar approaches as described previously by Kleinfeld and Delaney (1996). Standard coronal brain slices were prepared from three animals after sensory-evoked responses were recorded in vivo (Fig. 1G). The fluorescence profile indicated that 3% of total dye was present in layer 1, 95% in layer 2/3, and 2% in layer 4. The fluorescence maximum was located 295 μm below the pia. The decrease in fluorescence toward the pia over the top 300 μm suggests either that RH1691 preferentially stains deeper tissue or that the dye washes out more readily from the superficial tissue. Evidence that this latter possibility occurs is the slight blue color of the agar overlying the imaged area at the end of an experiment. When imaged under 40× water-immersion infrared differential interference contrast optics, neurons appeared as healthy under the craniotomy as they did in remote regions of neocortex. The surgery, staining procedures, and imaging thus do not appear to harm the underlying brain tissue.
The effects of light scattering by living brain tissue and the focal depth of the imaging system were assessed by imaging the tip of a glass electrode filled with a solution of the voltage-sensitive dye. The electrode was inserted at different depths into the cortex with the camera focused 300 μm below the pial surface as for voltage-sensitive dye experiments. The collected fluorescence from the electrode image was quantified and yielded an approximately Gaussian curve with a full width at half-maximum (FWHM) of 310 μm. Convolving this with the distribution of the voltage-sensitive dye found in the coronal slices suggests that under our experimental conditions <2% of the fluorescence originates from layer 1 and 98% from layer 2/3, with little contribution from layer 4 or the infragranular region. Changes in this fluorescence form the VSD signal recorded by the camera. The VSD signal will thus originate predominantly from changes in electrical potential across membranes located in layer 2/3, including neurons in layer 2/3 and neurons in deeper layers with dendrites that extend into layer 2/3. From the anatomy of reconstructed pyramidal neurons of L4–6, we estimate that their contribution to total neuronal membrane area in layer 2/3 is <10%. Thus the VSD signals that we image are likely to reflect primarily the electrical activity of neurons in layer 2/3.
Lack of pharmacological side effects and photo-toxicity of VSD imaging assessed by whole-cell recordings
Whole-cell recordings from layer 2/3 pyramidal neurons were made to evaluate potential alterations to cortical function and toxicity caused by voltage-sensitive dye imaging. We found that the resting membrane potential [without VSD −64 ± 4 mV (n = 15); with VSD −65 ± 3 mV (n = 29)] and spontaneous action potential (AP) frequency [without VSD 0.18 ± 0.07 Hz (n = 15); with VSD 0.17 ± 0.09 Hz (n = 29)] were not different compared with neurons from preparations that had not been stained with voltage-sensitive dye. Equally, when the epifluorescent illumination was turned on even for periods of several minutes, there was no effect on the neurons from which we recorded with respect to membrane potential [the membrane potential change between light on and off was 0.8 ± 1.2 mV (n = 9)] or whisker-evoked responses [the difference between peak amplitude of sensory response during light on and off was 1.1 ± 1.4 mV (n = 9)] (Fig. 1Hshows averages of 100 sweeps alternately with or without light). The voltage-sensitive dye-imaging technique as applied in this study does not appear to modify neocortical function via pharmacological side effects or photodynamic damage. Equally, deflection of single whiskers evoked VSD responses that were similar to those imaged without simultaneous whole-cell recording, and thus the process of obtaining a whole-cell recording and the presence of the whole-cell recording pipette also did not appear to disturb neocortical function. It thus appears meaningful to compare voltage-sensitive dye signals and membrane potential changes that are evoked by whisker deflection and recorded simultaneously.
Voltage-sensitive dye signals are dependent on glutamatergic synaptic transmission
Ionotropic glutamatergic synaptic transmission was blocked by applying 20 μm NBQX and 200 μmd-APV to the surface of the cortex and allowing the solutions to diffuse into the neocortex for 20 min. The peak amplitudes of whisker-evoked sensory responses were reduced to 3 ± 6% (n = 4) of the pretreated signal. This result suggests that the entire net excitation reflected by the voltage-sensitive dye signal is mediated by glutamatergic synaptic transmission.
Changes in membrane potential of single layer 2/3 pyramidal neurons correlate closely with the local voltage-sensitive dye signal
To understand quantitatively how the voltage-sensitive dye signal relates to neuronal membrane potential changes in the rat barrel cortex, we made whole-cell voltage recordings from superficial layer 2/3 pyramidal neurons relating the somatic location to the functional map of whisker-evoked voltage-sensitive dye signals that were recorded simultaneously. Although the voltage-sensitive dye signal presumably results from large ensembles, we found a remarkably close correlation with the evoked membrane potential changes in single pyramidal neurons in layer 2/3 (Fig. 2). In the experiment illustrated in Figure 2, the membrane potential of the L2/3 pyramidal neuron responds strongly but briefly to deflection of the C3 whisker (Fig. 2B, top red trace). The soma of the neuron is located close to the C3 barrel-column (Fig.2A,C). The local VSD response quantified in a 200 × 200 μm region around the soma shows an almost identical time course (Fig. 2B, bottom red trace). The membrane potential of this neuron also responds to deflection of the D2 whisker, but the response occurs after a longer latency, the amplitude is reduced, and the time course is very different for these 20 averaged sweeps (Fig. 2B,top blue trace). All of these differences in the membrane potential response are also reflected in the local VSD signal (Fig.2B, bottom blue trace). Thus the response latencies and kinetics of membrane potential changes are very similar to the local VSD responses. This is true of every neuron (n = 29) from which we recorded. Plotting the VSD signal amplitude as a function of membrane potential also revealed a close to linear relationship for this individual neuron with respect to the sensory responses from both of the tested whiskers (Fig.2D). The normalized data from all neurons recorded at 1–1.5 gm/kg urethane (green data points), 1.5–2 gm/kg urethane (black data points), or 0.5–1% halothane (cyan data points) show close correlations (Fig.2E). The local voltage-sensitive dye signal can thus be calibrated against the membrane potential of a single neuron generating the expected fluorescence change for a given membrane potential change. The reverse calculation reveals that the subthreshold membrane potential of a neuron can be predicted with an rms error of 2.0 mV once the local voltage-sensitive dye signal has been calibrated. However, it should be stressed that action potentials observed in the WC recording were not reflected in the VSD signal (no action potentials were observed in the experiment in Fig. 2, but see Fig.3). This result indicates that synchronous action potentials are unlikely to occur in a large fraction of nearby neurons. The threshold for AP initiation may thus convert relatively homogeneous postsynaptic potential (PSP) patterns of nearby neurons into a specific cortical representation of a whisker stimulus encoded in the inhomogeneous pattern of APs.
Fig. 2.
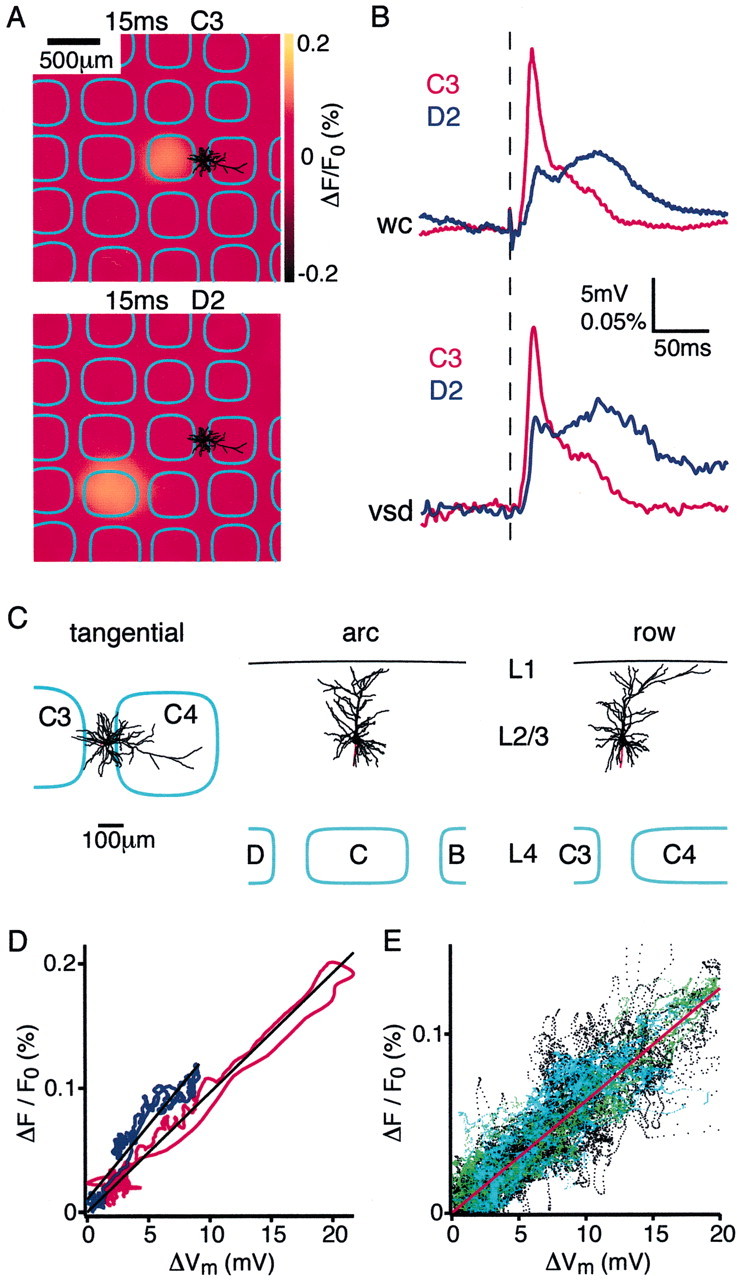
Subthreshold membrane potential changes in layer 2/3 pyramidal neurons are closely correlated with the local voltage-sensitive dye signal. A, The voltage-sensitive dye image of the cortical evoked response recorded 15 msec after deflection of the C3 whisker (top panel) and the D2 whisker (bottom panel). Superimposed are the reconstructed dendrites of the layer 2/3 pyramidal neuron from which a whole-cell recording was made simultaneously with the voltage-sensitive dye imaging. The neuron is located between the C3 and C4 barrels (barrel field with arcs oriented vertically and rows oriented horizontally. The barrels on the left edge belong to arc 1). B, The membrane potential changes evoked by stimulation of the C3 (red) and D2 (blue) whisker recorded in the layer 2/3 pyramidal neuron (top traces). The voltage-sensitive dye signal from a 200 × 200 μm region around the soma of the neuron is quantified (bottom traces). The membrane potential changes of a single neuron appear to be closely correlated with the voltage-sensitive dye signal in time course and relative amplitude, which presumably results from many neurons. C, Three different projections of the three-dimensional reconstruction of the dendritic arbor of the layer 2/3 pyramidal neuron shown inA. D, For the same neuron the VSD signal is plotted as a function of change in membrane potential during the first 200 msec of the whisker response. The two measurements are correlated linearly for the response to both the C3 whisker deflection (red) and the D2 deflection (blue) with a similar calibration constant. The depolarization in membrane potential of a single neuron appears to be closely correlated with the VSD signal in time course and relative amplitude, which obviously originate from many neurons. E, The normalized local VSD signal amplitude plotted as a function of the change in membrane potential across all neurons in the experimental data set. Theblack data points indicate data collected under 1.5–2 gm/kg urethane anesthesia (n = 24), thegreen data points are from experiments using animals that were more lightly anesthetized with 1–1.5 gm/kg urethane (n = 5), and the cyan data points are from experiments conducted under halothane (0.5–1%) anesthesia (n = 3). Under all of these conditions of different levels of anesthesia there is a close correlation between membrane potential changes and VSD signal.
Fig. 3.
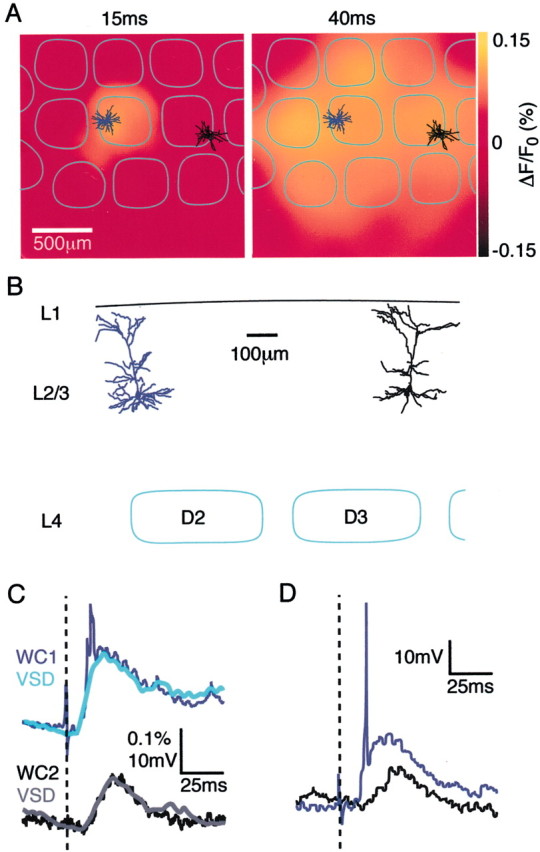
Dual whole-cell recordings from neurons in different cortical columns correlate closely with their respective local voltage-sensitive dye signal. A, The early VSD dye signal is localized close to one of the layer 2/3 pyramidal neurons (dendrites colored blue). At longer latencies the VSD signal indicates depolarization of a larger cortical region, including the location of the other whole-cell recording (dendrites inblack). B, Normal view of the cortex along a row to indicate the separation of the dendritic arbors of the two layer 2/3 pyramidal neurons that were recorded. C, The local VSD signal (gray for theblack neuron and cyan for theblue neuron) around each neuron follows closely the subthreshold membrane potential of the respective neurons. The latency, amplitude, and kinetics of the VSD signal and the membrane potential changes are well matched for both neurons. The early deviation in the WC recording from the blue neuron is caused by action potentials, which in general are not well correlated with a VSD signal (single sweep of the membrane potentials shown in D). The VSD signal is scaled identically for the two locations, indicating that the VSD image can be calibrated linearly and used to predict the membrane potential changes across the field of view under these experimental conditions.
The calibration ratio (gradient of the linear fit of the VSD signal plotted as a function of membrane potential) was similar for different stimuli in a given experiment (Fig. 2D) but varied almost 10-fold from one experiment to another, ranging from 15 × 10−6/mV to 140 × 10−6/mV (fractional fluorescence change per millivolt) with a mean ± SD of 72 ± 39 × 10−6/mV. The close correlation of the subthreshold response of a single neuron to the local voltage-sensitive dye signal suggests that neurons under our recording conditions in a small region of neocortex respond in a quantitatively similar manner at the level of subthreshold membrane potential changes.
To directly test this view, dual whole-cell recordings from identified layer 2/3 pyramidal neurons were obtained in seven additional experiments while simultaneously imaging the spatiotemporal dynamics of the ensemble cortical activity with voltage-sensitive dye (Fig. 3). This allows the changes in membrane potential of neurons located in two different cortical columns to be compared with the respective local voltage-sensitive dye signals recorded simultaneously. The example experiment in Figure 3 shows the reconstructed dendritic trees of the two layer 2/3 pyramidal neurons from which we recorded superimposed on images of evoked VSD signal at two different time points (Fig.3A,B). The neuron with blue color-coded dendrites is located in the D2 barrel-column, whereas the neuron with black color-coded dendrites is located almost 1 mm away at the far edge of the D3 barrel-column. A stereotypical spatiotemporal pattern of activity described in detail later in this paper is observed after a brief D2 whisker stimulation. The initial response occurs locally in the D2 barrel-column (Fig. 3A, left image at 15 msec after stimulus), and over the subsequent 25 msec spreads across the barrel cortex (Fig. 3A, right image at 40 msec after stimulus). The membrane potential of the blue neuron responds with a larger amplitude and shorter latency than the black neuron, after a time course that is very similar to the local VSD signal colored light blue and gray, respectively (Fig. 3C). Importantly, the scaling factor comparing membrane potential and VSD signal is the same for the two sets of traces, and a good match is observed. On some sweeps the whisker stimulus-evoked response in the blue neuron reached threshold (Fig. 3D), which explains the early brief signal in the averaged WC traces (Fig. 3C). This AP is not reflected in the VSD signal. The subthreshold membrane potential changes of two simultaneously recorded layer 2/3 pyramidal neurons both correlate well with a single calibration constant to scale signals in VSD images into membrane potential changes. This was true in all experiments; the scale factor for each doublet of neurons was within 8 ± 3% (n = 7), but again the value of the scale factor varied strongly from experiment to experiment. This variability from experiment to experiment thus likely reflects variability in the staining of the cortex, perhaps attributable to different amounts of dye binding or different amounts of dye remaining unbound in the extracellular space or different amounts of dye that might have flipped onto the inner leaflet of the plasma membrane, thus countering the signal from molecules located on the outer leaflet of the plasma membrane.
Dendritic and axonal organization of the excitatory neuronal network in layer 2/3 barrel cortex
The voltage-sensitive dye signals are thus likely to result primarily from membrane potential changes in layer 2/3 pyramidal neurons. The anatomical organization of these neurons is thus of key importance in understanding the spatiotemporal dynamics of the VSD signal. Therefore three-dimensional anatomical reconstructions were made of the dendrites and axon of simultaneously recorded neurons filled with biocytin during the whole-cell patch recording (Fig.4). These anatomical reconstructions were aligned with the barrel map visualized by cytochrome c stain and the functional map imaged by the voltage-sensitive dye.
Fig. 4.
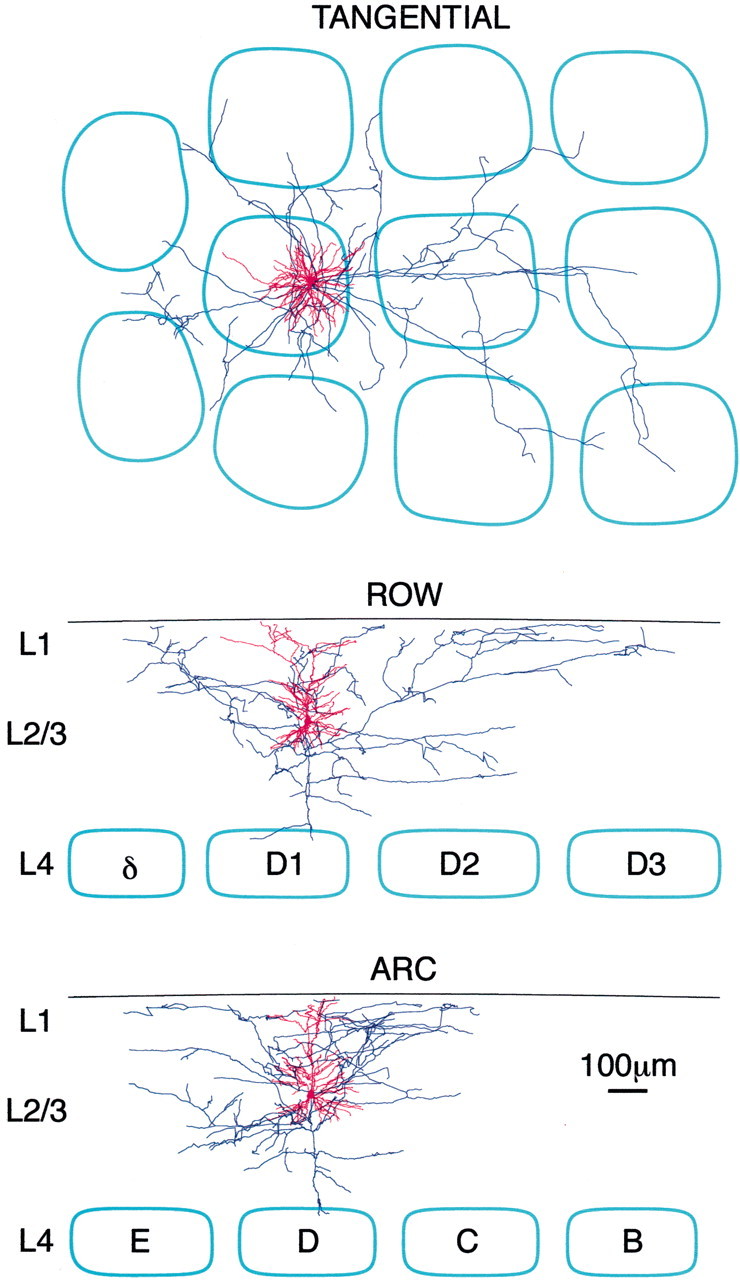
Three-dimensional reconstruction of the dendritic and axonal arbors of a layer 2/3 pyramidal neuron. During in vivo whole-cell recordings of layer 2/3 pyramidal neurons simultaneous with VSD imaging, the neuron is filled with biocytin. Subsequent staining of fixed tangential slices reveals the axonal and dendritic structure, which can be traced in three dimensions with the aid of a computer. The barrel field is visualized by cytochromec staining. The axon extends into all neighboring barrel-columns, whereas the dendrites remain close to the soma. The axon extends farther along the row than along the arc.
Dendritic arbors
The dendritic arbor (red) of an individual layer 2/3 pyramidal neuron is shown in Figure 4 from three different perspectives (tangential, viewed from above as in the voltage-sensitive dye imaging experiments, and from the side along the two orthogonal elements of barrel cortex structure, the row and the arc). In this neuron and in the other nine layer 2/3 pyramidal neurons that we reconstructed, the basal dendrites were oriented with radial symmetry around the soma, showing no preference for extending along rows or arcs of barrel cortex. The apical dendrite in general projected laterally across a somewhat wider area and showed a slight preference for orientation along the rows of barrel cortex. Altogether the ratio of maximal dendritic extent along row versus arc had a value of 1.15 ± 0.07 (n = 10). By far the greatest proportion of lateral length of dendrite of layer 2/3 pyramidal neurons arbors was within a 100 μm radius of the soma (density of dendrite decreases to 50% by 94 μm and to 10% by 189 μm). The lateral extent of dendrites is thus unlikely to substantially broaden the spatial profile of whisker-evoked sensory responses. The voltage-sensitive dye imaging technique applied here should thus be suitable for investigating the minimum spatial extent of cortical PSP responses in layer 2/3 for weak stimuli that result in only subthreshold activation of postsynaptic neurons.
Axonal arbors
In contrast the axonal arbors of L2/3 pyramidal cells have much larger projections that extend into adjacent barrels. The axonal arbor (blue) of the pyramidal neuron illustrated in Figure 4 shows axon collaterals projecting to all neighboring barrel-columns and even to some non-neighboring barrel-columns oriented along the row. The axonal arbor of this neuron thus extends farthest along the row of barrels. This asymmetry in the extent of the axonal arbor was observed in all the neurons that we reconstructed. The lateral extent of the axonal arbors was greatest along the row compared with the arc with a ratio of 1.81 ± 0.30 (n = 5). Axonal density decreased to 50% at 172 μm along the row and 118 μm along the arc and to 10% at 535 μm along the row and 250 μm along the arc.
There is thus a clear preference for axonal arbors of individual layer 2/3 pyramidal neurons to extend along the rows of barrel cortex. This is seen particularly clearly when the axonal arborizations of many neurons are superimposed and their length density is quantified (Fig.5). Previous studies using bulk labeling techniques (Bernardo et al., 1990; Keller and Carlson; 1999) were found to preferentially label neurons in the same row of barrels, although the precise nature of the types of neurons labeled is uncertain. The specific labeling and reconstruction of individual neurons performed in this study allow the unambiguous identification of the axon of layer 2/3 pyramidal neurons as providing a substrate for the clear anatomical preference for communication along the rows of barrel cortex.
Fig. 5.

Axonal arbors of layer 2/3 pyramidal neurons are preferentially oriented along rows. A, The superimposed reconstructions of 5 axons (blue) and 10 dendrites (red) from layer 2/3 pyramidal neurons in a tangential projection plotted on an idealized barrel field composed of 400 × 400 μm barrels separated by 100 μm of septa (left panel). The density of neuronal processes was calculated and Gaussian smoothed (50 μm smoothing). Contours of 10 and 50% density of axon (blue) and dendrite (red) plotted on the idealized barrel field (right panel). Dendritic field span is rather limited compared with the axon. The extent of the axon is clearly longer along the row as compared with the arc. B, The laminar extent of the reconstructed dendrites and axons along the rows of the barrel field. Axonal arbors were reconstructed only within layer 2/3.C, The laminar extent of the reconstructed dendrites and axons along the arcs of the barrel field.
Spatiotemporal dynamics of single whisker representation in layer 2/3 barrel cortex
Having defined layer 2/3 pyramidal neurons as the origin of the VSD signal and having defined the anatomical wiring of the layer 2/3 pyramidal neurons, we are now in a position to analyze the spatiotemporal dynamics of PSPs in layer 2/3 with millisecond time resolution. Our data demonstrate a highly dynamic view of cortical function. Neocortical sensory responses were evoked in barrel cortex by a backward 6° deflection of the D2 whisker for 2 msec (for stimulus kinetics see Fig. 1C; for an example VSD response see Fig.6). There was no immediate response or stimulation artifact observable in the voltage-sensitive dye signal. The earliest response was detected 10–12 msec after stimulation and was confined to a small region of neocortex (Fig.6B). During the subsequent milliseconds, the response amplitude increased at this epicenter, and the response spread to cover a large region of neocortex. Localized injections of DiI were subsequently made into upper layer 2/3 of the functionally identified epicenter of the sensory response in five experiments (Fig.6A). The brains were subsequently fixed overnight in paraformaldehyde and then transferred into PBS at 35°C for 2 weeks to allow DiI to diffuse into the membranes. Tangential brain sections were subsequently cut, and these indicated that the DiI had diffused throughout the depth of the neocortex and that DiI fluorescence was limited laterally in layer 4 to the D2 barrel (Fig.6C,D). Evidently the epicenter of the initial voltage-sensitive dye response thus maps onto the neocortical column defined by the layer 4 barrel isomorphic to the stimulated whisker. The spatial extent of the voltage-sensitive dye signal at later times can thus be compared with the anatomical map showing that 50 msec after stimulation the entire posterior medial barrel field was also activated. The VSD signal subsequently decays back to prestimulus levels over the next hundreds of milliseconds (Fig.6B,E). The early brief localized VSD signal can also be quantified by plotting the amplitude of the VSD signal in the D2 barrel-column as a ratio of the amplitude recorded in its neighbors (Fig. 6F).
Fig. 6.
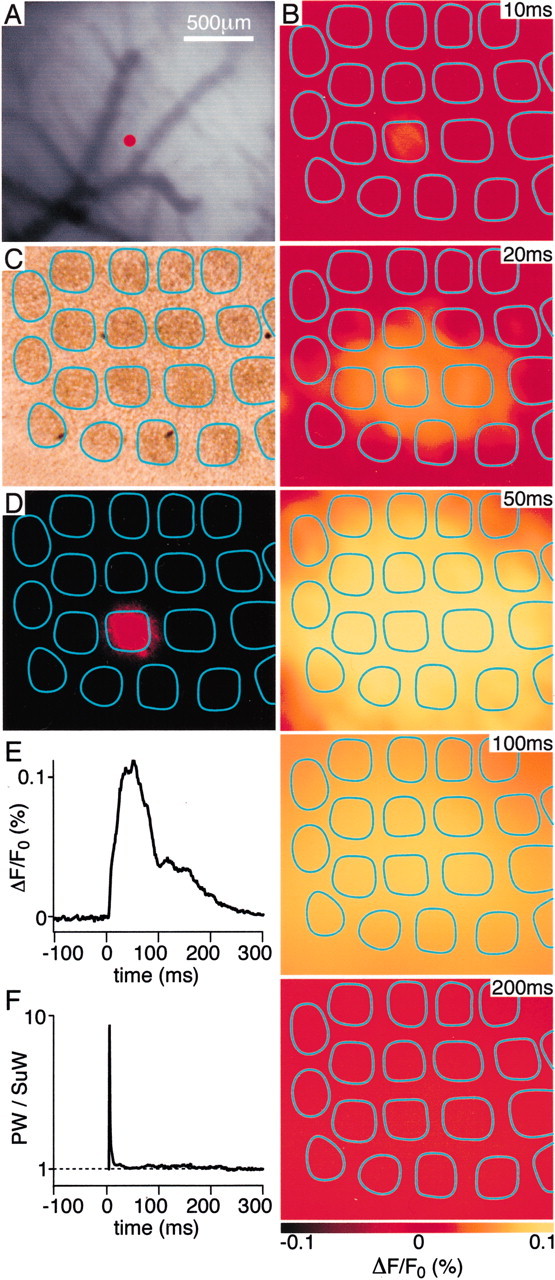
Spatiotemporal dynamics of the layer 2/3 neocortical voltage-sensitive dye response to a single brief whisker stimulus compared with the barrel map of layer 4. A, The blood vessels at the cortical surface are shown (top left) with a red dot indicating the location of a superficial DiI injection. The DiI was injected into the cortical location of the epicenter of the voltage-sensitive dye response evoked by a brief deflection of the D2 whisker. B, The spatiotemporal dynamics of the sensory response indicate a localized initial response at 10 msec after the stimulus, which rapidly spreads to excite the entire posterior medial barrel cortex at 50 msec, before decaying over the next 100 msec. C, The brain was fixed and kept at 35°C for 2 weeks to allow DiI diffusion in membranes. Subsequently the brain was sliced tangentially allowing the layer 4 barrels to be visualized under bright-field illumination. The barrels are outlined in cyan. D, DiI fluorescence was analyzed in the same slice. The fluorescence is limited primarily to the D2 barrel. The epicenter of the electrical sensory response to deflection of the D2 whisker thus occurs in the isomorphic cortical column defined by the D2 barrel. E, The time course of the VSD signal in the D2 barrel-column is plotted. F, The ratio of the response amplitude observed in the D2 barrel-column [principal whisker (PW)] compared with the response in surrounding barrel-columns [surround whisker (SuW)] is plotted. Thesharp peak indicates that for a short period of a few milliseconds the evoked response is localized to the D2 barrel-column and that the response rapidly becomes rather homogeneous at the spatial level of neighboring barrel-columns.
The earliest response is confined to a single barrel-column
Earlier work (Orbach et al., 1985; Grinvald et al., 1986;Kleinfeld and Delaney, 1996; Takashima et al., 2001) showed that deflection of a single whisker resulted in a “pagoda”-like activation extending far beyond the anatomic border of a single barrel-column. Through the improved spatiotemporal resolution of the present study and in view of the picture from the anatomy, we decided to revisit this issue by focusing our attention on the extent of the spatial cortical response at its earliest time. The first detectable VSD response after a single-whisker stimulation occurred in the image frames collected 9.6 or 12 msec after stimulation. These early responses had small amplitudes [24 ± 4% (n = 20) of the maximal response amplitude] and were confined laterally to a single barrel-column (Fig. 7). To quantify the spatial extent of these early responses, Gaussian curves were fitted to the intensity cross-section profile oriented along either a row or an arc of barrel cortex. Gaussian fits had a full width at half-maximum along a row of 477 ± 27 μm and along an arc of 451 ± 25 μm (n = 20). The profiles along a row and along an arc were not significantly different for the early responses. To further define the functional extent of the early response, the overlap of these signals evoked by nearest-neighbor whisker deflections were analyzed. Deflection of a nearest-neighbor whisker evoked a sensory response, which in the early VSD images was clearly spatially separable, having an epicenter located ∼500 μm away in the appropriate orientation for the whisker stimulated (Fig. 7).
Fig. 7.
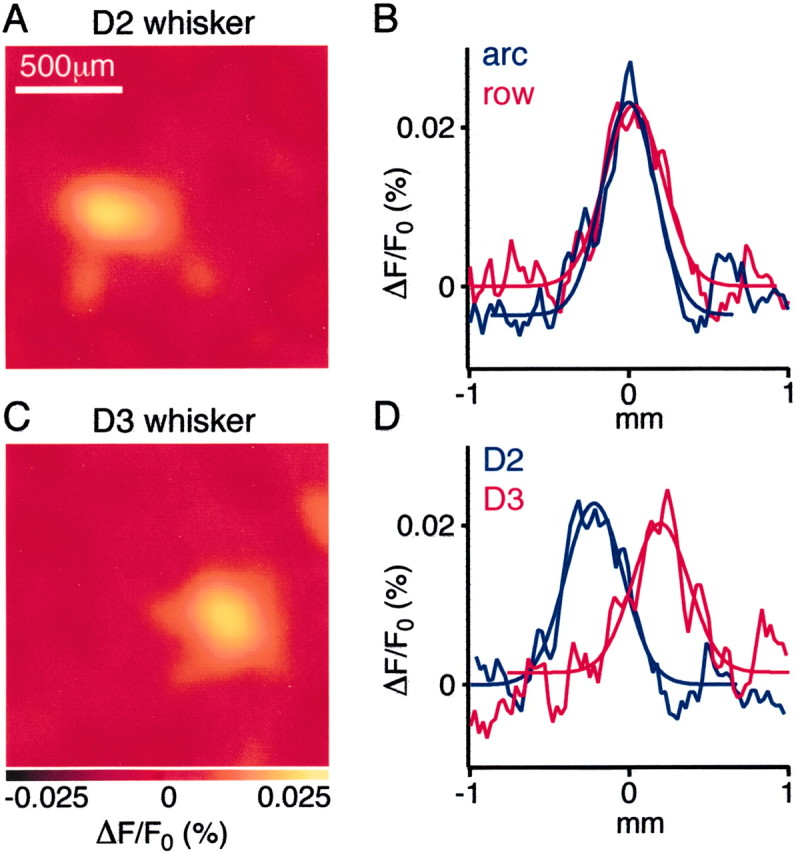
The earliest detectable response in layer 2/3 has tangential dimensions similar to a barrel-column. A, Brief deflection of the D2 whisker evoked a cortical response imaged 9.6 msec later that had lateral dimensions quantified along the row and arc were similar to a barrel-column. B, The spatial extent of this early VSD signal was quantified by fitting Gaussian curves to the VSD signal profile along the row (red trace; FWHM = 435 μm) or along the arc (blue trace; FWHM = 390 μm). C, Deflection of the D3 whisker evoked a response in a different cortical location imaged at 9.6 msec. Again the lateral extent of this early signal had dimensions comparable with that of a layer 4 barrel (row FWHM = 400 μm; arc FWHM = 320 μm) D, The VSD profile from these early images quantified along the row for the D2 response (blue trace) and the D3 response (red trace). The peaks of the two curves are clearly distinct and are separated by 420 μm.
The earliest detectable VSD signal evoked by whisker stimulation thus results from excitation of layer 2/3 immediately above and laterally confined to the width of the barrel in layer 4. This is in good agreement with in vitro measurements of the spread of excitation during stimulation of a single layer 4 barrel, where responses in layer 2/3 were confined primarily to the stimulated barrel-column (Petersen and Sakmann, 2001).
Excitation propagates preferentially along the rows of the barrel cortex map
The spread of excitation from the epicenter of the early response is not uniform, propagating preferentially along the rows of the barrel cortex map (Figs. 6,8, 9). Previous voltage-sensitive dye imaging data at lower time resolution (Kleinfeld and Delaney, 1996) observed a similarly oriented extent of a time-averaged response. Equally, analysis of extracellularly recorded action potential activity evoked by sequentially stimulating many whiskers inferred a similar structure to the spread of activity in L2/3 (Simons, 1978). In this study, with the improved spatiotemporal resolution, we can directly visualize the time-dependent spread of the activity in L2/3 evoked by a single whisker deflection rather than the extent of a time-averaged signal or one inferred from multiple stimuli of different whiskers. This allows quantification of the direction and the velocity of excitation.
Fig. 8.

Excitation spreads preferentially along rows compared with arcs. The left column shows a series of voltage-sensitive dye images demonstrating the time-dependent spread of excitation, along with a schematic drawing of the orientation of the barrel field (top). The earliest response (10 msec) has no preferred orientation, with a small signal amplitude that is confined horizontally to a single barrel-column. Subsequently (images at 20 and 50 msec), excitation extends into neighboring barrel-columns with a preferential spread along the rows of barrel cortex. Theright column provides quantification of the spread of excitation. Gaussian functions are fitted to line sections of the voltage-sensitive dye response oriented along the row (red curves) or arc (blue curves) through the epicenter. The broader Gaussian curves calculated along the row indicated the preferred orientation of the delayed spread of excitation. The propagation velocity of the Gaussian wave front is twice as fast along the row compared with along the arc (top).
Fig. 9.

The spread of excitation decreases at small whisker deflection, and at very weak stimulation intensities excitation remains confined to a single barrel-column. A, Strong whisker deflection (6° amplitude evoked with high velocity and acceleration) evoked a response confined initially to a barrel-column that spread rapidly to comprise the entire barrel cortex. Scale bar, 200 μm. B, At reduced whisker deflection (2° amplitude evoked with lower velocity and acceleration) the response was smaller in amplitude and spread over a smaller area but preferentially along the rows. C, Weak whisker stimulation (0.6° amplitude evoked with still lower velocity and acceleration) evoked a small amplitude response of brief duration, which remained confined to the barrel-column. A schematic drawing of the local barrel field map is superimposed (left). D, In addition to spreading over a larger cortical area, the time course of sensory responses increased with stimulation strength (red curve, 0.6° stimulus; blue curve, 2° stimulus; black curve, 6° stimulus). E, The spatial extent of the VSD signal evoked by the weakest stimulus (0.6°) is quantified for three time points to show that the VSD signal does not spread (blue, 12 msec;red, 16.8 msec; black, 24 msec). Thus a functional neocortical column has been directly visualized in vivo, in response to a sensory input, for the first time.
The spread of excitation was quantified by fitting Gaussian curves to the cross-section profile through the epicenter along either rows or arcs obtained in 20 experiments (Fig. 8). As the response develops during the first 50 msec, the amplitude of the signals increase both at the epicenter and over large areas of neocortex. The Gaussian profile thus becomes increasingly broad as the response amplitude over the barrel field becomes close to uniform spatially at later times during the response. The Gaussian profiles provide a way to quantify the spread of the excitation beginning with narrow Gaussians of ∼500 μm for both row and arc. The spread of the Gaussian wave front of excitation occurs almost twice as rapidly along the row (60 μm/msec) as compared with along the arc (33 μm/msec). Higher velocities calculated from amplitude thresholds (rather than Gaussian wave fronts) also show more rapid spread along the rows. This preferred orientation of the spread of excitation from a single whisker is in accord with the preferred orientation of the axons in layer 2/3 (Figs. 4, 5), suggesting that action potentials within the excitatory neuronal network of layer 2/3 are likely to be responsible for wave propagation.
Excitation evoked by a weak whisker stimulus remains confined to a single barrel-column
Smaller whisker deflections evoked VSD signals that had lower amplitude, lasted for shorter duration, and spread over smaller regions of cortex. A particularly clear example of the relationship of the spatiotemporal dynamics to stimulus intensity is illustrated in Figure 9. At the standard stimulus intensity used in this study (6° deflection, large velocity and acceleration), the voltage-sensitive dye response in this experiment follows the pattern described above: the signal is initially localized to a small barrel-column-sized area, and then over the next milliseconds the amplitude of the response increases and excitation spreads preferentially along a row to cover a large area of neocortex. Reducing the stimulus strength (2° deflection, lower velocity and acceleration) decreases the amplitude of the initial localized response, which occurs in the same barrel-column area. Subsequently the signal increases in amplitude and spreads laterally, but at the smaller stimulation strength the response is weaker (peak amplitude is 51% of that evoked by the 6° stimulus) and the row-like nature of the spread is particularly obvious. At a yet smaller whisker deflection strength (0.6° deflection and further reduced velocity and acceleration), the voltage-sensitive dye signal is again initiated at the same area as before, but the amplitude is reduced further. In the next milliseconds the response amplitude does not increase (peak amplitude is 29% of that evoked by the 6° stimulus), and the signal remains confined to the excited region. The entire response to this very weak stimulus lasts <50 msec, similar to the time course of unitary EPSPs and to the duration of voltage-sensitive dye responses evoked by layer 4 barrel stimulationin vitro (Petersen and Sakmann, 2001). Furthermore, the spatial confinement of this signal to a single barrel-column is also what is observed in vitro for stimuli that generate primarily subthreshold responses in layer 2/3 pyramidal neurons (Petersen and Sakmann, 2001). The response to the weak stimulus thus defines the localized activation of a neocortical column at the level of subthreshold membrane potential changes in vivo.
Discussion
Sensory stimulus-evoked membrane potential changes
The fluorescence of voltage-sensitive dye RH1691 under our experimental conditions correlates strongly with membrane potential changes in layer 2/3 pyramidal neurons. Dendrites of layer 2/3 pyramidal neurons contribute by far the largest percentage area of membrane within the stained region of neocortex, and the entire VSD response can be blocked by antagonists of AMPA and NMDA receptors. Therefore it is perhaps not surprising that we found a close correlation between the average WC membrane potential changes of pyramidal neurons in L2/3 and the local VSD response. What is remarkable, however, is that the evoked membrane potential changes of each individual layer 2/3 pyramidal neuron from which we recorded were locked tightly to the local VSD signal. Under these experimental conditions, layer 2/3 pyramidal neurons within several hundred micrometers of each other in the barrel field appear to respond in a similar manner at the level of subthreshold membrane potential changes. This result is consistent with dual recordings from nearby (within 500 μm distance) neurons in the anesthetized cat visual cortex that showed highly correlated changes in membrane potential (Lampl et al., 1999), although the morphological identity of these neurons as well as the cortical layers were unknown. By scaling the local VSD signal to the membrane potential in a layer 2/3 pyramidal neuron, we could predict the time-dependent subthreshold membrane potential changes recorded in another layer 2/3 pyramidal neuron at a different cortical location. It would thus appear that the VSD images can be converted into reasonable estimates of subthreshold PSPs expected in the dendrites of layer 2/3 pyramidal neurons, at least under our experimental conditions of anesthesia and simple sensory stimuli.
Because APs observed in the WC recording were not correlated with a VSD signal, it appears that APs do not occur synchronously in a large fraction of L2/3 neurons. Diverse receptive field properties (e.g., single whisker or multiwhisker units) of layer 2/3 neurons (Simons, 1978) are thus consistent with our PSP data. Thus the information specificity of whisker stimuli as represented by AP patterns in L2/3 pyramids thus is likely to arise from the nonlinear threshold for AP initiation in each particular neuron.
Signal flow within and between columns
The earliest cortical sensory response evoked by a vibrissa stimulus occurs in layer 4, at the level of both the subthreshold membrane potential changes (Moore and Nelson, 1998; Zhu and Connors, 1999; Brecht and Sakmann, 2002) and the unit activity (Armstrong-James et al., 1992). Anatomical and functional studies demonstrate that these layer 4 neurons project in a columnar manner into layer 2/3 (Lübke et al., 2000; Petersen and Sakmann, 2001) and make glutamatergic synapses predominantly onto the basal dendrites of pyramidal neurons (Feldmeyer et al., 2002). The resulting EPSPs evoked by the APs of the layer 4 spiny neurons are likely to form the earliest component of the VSD signal, which is horizontally restricted to a single barrel-column. Previous studies imaging whisker-evoked VSD signals (Orbach et al., 1985; London et al., 1989; Kleinfeld and Delaney, 1996) may have been unable to resolve this initial spatial confinement to a single column because of insufficient spatial and temporal resolution. Furthermore, the excitation remained localized during the small and brief responses evoked by weak whisker stimuli. This localized VSD response thus defines a functional cortical columnin vivo at the level of subthreshold PSPs. However, in response to stronger stimuli, the VSD signal grows in amplitude and spatial extent for many milliseconds. The horizontal spread of excitation is likely to be initiated by APs, generated in a fraction of the layer 2/3 pyramidal neurons located in the principal whisker column that then evoke EPSPs in other synaptically connected L2/3 pyramidal neurons (Egger et al., 1999; Reyes and Sakmann, 1999) initially within that column and then in adjacent columns. The axons of pyramids extend almost twice as far along a row as along an arc, with an equal increase in the axonal density along a row. Thus for any two layer 2/3 pyramidal neurons separated laterally by a given distance, there is likely to be a higher rate of synaptic connectivity if they are located in the same row. The higher axonal density along a row also makes multiple synaptic contacts between presynaptic and postsynaptic neurons more likely, and unitary EPSPs are thus also likely to be larger. Both factors would allow the spread of PSPs to occur more rapidly along the rows of barrel cortex than along the arcs as observed by VSD imaging. That both axonal length density and propagation velocity are almost doubled along the row compared with the arc indicates a close correlation between the density of layer 2/3 axonal arborization and the preferred spread of PSPs in L2/3. Receptive fields of neurons in L2/3 mapped by extracellular unit recordings are elongated along the rows (Simons, 1978). The fact that receptive fields in identified L4 barrel neurons are symmetric both at the input (PSP) and output (AP) levels (Brecht and Sakmann, 2002) strongly suggests that it is predominantly the pattern of axonal arborization of barrel-related pyramids in L2/3 that is responsible for the asymmetric receptive field shapes of L2/3 cells and for the asymmetric spread of excitation.
The spread of excitation evoked by the strongest whisker stimuli is larger than the average horizontal spread of axons of individual layer 2/3 pyramidal neurons. This difference suggests that after strong stimuli, layer 2/3 pyramidal neurons located in neighboring surround whisker columns also generate APs and contribute to the propagating wave of excitation. Spiny barrel neurons in L4 receive excitatory input from surround whiskers (Moore and Nelson, 1998; Zhu and Connors, 1999;Brecht and Sakmann, 2002); thus during strong stimulation, a fraction of spiny neurons in surround whisker barrels might then be excited suprathreshold. The propagating wave of excitation in a network of L2/3 pyramids across the barrel field might thus be supported by the combined near-coincident horizontal input from pyramids in the principal whisker column and the vertical input from barrel neurons located in the adjacent surround whisker columns.
Comparison of columnar responses in vitro andin vivo
The time course and spatial extent of the VSD response in L2/3 evoked by stimulation of a layer 4 barrel in vitro (Petersen and Sakmann, 2001) are in complete agreement with the in vivo response to weak stimuli. However, the propagating wave of excitation evoked in vivo in L2/3 by stronger whisker stimulation was not observed in vitro because GABAergic inhibition in vitro prevents the lateral spread of excitation in layer 2/3. This might arise partly from cut axon collaterals and dendrites in vitro, but it might also indicate that the neocortex under anesthesia may be more excitablein vivo than in vitro. That this is the case is also suggested by large spontaneous subthreshold membrane potential changes accompanied by spontaneous APs in layer 2/3 pyramidal neurons under our experimental conditions in vivo, whereas in vitro spontaneous EPSPs with amplitudes exceeding 2 mV occur infrequently. GABAergic inhibition in vivo under anesthesia may thus be less effective than that observed in vitro, allowing a propagating wave of excitation.
Functional significance
During exploratory periods the mystacial whiskers are moved rapidly back and forth at a high frequency of ∼10 Hz in an active behavior termed whisking (Welker, 1964; Carvell and Simons, 1990). This is thought to increase the resolution with which the rodent whiskers can sample the space surrounding the snout, thus allowing rodents to use their mystacial whiskers both to locate objects (Brecht et al., 1997) and to perform fine texture discrimination (Carvell and Simons, 1990). Each whisk epoch consists of an active protraction and a retraction of the whiskers with a movement that is oriented parallel to the rows of whiskers on the snout. Thus during a whisk the same point in space will be sampled by consecutive whiskers in a row over a period of a few tens of milliseconds. The signals from different whiskers in a row are thus likely to be processed in concert, requiring signals to spread rapidly along the rows of barrel cortex. The preferred spread of excitation along the rows propagating twofold as rapidly compared with the arcs evoked by a single whisker deflection thus appears well suited to integrate information concerning deflection of whiskers within the same row.
Footnotes
We are grateful to the Bundesministerium Fur Forschung und Bildung/Israeli Ministry of Science for a joint grant to B.S. and A.G. C.C.H.P. was supported by a Marie Curie fellowship from the European Commission. We thank Drs. Michael Brecht, Dirk Feldmeyer, Fritjof Helmchen, Hartwig Spohrs, and Jack Waters for useful discussions, technical advice, and comments on an earlier version of this manuscript, and Rina Hildesheim for the dye RH1691.
Correspondence should be addressed to Carl C. H. Petersen, Department of Cell Physiology, Max-Planck-Institute for Medical Research, Jahnstrasse 29, Heidelberg D-69120, Germany. E-mail:petersen@mpimf-heidelberg.mpg.de
References
- 1.Agmon A, Connors BW. Thalamocortical responses of mouse somatosensory (barrel) cortex in vitro. Neuroscience. 1991;41:365–379. doi: 10.1016/0306-4522(91)90333-j. [DOI] [PubMed] [Google Scholar]
- 2.Arieli A, Shoham D, Hildesheim R, Grinvald A. Coherent spatiotemporal pattern of on-going activity revealed by real-time optical imaging coupled with single unit recording in the cat visual cortex. J Neurophysiol. 1995;73:2072–2093. doi: 10.1152/jn.1995.73.5.2072. [DOI] [PubMed] [Google Scholar]
- 3.Armstrong-James M, Fox K, Das-Gupta A. Flow of excitation within rat barrel cortex on striking a single vibrissa. J Neurophysiol. 1992;68:1345–1358. doi: 10.1152/jn.1992.68.4.1345. [DOI] [PubMed] [Google Scholar]
- 4.Bernardo KL, McCasland JS, Woolsey TA, Strominger RN. Local intra- and interlaminar connections in mouse barrel cortex. J Comp Neurol. 1990;291:231–255. doi: 10.1002/cne.902910207. [DOI] [PubMed] [Google Scholar]
- 5.Brecht M, Sakmann B. Dynamic representation of whisker deflection by synaptic potentials in spiny stellate and pyramidal cells in the barrels and septa of layer 4 rat somatosensory cortex. J Physiol (Lond) 2002;543:49–70. doi: 10.1113/jphysiol.2002.018465. [DOI] [PMC free article] [PubMed] [Google Scholar]
- 6.Brecht M, Preilowski B, Merzenich MM. Functional architecture of the mystacial vibrissae. Behav Brain Res. 1997;84:81–97. doi: 10.1016/s0166-4328(97)83328-1. [DOI] [PubMed] [Google Scholar]
- 7.Carvell GE, Simons DJ. Biometric analyses of vibrissal tactile discrimination in the rat. J Neurosci. 1990;10:2638–2648. doi: 10.1523/JNEUROSCI.10-08-02638.1990. [DOI] [PMC free article] [PubMed] [Google Scholar]
- 8.Derdikmann D, Grinvald A, Ahissar E. Spatiotemporal response dynamics in barrel cortex revealed by fast optical imaging. Soc Neurosci Abstr. 2000;26:548.20. [Google Scholar]
- 9.Durham D, Woolsey TA. Barrels and columnar cortical organization: evidence from 2-deoxyglucose (2-DG) experiments. Brain Res. 1977;137:168–174. doi: 10.1016/0006-8993(77)91022-8. [DOI] [PubMed] [Google Scholar]
- 10.Egger V, Feldmeyer D, Sakmann B. Coincidence detection and changes of synaptic efficacy in spiny stellate neurons in rat barrel cortex. Nat Neurosci. 1999;2:1098–1105. doi: 10.1038/16026. [DOI] [PubMed] [Google Scholar]
- 11.Feldmeyer D, Silver RA, Lübke J, Sakmann B. Synaptic connections between layer 4 spiny neurone-layer 2/3 pyramidal cell pairs in juvenile rat barrel cortex: physiology and anatomy of interlaminar signalling within a cortical column. J Physiol (Lond) 2002;538:803–822. doi: 10.1113/jphysiol.2001.012959. [DOI] [PMC free article] [PubMed] [Google Scholar]
- 12.Grinvald A, Anglister L, Freeman JA, Hildesheim R, Manker A. Real-time optical imaging of naturally evoked electrical activity in intact frog brain. Nature. 1984;308:848–850. doi: 10.1038/308848a0. [DOI] [PubMed] [Google Scholar]
- 13.Grinvald A, Lieke E, Frostig RD, Gilbert CD, Wiesel TN. Functional architecture of cortex revealed by optical imaging of intrinsic signals. Nature. 1986;324:361–364. doi: 10.1038/324361a0. [DOI] [PubMed] [Google Scholar]
- 14.Grinvald A, Shoham D, Shmuel A, Glaser DE, Vanzetta I, Shtoyerman E, Slovin H, Wijnbergen C, Hildesheim R, Sterkin A, Arieli A. In-vivo optical imaging of cortical architecture and dynamics. In: Windhorst U, Johansson H, editors. Modern techniques in neuroscience research. Springer; New York: 1999. pp. 893–969. [Google Scholar]
- 15.Keller A, Carlson GC. Neonatal whisker clipping alters intracortical, but not thalamocortical projections, in rat barrel cortex. J Comp Neurol. 1999;412:83–94. doi: 10.1002/(sici)1096-9861(19990913)412:1<83::aid-cne6>3.0.co;2-7. [DOI] [PubMed] [Google Scholar]
- 16.Kleinfeld D, Delaney KR. Distributed representation of vibrissa movement in the upper layers of somatosensory cortex revealed with voltage-sensitive dyes. J Comp Neurol. 1996;375:89–108. doi: 10.1002/(SICI)1096-9861(19961104)375:1<89::AID-CNE6>3.0.CO;2-K. [DOI] [PubMed] [Google Scholar]
- 17.Lampl I, Reichova I, Ferster D. Synchronous membrane potential fluctuations in neurons of the cat visual cortex. Neuron. 1999;22:361–374. doi: 10.1016/s0896-6273(00)81096-x. [DOI] [PubMed] [Google Scholar]
- 18.London JA, Cohen LB, Wu JY. Optical recordings of the cortical response to whisker stimulation before and after the addition of an epileptogenic agent. J Neurosci. 1989;9:2182–2190. doi: 10.1523/JNEUROSCI.09-06-02182.1989. [DOI] [PMC free article] [PubMed] [Google Scholar]
- 19.Lübke J, Egger V, Sakmann B, Feldmeyer D. Columnar organization of dendrites and axons of single and synaptically coupled excitatory spiny neurons in layer 4 of the rat barrel cortex. J Neurosci. 2000;20:5300–5311. doi: 10.1523/JNEUROSCI.20-14-05300.2000. [DOI] [PMC free article] [PubMed] [Google Scholar]
- 20.Masino SA, Frostig RD. Quantitative long-term imaging of the functional representation of a whisker in rat barrel cortex. Proc Natl Acad Sci USA. 1996;93:4942–4947. doi: 10.1073/pnas.93.10.4942. [DOI] [PMC free article] [PubMed] [Google Scholar]
- 21.Moore CI, Nelson SB. Spatio-temporal subthreshold receptive fields in the vibrissa representation of rat primary somatosensory cortex. J Neurophysiol. 1998;80:2882–2892. doi: 10.1152/jn.1998.80.6.2882. [DOI] [PubMed] [Google Scholar]
- 22.Orbach HS, Cohen LB, Grinvald A. Optical mapping of electrical activity in rat somatosensory and visual cortex. J Neurosci. 1985;5:1886–1895. doi: 10.1523/JNEUROSCI.05-07-01886.1985. [DOI] [PMC free article] [PubMed] [Google Scholar]
- 23.Petersen CCH, Sakmann B. The excitatory neuronal network of rat layer 4 barrel cortex. J Neurosci. 2000;20:7579–7586. doi: 10.1523/JNEUROSCI.20-20-07579.2000. [DOI] [PMC free article] [PubMed] [Google Scholar]
- 24.Petersen CCH, Sakmann B. Functionally independent columns of rat somatosensory barrel cortex revealed with voltage-sensitive dye imaging. J Neurosci. 2001;21:8435–8446. doi: 10.1523/JNEUROSCI.21-21-08435.2001. [DOI] [PMC free article] [PubMed] [Google Scholar]
- 25.Petersen RS, Diamond ME. Spatial-temporal distribution of whisker-evoked activity in rat somatosensory cortex and the coding of stimulus location. J Neurosci. 2000;20:6135–6143. doi: 10.1523/JNEUROSCI.20-16-06135.2000. [DOI] [PMC free article] [PubMed] [Google Scholar]
- 26.Ratzlaff EH, Grinvald A. A tandem-lens epifluorescence macroscope: hundred-fold brightness advantage for wide-field imaging. J Neurosci Methods. 1991;36:127–137. doi: 10.1016/0165-0270(91)90038-2. [DOI] [PubMed] [Google Scholar]
- 27.Reyes A, Sakmann B. Developmental switch in the short-term modification of unitary EPSPs evoked in layer 2/3 and layer 5 pyramidal neurons of rat neocortex. J Neurosci. 1999;19:3827–3835. doi: 10.1523/JNEUROSCI.19-10-03827.1999. [DOI] [PMC free article] [PubMed] [Google Scholar]
- 28.Shoham D, Glaser DE, Arieli A, Kenet T, Wijnbergen C, Toledo Y, Hildesheim R, Grinvald A. Imaging cortical dynamics at high spatial and temporal resolution with novel blue voltage-sensitive dyes. Neuron. 1999;24:791–802. doi: 10.1016/s0896-6273(00)81027-2. [DOI] [PubMed] [Google Scholar]
- 29.Simons DJ. Response properties of vibrissa units in rat SI somatosensory neocortex. J Neurophysiol. 1978;41:798–820. doi: 10.1152/jn.1978.41.3.798. [DOI] [PubMed] [Google Scholar]
- 30.Takashima I, Kajiwara R, Iijima T. Voltage-sensitive dye versus intrinsic signal optical imaging: comparison of optically determined functional maps from rat barrel cortex. NeuroReport. 2001;12:2889–2894. doi: 10.1097/00001756-200109170-00027. [DOI] [PubMed] [Google Scholar]
- 31.Welker WI. Analysis of sniffing of the albino rat. Behaviour. 1964;22:223–244. [Google Scholar]
- 32.Woolsey TA, Van der Loos H. The structural organisation of layer IV in the somatosensory region (SI) of the mouse cerebral cortex: the description of a cortical field composed of discrete cytoarchitectonic units. Brain Res. 1970;17:205–242. doi: 10.1016/0006-8993(70)90079-x. [DOI] [PubMed] [Google Scholar]
- 33.Yang X, Hyder F, Shulman RG. Activation of single whisker barrel in rat brain localized by functional magnetic resonance imaging. Proc Natl Acad Sci USA. 1996;93:475–478. doi: 10.1073/pnas.93.1.475. [DOI] [PMC free article] [PubMed] [Google Scholar]
- 34.Zhu JJ, Connors BW. Intrinsic firing patterns and whiskers-evoked synaptic responses of neurons in the rat barrel cortex. J Neurophysiol. 1999;81:1171–1183. doi: 10.1152/jn.1999.81.3.1171. [DOI] [PubMed] [Google Scholar]