

Abstract
Sensory processing and its perception require that local information would also be available globally. Indeed, in the mammalian neocortex, local excitation spreads over large distances via the long-range horizontal connections in layer 2/3 and may spread over an entire cortical area if excitatory polysynaptic pathways are also activated. Therefore, a balance between local excitation and surround inhibition is required. Here we explore the spatiotemporal aspects of cortical depolarization and hyperpolarization of rats anesthetized with urethane. New voltage-sensitive dyes (VSDs) were used for high-resolution real-time visualization of the cortical responses to whisker deflections and cutaneous stimulations of the whisker pad. These advances facilitated imaging of ongoing activity and evoked responses even without signal averaging. We found that the motion of a single whisker evoked a cortical response exhibiting either one or three phases. During a triphasic response, there was first a cortical depolarization in a small cortical region the size of a single cortical barrel. Subsequently, this depolarization increased and spread laterally in an oval manner, preferentially along rows of the barrel field. During the second phase, the amplitude of the evoked response declined rapidly, presumably because of recurrent inhibition. Subsequently, the third phase exhibiting a depolarization rebound was observed and clear, and ∼16 Hz oscillations were detected. Stimulus conditions revealing a net surround hyperpolarization during the second phase were also found. By using new, improved VSD, the present findings shed new light on the spatial parameters of the intricate spatiotemporal cortical interplay of inhibition and excitation.
Keywords: barrel cortex, cortical dynamics, cortical populations, cutaneous stimulation, depolarization, excitation, hyperpolarization, inhibition, oscillations, somatosensory cortex, voltage sensitive dyes
Introduction
To understand sensory processing it is essential to visualize the spatiotemporal pattern of electrical activity in the neocortex. The well studied whisker barrel system in the rodent somatosensory cortex (Woolsey and Van der Loos, 1970), whose neurons encode external events both in time and in space (Ahissar et al., 2000; Ahissar and Arieli, 2001), offers an excellent model to study such processes.
Previous electrophysiological studies have shown that brief cutaneous stimulation commonly elicits a triphasic response in the somatosensory cortex, consisting of an early depolarization, a late hyperpolarization, and a late rebound depolarization. Such a pattern is seen in extracellular studies (Laskin and Spencer, 1979; Simons and Carvell, 1989), in intracellular studies (Andersson, 1965; Hellweg et al., 1977; Carvell and Simons, 1988; Zhu and Connors, 1999), and in voltage-sensitive dye (VSD) studies (Orbach et al., 1985; Kleinfeld and Delaney, 1996; Takashima et al., 2001).
To study temporal patterns of populations of neurons (rather than single cells) and to map the loci of excitation, suppression, and net hyperpolarization across the cortical surface, we used in vivo VSDI (voltage-sensitive dye imaging) (Grinvald et al., 1984), which had already proved to be useful in exploring cortical dynamics in the visual cortex of cats and monkeys (Arieli et al., 1996; Tsodyks et al., 1999; Slovin et al., 2002) and in the somatosensory cortex of rats (Orbach et al., 1985; Kleinfeld and Delaney, 1996). Recent intracellular recordings in vivo in deeply anesthetized cats (A. Sterkin, I. Lampl, D. Ferster, D. E. Glaser, A. Grinvald, and A Arieli, unpublished observations) (Grinvald et al., 1999, their Fig. 23) have suggested that the VSD signal emphasizes changes in dendritic membrane potential. Recently, the striking similarity between intracellular recording and the VSD signal of a synchronized population has also been confirmed in vitro (Petersen and Sakmann, 2001) and in vivo in the rat barrel cortex (Petersen et al., 2003).
Here we systematically explored the spatiotemporal aspects of cortical depolarization and hyperpolarization and searched for stimuli parameters that would reveal the net hyperpolarization. We also report on the development of better dyes for real-time imaging of electrical activity in the rodent somatosensory cortex. The results have been presented previously in abstract form (Derdikman et al., 2000).
Materials and Methods
Animals. Approximately 250 adult male Wistar albino rats were used for screening the new VSDs that we developed for imaging activity in the rodent somatosensory cortex. For the current study, 20 adult male Wistar albino rats were used (weight, 330 ± 70 gm). The surgical procedures have been described in detail previously (Haidarliu et al., 1999). Briefly, atropine sulfate (0.05 mg/kg, i.m.) was administered before general anesthesia. The rats were anesthetized with urethane (1.5 gm/kg, i.p.). A dental cement chamber was built on top of the exposed skull. A 7 mm diameter opening was drilled above the barrel cortex of the rat. The dura was carefully removed. All experiments were conducted in conformity with the Guiding Principles for Research Involving Animals and Human Beings and with the animal welfare guidelines of The Weizmann Institute of Science.
Dye screening. Because VSDs are species-specific and often even cortical-area-specific, 108 new dyes were screened on the barrel cortex to assess their suitability for use in the barrel cortex. Dyes were tested for their in vivo voltage sensitivity, toxicity, photodynamic damage and bleaching, and capacity to stain deep cortical layers. The cortex was stained for 2 hr with a solution of the dye (optical density, 5–7 at 580 nm). Excitation light was 630 ± 15 nm, reflected onto the cortex by a 650 nm dichroic mirror, and the epifluorescent image above 665 nm was detected by a photodiode. We found that dyes RH-1691, RH-1692, and RH-1838 were the best for the present application. For their chemical structure see Spors and Grinvald (2002).
Optical imaging. The procedures for VSD optical imaging have been described in detail previously (Grinvald et al., 1999; Shoham et al., 1999). A modified Fuji (Tokyo, Japan) XHR Deltaron 1700 camera, with an array of 128 × 128 detectors, was used for data acquisition. Frames were acquired at a rate of 0.6–9.6 msec/frame. The cortical state was not affected, as was ascertained during screening by the electrical evoked response before and after staining, using a ball electrode. Also, Petersen and colleagues verified cortical state simultaneously with intracellular recordings (C. C. H. Petersen, A. Grinvald, B. Sakmann, personal communication).
Stimulation. Air puffs consisted of pulses that were delivered by a Picospritzer (General Valve Corporation, Fairfield, NJ) at a pressure of 5 psi. Piezoelectric stimulation (Physik Instrumente, Karlsruhe, Germany) was performed on single whiskers, 5 mm from the whisker base, at an amplitude of ∼1 mm. Cutaneous mechanical stimulation was carried out using a metal rod (diameter, 1.3 mm) attached to an electromagnetic solenoid, hitting the skin at the base pad of a given whisker for a duration of 0.5 msec. The force of the mechanical stimulation was calibrated by measuring the impact force of the rod on a piezoelectric force transducer (Kistler Instrument, Amherst, NY). We ascertained by photographing the stimulation that no unintended mechanical vibration was transmitted from the stimulator to the rat.
Statistical analysis. The recorded value at each pixel was first divided by the average DC value at that pixel before stimulus onset. The data from the evoked trials were subsequently divided by the data from the blank trials (Shoham et al., 1999), and low-pass-filtered in space (Gaussian, ς = 2 pixels). When the results of a few experimental sessions were added together (see Fig.3B,D,E), different experiments were normalized according to the maximal signal in each experiment and then summed by positioning the point of maximum signal at the center of the image. Average data (as a function of distance from maximum activity) were fitted to the following difference of 1-D Gaussian:F(r;A+,ς+,A−,ς−) =A+e−r2/2ς+2−A−e−r2/2ς−2.
Fig. 3.

The VSD response to a strong cutaneous stimulus is triphasic. A, Frame sequence of averaged functional maps depicting the depolarization phase, followed by the hyperpolarization phase (n = 192 trials). Scale bar, 1 mm.B, Average normalized frame sequence across 10 experiments (n = 1638 trials). C,Time course of the triphasic response for the experiment shown inA. The three traces are at different distances from the barrel center. D, Average normalized time course of the triphasic response for the same 10 experiments. Different traces depict responses at different cortical distances from the point of maximal response. Inset, Same responses normalized to the peak of the depolarization phase. E, Average response as a function of the distance from the center of activity at different times. Black curves are Gaussian fits to the net depolarization minus the net hyperpolarization (see text). F, HWHH of positive Gaussian (red) and of negative Gaussian (blue). Fit during early depolarization (t <50 msec) is done only to the positive Gaussian. G, Late normalized response (t = 50–150 msec from stimulation onset) as a function of early response (t = 20 msec from stimulation onset), for different forces of cutaneous stimulation (n = 4 experiments, 488 trials).
Results
Preferential spread of cortical activity along the whisker rows
To examine the spatiotemporal pattern of the monophasic cortical response, a single whisker was deflected by an air puff. The response reached a peak after 40 msec and then monotonically declined back to baseline after 200 msec (Fig.1A,B). Clearly, the response covered an area much larger than the size of a single barrel column (Fig. 1C). It is interesting to note from this experiment as well as additional experiments (n = 5) that the activated area appeared elliptical rather than circular, indicating an asymmetrical spread. To examine if this spread was larger along the row of the whisker or perpendicular to it, we determined the direction of a row in the imaged area by activating two adjacent whiskers within the same row, C3 and C2. As expected, there was a large overlap in the activity evoked by two adjacent whiskers (Fig. 1C) because of the large spread. In the differential image, the difference between the two whisker stimulations is seen saliently (Fig. 1D). Comparing the axis of asymmetry in Figure 1C to the row axis seen in Figure 1D, we concluded that the spread was ∼1.4-fold larger along the row axis relative to the perpendicular direction. To characterize the nature of the spread we scrutinized the series of frames obtained at 4.8 msec shown in Figure1A. The initial response had a diameter of ∼400 μm, corresponding to the diameter of the single barrel. In a different experiment in which the camera collected data at its fastest sampling rate (0.6 msec/frame), we found that activity spread to a distance of 0.9 mm in 2–3 msec (Fig. 1E).
Fig. 1.

Monophasic cortical response to single-whisker stimulation. A, Spatiotemporal dynamics of spread of averaged response (n = 128 trials) to whisker C3 stimulation using a 3 msec air puff. B, Average time course of response (SEs are displayed every five frames).C, Contour map comparing the response to whisker C3 versus C2. Note that the distance between the centers of activation in the two cases is <0.5 mm. D, The differential map of C3 and C2 activation revealing the cortical axis along rowC.E, Averaged response to E1 mechanical stimulation (10 msec; n = 244) at the center of activity and at a ring-like shape 0.9 mm away from the barrel center (frame rate, 0.6 msec/frame). The response was normalized to maximum. Inset, absolute responses before normalization (n = 244).
Surround hyperpolarization obtained on whisker deflection
We conducted another series of experiments using a mechanical stimulator, which provides larger whisker acceleration by a factor of ∼5 relative to the air puff. A brief mechanical stimulation to a single whisker evoked activity, which peaked after ∼11 msec (Fig.2B) and quickly decreased and crossed the baseline after 40 msec. In contradistinction to the air-puff stimulation, this second phase exhibited a net hyperpolarization in the form of a ring (radius, ∼1000 μm) showing the trough at ∼80 msec. The net hyperpolarization first appeared at the caudal medial corner of the image, suggesting that the inhibition was also asymmetric in space and time (Fig. 2A). Judging from additional experiments (n = 3), there was an asymmetric tendency of the inhibition in all cases we examined.
Fig. 2.
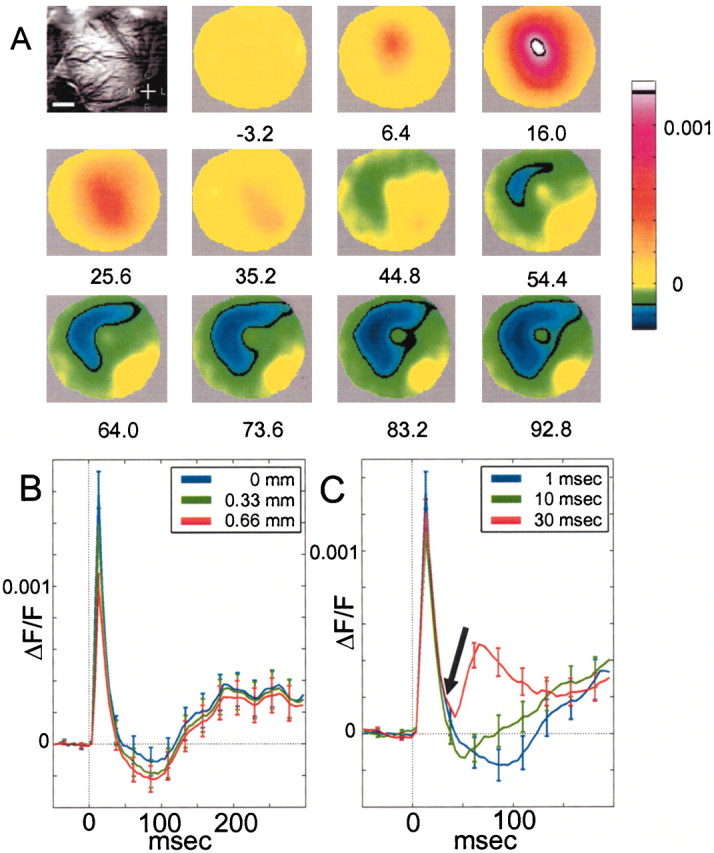
Brief mechanical single whisker deflection causes a center-surround triphasic response. A, Frame sequence showing averaged cortical activation maps in response to brief (1 msec) mechanical stimulation of whisker D2 (4.8 msec/frame;n = 92 trials). B, Three time courses showing the averaged values from a ring-like shape at different distances from the barrel center. During the hyperpolarization phase, the response in the surround is more negative than the response in the center. The opposite is true for the earlier depolarization response.C, The net hyperpolarization gradually disappears on changing the duration of the stimulation from 1 msec to 30 msec.
The time courses of cortical activation at the center of the barrel, at its edge, and in the approximate center of the next barrel are depicted by the traces shown in Figure 2B. The net hyperpolarization, in absolute value, was ∼12 times smaller than the size of the maximum depolarization at the center of the barrel, but ∼4 times smaller at the adjacent barrel (n = 92 trials).
The comparison of the monophasic response obtained by the air-puff stimulation of a whisker (Fig. 1) with the strong mechanical stimulation (Fig. 2), suggests that the intricate synaptic interactions in the barrel somatosensory cortex may be very sensitive to the exact nature of the stimulus (for previously reported net hyperpolarization, see Orbach et al., 1985, their Figs. 2, 4). Therefore, we varied the duration of whisker defection systematically (Fig. 2C). A net hyperpolarization was observed with a stimulus duration of 1 and 10 msec, but at a 30 msec duration it disappeared. Instead, a second depolarization peak emerged, with an onset of 30 msec after the onset of early depolarization (Fig. 2C, arrow), most likely related to the offset response to the mechanical stimulation
Larger surround hyperpolarization revealed with a brief cutaneous stimulation
To further characterize stimulus conditions revealing the surround hyperpolarization, we applied a brief cutaneous stimulation (0.5 msec, 3–4 nt) to the whisker pad between the follicles of whiskers D1 and D2. Most likely, such stimulation activates a much larger proportion of the whisker follicle receptors (Rice and Munger, 1986; Rice et al. 1986). A triphasic response exhibiting a large ring-like shape surround hyperpolarization was observed around the center (Fig.3A,B). During the decline phase, the areas surrounding the region of peak depolarization became hyperpolarized significantly before the site of the peak itself was hyperpolarized (Fig. 3C) (p < 0.05, t test). In addition, the surrounding hyperpolarization appeared asymmetrical, with a tendency toward the caudomedial direction (Fig. 3A). On average across experiments (Fig. 3B,D), the signal at the center reached its peak after ∼15 msec; then there was a rapid decline: the signal crossed the baseline at ∼80 msec after the onset of the stimulus. The signal at the surround (at ∼1 mm from the center) crossed below the baseline significantly before the center, at about t = 50 msec (p < 10−6, t test). Another significant result is that the spatial decrease of the late hyperpolarization from center to surround is much more gradual than the spatial decrease of the early depolarization; thus, we can say that the inhibition is on average more distant from the center of activation than the excitation (Fig. 3D, inset). To quantify the difference in width between the early depolarization response and the late hyperpolarization, we averaged the data around the center of activity (neglecting the slightly elliptical shape of the response as a first approximation), and fit it to a difference of two Gaussians, one for the net depolarization minus the other for the net hyperpolarization (Fig. 3E). We found that the half-width at half-height (HWHH) of the negative Gaussian is significantly larger than the HWHH of the positive Gaussian, at all times (Fig.3F). From the Gaussian fit we can estimate the average area of depolarization (area in circle with radius = HWHH) to be ∼9 mm2 and the average area of hyperpolarization to be ∼14 mm2(including the central, more depolarized, region).
To further test the dependence of the hyperpolarization on the strength of the cutaneous stimulus, we applied the stimulation at different forces. Stronger stimulation resulted in stronger depolarization and stronger afterhyperpolarization (Fig. 3G). In all cases, the strongest stimuli (3.2–3.6 nt) caused a salient triphasic response, whereas the weaker stimuli (1.4–2.8 nt) caused a monophasic response or a reduced triphasic response with very little hyperpolarization (n = 4 experiments). All cases we examined in which a triphasic response emerged with net hyperpolarization were characterized by a rapid ascent of the early depolarization to its maximum.
Stimulus locked oscillations in the rebound depolarization
In 6 of the 10 cutaneous stimulation sessions, the rebound depolarization contained stimulus-locked oscillations, riding on top of the late positive response (Fig.4A). Such oscillations were also recorded for single-whisker piezostimulation (Fig.2B). In general, stimulus-locked oscillations were more prominent in cases that showed salient net hyperpolarization. The power spectra of the evoked activity contained dominant oscillations at 15.8 ± 0.5 Hz (Fig. 4B). Additional analysis of the spatiotemporal behavior of the oscillations revealed that the peak of the amplitude map of the 16 Hz oscillations coincided in space with the peak of the initial positive response (Fig. 4C). At the time resolution used here (4.8 msec/frame), the phase of the response at 16 Hz was almost constant (phase difference < π/4) across all the activated area. The fast Fourier transform (Fig.4B) was averaged across single trials. Note that the good signal-to-noise ratio in single trial data enables an easy differentiation of the evoked response from ongoing activity (Fig.4D, arrow).
Fig. 4.

Stimulus-evoked 16 Hz oscillations seen in the positive rebound phase of the response. A, Average time course for a cutaneous stimulation (n = 192 trials), depicting the appearance of oscillations. B,Power spectrum performed on rebound depolarization phase ofA (from t = 155 msec).C, Contour plot showing that the spatial extent of the 16 Hz oscillations amplitude in the rebound phase (red) is similar to the spatial extent of the response in the initial depolarization phase, for the same data as in A. D, Comparison of a typical single trial, showing both ongoing and evoked activity (green), to average response from 75 trials (blue). Large ongoing activity is detected only in the trial without signal averaging (arrow).
Discussion
The present findings shed light on the intricate spatiotemporal cortical interplay of inhibition and excitation phenomena, which up to now have been well described only in the temporal domain. We characterized two types of cortical responses to brief somatosensory stimulation in the rat's whisker pad: A monophasic response (Fig. 1) and a triphasic response (Figs. 2-4). The monophasic response and the early triphasic depolarization were characterized by an asymmetric spread in the direction of whisker rows (Fig. 1). The triphasic response was more pronounced in cutaneous than in whisker stimulation and depended on the force and duration of the stimulus (Figs. 2, 3). The triphasic response consisted of a large depolarization, followed by up to a 150 msec period of a net hyperpolarization in some stimulus conditions. After the hyperpolarization, there was a phase of rebound depolarization, containing oscillations at frequencies of ∼16 Hz. A quantification of the spatial extent of the depolarization and hyperpolarization phases indicated that the hyperpolarization is more distant from the position of the center of activity than the depolarization (Fig. 3).
What does the dye signal measure?
It is well established that the VSD signal measures membrane-potential changes in vitro and in vivo(Cohen et al., 1974; Petersen and Sakmann, 2001; Petersen et al., 2003) (Grinvald et al., 1999, their Fig. 23) (Sterkin, Lampl, Ferster, Glaser, Grinvald, and Arieli, unpublished observations). Thus, not surprisingly, the time course of our results resembles the time courses seen in intracellular recordings, and somewhat also in extracellular recordings, in the somatosensory cortex (Laskin and Spencer, 1979; Simons and Carvell, 1989; Zhu and Connors, 1999). The net hyperpolarization observed here cannot be attributed to an artifact from intrinsic signals because the latency and time course are different from those of intrinsic signals (Vanzetta and Grinvald, 1999; Takashima et al., 2001). Thus, the hyperpolarization or depolarization recorded by VSD reflects the average hyperpolarization or depolarization of large neuronal populations, emphasizing the membrane potential changes in dendrites and nonmyelinated axons, with a bias toward the superficial layers of the cortex.
The early depolarization
We found that the early depolarization had an elliptical shape, with the long axis of the ellipse in the direction of the whisker rows. This finding, using a variety of stimulus types, is in congruence with the findings of Petersen et al. (2003), in which it is also shown by histology that the VSD activity originates at the center of the corresponding barrel (Kleinfeld and Delaney, 1996).
The surround hyperpolarization
We found that the cortical response critically depends on multiple stimulus parameters affecting latency, rise time, amplitude of depolarization and suppression, speed of repolarization, and the characteristics of the rebound phase. These findings clarify why different results were obtained in three previous VSDI in vivo studies in the rat barrel cortex. Although different VSDs were used in these studies, it is likely that the different results should be attributed to the different stimulus parameters used. Thus, net hyperpolarization was recorded by Orbach et al. (1985, their Figs. 2, 4) and by Takashima et al. (2001). In contrast, Kleinfeld and Delaney (1996) detected a triphasic response, but without the net hyperpolarization.
We found that on average hyperpolarization was more distant from the center of activity than the average depolarization (Fig.3D–F), and also that the hyperpolarization formed a ring-like shape around the center of activity (Figs.2A, 3A,B). Asymmetry in the hyperpolarization responses was noted, usually not parallel to the direction of asymmetry in the early depolarization, thus confirming previous single-unit studies (Brumberg et al., 1996).
The larger distance of hyperpolarization from the center of activity can assist in explaining the underlying cortical dynamics responsible for generating the phenomena of surround inhibition and cutaneous masking in single cortical cells (Hellweg et al., 1977; Laskin and Spencer, 1979; Simons and Carvell, 1989). However, we do not know whether the stronger hyperpolarization detected at the periphery reflects stronger peripheral inhibition rather than a strong center inhibition masked by a larger center depolarization. Therefore, additional experiments are required using pharmacological manipulations and intracellular recordings to clarify the spatiotemporal organization of inhibitory neurons.
Rebound phase and oscillations
The oscillations observed here resemble the oscillations seen in studies on evoked oscillations in the 5–20 Hz range in the cortex of the rat and of other species. Stimuli in different sensory modalities, including the somatosensory cortex, cause the emergence of oscillations, sometimes directly after the stimulus, but usually after a primary response, both in evoked potential studies and in intracellular and extracellular studies (Andersen and Andersson, 1968;Dinse et al., 1997). The origin of such oscillations can be extracortical (Contreras and Steriade, 1995) or intrinsic to the somatosensory cortex (Silva et al., 1991; Ahissar et al., 1997). The present study demonstrates the locality of somatosensory oscillations. The oscillations did not spread out of the cortical range that was initially depolarized.
Conclusions
The improved sensitivity of VSDI facilitated the localization of net hyperpolarization and visualization of cortical dynamics without signal averaging (Fig. 4D). This should accelerate studies of ongoing and evoked cortical dynamics all the way from the system level to the molecular level, using transgenic mice.
Footnotes
This work was supported by grants from the Enoch, Goldsmith, and Glasberg Foundations, the International Science Foundation, the Bundesministerium für Bildung, Wissenschaft, Forschung, und Technologie and the Grodetsky Center. This paper is dedicated to our devoted engineer Chaipi Wijnbergen, whose sudden death was a great loss to us all. We thank D. Backalash, F. Chavanne, D. Jancke, E. Seidmann, H. Slovin, and M. Szwed for their insightful comments, D. Ettner and Y. Toledo for technical assistance, and D. Sharon, H. Spors, and S. Haidarliu for help with the experiments.
Correspondence should be addressed to Dori Derdikman, Department of Neurobiology, Weizmann Institute of Science, PO Box 26, Rehovot 76100, Israel. E-mail: dori.derdikman@weizmann.ac.il.
References
- 1.Ahissar E, Arieli A. Figuring space by time. Neuron. 2001;32:185–201. doi: 10.1016/s0896-6273(01)00466-4. [DOI] [PubMed] [Google Scholar]
- 2.Ahissar E, Haidarliu S, Zacksenhouse M. Decoding temporally encoded sensory input by cortical oscillations and thalamic phase comparators. Proc Natl Acad Sci USA. 1997;94:11633–11638. doi: 10.1073/pnas.94.21.11633. [DOI] [PMC free article] [PubMed] [Google Scholar]
- 3.Ahissar E, Sosnik R, Haidarliu S. Transformation from temporal to rate coding in a somatosensory thalamocortical pathway. Nature. 2000;406:302–306. doi: 10.1038/35018568. [DOI] [PubMed] [Google Scholar]
- 4.Andersen P, Andersson SA. Physiological basis of the alpha rhythm. Meredith; New York: 1968. [Google Scholar]
- 5.Andersson SA. Intracellular postsynaptic potentials in the somatosensory cortex of the cat. Nature. 1965;205:297–298. doi: 10.1038/205297a0. [DOI] [PubMed] [Google Scholar]
- 6.Arieli A, Sterkin A, Grinvald A, Aertsen A. Dynamics of ongoing activity: explanation of the large variability in evoked cortical responses. Science. 1996;273:1868–1871. doi: 10.1126/science.273.5283.1868. [DOI] [PubMed] [Google Scholar]
- 7.Brumberg JC, Pinto DJ, Simons DJ. Spatial gradients and inhibitory summation in the rat whisker barrel system. J Neurophysiol. 1996;76:130–140. doi: 10.1152/jn.1996.76.1.130. [DOI] [PubMed] [Google Scholar]
- 8.Carvell GE, Simons DJ. Membrane-potential changes in rat SMI cortical-neurons evoked by controlled stimulation of mystacial vibrissae. Brain Res. 1988;448:186–191. doi: 10.1016/0006-8993(88)91118-3. [DOI] [PubMed] [Google Scholar]
- 9.Cohen LB, Salzberg BM, Davila HV, Ross WN, Landowne D, Waggoner AS, Wang CH. Changes in axon fluorescence during activity: molecular probes of membrane potential. J Membr Biol. 1974;19:1–36. doi: 10.1007/BF01869968. [DOI] [PubMed] [Google Scholar]
- 10.Contreras D, Steriade M. Cellular basis of EEG slow rhythms: a study of dynamic corticothalamic relationships. J Neurosci. 1995;15:604–622. doi: 10.1523/JNEUROSCI.15-01-00604.1995. [DOI] [PMC free article] [PubMed] [Google Scholar]
- 11.Derdikman D, Grinvald A, Ahissar E. Spatiotemporal response dynamics in the barrel cortex revealed by fast optical imaging. Soc Neurosci Abstr. 2000;26:548.20. [Google Scholar]
- 12.Dinse HR, Kruger K, Akhavan AC, Spengler F, Schoner G, Schreiner CE. Low-frequency oscillations of visual, auditory and somatosensory cortical neurons evoked by sensory stimulation. Int J Psychophysiol. 1997;26:205–227. doi: 10.1016/s0167-8760(97)00765-4. [DOI] [PubMed] [Google Scholar]
- 13.Grinvald A, Anglister L, Freeman JA, Hildesheim R, Manker A. Real-time optical imaging of naturally evoked electrical activity in intact frog brain. Nature. 1984;308:848–850. doi: 10.1038/308848a0. [DOI] [PubMed] [Google Scholar]
- 14.Grinvald A, Shoham D, Shmuel A, Glaser DE, Vanzetta I, Shtoyerman E, Slovin H, Sterkin A, Wijnbergen C, Hildesheim R, Arieli A. In-vivo optical imaging of cortical architecture and dynamics. In: Windhorst U, Johansson H, editors. Modern techniques in neuroscience research. Springer; Heidelberg: 1999. pp. 893–969. [Google Scholar]
- 15.Haidarliu S, Sosnik R, Ahissar E. Simultaneous multi-site recordings and iontophoretic drug and dye applications along the trigeminal system of anesthetized rats. J Neurosci Methods. 1999;94:27–40. doi: 10.1016/s0165-0270(99)00123-5. [DOI] [PubMed] [Google Scholar]
- 16.Hellweg FC, Schultz W, Creutzfeldt OD. Extracellular and intracellular recordings from cat's cortical whisker projection area: thalamocortical response transformation. J Neurophysiol. 1977;40:463–479. doi: 10.1152/jn.1977.40.3.463. [DOI] [PubMed] [Google Scholar]
- 17.Kleinfeld D, Delaney KR. Distributed representation of vibrissa movement in the upper layers of somatosensory cortex revealed with voltage-sensitive dyes. J Comp Neurol. 1996;375:89–108. doi: 10.1002/(SICI)1096-9861(19961104)375:1<89::AID-CNE6>3.0.CO;2-K. [DOI] [PubMed] [Google Scholar]
- 18.Laskin SE, Spencer WA. Cutaneous masking. II. Geometry of excitatory and inhibitory receptive fields of single units in somatosensory cortex of the cat. J Neurophysiol. 1979;42:1061–1082. doi: 10.1152/jn.1979.42.4.1061. [DOI] [PubMed] [Google Scholar]
- 19.Orbach HS, Cohen LB, Grinvald A. Optical mapping of electrical activity in rat somatosensory and visual cortex. J Neurosci. 1985;5:1886–1895. doi: 10.1523/JNEUROSCI.05-07-01886.1985. [DOI] [PMC free article] [PubMed] [Google Scholar]
- 20.Petersen CC, Sakmann B. Functionally independent columns of rat somatosensory barrel cortex revealed with voltage-sensitive dye imaging. J Neurosci. 2001;21:8435–8446. doi: 10.1523/JNEUROSCI.21-21-08435.2001. [DOI] [PMC free article] [PubMed] [Google Scholar]
- 21.Petersen CCH, Grinvald A, Sakmann B. Spatiotemporal dynamics of sensory responses in layer 2/3 of rat barrel cortex measured in vivo by voltage-sensitive dye imaging combined with whole-cell voltage recordings and neuron reconstructions. J Neurosci. 2003;23:1298–1309. doi: 10.1523/JNEUROSCI.23-04-01298.2003. [DOI] [PMC free article] [PubMed] [Google Scholar]
- 22.Rice FL, Munger BL. A comparative light microscopic analysis of the sensory innervation of the mystacial pad. II. The common fur between the vibrissae. J Comp Neurol. 1986;252:186–205. doi: 10.1002/cne.902520205. [DOI] [PubMed] [Google Scholar]
- 23.Rice FL, Mance A, Munger BL. A comparative light microscopic analysis of the sensory innervation of the mystacial pad. I. Innervation of vibrissal follicle-sinus complexes. J Comp Neurol. 1986;252:154–174. doi: 10.1002/cne.902520203. [DOI] [PubMed] [Google Scholar]
- 24.Shoham D, Glaser DE, Arieli A, Kenet T, Wijnbergen C, Toledo Y, Hildesheim R, Grinvald A. Imaging cortical dynamics at high spatial and temporal resolution with novel blue voltage-sensitive dyes. Neuron. 1999;24:791–802. doi: 10.1016/s0896-6273(00)81027-2. [DOI] [PubMed] [Google Scholar]
- 25.Silva LR, Amitai Y, Connors BW. Intrinsic oscillations of neocortex generated by layer 5 pyramidal neurons. Science. 1991;251:432–435. doi: 10.1126/science.1824881. [DOI] [PubMed] [Google Scholar]
- 26.Simons DJ, Carvell GE. Thalamocortical response transformation in the rat vibrissa-barrel system. J Neurophysiol. 1989;61:311–330. doi: 10.1152/jn.1989.61.2.311. [DOI] [PubMed] [Google Scholar]
- 27.Slovin H, Arieli A, Hildesheim R, Grinvald A. Long-term voltage-sensitive dye imaging reveals cortical dynamics in behaving monkeys. J Neurophysiol. 2002;88:3421–3438. doi: 10.1152/jn.00194.2002. [DOI] [PubMed] [Google Scholar]
- 28.Spors H, Grinvald A. Spatio-temporal dynamics of odor representations in the mammalian olfactory bulb. Neuron. 2002;34:301–315. doi: 10.1016/s0896-6273(02)00644-x. [DOI] [PubMed] [Google Scholar]
- 29.Takashima I, Kajiwara R, Iijima T. Voltage-sensitive dye versus intrinsic signal optical imaging: comparison of optically determined functional maps from rat barrel cortex. NeuroReport. 2001;12:2889–2894. doi: 10.1097/00001756-200109170-00027. [DOI] [PubMed] [Google Scholar]
- 30.Tsodyks M, Kenet T, Grinvald A, Arieli A. Linking spontaneous activity of single cortical neurons and the underlying functional architecture. Science. 1999;286:1943–1946. doi: 10.1126/science.286.5446.1943. [DOI] [PubMed] [Google Scholar]
- 31.Vanzetta I, Grinvald A. Increased cortical oxidative metabolism due to sensory stimulation: implications for functional brain imaging. Science. 1999;286:1555–1558. doi: 10.1126/science.286.5444.1555. [DOI] [PubMed] [Google Scholar]
- 32.Woolsey TA, Van der Loos H. The structural organization of layer IV in the somatosensory region (SI) of mouse cerebral cortex. The description of a cortical field composed of discrete cytoarchitectonic units. Brain Res. 1970;17:205–242. doi: 10.1016/0006-8993(70)90079-x. [DOI] [PubMed] [Google Scholar]
- 33.Zhu JJ, Connors BW. Intrinsic firing patterns and whisker-evoked synaptic responses of neurons in the rat barrel cortex. J Neurophysiol. 1999;81:1171–1183. doi: 10.1152/jn.1999.81.3.1171. [DOI] [PubMed] [Google Scholar]