

Abstract
In the wild-type brain, the Drosophila classic cadherin DE-cadherin is expressed globally by postembryonic neuroblasts and their lineages (“secondary lineages”), as well as glial cells. To address the role of DE-cadherin in the larval brain, we took advantage of the dominant-negative DE-cadexconstruct, the expression of which was directed to neurons, glial cells, or both. Global expression of DE-cadex driven by a heat pulse during the early second instar resulted in a severe phenotype that included deficits in neural proliferation. Neuroblasts appeared in approximately normal numbers but had highly reduced mitotic activity. When the DE-cadex construct was driven by the glial-specific driver gcm-Gal4, the effect of DE-cadex on neuroblast proliferation could be replicated, which indicates that DE-cadherin acts in glial cells to promote proliferation of neuroblasts. Expression of DE-cadex in neurons, cortex glia, or both results in abnormalities in cortex layering and in trajectories of secondary axons. In the wild-type brain, neuroblasts and neurons generated at different time points are arranged concentrically around the neuropile, with the DE-cadherin-positive neuroblasts and young secondary neurons at the surface, followed by older secondary neurons and primary neurons. Axons of secondary lineages follow a straight radial course toward the neuropile. Processes of glial cells located in the cortex form a scaffold, called trophospongium, that enwraps neuroblasts and neurons. Expression of DE-cadex in neurons, cortex glia, or both disrupted the regular placement of neuroblasts and secondary neurons and resulted in abnormal trajectories of cell body fiber tracts. We conclude that DE-cadherin plays a pivotal role in larval brain proliferation, brain cortex morphogenesis, and axon growth.
Keywords: DE-cadherin, larva, brain, neuroblast, morphogenesis, axon
Introduction
The cadherin superfamily of cell adhesion molecules plays an essential role during multiple steps of neural development. Members of this large family include the classic cadherins, which are linked to the actin cytoskeleton via binding to the proteins of the catenin family, and nonclassic cadherins that lack this link. Both classic and nonclassic cadherins preferentially homodimerize, which is important for mediation of cell–cell sorting in tissues that express differential patterns of cadherins (for review, see Tepass et al., 2000). In vertebrates, cadherins are widely expressed in the nervous system in distinct patterns; this finding, in conjunction with numerous experimental studies, corroborates the importance of cadherins in nervous system regionalization, axon tract formation, and synaptic connectivity (for review, see Redies, 2000).
The study of the role of cadherins in Drosophilaneurogenesis has been limited so far to the Drosophilaclassic cadherin DN-cadherin. DN-cadherin is expressed in the embryonic mesoderm and later by all neurons and their axons (Iwai et al., 1997). Loss of DN-cadherin in the embryo results in subtle defects in axon fasciculation and growth cone navigation. During larval visual system development, loss of DN-cadherin in the R7 photoreceptor leads to defects in target specificity (Lee et al., 2001). In addition to DN-cadherin, Drosophila embryos express DE-cadherin. DE-cadherin, which is expressed in all epithelia from the blastoderm stage onward, is downregulated in cells that lose their epithelial characteristics, including the mesoderm, neuroblasts, and their neurons (Tepass et al., 1996; Uemura et al., 1996). Loss-of-function analysis of DE-cadherin in the embryo and during oogenesis has demonstrated its requirement for the formation and maintenance of epithelial cells and for cell–cell sorting processes (Godt and Tepass, 1998).
Recently, we have shown that during larval neurogenesis, DE-cadherin is turned on in postembryonic neuroblasts and their progeny (secondary neurons) in a dynamic pattern (Dumstrei et al., 2003). In addition, neuropile and surface glia express DE-cadherin at a high level. This global expression prompted us to speculate that DE-cadherin-mediated adhesion between glial cells, neuroblasts, and neurons may be essential for larval brain morphogenesis. TheDrosophila brain originates in the early embryo with the delamination and subsequent proliferation of a population of neuroblasts that generate, in a stem cell-like manner, a fixed set of so-called primary glial and neuronal lineages. After a phase of mitotic “dormancy” that lasts from late embryogenesis to the end of the first larval instar, neuroblasts become active again and initiate a second wave of neural proliferation that gives rise to secondary (larval and pupal) lineages (Truman and Bate, 1988; Ito and Hotta, 1992). The pattern of neuroblast proliferation and neural differentiation generates a concentrically organized ganglionic brain, comprising a central neuropile formed by neuronal processes and synapses, surrounded by an outer cortex of neuronal and glial cell bodies. Neuroblasts and secondary neurons form the outer realm of the cortex. Secondary neurons are delayed in regard to morphological and functional differentiation (Truman, 1990). They form axonal processes (cell body fibers) (Strausfeld, 1976; Dumstrei et al., 2003), which penetrate the cortex and, in most cases, halt at the cortex–neuropile border. During metamorphosis, primary and secondary neurons become integrated into the adult neuropile (Truman et al., 1994). Glial cells form a sheath-like covering of the larval brain as a whole (surface glia), of individual neuronal lineages or parts thereof (cortex glia), and of the neuropile (neuropile glia) (Hartenstein et al., 1998).
Given its widespread expression in neuroblasts, secondary neurons, and glial cells, it stands to reason that DE-cadherin is involved in multiple steps of postembryonic neurogenesis. In particular, interactions between glial cells and neurons, shown to be crucial in neural proliferation, axonogenesis, and connectivity in vertebrates (for review, see Lemke, 2001), could be controlled by DE-cadherin-mediated adhesion. In Drosophila, surface glial cells appear to be involved in the onset and rate of neuroblast proliferation (Ebens et al., 1993). The glia of theDrosophila optic lobe play a crucial role in directing the connections between retinal axons and their central targets (Poeck et al., 2001). Other functions, including control of placement of neurons within the cortex, trajectory of proximal axon tracts, and ordered entry of these tracts into the neuropile, are to be expected.
In the present study, we used a dominant-negative construct of DE-cadherin, DE-cadex (F. Wang, K. Dumstrei, T. Haag, and V. Hartenstein, unpublished observations), to investigate its function during larval neurogenesis. We show that ubiquitous expression of this construct leads to reduced neuronal proliferation that results in the absence of many neurons and their axon tracts. This phenotype is likely attributable to glial cell defects, because it can be phenocopied when expressing DE-cadex in the glial cells alone. We further confirm the hypothesis that expression of DE-cadex in the neuronal cells results in loss of normal neuronal cell body placement in the cortex of the larval brain and irregularities in their axon projections through the cortex. We discuss the implications of DE-cadherin-dependent glia–neuronal cell interactions, as well as the role of cell adhesion molecules in cell sorting during neurogenesis.
Materials and Methods
Immunohistochemistry. An antibody that recognizes bromodeoxyuridine (BrdU; Becton Dickinson, Mountain View, CA) was used at a dilution of 1:40. Anti-β-galactosidase antibody (Promega, Madison, WI) was used at a dilution of 1:100. An antibody against castor was used at a dilution of 1:500 (Kambadur et al., 1998; kindly provided by Dr. W. Odenwald). A monoclonal antibody against the FasII protein was used at a dilution of 1:50 (Grenningloh et al., 1991; kindly provided by Dr. C. Goodman). An antibody against DE-cadherin was used at a dilution of 1:200 (Dumstrei et al., 2003). Anti-syntaxin antibody that labels the neuropile was used at a dilution of 1:10 (Fujita et al., 1982; obtained from the Developmental Studies Hybridoma Bank maintained by the Department of Pharmacology and Molecular Sciences, Johns Hopkins University School of Medicine, Baltimore, MD). Anti-Repo antibody, which labels all glial cells, was used at a dilution of 1:1000 (Campbell et al., 1994; kindly provided by Dr. A. Tomlinson). Secondary antibodies, which were Cy3-conjugated anti-rat Ig and anti-rabbit Ig (Jackson ImmunoResearch, West Grove, PA) and FITC-conjugated anti-mouse Ig (Jackson ImmunoResearch), were used at a 1:100 dilution. For antibody labeling, standard procedures were followed (Ashburner, 1989).
Fly stocks. Oregon R flies were used as the wild-type stock. The following fly lines were used: UAS-DE-cadex, which carries two copies of the DE-cadex construct on the X chromosome (Wang, Dumstrei, Haag, and Hartenstein, unpublished observations); actin “cdc2”-Gal4 (Ito et al., 1997; kindly provided by Dr. J. Lengyel); hs-FLP;UAS-green fluorescent protein (GFP) (Ito et al., 1997; kindly provided by Dr. J. Lengyel); hs-Gal4, Nrv2-Gal4;UAS-GFP (Sun et al., 1998); gcm-Gal4 (kindly provided by Dr. L. Zipursky); and elav-Gal4 (available from the Bloomington Stock Center). Flies were grown under standard conditions at room temperature or at 25°C. Egg collections were done on yeasted apple juice agar plates. Hatching larvae were transferred to Petri dishes filled with standard fly food. Larvae were collected at desired time points, and brains were dissected in PEMS (0.1 m PIPES, 2 mmMgSO4, and 1 mm EGTA, pH 7.0)-buffered 4% formaldehyde for 20 min.
GFP clones. The hs-FLP;UAS-GFP stock was crossed with the actin “cdc2”-Gal4 line. Progeny were raised at 25°C until the first instar larval stage, heat-pulsed at 37°C for 5 min, and placed back at 25°C. Wandering third instar larvae were dissected, fixed, and stained with either anti-DE-cadherin or anti-syntaxin antibodies.
BrdU incorporation. BrdU was dissolved in 40% ethanol (1 mg/100 μl) and mixed with fly medium to a final concentration of 1 mg/ml. Larvae were placed in vials with BrdU-containing food for 5 hr, at which point the brains were either dissected and fixed immediately in 4% formaldehyde or placed in normal fly medium until they reached the desired stage. After dissection and fixation for 20 min, the brains were washed three times for 15 min each in PBS and incubated in 2 m HCl for 45 min to denature BrdU-labeled DNA. The brains were washed three times for 15 min each and stained with antibody according to standard procedures (Ashburner, 1989).
To estimate the number of dividing cells in the larval brains (see histogram in Fig. 4), BrdU-positive cells were counted from confocal sections that were taken 10 μm apart, with the series starting from the anterior section and moving posteriorly. Five UAS-DE-cadex brains were counted as controls. Six gcm-Gal4;UAS-DE-cadex brains were counted as experimental samples. The average number of BrdU-labeled cells per brain was calculated after the samples with the highest and lowest number of BrdU-labeled cells were removed, which left three samples for the control and four for the experimental samples.
Fig. 4.
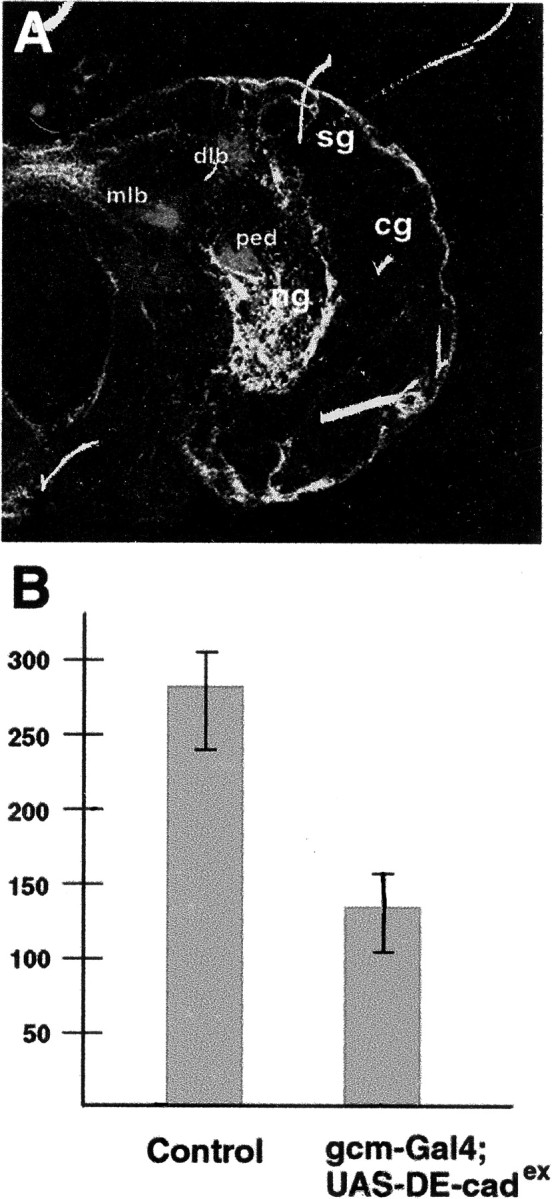
DE-cadex driven in glial cells reduces neuroblast proliferation. A, Confocal section of second instar wild-type brain showing GFP expression driven by the gcm-Gal4 line and anti-FasII labeling of neuropile tracts and mushroom body. dlb, Dorsal lobe; mlb medial lobe; ped peduncle. Strong GFP expression is seen in surface glia (sg) and neuropile glia (ng); weak expression is seen in cortex glia (cg). B, Histogram showing average number of BrdU-labeled cells per brain section, obtained by feeding BrdU for 5 hr. For both control and experimental brain, BrdU-positive nuclei were counted in every fifth section for six brains (see Materials and Methods). Expression of DE-cadex reduces the BrdU index by ∼50%.
Acridine orange staining of larval brains.UAS-DE-Cadex16;hs-gal4 and wild-type specimens were collected as embryos for 8 hr at 25°C and aged to the early second larval instar (∼48 hr after eggs were laid). After a 10 hr heat shock, larvae were transferred back to the 25°C incubator and aged until the mid third instar (∼16 hr after heat shock). At that time, larval brains were dissected in Ringer's solution and stained with acridine orange (Sigma, St. Louis, MO; 1.6 × 10⁻⁶m in Ringer's solution) for 5 min in the dark under gentle shaking. The brains were washed in Ringer's solution for 10 min and mounted on slides with spacers. Confocal images were taken immediately after the staining.
Confocal microscopy and three-dimensional digital models.Confocal images were taken on an MRC 1024ES microscope (Bio-Rad, Hercules, CA) with Bio-Rad Lasersharp version 3.2 software. Three-dimensional digital models were prepared as described by Nassif et al. (1998).
Results
Cellular architecture of the larval brain
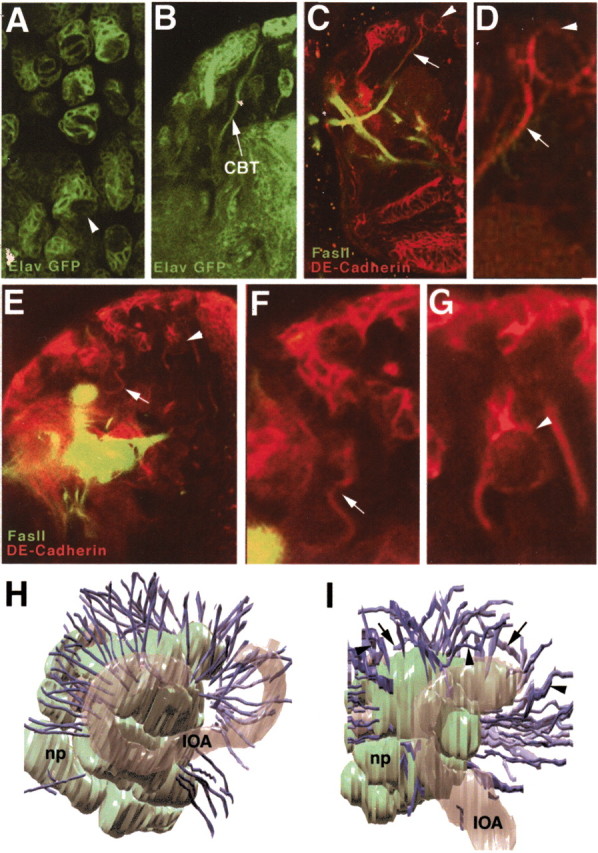
The larval brain is organized into concentric layers, with a central neuropile formed by axons, the cell bodies of which form the cortex that surrounds the neuropile (Fig.1A). During early larval stages, only neurons born during the embryonic period (primary neurons) are present. Toward the end of the first larval instar, neuroblasts located at the surface of the cortex become active and divide with a vertically oriented spindle to produce ganglion mother cells. Ganglion mother cells undergo one more division to form larval (secondary) neurons and glial cells. These secondary cells form a layer surrounding the primary neurons. Within the secondary neuronal layer, position is also correlated to time of birth, with young neurons situated superficially and old neurons situated deeply (Fig.1C,D). Using the flippase/flippase recombination target (FLP/FRT) system to mark cell lineages, individual clones of secondary neurons, and their neurites were labeled (Fig.1B). Neurites emanating from neurons belonging to one lineage form a coherent bundle, the cell body fiber tract (CBT) (Strausfeld, 1976; Dumstrei et al., 2003). CBTs penetrate the cortex in a straight radial trajectory. Many tracts stop at the neuropile–cortex boundary and do not appear to enter the neuropile during the larval period. Other CBTs enter the neuropile and navigate around the compartments of the neuropile without forming any arborizations that intermingle with the neuropile formed by primary neurons (Fig.1B).
Fig. 1.
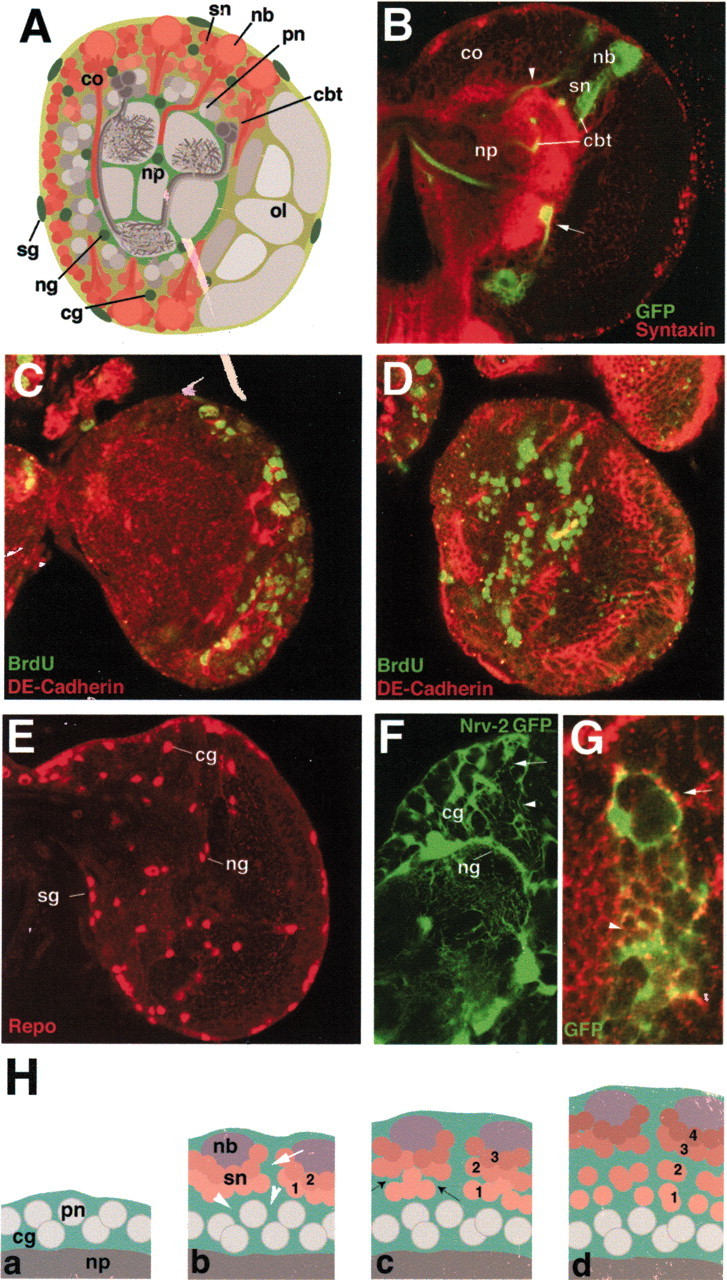
Cellular architecture of the larval brain.A, Schematic cross section of a third instar larval brain. Cells shaded in red are neurons born during the larval period [secondary neurons (sn)], neuroblasts (nb), and their axon tracts (cbt). Cells shaded in gray are embryonically born neurons [primary neurons (pn)] and the central neuropile (np) formed by their axon tracts. The laterally located optic lobe (ol) is also colored in different shades of gray. Cells in green represent the glial cells. Glial cells surrounding the surface of the brain are referred to as surface glia (sg), whereas neuropile glia (ng) surround the neuropile. Cortex glia (cg) surround clusters of neuronal cells. B, Confocal cross section of third instar brain labeled with anti-syntaxin (red, neuropile). Section contains three GFP-positive clones, each consisting of a neuroblast and its progeny. Clones were induced during late first instar. The arrowhead shows the axon tract entering the neuropile, whereas the arrow points to the axon tract that stops at the neuropile–cortex boundary. co, Cortex. C,D, Confocal cross sections of early third instar brains labeled with anti-DE-cadherin (red) and anti-BrdU (green). InC, larva was fed BrdU for 5 hr and fixed immediately. InD, a 24 hr period separated the BrdU pulse and fixation. Note the superficial location of BrdU-positive neural cells inC and the deep location in D.E, Confocal cross section of third instar brain labeled with anti-Repo antibody to label nuclei of surface glia (sg), cortex glia (cg), and neuropile glia (ng). F, Confocal cross section of third instar brain in Nrv-2-Gal4;UAS-GFP labels neuropile glia (ng) and cortex glia (cg). G, GFP-positive cortex glia clone, induced during the late first instar and fixed in the late third instar. H, Schematic cross section of brain cortex (cx) at different larval stages, illustrating formation of the trophospongium. Stages are as follows: a, first instar;b, second instar; c, early third instar;d, late third instar. Cortex glial cells (cg) are in green, neuroblasts (nb) in purple, secondary neurons (sn) in shades of red, and primary neurons (pn) in gray. Numbers 1–4 indicate birth order of secondary neurons (1, early; 4, late). White arrows inF–H illustrate the larger trophospongium chambers located superficially in the cortex, whereas white arrowheads show the deeper small chambers, which appear to include individual neurons. Black arrows in H, c, point at nascent glial septum.
Three different types of glial cells (surface, cortex, and neuropile glia) can be visualized with an antibody against the homeobox gene Repo, which is expressed in all glial lineages from an early stage onward (Campbell et al., 1994) (Fig. 1E). Whereas Repo is a nuclear antigen, glia-directed expression of GFP by driver lines such as gcm-Gal4 (Booth et al., 2000) and Nrv2-Gal4 (Sun et al., 1998), in combination with FRT/FLP-induced labeled clones, permit one to visualize the outline of individual glial cells at different stages and thereby follow the morphogenesis of the various types of glial cells. This approach reveals impressively the complex glial “trophospongium” (Hoyle, 1986) in the larval brain (Fig.1F–H). The trophospongium is a sponge-like matrix of cortex glial processes that arise in the late embryo and grow by both cell division (cortex glia clones contain six to eight cells 48 hr after clone induction) and cell size increase. Growth of the trophospongium and neuroblast proliferation appear to be coordinated in a complex manner. Thus, close to the brain surface, individual chambers of the trophospongium are large, containing a neuroblast and 15–20 neurons (Fig. 1F–H, arrow). It is possible that each superficial trophospongium chamber corresponds to one secondary lineage, such that the neurons formed by one neuroblast over a certain period are “received” into one chamber, thereby isolating them from other lineages. At deeper levels, chambers become smaller, in many cases taking up no more than a single neuron (Fig. 1G,H, arrowhead). This implies that there is a dynamic rearrangement of glia processes at the transition zone from large chambers to small chambers.
DE-cadherin expression in the larval brain
The expression of DE-cadherin was monitored with a polyclonal antibody and a P lacZ insertion into theshg gene, shgP34-1 (Tepass et al., 1996). In the embryo, DE-cadherin is expressed in all epithelial cells and is downregulated as cells undergo epithelial to mesenchymal transition. In that way, DE-cadherin is lost in neuroblasts and their progeny but is expressed in glial cells. By contrast, in the larval brain, DE-cadherin is also expressed in most neuroblasts and secondary neurons, in addition to glial cells and the cerebral tracheae that grow into the brain (Fig.2A–C). Expression in neuroblasts begins as these cells become mitotically active and persists throughout larval life. Both DE-cadherin RNA (data not shown) and protein are still present in ganglion mother cells and postmitotic neurons located superficially around the neuroblasts. Expression is downregulated after a certain interval, because deeply located secondary neurons are no longer labeled by DE-cadherin antibody or probe. This can be observed in GFP-positive clones, induced during the early second instar and fixed during the mid third instar, double-labeled with DE-cadherin antibody (Fig. 2D,E). These clones contain a neuroblast and several cells in close proximity labeled with both GFP and anti-DE-cadherin, whereas deep neurons only express GFP. The transient DE-cadherin expression is also demonstrated by labeling dividing neuroblasts with BrdU during the second instar followed by fixing and staining the brains for DE-cadherin expression after 2 or 36 hr during the mid third instar. In the first case, BrdU-positive cells overlap with DE-cadherin expression in newly born neurons (Fig. 2F); in the latter case, BrdU-positive neurons born during the second instar have moved deep in the cortex and do not express DE-cadherin (Fig. 2G).
Fig. 2.
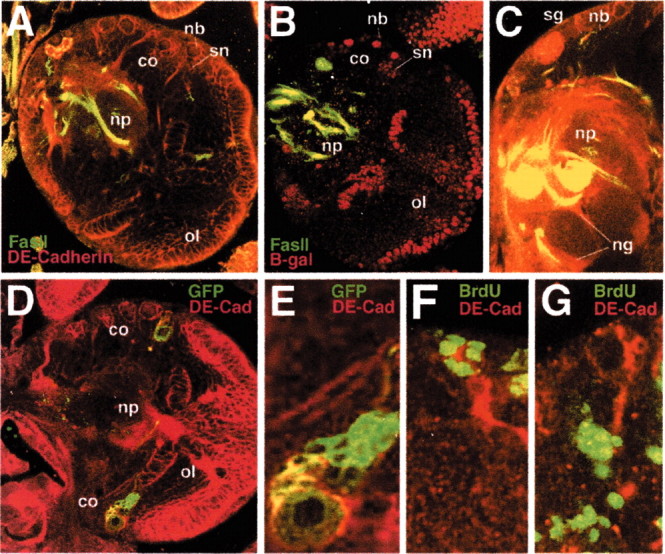
DE-cadherin expression in the larval brain. All panels show confocal sections of third instar brains. A, Expression of FasII (green) and DE-cadherin (red). B, Expression of FasII (green) and β-galactosidase (red) driven by a DE-cadherin enhancer trap line (shgp341). FasII is expressed in known landmark tracts in the larval brain neuropile (np). DE-cadherin (A) or β-galactosidase (B) activity is seen in the neuroblasts (nb) and those secondary neurons (sn) that are close to the neuroblasts.C, DE-cadherin expression in the surface glia (sg) and neuropile glia (ng). D, Two GFP-positive clones of neuroblasts and their progeny, induced during the late first instar, in brain labeled with anti DE-cadherin. E, High magnification of one of the clones shown in D. The neuroblast (nb) and cells in its proximity appear yellow because of expression of both GFP and DE-cadherin, whereas cells farther away from the neuroblast are labeled with GFP alone, which indicates that these cells no longer express DE-cadherin. F,G, Close-up views of parts of cross sections of early third instar brains labeled with anti-DE-cadherin (red) and anti-BrdU (green). In F, larva was fed BrdU for 5 hr and fixed immediately. In D, a 24 hr period separated the BrdU pulse and fixation. Note that BrdU label is found in DE-cadherin-positive superficial cells in F and deep in DE-cadherin expressing cells in G. co, Cortex; ol, optic lobe.
DE-cadherin is required for postembryonic neural proliferation and differentiation
The role of DE-cadherin during larval brain development was addressed with the dominant-negative construct UAS-DE-cadex. This construct contains the extracellular and transmembrane regions but lacks the cytoplasmic domain. The latter domain is required for binding to the catenins, which link the classic cadherins to the actin cytoskeleton, and is required for the adhesive functions of classic cadherins. Ectopic expression of this construct in the embryo with daughterless Gal4 results in a DE-cadherin loss-of-function phenotype. Furthermore, expression of DE-cadex in anshg null background does not lead to any detectable rescue of the embryonic phenotype as assayed by cuticle preparations (Wang, Dumstrei, Haag, and Hartenstein, unpublished observations).
Because the DE-cadherin antibody recognizes the extracellular domain of the protein, ectopic expression of the DE-cadex construct can be monitored with this antibody. Even though a ubiquitous driver line, hs-Gal4, was used, high levels of DE-cadex were only observed in cells that endogenously expressed DE-cadherin, i.e., glial cells, neuroblasts, and secondary neurons (Fig.3B,F). Less DE-cadex was detected in primary neurons and the neuropile (formed by processes of primary neurons). Like endogenous DE-cadherin, DE-cadex was localized at the cell membrane. This notion is supported by the finding that DE-cadex expressed in cultured S2 cells is integrated in the cell membrane (Fig. 3B, inset).
Fig. 3.
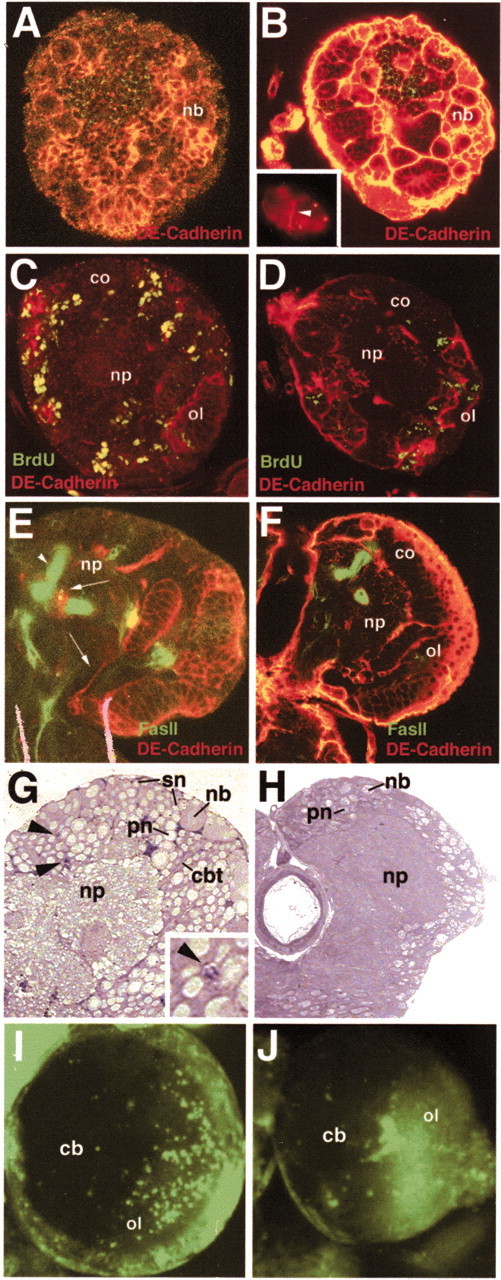
Ectopic expression of DE-cadexwith the hs-Gal4 driver line. All panels show confocal cross sections of early third instar brains. A, C, E, G, I, Wild-type controls; B, D, F, H, J, brains of larvae containing hs-Gal4;UAS-DE-cadex and heat-pulsed for 10 hr during the second instar. A, B, Labeling with anti-FasII (green) and anti-DE-cadherin (red) to show reduced brain size and higher packing density of neuroblasts (nb) in experimental animal (B). Inset inB shows a cluster of S2 cells expressing the DE-cadexconstruct in their membrane (white arrowhead). C, D, Anti-BrdU (green) and anti-DE-cadherin (red) labeling. In both the control and experimental animals, BrdU was fed for 5 hr during the second instar, followed by fixation and labeling 24 hr later. BrdU-positive cells were strongly reduced in the experimental animal. co, Cortex; ol, optic lobe; np, neuropile. E,F, Labeling with anti-FasII (green) and anti-DE-cadherin (red) to show the lack of axon tracts (arrows in control shown inE) in the experimental brains (F). Both sections were taken at the anteroposterior level of the dorsal lobe of the mushroom body, demarcated by the arrowheads in E and F.G, H, Histological sections of wild-type (G) and experimental (H) brain labeled with methylene blue. Neuroblasts (nb) in wild type are embedded in clusters of small secondary neurons (sn). Secondary neurons form CBTs (cbt) that traverse the cortex. Primary neurons (pn), characterized by their larger size, are located in the deep layer of the cortex. Apoptotic cells (arrowheads; enlargement in inset) are scattered at a low frequency throughout the cortex. In experimental brain, secondary neurons and CBTs are strongly reduced. The number of apoptotic cells is not increased compared with wild type. I, J, Acridine orange labeling of apoptotic cells in central brain (cb) and optic lobe (ol) of wild-type and experimental animals. Cell death is very limited in the central brain of both wild type and mutant. co, Cortex.
Global expression of DE-cadex driven by a heat pulse during the early second instar followed by fixation during the mid third instar resulted in severe deficits in neural proliferation and morphogenesis. The most conspicuous phenotype was the reduced brain size and the loss of most proximal axon tracts compared with control larval brains (Fig.3A,B,G,H). As observed generally in experiments in which transgenes are driven by Gal-4 driver lines, the expressivity of the phenotype covered a wide range. In brains most heavily affected (20–30%), neuroblasts appeared in approximately normal numbers but had highly reduced mitotic activity, as shown by BrdU-labeling experiments. BrdU was fed for 5 hr to second instar hs-Gal4;DE-cadex larvae, immediately followed by a 10 hr heat pulse and fixation after 24 hr. In experimental brains, the number of mitotic cells (neuroblasts and ganglion mother cells) was reduced to <25% of that of control animals (Fig. 3D). The number of secondary neurons produced by dividing postembryonic neuroblasts was reduced correspondingly (Fig.3H). Excess cell death did not appear to contribute to the reduced brain size, because labeling of DE-cadex and control brains heat-shocked and aged identically showed a similar amount of acridine orange-positive cells in the brain (Fig. 3I,J). Apart from reduced brain size, the lack of proper spacing between the neuroblasts is another characteristic of DE-cadex brains. In the control larval brains, neuroblasts were relatively evenly spaced over the surface of the central brain (Fig. 3A), an effect caused by the growing number of secondary neurons that pushed the neuroblasts away from each other. In the experimental larval brains, neuroblasts were typically clustered closely together (Fig. 3B). Given the abnormal spacing of neuroblasts and their reduced rate of mitosis, we were able to sample only a few neuroblasts in mitosis. In these cells, the orientation of the mitotic spindle was vertical or close to vertical, just as seen in the wild-type control (data not shown).
The reduced neuroblast proliferation and consecutive decrease in size of secondary lineages seen in DE-cadex-expressing larvae were accompanied by a global loss of CBTs. Figure 3E illustrates the centroanterior protocerebral tract (Nassif et al., 2003), which can be identified easily in wild-type brains by its proximity to the spur of the mushroom body and which is absent in hs-Gal4;UAS-DE-cadex brains (Fig.3F). By contrast, axons formed by primary neurons and their terminal branches that make up the neuropile appeared to be mostly undisturbed, as shown by labeling of brains with the anti-FasII antibody (Fig. 3E,F).
The effect of DE-cadherin on neural proliferation is mediated in part by glial cells
Previous reports indicating that glial cells may produce factors controlling neuroblast proliferation (Ebens et al., 1993) prompted us to ask whether DE-cadexexpression in glial cells alone would be able to replicate certain aspects of the phenotype that result from global heat shock-driven expression. In this experiment, gcm-Gal4, which is expressed in all glial cells at embryonic and early larval stages, was used to drive ectopic DE-cadex expression. The DE-cadex expression was particularly high in the surface glia that cover neuroblasts at the surface of the brain (Fig. 4A). The gcm-Gal4;UAS-DE-cadex brains showed a decrease in the size of the central brain (results not shown) accompanied by a reduction in neuronal proliferation. Experimental and control larvae were treated with BrdU for 5 hr at the early second instar and allowed to develop until the third instar. Experimental brains had a twofold decrease in uptake of BrdU compared with control larval brains (Fig. 4B), which suggests that the expression of DE-cadex in glia cells results in reduced mitotic activity of neuroblasts.
DE-cadherin is required in secondary lineages for normal cell placement and axon tract formation
DE-cadherin is expressed at a high level in neuroblasts and recently born secondary neurons, which suggests that besides neuroblast proliferation, this adhesion molecule could be involved in neural morphogenesis and differentiation. To disturb DE-cadherin function in neurons, DE-cadex was expressed with elav-Gal4, which is expressed in neurons but not glial cells (Fig.5A,B). Two phenotypes were particularly evident: the irregular placement of secondary lineages in the cortex and the abnormal trajectory of proximal axon tracts. In control brains, neuroblasts were invariably held at the brain surface (Fig. 5C,D). By contrast, neuroblasts in DE-cadex-expressing brains were located at variable depths (Fig. 5E,G). This phenotype is likely the result of increased mixing between secondary neurons of different ages and primary neurons caused by the absence of differential DE-cadherin levels in all cells.
Fig. 5.
Expression of DE-cadex in neuronal cells causes cortex layering defects and abnormal axonal trajectories. A, B, Elav-Gal4 drives UAS-GFP in neuroblasts and neurons in third instar brain. The arrowhead in A shows a representative lineage with neuroblast and secondary neurons. The arrow in B shows GFP-positive CBT. C, Confocal section of third instar wild-type brain labeled with anti-DE-cadherin (red) and anti-FasII (green), showing superficial location of neuroblasts (arrowhead) and straight radial trajectory of secondary axons (arrow). D, Enlargement of secondary lineage and CBT shown in C.E–G, Confocal sections of third instar brains after elav-Gal4;UAS-DE-cadex expression, labeled with anti-DE-cadherin (red) and anti-FasII (green) antibodies. CBTs in many instances follow a tortuous course (arrow); neuroblasts are frequently located deep in cortex (arrowhead). H, I, Three-dimensional digital models of third instar wild-type (H) and elav-Gal4;DE-cadex brain reconstructed from serial confocal sections of brains labeled with anti-FasII and anti-DE-cadherin. Brains are viewed laterally, with anterior to the left and dorsal to the top. The neuropile (np) is depicted in light green. The inner optic anlage (IOA) is shown in gray. CBTs are in purple. In wild type, all CBTs follow a straight, radially oriented trajectory. Numerous CBTs in elav-Gal4;DE-cadexbrains approach the neuropile surface almost tangentially (arrows), follow a serpentine path (arrowheads), or both.
In addition to abnormal cortical layering, elav-Gal4;UAS-DE-cadex brains showed defects in the trajectory of proximal axon tracts. Proximal axon tracts in wild-type brains usually follow a straight radial course from the lineage of origin, through deeper cortical layers of older secondary neurons and primary neurons, toward the neuropile surface, where many tracts stop (Dumstrei et al., 2003) (Fig. 5C,D). Proximal axon tracts in elav-Gal4;DE-cadex brains were approximately normal in number but often did not follow a straight radial trajectory (Fig. 5E,F,I). Instead, they traveled at various angles relative to the surface and often followed a tortuous course. This demonstrates that proximal axons are still able to bundle together, possibly because of the expression of adhesion systems other than DE-cadherin; however, confronted with abnormally positioned neurons, these axons often grow in the wrong direction, are frequently “sidetracked” by obstacles in their path, or both. We also cannot exclude the possibility that axon outgrowth is normal initially but tracts become warped secondarily as a result of enhanced cell movement in the cortex because of reduced adhesion between somata or between somata and cortex glia.
Effect of DE-cadex expression on glial morphology
Given that the severe abnormalities in neural proliferation and morphogenesis are caused at least in part by DE-cadex expression in glial cells, we asked whether this expression causes structurally visible defects in glia. The use of anti-Repo antibody as a marker to monitor the number and pattern of glial cells showed that all three major types of glial cells were present (data not shown). Histological and EM sections confirmed that the surface glia layer was present (Fig.6A). Structural defects were clearly evident in the neuropile glia and cortex glia. Neuropile glial cell bodies were less flattened; the neuropile sheath was interrupted by multiple gaps and clefts, which resulted in a mixing of cell bodies and axonal processes in the boundary area (Fig.6C). A dramatic phenotype was seen when DE-cadex was expressed in cortex glia by the Nrv2-Gal4 driver line (Fig.7B) and in a combination of both cortex glia and neurons by Nrv2-Gal4 combined with elav-Gal4 (Fig.7D). In both instances, cortex glial cells showed a severe reduction in processes, which left wide areas of the cortex without trophospongium. At the same time, many cortex glial cell bodies appeared to be more rounded and bulky than their wild-type counterparts (Fig. 7A,B). In cortical domains lacking the trophospongium, neurons that express markers normally restricted to the superficial layers, such as the castor epitope (Kambadur et al., 1998) (Fig.7B,D), are scattered throughout the entire cortex. We conclude that by interfering with neuron–glial adhesion, DE-cadex reduces the capability of cortex glia to slide processes between neurons. This in turn may be responsible in part for the increased movement of neurons and the resulting loss of strict layering of the cortex.
Fig. 6.
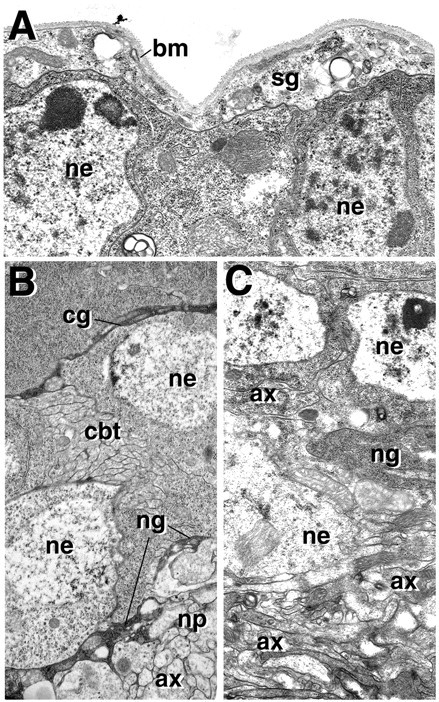
Effect of DE-cadex on glial ultrastructure. All panels show electron micrographs of cross sections of mid third instar brains. In A and C, DE-cadex is activated by a heat pulse delivered during the second instar. A, DE-cadexdoes not noticeably affect the integrity of surface glia (sg), which forms a prominent sheath surrounding neuronal cell bodies (ne). Basement membrane (bm) is secreted by surface glia. B, Section of control wild-type brain showing neuronal cell bodies (ne), electron-dense septa of trophospongium formed by cortex glia (cg), and neuropile glial sheath (ng) formed around the central neuropile (np). Note tightly packed CBT (cbt) in cortex and large-diameter axons of primary neurons (ax) in neuropile. C, Expression of DE-cadex disrupts cortex and neuropile glia. Note interrupted neuropile glial sheath (ng) and intermixing of neuronal somata (ne) and axons (ax) at the cortex–neuropile boundary.
Fig. 7.
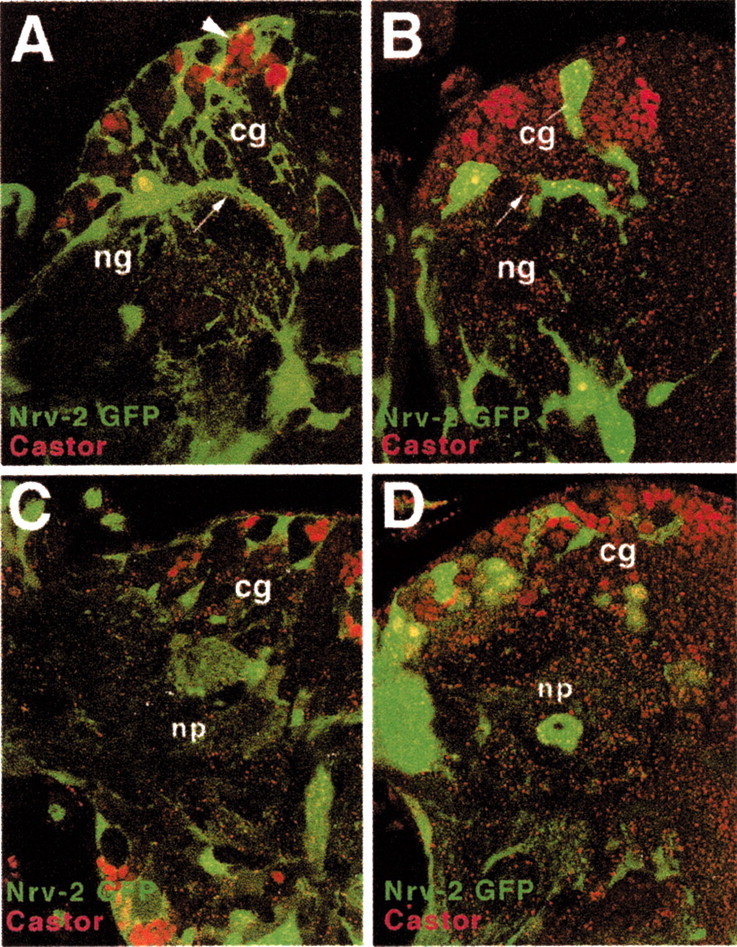
Ectopic expression of DE-cadexin neurons and cortex glia affects glial morphology. All panels show confocal sections of mid third instar brains labeled with anti-castor antibody (red), a marker for recently born neurons, and Nrv2-Gal4;UAS-GFP, expressed in glia (green). A, Wild-type brain showing abundant trophospongium, formed by cortex glia (cg). Note the location of castor-positive neurons in superficial chambers of the trophospongium (arrowhead). The arrow demarcates a thick glial sheath formed by neuropile glia (ng). B, Nrv-Gal4;UAS-GFP;DE-cadex brain. The trophospongium is severely reduced. Castor-positive neurons are found throughout the cortex. The glial sheath surrounding the neuropile is uneven and full of gaps (arrow). C, Wild-type brain expressing GFP under the control of Nrv2-Gal4 (glia) and elav-Gal4 [neurons; faint labeling, mainly in primary neurons and neuropile (np)].D, DE-cadex driven by Nrv2-Gal4 and elav-Gal4. The phenotype is similar to that shown inB, with a severely reduced trophospongium and neuropile glial sheath.
Discussion
We have previously shown that DE-cadherin is expressed in the majority of postembryonic neuroblasts and transiently in their progeny, as well as in all three types of glial cells. In this report, we demonstrate that during different phases of postembryonic neurogenesis, DE-cadherin is required for several functions that can be addressed experimentally. The UAS-DE-cadex construct containing the extracellular and transmembrane domains of DE-cadherin was used to perturb the normal function of DE-cadherin. The nature of this perturbation is considered a dominant-negative effect for the following reasons (Wang, Dumstrei, Haag, and Hartenstein, unpublished observations): (1) when expressing DE-cadex in embryos using a ubiquitous driver line, we see a range of defects that phenocopy the DE-cadherin loss-of-function allelic series; (2) expression of DE-cadex in a shg null background does not result in any detectable phenotypic rescue, which suggests that this construct cannot mediate adhesive contacts; and (3) recent studies by Oda and Tsukita (1999) and LeBorgne et al. (2002)that focused on tracheal and sense organ development confirmed that a DE-cadex construct acts in a dominant-negative manner.
Glial cells and proliferation
We detected high levels of DE-cadherin expression in the surface glia throughout larval development. Expression of DE-cadex with a ubiquitous driver line, hs-Gal4, results in brains with reduced neuronal proliferation activity, which resulted in lack of secondary neurons. The proliferation deficit appeared to exist in all lineages, although because of a lack of markers for specific lineages, we could not rule out that proliferation was more affected in some lineages than others. We speculate that the effect on neuroblast proliferation is mainly attributable to DE-cadex expression in the surface glia, given that activation of DE-cadex by the glia-specific gcm-Gal4 resulted in a similar, albeit weaker, phenotype than driving with hs-Gal4. At the same time, driving with Nrv2-Gal4 (expressed in cortex and neuropile glia) led to no detectable defects in the size of the larval brains.
Despite the strong reduction in secondary neurons after global expression of DE-cadex, the number of surface glial cells did not appear to be affected significantly. This suggests that surface glial growth is independent of neuroblast division. The mechanism of glial growth in the larval central brain has not been investigated. We are currently addressing this question by inducing labeled clones of neuronal and glial lineages. Preliminary data show that surface glia increase only slightly in number. Thus, occasional clones containing one or two isolated surface glial cells were observed (V. Hartenstein, unpublished data). Neither surface glia nor cortex glia appear to derive from mixed neural–glial clones (Hartenstein, unpublished data).
Surface glia-derived signals controlling the onset of mitotic activity of neuroblasts have been reported previously (Ebens et al., 1993; Park et al., 1997). According to these studies, the Anachronism (Ana) protein is expressed on membranes of surface glial cells surrounding the brain, peripheral nerves, and sensory complexes. Loss of Ana results in premature neuroblast proliferation in the larval brain. Thus, after a normal course of proliferation and mitotic quiescence, neuroblasts and optic anlagen in ana larvae start proliferating during the early first instar, resulting in morphogenetic abnormalities of both central brain and optic lobe (Ebens et al., 1993). We speculate that DE-cadherin forms part of another molecular pathway that mediates glia–neuroblast interactions that affect neuroblast division. Findings in the embryo, as well as recent results by Akong et al. (2002) on the role of the α-catenin-binding protein APC2, support this notion.
In the embryo, two lines of evidence implicate DE-cadherin in cell division. First, recent findings by Lu et al. (2001) indicate that the zonula adherens, formed by high concentrations of the cadherin–catenin complex (CCC) near the apical pole of epithelial cells, acts as a spindle-anchoring center that pulls the mitotic spindle into a horizontal position. Loss of the zonula adherens, induced by removal of the apical membrane protein Crumbs, results in ectodermal cells with vertical mitotic spindles. The same phenotype is observed after elimination of the function of DE-cadherin by expression of DE-cadex (Wang, Dumstrei, Haag, and Hartenstein, unpublished observations). In DE-cadex-expressing embryos, mitotic spindles in the surface layer are oriented randomly, with vertical spindles occurring as frequently as horizontal spindles. The control of mitotic spindle orientation by the CCC has also been reported for the sense organ precursor cells that divide and give rise to the mechanosensory bristles of the notum (Le Borgne et al., 2002). According to the present findings, as well as a recent study by Akong et al. (2002), mitotic spindles are little or not affected in larval brain neuroblasts, although the onset of frequency of mitosis of these cells is abnormal. This difference between embryonic and larval neural precursors may be related to the fact that in the embryo, neuroblasts delaminate from an epithelial layer (the neurectoderm), whereas such a layer is absent in the larval brain. Here, only glial cells cap the neuroblasts, and it is possible that the role of glial cells in neuroblast spindle orientation is different from that played by the embryonic neurectoderm.
At an even earlier stage, at the onset of gastrulation, DE-cadherin is involved in coordinating invagination and mitosis of mesoderm cells. In wild-type embryos, the mesoderm invaginates as an epithelial layer. Subsequently, mesoderm cells undergo a synchronous round of mitosis, accompanied by an epithelial–mesenchymal transition (Campos-Ortega and Hartenstein, 1985). If DE-cadex is expressed by a maternally activated driver line, mesoderm cells divide and become mesenchymal prematurely (Wang, Dumstrei, Haag, and Hartenstein, unpublished observations). An almost identical phenotype was described recently for the mutation tribbles (trb; Grosshans and Wieschaus, 2000;Mata et al., 2000; Seher and Leptin, 2000). Trb encodes a cytoplasmic kinase that inhibits the cdc25 homolog String (Stg), thereby delaying mitosis of the mesoderm. It is possible that, similar to many other cytoplasmic enzymes, Trb is linked to the cytoskeleton, or even directly to the CCC. In this case, it would be plausible that Trb activity requires an intact CCC, explaining why disruption of DE-cadherin results in loss of Trb activity and premature mesoderm mitosis.
APC2, a Drosophila homolog of the adenomatosis coli (APC) protein, also plays a role in anchoring mitotic spindles in embryos and controlling proliferation of larval neuroblasts. The protein colocalizes with the other components of the CCC in embryos (McCartney et al., 2001), as well as larval neuroblasts and neurons (McCartney et al., 1999). Loss of APC2 negatively affects the number of neuroblasts that are reactivated in the larval period (Akong et al., 2002). No effect on the (vertical) orientation of mitotic spindles of those neuroblasts that do divide was reported, similar to our findings on larval brain in which DE-cadex is expressed ubiquitously or in surface glial cells.
It is not yet clear how the different phenotypes that resulted from disturbance of DE-cadherin can be integrated into one coherent picture. In epithelial cells [or modified epithelial cells such as sensory organ precursors investigated by LeBorgne et al. (2002)], it is plausible that DE-cadherin, as part of the CCC, which links the cytoskeleton to the membrane, should be involved in mitotic spindle orientation. To date, there is no information as to how spindle orientation and the timing, or frequency, of mitosis are related, if at all. Ectodermal cells that divide vertically after deleting the zonula adherens appear to enter mitosis at approximately the same time at which they would divide normally (Lu et al., 2001). In the larva, where DE-cadherin and other CCC components are positively required for proliferation, no significant effect on spindle orientation can be seen (Akong et al., 2002; this study). It is possible that the effect of DE-cadherin on spindle orientation in epithelial cells and proliferation in neuroblasts are unrelated. The positive involvement in neuroblast proliferation could be a reflection of the surface glia-derived mitogenic signal that activates neuroblasts. Thus, in the brain, DE-cadherin might be involved primarily in mediating glia–neuroblast interactions. If these interactions fail, the mitogenic signal, which is separate from DE-cadherin, is unable to exert its effect on neuroblasts. This view would also explain why embryonic neuroblasts, which do not depend on glial cells for proliferation, show no requirement for DE-cadherin (Tepass et al., 1996).
DE-cadherin and brain cortex morphogenesis: effect of cell sorting
The defect in cortex layering and cell body fiber trajectory that we saw in larval brains in which DE-cadex was expressed is likely the result of two interrelated effects of DE-cadherin. First, given that DE-cadherin is expressed in neurons and cortex glia and that DE-cadex causes structural changes in the trophospongium, this in itself would have an effect on the layering of neuroblasts and neurons. Second, cell sorting based on differential DE-cadherin expression may be involved. Thus, DE-cadherin is expressed at high levels in neuroblasts, ganglion mother cells, and newly born neurons but is turned off in older neurons and is never expressed in primary neurons. This expression gradient could be instrumental for maintaining the layered arrangement of neuroblasts, ganglion mother cells, and neurons of different ages. Removal or lowering of DE-cadherin levels by DE-cadex would disturb this gradient, which could cause cell mixing and thereby a breakdown of the layered organization of the cortex. Classic experiments by Townes and Holtfreter (1955) had shown that dissociated cells expressing different adhesion molecules will sort out according to the type of molecule they express. The same effect can be achieved if cells express the same adhesion system at different concentrations (Steinberg and Takeichi, 1994). In vivo studies strongly suggest that cell sorting based on different DE-cadherin concentrations is involved in normal ovary morphogenesis (Godt and Tepass, 1998). During vertebrate neurogenesis, cell sorting mediated by expression of different members of the cadherin superfamily is an important process in establishing compartments or subregions of the brain. For example, in the Xenopus neural tube, F-cadherin functions to position the neuroepithelial cells at the sulcus limitans (Espeseth et al., 1998). Similarly, in the embryonic mouse brain, cadherin 6 and R-cadherin maintain the boundary between the lateral ganglionic eminence and the presumptive cerebral cortex, respectively (Inoue et al., 2001).
Cell sorting might also be the mechanism by which the complementary expression of DE-cadherin and the only other Drosophilaclassic cadherin, DN-cadherin, exerts an effect on larval brain morphogenesis. DN-cadherin is expressed globally by embryonic primary neurons and their neurites (Iwai et al., 1997). This expression is carried over from the embryonic into the larval period. As a result, the entire larval neuropile is labeled (Hartenstein, unpublished data). None of the classes of glial cells express DN-cadherin. Furthermore, with the notable exception of mushroom body cells, which are DE-cadherin-negative, secondary neurons do not express DN-cadherin. This expression pattern represents the exact opposite of the pattern exhibited by DE-cadherin, which is globally expressed in neuroblasts, secondary neurons, and glial cells but not in primary neurons and the mushroom body. It is possible that the complementary expression of the two classic cadherins in the larval brain is involved in the separation of differentiated primary lineages and immature secondary lineages. So far, no functional study of DN-cadherin in the central larval brain has been performed. In the pupal optic lobe, DN-cadherin plays a role in targeting afferent retinal axons to their proper termination site in the optic lobe (Lee et al., 2001). Additional studies, including ectopic expression of DN-cadherin in secondary lineages or removal of both cadherins from brain neurons, are required to address the role of these molecules in brain morphogenesis.
DE-cadherin and brain cortex morphogenesis: role of cortex glia
Cortex glial cells form a scaffold of processes, adequately termed trophospongium by Hoyle (1986), around neuronal somata located in the cortex. In Drosophila, the trophospongium has not been described in much detail, and its origin during embryonic development or remodeling during metamorphosis is entirely unknown. Buchanan and Benzer (1993) demonstrated that loss of the drop-dead gene causes lethality in early adulthood and is accompanied by structural defects, primarily of the cortex glia. Electron micrographs presented in that report documented the morphology of cortex glia in adult brains of wild-type and drop-dead flies. Similar to results presented here, adult cortex glia formed 20- to 50-nm-thick electron-dense sheaths around individual neurons or, in some cases, small packets of neurons. This trophospongium is fully established in the early larva around primary neurons (Younossi-Hartenstein et al., 2003) (Fig. 1H, a). As neuroblasts become active and produce secondary lineages, the trophospongium expands to form additional chambers that take up the newly generated neurons. These superficial chambers are larger than the deep ones, typically containing an entire lineage formed by a neuroblast and 20–30 ganglion mother cells or neurons (Fig. 1H, b). As lineages grow, the oldest neurons become separated from their younger siblings by newly formed cortex glia processes (Fig. 1H, c, d). The ordered formation of cortex glial processes may well represent a mechanism that establishes and maintains the position of a neuron within the cortex. Changes in cortex glial morphology, such as reported here to result from DE-cadexexpression, may well be responsible for the neural layering defects.
The role we ascribe here to cortex glia in the Drosophilalarval brain is highly reminiscent of the role of radial glial cells in vertebrates. Radial glial cells in the neural tube form processes that extend from the ventricular zone through the entire thickness of the ventral tube. These processes form a scaffold on which the neurons migrate from the ventricular layer, where they are born, into the mantle layer (Rakic, 1972). Experimental studies confirm that clonally related neurons migrate preferentially along a common radial glial process and thereby form a vertical column of neurons (Walsh and Cepko, 1988).
Radial glia represent a peculiar cell type restricted to embryos in mammals but persisting into adulthood in all other vertebrate groups. According to recent findings, radial glial cells are a subclass of neuroepithelial cells that start to express molecular markers of astrocytes without being firmly committed to a glial fate. Thus, it could be shown that in mouse, radial glial cells of the early embryo continue dividing and producing neurons and astroglia (for review, seeParnavelas and Nadarajah, 2001). In view of the similar role cortex glia in insects and radial glia in vertebrates appear to play, it is tempting to speculate that future studies will uncover fundamental similarities in the molecular mechanisms underlying the interaction between neurons and glial cells. Currently, it is difficult to compare glial cells in different phyla. Thus, given that glial cells, as defined morphologically, appear to be absent from many simple invertebrate animals (including flatworms and nematodes; Radojcic and Pentreath, 1979), it is unlikely that the bilaterian ancestor possessed these cells. Consequently, glial cells in vertebrates and insects (as well as other “higher” protostome phyla, including annelids and molluscs) represent convergent traits, having evolved independently from neurons or epidermal cells in animal phyla that developed a complex nervous system. Comparative molecular studies investigating the pathways that control glial fate in different animals will shed more light on the question of how to evaluate the phylogenetic and functional relationship between glial cells of different phyla.
Footnotes
This work was supported by University of California, Los Angeles, United States Public Health Service National Research Service Award GM07185 to F.W. and National Institutes of Health Grant NS 29367 to V.H. We thank Drs. C. Goodman, W. Odenwald, J. Lengyel, A. Tomlinson, and L. Zipursky and the Bloomington and Umea Stock Center for sending fly stocks and antibodies. The following antibodies were obtained from the Developmental Studies Hybridoma Bank, developed under the auspices of the National Institute of Child Health and Human Development and maintained by the University of Iowa, Department of Biological Sciences (Iowa City, IA): armadillo antibody, developed by Dr. E. Wieschaus; and crumbs antibody, developed by Dr. E. Knust.
Correspondence should be addressed to Dr. Volker Hartenstein at the above address.
References
- 1.Akong K, Grevengoed EE, Price MH, McCartney BM, Hayden MA, Peifer M. Drosophila APC2 and APC1: distinct intracellular localization and complex overlapping roles in the embryos, larval brain, and imaginal discs. Dev Biol. 2002;250:71–90. doi: 10.1006/dbio.2002.0777. [DOI] [PubMed] [Google Scholar]
- 2.Ashburner M. Drosophila: a laboratory manual. Cold Spring Harbor Laboratory; Cold Spring Harbor, NY: 1989. [Google Scholar]
- 3.Booth GE, Kinrade EF, Hidalgo A. Glia maintain follower neuron survival during Drosophila CNS development. Development. 2000;127:237–244. doi: 10.1242/dev.127.2.237. [DOI] [PubMed] [Google Scholar]
- 4.Buchanan RL, Benzer S. Defective glia in the Drosophila brain degeneration mutant drop-dead. Neuron. 1993;10:839–850. doi: 10.1016/0896-6273(93)90200-b. [DOI] [PubMed] [Google Scholar]
- 5.Campbell G, Goring H, Lin T, Spana E, Andersson S, Doe CQ, Tomlinson A. RK2, a glial-specific homeodomain protein required for embryonic nerve cord condensation and viability in Drosophila. Development. 1994;120:2957–2966. doi: 10.1242/dev.120.10.2957. [DOI] [PubMed] [Google Scholar]
- 6.Campos-Ortega JA, Hartenstein V. The embryonic development of Drosophila melanogaster. Springer; Berlin: 1985. [Google Scholar]
- 7.Dumstrei K, Wang F, Nassif C, Hartenstein V. Early development of the Drosophila brain. V. Pattern of postembryonic neuronal lineages expressing Shg/DE-cadherin. J Comp Neurol. 2003;455:451–462. doi: 10.1002/cne.10484. [DOI] [PubMed] [Google Scholar]
- 8.Ebens AJ, Garren H, Cheyette BN, Zipursky SL. The Drosophila anachronism locus: a glycoprotein secreted by glia inhibits neuroblast proliferation. Cell. 1993;74:5–27. doi: 10.1016/0092-8674(93)90291-w. [DOI] [PubMed] [Google Scholar]
- 9.Espeseth A, Marnellos G, Kintner C. The role of F-cadherin in localizing cells during neural tube formation in Xenopus embryos. Development. 1998;125:301–312. doi: 10.1242/dev.125.2.301. [DOI] [PubMed] [Google Scholar]
- 10.Fujita SC, Zipursky SL, Benzer S, Ferrus A, Shotwell SL. Monoclonal antibodies against the Drosophila nervous system. Proc Natl Acad Sci USA. 1982;79:7929–7933. doi: 10.1073/pnas.79.24.7929. [DOI] [PMC free article] [PubMed] [Google Scholar]
- 11.Godt D, Tepass U. Drosophila oocyte localization is mediated by differential cadherin-based adhesion. Nature. 1998;395:387–391. doi: 10.1038/26493. [DOI] [PubMed] [Google Scholar]
- 12.Grenningloh G, Rehm EJ, Goodman CS. Genetic analysis of growth cone guidance in Drosophila: fasciclin II functions as a neuronal recognition molecule. Cell. 1991;67:45–57. doi: 10.1016/0092-8674(91)90571-f. [DOI] [PubMed] [Google Scholar]
- 13.Grosshans J, Wieschaus E. A genetic link between morphogenesis and cell division during formation of the ventral furrow in Drosophila. Cell. 2000;101:523–531. doi: 10.1016/s0092-8674(00)80862-4. [DOI] [PubMed] [Google Scholar]
- 14.Hartenstein V, Nassif C, Lekven A. Embryonic development of the Drosophila brain. II. The glia cells of the brain. J Comp Neurol. 1998;402:32–48. [PubMed] [Google Scholar]
- 15.Hoyle G. Glial cells of an insect ganglion. J Comp Neurol. 1986;246:85–103. doi: 10.1002/cne.902460106. [DOI] [PubMed] [Google Scholar]
- 16.Inoue T, Tanaka T, Takeichi M, Chisaka O, Nakamura S, Osumi N. Role of cadherins in maintaining the compartment boundary between the cortex and striatum during development. Development. 2001;128:561–569. doi: 10.1242/dev.128.4.561. [DOI] [PubMed] [Google Scholar]
- 17.Ito K, Hotta Y. Proliferation pattern of postembryonic neuroblasts in the brain of Drosophila melanogaster. Dev Biol. 1992;149:134–148. doi: 10.1016/0012-1606(92)90270-q. [DOI] [PubMed] [Google Scholar]
- 18.Ito K, Sass H, Urban J, Hofbauer A, Schneuwly S. GAL4-responsive UAS-tau as a tool for studying the anatomy and development of the Drosophila central nervous system. Cell Tissue Res. 1997;290:1–10. doi: 10.1007/s004410050901. [DOI] [PubMed] [Google Scholar]
- 19.Iwai Y, Usui T, Hirano S, Steward R, Takeichi M, Uemura T. Axon patterning requires DN-cadherin, a novel neuronal adhesion receptor, in the Drosophila embryonic CNS. Neuron. 1997;19:77–89. doi: 10.1016/s0896-6273(00)80349-9. [DOI] [PubMed] [Google Scholar]
- 20.Kambadur R, Koizumi K, Stivers C, Nagle J, Poole SJ, Odenwald WF. Regulation of POU genes by castor and hunchback establishes layered compartments in the Drosophila CNS. Genes Dev. 1998;12:246–260. doi: 10.1101/gad.12.2.246. [DOI] [PMC free article] [PubMed] [Google Scholar]
- 21.Le Borgne R, Bellaiche Y, Schweisguth F. Drosophila E-cadherin regulates the orientation of asymmetric cell division in the sensory organ lineage. Curr Biol. 2002;12:95–104. doi: 10.1016/s0960-9822(01)00648-0. [DOI] [PubMed] [Google Scholar]
- 22.Lee CH, Herman T, Clandinin TR, Lee R, Zipursky SL. N-cadherin regulates target specificity in the Drosophila visual system. Neuron. 2001;30:437–450. doi: 10.1016/s0896-6273(01)00291-4. [DOI] [PubMed] [Google Scholar]
- 23.Lemke G. Glial control of neuronal development. Annu Rev Neurosci. 2001;24:87–105. doi: 10.1146/annurev.neuro.24.1.87. [DOI] [PubMed] [Google Scholar]
- 24.Lu B, Roegiers F, Jan LY, Jan YN. Adherens junctions inhibit asymmetric division in the Drosophila epithelium. Nature. 2001;409:522–525. doi: 10.1038/35054077. [DOI] [PubMed] [Google Scholar]
- 25.Mata J, Curado S, Ephrussi A, Rorth P. Tribbles coordinates mitosis and morphogenesis in Drosophila by regulating string/CDC25 proteolysis. Cell. 2000;101:511–522. doi: 10.1016/s0092-8674(00)80861-2. [DOI] [PubMed] [Google Scholar]
- 26.McCartney BM, Dierick HA, Kirkpatrick C, Moline MM, Baas A, Peifer M, Bejsovec A. Drosophila APC2 is a cytoskeletally-associated protein that regulates wingless signaling in the embryonic epidermis. J Cell Biol. 1999;146:1303–1318. doi: 10.1083/jcb.146.6.1303. [DOI] [PMC free article] [PubMed] [Google Scholar]
- 27.McCartney BM, McEwen DG, Grevengoed E, Maddox P, Bejsovec A, Peifer M. Drosophila APC2 and Armadillo participate in tethering mitotic spindles to cortical actin. Nat Cell Biol. 2001;10:933–938. doi: 10.1038/ncb1001-933. [DOI] [PubMed] [Google Scholar]
- 28.Nassif C, Noveen A, Hartenstein V. Embryonic development of the Drosophila brain. I. The pattern of pioneer tracts. J Comp Neurol. 1998;402:10–31. [PubMed] [Google Scholar]
- 29.Nassif C, Noveen A, Hartenstein V. Early development of the Drosophila brain. III. The pattern of neuropile founder tracts during the larval period. J Comp Neurol. 2003;455:417–434. doi: 10.1002/cne.10482. [DOI] [PubMed] [Google Scholar]
- 30.Oda H, Tsukita S. Nonchordate classic cadherins have a structurally and functionally unique domain that is absent from chordate classic cadherins. Dev Biol. 1999;216:406–422. doi: 10.1006/dbio.1999.9494. [DOI] [PubMed] [Google Scholar]
- 31.Park Y, Caldwell MC, Datta S. Mutation of the central nervous system neuroblast proliferation repressor ana leads to defects in larval olfactory behavior. J Neurobiol. 1997;33:199–211. [PubMed] [Google Scholar]
- 32.Parnavelas JG, Nadarajah B. Radial glial cells. Are they really glia? Neuron. 2001;31:881–884. doi: 10.1016/s0896-6273(01)00437-8. [DOI] [PubMed] [Google Scholar]
- 33.Poeck B, Fischer S, Gunning D, Zipursky SL, Salecker I. Glial cells mediate target layer selection of retinal axons in the developing visual system of Drosophila. Neuron. 2001;29:99–113. doi: 10.1016/s0896-6273(01)00183-0. [DOI] [PubMed] [Google Scholar]
- 34.Radojcic T, Pentreath VW. Invertebrate glia. Prog Neurobiol. 1979;12:115–179. doi: 10.1016/0301-0082(79)90002-9. [DOI] [PubMed] [Google Scholar]
- 35.Rakic P. Mode of cell migration to the superficial layers of fetal monkey neocortex. J Comp Neurol. 1972;145:61–84. doi: 10.1002/cne.901450105. [DOI] [PubMed] [Google Scholar]
- 36.Redies C. Cadherins in the central nervous system. Prog Neurobiol. 2000;61:611–648. doi: 10.1016/s0301-0082(99)00070-2. [DOI] [PubMed] [Google Scholar]
- 37.Seher TC, Leptin M. Tribbles, a cell-cycle brake that coordinates proliferation and morphogenesis during Drosophila gastrulation. Curr Biol. 2000;10:623–629. doi: 10.1016/s0960-9822(00)00502-9. [DOI] [PubMed] [Google Scholar]
- 38.Steinberg MS, Takeichi M. Experimental specification of cell sorting, tissue spreading, and specific spatial patterning by quantitative differences in cadherin expression. Proc Natl Acad Sci USA. 1994;91:206–209. doi: 10.1073/pnas.91.1.206. [DOI] [PMC free article] [PubMed] [Google Scholar]
- 39.Strausfeld N. Atlas of an insect brain. Springer; Berlin: 1976. [Google Scholar]
- 40.Sun B, Wang W, Salvaterra PM. Functional analysis and tissue-specific expression of Drosophila Na+, K+-ATPase subunits. J Neurochem. 1998;71:142–151. doi: 10.1046/j.1471-4159.1998.71010142.x. [DOI] [PubMed] [Google Scholar]
- 41.Tepass U, Gruszynski-DeFeo E, Haag TA, Omatyar L, Torok T, Hartenstein V. shotgun encodes Drosophila E-cadherin and is preferentially required during cell rearrangement in the neurectoderm and other morphogenetically active epithelia. Genes Dev. 1996;10:672–685. doi: 10.1101/gad.10.6.672. [DOI] [PubMed] [Google Scholar]
- 42.Tepass U, Truong K, Godt D, Ikura M, Peifer M. Cadherins in embryonic and neural morphogenesis. Nat Rev Mol Cell Biol. 2000;1:91–100. doi: 10.1038/35040042. [DOI] [PubMed] [Google Scholar]
- 43.Townes PL, Holtfreter J. Directed movement and selective adhesion of embryonic amphibian cells. J Exp Zool. 1955;128:53–120. doi: 10.1002/jez.a.114. [DOI] [PubMed] [Google Scholar]
- 44.Truman JW. Metamorphosis of the central nervous system of Drosophila. J Neurobiol. 1990;21:1072–1084. doi: 10.1002/neu.480210711. [DOI] [PubMed] [Google Scholar]
- 45.Truman JW, Bate M. Spatial and temporal patterns of neurogenesis in the central nervous system of Drosophila melanogaster. Dev Biol. 1988;125:145–157. doi: 10.1016/0012-1606(88)90067-x. [DOI] [PubMed] [Google Scholar]
- 46.Truman JW, Talbot WS, Fahrbach SE, Hogness DS. Ecdysone receptor expression in the CNS correlates with stage-specific responses to ecdysteroids during Drosophila and Manduca development. Development. 1994;120:219–234. doi: 10.1242/dev.120.1.219. [DOI] [PubMed] [Google Scholar]
- 47.Uemura T, Oda H, Kraut R, Hayashi S, Kotaoka Y, Takeichi M. Zygotic Drosophila E-cadherin expression is required for processes of dynamic epithelial cell rearrangement in the Drosophila embryo. Genes Dev. 1996;10:659–671. doi: 10.1101/gad.10.6.659. [DOI] [PubMed] [Google Scholar]
- 48.Walsh C, Cepko CL. Clonally related cortical cells show several migration patterns. Science. 1988;241:1342–1345. doi: 10.1126/science.3137660. [DOI] [PubMed] [Google Scholar]
- 49.Younossi-Hartenstein A, Salvaterra P, Hartenstein V. Early development of the Drosophila brain. IV. Larval neuropile compartments defined by glial septa. J Comp Neurol. 2003;455:434–450. doi: 10.1002/cne.10483. [DOI] [PubMed] [Google Scholar]