

Abstract
We examined mechanisms contributing to stimulus-evoked changes in NAD(P)H fluorescence as a marker of neuronal activation in area CA1 of murine hippocampal slices. Three types of stimuli (electrical, glutamate iontophoresis, bath-applied kainate) produced biphasic fluorescence changes composed of an initial transient decrease (“initial component,” 1–3%), followed by a longer-lasting transient increase (“overshoot,” 3–8%). These responses were matched by inverted biphasic flavin adenine dinucleotide (FAD) fluorescence transients, suggesting that these transients reflect mitochondrial function rather than optical artifacts. Both components of NAD(P)H transients were abolished by ionotropic glutamate receptor block, implicating postsynaptic neuronal activation as the primary event involved in generating the signals, and not presynaptic activity or reuptake of synaptically released glutamate. Spatial analysis of the evoked signals indicated that the peak of each component could arise in different locations in the slice, suggesting that there is not always obligatory coupling between the two components. The initial NAD(P)H response showed a strong temporal correspondence to intracellular Ca+ increases and mitochondrial depolarization. However, despite the fact that removal of extracellular Ca2+ abolished neuronal cytosolic Ca2+ transients to exogenous glutamate or kainate, this procedure did not reduce slice NAD(P)H responses evoked by either of these agonists, implying that mechanisms other than neuronal mitochondrial Ca2+ loading underlie slice NAD(P)H transients. These data show that, in contrast to previous proposals, slice NAD(P)H transients in mature slices do not reflect neuronal Ca2+ dynamics and demonstrate that these signals are sensitive indicators of both the spatial and temporal characteristics of postsynaptic neuronal activation in these preparations.
Keywords: NADH, optical imaging, mitochondria, oxidative metabolism, hippocampus, calcium, glutamate, postsynaptic excitation, intrinsic signals, Na+/K+ ATPase, ouabain
Introduction
Interest in noninvasive indicators of neuronal electrical activity has been ongoing for several decades and includes studies of birefringence, light scattering (Hill and Keynes, 1949; Cohen et al., 1968), and plasmalemma-associated dyes (Cohen et al., 1974; Salzberg, 1989; Shoham et al., 1999). Starting with the “slow” measurements of Blasdel and Salama (1986) reporting what proved mostly to be intrinsic absorbance changes of hemoglobin in CNS tissue with intact circulation, measurements of integrated neuronal activity have come increasingly into the forefront of noninvasive optical measurements (Grinvald et al., 1986; Frostig et al., 1990; Luo and Katz, 2001). Other intrinsic monitoring loci, possibly more sensitive and not dependent on the presence of hemoglobin, are also available and at present are underexploited. These include monitoring the fluorescence of key components of oxidative phosphorylation, nicotinamide adenine dinucleotide (NADH).
NADH is the predominant component of tissue autofluorescence under UV excitation, but after donation of electrons to the electron transport chain, the oxidized molecule (NAD+) is nonfluorescent. Thus changes in NADH fluorescence long have been used as a measure of oxidative phosphorylation changes (Chance et al., 1962; Connor et al., 1976; Mayevsky et al., 1988). Signals are attributable primarily to mitochondrial NADH dynamics but can be referred to as NAD(P)H transients, because the fluorescence profile of NADPH is indistinguishable from that of NADH (Schuchmann et al., 2001). The usefulness of NAD(P)H fluorescence measurements for monitoring intense and coordinated CNS activation has been demonstrated during seizures (Jöbsis, 1971; O'Connor et al., 1972) or putative spreading depression produced by cerebral ischemia (Mayevsky et al., 1998; Rex et al., 1999; Hashimoto et al., 2000; Strong et al., 2000). In brain slice preparations the seizure-like bursting activity in hippocampus (Schuchmann et al., 1999; Kovacs et al., 2001) or burst discharges in respiratory neurons (Mironov and Richter, 2001) are accompanied by biphasic NAD(P)H changes in which an initial transient NAD(P)H decrease is followed by a longer-lasting NAD(P)H increase. It has been suggested that these signals in slices are a consequence of stimulus-induced Ca2+ influx, Ca2+-dependent production of reactive oxygen species (ROS) production, and stimulation of citric acid cycle enzymes (Kovacs et al., 2001; Schuchmann et al., 2001). Whether such mechanisms would produce resolvable signals after less intense stimuli is not known, and the requirement for Ca2+influx in these signals has not been examined previously in hippocampal slice preparations.
In the present study we have investigated NAD(P)H fluorescence transients in murine hippocampal slices. Robust signals were observed even with very modest presynaptic inputs, and we conclude that, contrary to previous assertions, there is no necessity for an increase in intracellular Ca2+ to generate the biphasic transients. A CCD imaging-based approach was used in this study, which permitted investigation of the spread of signals and also the spatial relationship between components of biphasic NAD(P)H signals. From these data and pharmacological analysis of evoked NAD(P)H transients we conclude that these signals can provide a sensitive Ca2+-independent monitor of spatial as well as temporal aspects of physiological postsynaptic neuronal activation in slice.
Materials and Methods
Slice preparation. Male mice (C57BL/10J or C57BL/6J) were obtained from Jackson Laboratories (Bar Harbor, ME) at 4–6 weeks of age and were housed in standard conditions (12 hr light/dark cycle) before death. Numbers in the study refer to numbers of slices, with a maximum of two slices obtained from an individual experimental animal used for each protocol. Mice were anesthetized deeply with a mixture of ketamine and xylazine (85 and 15 mg/ml, respectively; 150 ml, s.c.) and decapitated. Brains were removed and placed in ice-cold cutting solution (see below for composition). Coronal sections (350 μm) were cut with a Vibratome (Technical Products International, St. Louis, MO), and slices were transferred into room temperature ACSF (see below). Cutting and recording solutions were both 300–305 mOsm/l. After being warmed to 34°C and held for 1 hr, ACSF was changed again, and the slices were held at room temperature until used for recording. Individual slices were transferred to the recording chamber and were perfused with warmed (34°C), oxygenated ACSF at 2 ml/min.
NAD(P)H and flavin adenine dinucleotide fluorescence imaging.NADH has broad excitation and emission spectra with peaks at ∼350 and 460 nm, respectively. Excitation (360 nm) was delivered via a fiber optic/monochromator system (Polychrome IV; Till Photonics, Gräfelfing, Germany) reflected onto the slice surface via a dichroic mirror (DMLP 400 nm, Chroma Technology, Brattleboro, VT). Fluorescence emission was collected by using a cooled interline transfer CCD camera (IMAGO, Till Photonics). All experiments used a 410 nm long-pass glass filter between the dichroic mirror and camera to maximize light capture. Pilot experiments that used a 450 ± 15 nm interference filter showed that there was insignificant distortion from longer wavelength emitters. Flavin adenine dinucleotide (FAD) is the oxidized form of another electron carrier, FADH2, generated by tricarboxylic acid (TCA) cycle activity and oxidized in the electron transport chain. Unlike NADH, FADH2 is not fluorescent, but FAD displays green fluorescence after excitation in the blue range. Consequently, FAD fluorescence signals should be opposite in sign to NAD(P)H changes if these signals reflect mitochondrial metabolism. Changes in the FAD fluorescence were monitored by using excitation at 450 nm, and emission was detected by using a 535 (50 BW) interference filter. Photobleaching was not significant for NAD(P)H measurements. For FAD measurements the photobleaching was noticeable, and data were corrected by fitting a first-order regression to prestimulus periods and subtracting extrapolated values from raw data. Absorbance of 360 nm excitation by solutions of carbonyl cyanide 4-(trifluoromethoxy)phenyl hydrazone (FCCP) was concentration-dependent and appreciable at 5 μm, producing an immediate 3–5% decrease in slice fluorescence when excited at this wavelength. This slightly depressed baseline was used in computing subsequent NAD(P)H fluorescence changes. FCCP absorbance was negligible at 450 nm.
Imaging was performed after focusing onto the surface of slices, using either 10× or 40× water immersion objectives (numerical apertures 0.3 and 0.8, respectively; Olympus), and collected after 2 × 2 binning of the 640 × 480 line image. After binning, individual pixels corresponded to areas of 2.6 and 0.64 μm2 for 10× and 40× objectives, respectively. For analysis the image data were filtered by using 3 × 3 pixel averaging and presented as the change in fluorescence intensity/prestimulus fluorescence intensity (ΔF/Fo). Mean camera background was 421 ± 23.3 (mean ± SD) arbitrary fluorescence units (AFU)/sec. With the use of a 10× objective the slice fluorescence attributable to NAD(P)H, measured in stratum pyramidale, was ∼700 AFU/sec. Integration times for data collection were between 100 and 150 msec. For display the selected images were converted to “tif” format and exported to NIH Image (v1.62). Then they were put through the median filter of the program, mapped to color, and rendered as surface plots. Top and bottom colors were set to minimum and maximum signal values for each experimental protocol. Consequently, the color for the prestimulus maps “floats” to an extent, depending on these minimum and maximum values.
Ca2+ imaging. Ester loading of fura-2 into CA1 neurons followed the procedure described previously (Regehr and Tank, 1991; Connor et al., 1999). A large-bore micropipette (tip ∼15 μm) filled with fura-2 AM/DMSO/Pluronic (10 μm, 0.3%, 0.3%, respectively) was positioned below the slice surface in stratum oriens, and pressure pulses (1 Hz, 0.5 duty cycle) were applied for 15–25 min. CA1 neurons located under the slice surface, with basal dendrites projecting to the loading site, steadily accumulated fura-2 that diffused to cell bodies and apical dendrites. Measurements were made in the cell body layer distant from the loading site. Measurements of Ca2+ are reported as fluorescence ratios (350/380 nm excitation) because of uncontrollable variables introduced by the loading method (Regehr and Tank, 1991;Connor et al., 1999). This bulk loading approach has the advantage that Ca2+ changes are reported from a population of healthy cells located below the slice surface, a situation analogous to that used for NAD(P)H fluorescence measurements. Image pairs (λ > 510 nm) were collected for excitations at 350 and 380 nm, background-corrected, and then ratioed. Ca2+ imaging was not contaminated by NAD(P)H fluorescence because of the relative brightness of the fura-2 and the 510 nm long-pass filter, which removes most of the NAD(P)H signal.
Rhodamine 123 imaging. Slices were incubated in 26 μm rhodamine 123 (Rh123) in ACSF, continuously bubbled with 95% O2/5% CO2 for 30 min at room temperature (Bindokas et al., 1998), and then transferred to the recording chamber where they were superfused with ACSF and warmed to 34°C. Excitation was delivered at 510 nm, and emission was monitored through a 610 nm long-pass filter. In one set of experiments simultaneous Rh123 and NAD(P)H fluorescence was measured in alternate frames of a sequence by using a single filter set (Chroma Technology) composed of a dual transmission band dichroic (460 and >590 nm, number 51002) and a dual emission filter (455 and 620 nm, number 51003). Excitation wavelengths were switched by the Polychrome IV. This configuration yielded significantly smaller signals from each fluorophore, but the ability to make near simultaneous measurements was an effective tradeoff.
Rh123 gives an indirect measure of changes in mitochondrial inner membrane potential, Ψm. For normal Ψm and the loading procedure outlined above, Rh123 is concentrated sufficiently in the mitochondria to self-quench. A reduction in Ψm allows leakage into the cytosol where the molecule, present in much lower concentration, fluoresces. In these preparations, over a period of 10 min, the proton ionophore FCCP (1 μm) produced a substantial increase in Rh123 fluorescence (peak, 80.5 ± 8.2%; n = 6), which is attributable to loss of mitochondrial inner membrane potential (see Bindokas et al., 1998). A careful comparison of the Rh123 signal with other indicators of Ψm in the hippocampal slice preparation and an emphasis on the usefulness of the Rh123 signal have been published (Bindokas et al., 1998).
Stimuli. Bipolar stimulating electrodes were used for stimulation of Schaffer collateral fibers. Platinum tips (50 or 25 μm in diameter) were placed in s. radiatum, ∼150 μm from the pyramidal cell layer. Stimuli were delivered via a Master 8 controller, DC supply, and constant current isolation unit (A.M.P.I., Jerusalem, Israel). In those cases in which trains of stimuli were used, the stimulus frequency was 50 Hz. Between successive tetani 5 min intervals were maintained. For most studies the fluorescence excitation/imaging at 3 Hz was begun 4 sec before onset of the stimulus and continued for a total of 25 sec. So that the kinetics of initial NAD(P)H oxidation events (transient negative deflections) could be assessed, the acquisition rate was increased to 10–18 Hz. In experiments to monitor the time course of recovery of NAD(P)H fluorescence changes, the acquisition rate was decreased (0.25 Hz), and longer sequences (up to 90 sec) were recorded.
To investigate transient responses to brief kainate (KA) exposures, we introduced a bolus of KA (25 μl, 5 mm stock) into the perfusion line (continuous 2 ml/min). The maximum peak concentration in the recording chamber was estimated at 100 μm with this procedure.
For studies with local application of glutamate, glass microelectrodes were filled with 1 m Na-glutamate (in H2O) and placed above the surface of the CA1 pyramidal cell layer. When filled with 1 m KCl, these electrodes have a resistance of ∼5 MΩ, and no evidence of glutamate leak (e.g., changes in baseline NAD(P)H fluorescence) was observed. Glutamate was ejected by passing current pulses (20 μA, 2 sec) at 5 min intervals. Comparisons were made with electrodes filled with 1m NaCl, and under these conditions identical stimuli produced no demonstrable NAD(P)H fluorescence responses.
Drugs and solutions. ACSF contained (in mm): 126 NaCl, 3 KCl, 1.25 NaH2PO4, 1 MgSO4, 26 NaHCO3, 2 CaCl2, and 10 glucose equilibrated with 95%O2/5%CO2. Cutting solution contained (in mm): 3 KCl, 1.25 NaH2PO4, 6 MgSO4, 26 NaHCO3, 0.2 CaCl2, 10 glucose, 220 sucrose, and 0.43 ketamine. For zero Ca2+ ACSF the CaCl2 was replaced by MgSO4, and 0.5 mm BAPTA (Na+ salt) was added. KA was obtained from A. G. Scientific (San Diego, CA). FCCP and CNQX were from Calbiochem, San Diego, CA). All other drugs and salts were obtained from Sigma (St. Louis, MO) and were diluted in the ACSF perfusate. FCCP was prepared as a 20 mm stock in ethanol. Data are presented as mean ± SEM; significant differences between group data were evaluated by using paired or unpaired Student's t tests, with p < 0.05 considered significant.
Results
Evoked NAD(P)H transients in murine hippocampal slices
Figure 1 illustrates basic properties of the biphasic fluorescence transients evoked by a single tetanus to Schaffer collateral inputs. The 360 nm light pulses (40–100 msec) were used for excitation, and emission (>410 nm) was collected from the CA1 pyramidal cell region. The GABAAreceptor antagonist bicuculline (30 μm; 10 min exposure) was present in the ACSF to augment the amplitude of responses (see below). The stimulus (25 pulses, 70 μsec, 50 Hz) was applied at the arrows and was accompanied by an immediate decrease in fluorescence. This transient decrease, hereafter referred to as the “initial component,” was followed by a more sustained fluorescence increase, “overshoot” (Fig. 1A). The characteristics of the initial component are shown in more detail in Figure1B, where images were acquired at 18 Hz in a different slice and a significant decrease in fluorescence could be detected in the second frame (i.e., within 100 msec) after the stimulus onset. These biphasic responses were very reproducible when tetani were spaced at sufficient intervals (> 5 min) to allow for full recovery of the overshoot between trials. Under these recording conditions the signal-to-noise ratio was sufficiently high that all traces in Figure 1are generated from single trials. Furthermore, the response to a single shock stimulus was sufficient to generate a detectable signal. Figure1C illustrates a representative of six experiments in which the number of stimuli in a volley was decreased from 25 to 1. A progressive decrease in both components of the response can be seen, but both components of responses were still evident with the single shock. The sensitivity of detection could be increased further for very weak presynaptic stimuli by averaging responses to multiple trials generated at 1–3 min intervals (data not shown). However, single trials proved suitable for all subsequent experiments in this study.
Fig. 1.
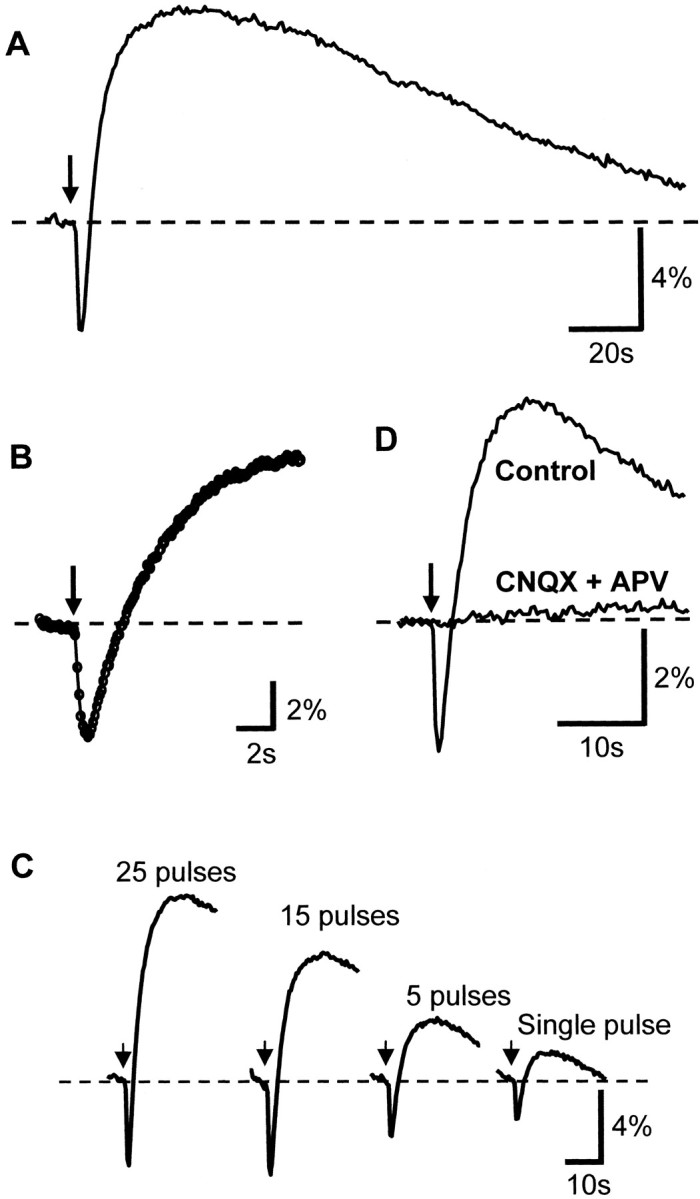
Temporal characteristics of NAD(P)H fluorescence changes evoked by electrical stimuli applied to s. radiatum. In all panels the stimuli were applied at the arrow; NAD(P)H fluorescence was monitored in s. pyramidale and expressed as ΔF/Fo. Bicuculline (30 μm) was present in all cases; data shown are from single trials. A, Response to single tetanus (25 pulses, 50 Hz) illustrating the characteristic biphasic NAD(P)H response, comprising an initial NAD(P)H fluorescence decrease (oxidation) followed by a more sustained NAD(P)H fluorescence increase (reduction). Acquisition rate, 3 Hz. B, The onset of the response is shown in more detail in a trial in which the acquisition rate was increased to 18 Hz (stimulus, 25 pulses, 50 Hz). The onset of the response was detected within 100 msec of stimulus onset. C, NAD(P)H transients could be resolved in single trials after more modest presynaptic stimuli. Panels illustrate successive trials (3 min intervals) in which the number of pulses in the stimulus train was decreased from 25 to a single shock. D, Both components of NAD(P)H responses were blocked by a combination of ionotropic glutamate receptor antagonists. Representative trials illustrate responses in normal ACSF and after 10 min exposure to 50 μm CNQX and 100 μm APV.
Both components of the fluorescence responses evoked by electrical stimuli were abolished by exposure to tetrodotoxin (1 μm;n = 6) or by a combination of ionotropic glutamate receptor antagonists. Figure 1D shows representative traces from a single slice before and after 10 min of perfusion with a combination of CNQX (50 μm) and APV (100 μm). From four such experiments the amplitude of the initial component was decreased from −3.50 ± 0.64% to an isochronal value of −0.28 ± 0.07% (p < 0.02), and the mean overshoot of 4.84 ± 1.63% was abolished (−0.22 ± 0.20%). The effective block of evoked transients with this antagonist combination suggests that the signals depend primarily on postsynaptic neuronal activation rather than on presynaptic excitation and/or neuron/glial glutamate uptake. The wavelengths used to excite and measure fluorescence were those commonly used in NAD(P)H measurements, and the biphasic nature of the signal has been shown in photo multiplier measurements from isolated neurons (Duchen, 1992) and rat hippocampal slices (Schuchmann et al., 1999; Kovacs et al., 2001). Consequently, the more generic terminology, “fluorescence change,” will be replaced with “NAD(P)H transients.” A more detailed characterization of the intracellular events driving these changes is deferred until after the next section.
To establish where evoked NAD(P)H transients lie with respect to maximally reduced and maximally oxidized NAD(P)H signals, we examined responses to rotenone and FCCP. Rotenone (5 μm) produced a progressive, very large fluorescence increase (30.7 ± 3.9% at 15 min, n = 8; 70.2 ± 9.8% at 40 min,n = 3) as would be expected as a consequence of block of complex I and decrease in NADH consumption. FCCP produced a transient fluorescence increase (15.1 ± 5.4% for 1 μm, n = 4; 28.6 ± 1.6% for 5 μm,n = 8) that peaked 6–8 min after the onset of FCCP exposure. After the peak increase NAD(P)H levels then began a very large progressive decrease (47.7 ± 1.2%; n = 5) after 40 min of 5 μm FCCP exposure. Thus the extremes observed with rotenone and FCCP are substantially larger than the evoked signals discussed above, implying that the amplitudes of signals evoked by electrical stimulation were not limited by maximal changes to reduction and oxidation of the NAD(P)H/NAD(P) pool. The mechanism(s) underlying the transient NAD(P)H increase, seen early during FCCP exposure in these slice preparations, currently is(are) unknown. However, to ensure that fluorescence signals observed with rotenone and FCCP were indeed a consequence of mitochondrial function perturbations, we compared NAD(P)H fluorescence signals with fluorescence signals attributable to FAD (see Materials and Methods). In these separate series of experiments near-simultaneous NAD(P)H/FAD measurements were made by alternating appropriate filter sets during drug exposure. As would be expected, NAD(P)H increases produced by rotenone over 15 min (29.9 ± 2.9%) were mirrored by decreases in FAD fluorescence (25.7 ± 2.5%; n = 5). Likewise, initial transient NAD(P)H increases produced by FCCP (5 μm) were mirrored by FAD decreases (29.3 ± 2.5% NAD(P)H increase vs 27.1 ± 2.0% FAD decrease; n = 3 each).
Spatially resolved NAD(P)H signals
The NAD(P)H signal tracked electrical activity with a high degree of spatial resolution. This is illustrated first for Schaffer collateral stimulation in Figure 2, which shows maps of optical signals at the peak of the initial component (500 msec after stimulus onset) and the overshoot (10 sec after stimulus). Figure 2A shows the peak optical signals elicited by a stimulus of five 1 mA pulses delivered at 50 Hz. The position of the stimulus electrode in s. radiatum is indicated on the bright-field image of the slice (Fig. 2E). The optical changes were limited to an ∼150 μm2 area near the stimulus electrode, centered in the s. radiatum. This corresponds to the area that should receive the highest density of inputs from the activated presynaptic fibers. In Figure 1B the stimulus intensity was increased to 2 mA. Peak magnitudes of both the initial component and the overshoot were increased, as was the spatial spread of the signal. Near the electrode significant changes became detectable in s. pyramidale and s. oriens. The slice then was disinhibited by the addition of bicuculline (30 μm). This treatment resulted in higher efficiency of excitatory stimuli because the time course of the GABAA IPSP somewhat overlaps the EPSP and persists long enough to summate and shunt subsequent EPSPs evoked by a high-frequency stimulus train (Grinvald et al., 1982). Figure2C illustrates the peak optical signals evoked by the 2 mA stimulus train after a 2 min exposure to bicuculline. Visualized with the NAD(P)H signal, the excitation was seen to spread further from the stimulus electrode along the beam of stimulated collateral fibers. Additionally, there were now even larger optical signals detected in s. pyramidale and s. oriens. These observations are consistent with supra-threshold excitation near the electrode and more efficient excitation by the lower density of activated fibers more distant from the electrode. After a longer exposure to bicuculline (7 min), which should allow for more effective infiltration of the antagonist, the slices tended to become even more excitable, a condition illustrated in Figure 2D, in which the 2 mA stimulus train now triggered large, biphasic optical signals in the entire CA1 field within view. GABAA receptor antagonism always produced an increase in signal magnitude as well as the activated area. Figure 3 shows the mean effects of both increasing stimulus strength and bicuculline addition on a group of six slices from six animals. All stimuli in normal ACSF evoked initial components and overshoots of similar magnitude, and both components increased monotonically with increasing stimulus intensity (Fig.3A,B, open circles; C, open bars). In bicuculline both components were larger for a given stimulus strength. The overshoot was disproportionately larger and showed a steep dependence on stimulus amplitude, being nearly maximal at 1 mA when GABAA receptors were blocked.
Fig. 2.
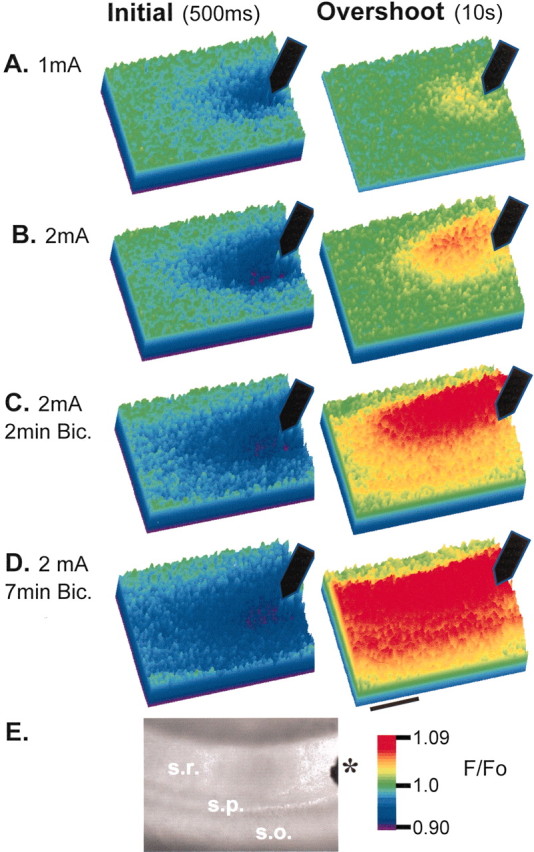
Spatial characteristics of NAD(P)H transients evoked by stimulation in s. radiatum. Color panels A–Dillustrate NAD(P)H fluorescence changes at times corresponding to the peak initial component and overshoot (500 msec and 10 sec after stimulus onset, respectively). Scale bar, 200 μm. Filled arrows indicate the position of the stimulating electrode.A, The peak optical signals elicited by a stimulus of five 1 mA pulses at 50 Hz. The optical changes were limited to an ∼150 μm area near the stimulus electrode, centered in s. radiatum. Increasing the stimulus intensity (B; 2 mA) increased the magnitudes of both the initial component and the overshoot and increased the spatial spread of the signal. Near the electrode significant changes became detectable in s. pyramidal and s. oriens.C, Two minute bicuculline exposure. The plume of excitation can be seen to spread further from the stimulus electrode along s. radiatum. Additionally, there are now even larger optical signals detected in s. pyramidal and s. oriens. D, Seven minute bicuculline exposure. The 2 mA stimulus train now triggers large biphasic optical signals in the entire CA1 field within view.E, Bright-field image of the slice showing the position of the stimulating electrode (asterisk) together with the locations of s. oriens (so), s. pyramidale (sp), and s. radiatum (sr).
Fig. 3.
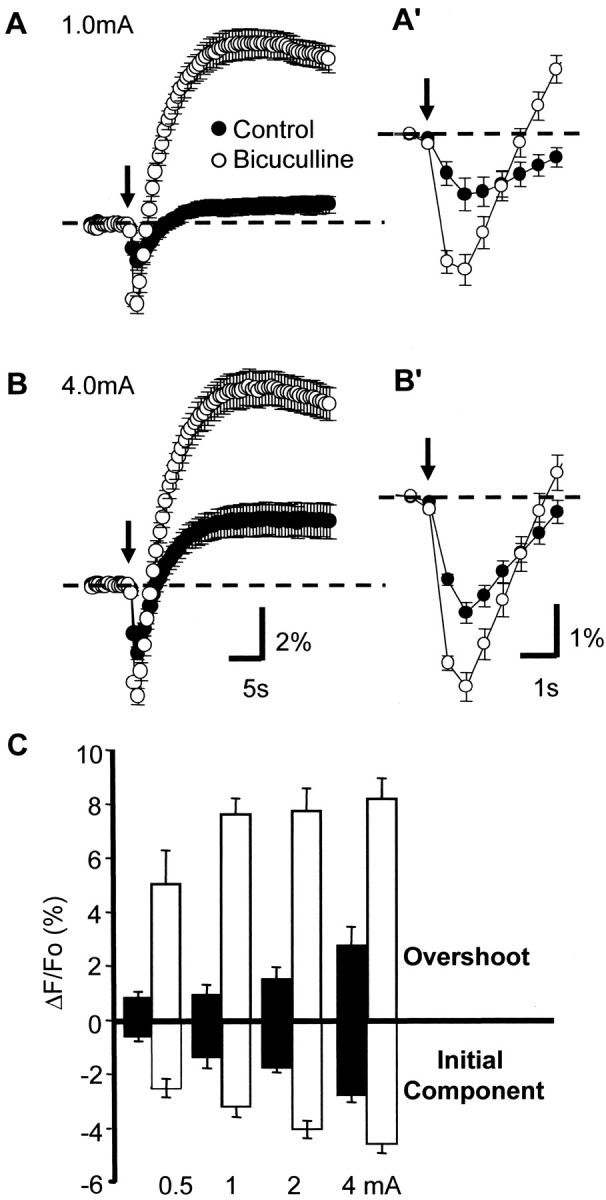
Increase in NAD(P)H responses by disinhibition.A, B, Mean biphasic responses to tetani applied at two different stimulus intensities (1 and 4 mA). Control responses are represented by filled circles, and responses in the same preparations after 10 min of bicuculline exposure (30 mm) are in open circles. Arrows indicate stimulus train (25 pulses, 50 Hz).A′, B′, Initial components of responses shown inA and B at an expanded time base.C, Summary of effects on initial and overshoot responses for a range of stimulus intensities. Filled bars represent control responses, and open bars represent bicuculline. Note the large effect on overshoot responses as compared with the more modest increase of initial components. For all panels the data are the mean ± SEM; n = 6.
Figure 3, A′ and B′, show responses to 1 and 4 mA stimuli at an expanded time scale so that the rate of rise of both components of evoked NAD(P)H transients can be observed in more detail. Bicuculline exposure significantly increased the peak rate of rise of both components of evoked NAD(P)H transients (i.e., 2.20 vs 0.40%/sec for 1 mA and 2.34 vs 1.1%/sec for 4 mA; n = 6). This large difference raised the possibility that the more rapid development of a large overshoot response could mask the full extent of the initial component. The next series of experiments, in which the stimulating electrode was placed in the alveus, lends support to this suggestion.
Alveus stimulation also produced a spatially restricted NAD(P)H response but with different dynamic characteristics when compared with s. radiatum stimulation. Figure 4illustrates the time course of the optical signal after a single stimulus train of 10 pulses (1 mA, 50 Hz in the presence of bicuculline). The initial component was largest in s. oriens, centered above the stimulus electrode. In s. pyramidale and s. radiatum the initial component was smaller and showed a wider lateral extent. A wide divergence in the two components of the NAD(P)H transient developed, beginning 1–2 sec after the stimulus. The negative-going initial component remained in the same localized area in s. oriens, whereas a strong overshoot developed in s. pyramidale and s. radiatum. This overshoot clearly covered the lateral extent of the field. Thus unlike the situation with s. radiatum stimulation (Fig. 2), stimulation in alveus resulted in clear spatial mismatch between the two components of NAD(P)H transients (Fig. 4). These data (Fig. 4B) suggest that the initial NAD(P)H decrease in fact is longer-lasting in the alveus, because it is not masked by the emergence of a large overshoot response in this location.
Fig. 4.
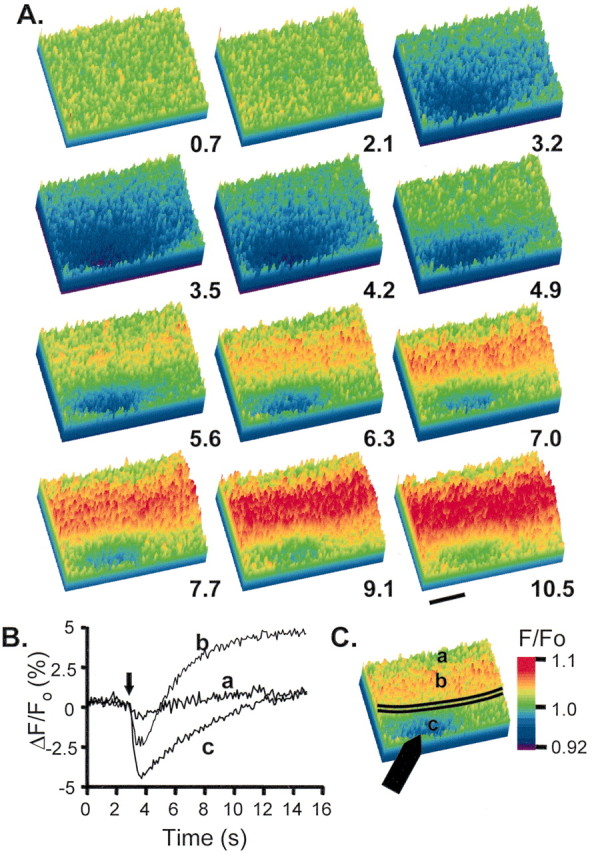
Alveus stimulation. A bipolar stimulating electrode was used to deliver a single tetanus (10 pulses, 50 Hz); NAD(P)H fluorescence changes were imaged at 10 Hz. A, Selected frames at 700 msec intervals illustrating a clear spatial difference between the peak initial component and overshoot. Times are indicated in seconds; stimulus onset occurs at 3 sec. The initial component was largest in s. oriens, centered above the stimulus electrode; in s. pyramidale and s. radiatum it was smaller and showed a wider lateral extent. A wide spatial divergence in the responses of the two components developed, beginning 1–2 sec after the stimulus. The initial component remained in the same localized area in s. oriens while a strong overshoot developed in s. pyramidale and s radiatum. This overshoot clearly covers the lateral extent of the field. Scale bar, 200 μm. B, Data from the same trial extracted from the three locations indicated in C. Arrow indicates onset of stimulus train. There is no significant change in fluorescence at location a, almost no overshoot at location c, and a biphasic change in location b. C, Single frame illustrates the location of the pyramidal cell layer (black lines) and stimulating electrode (filled arrow).
Responses to alveus stimulation were blocked in their entirety by CNQX/APV or by TTX (n = 4), implying that, like responses to Schaffer collateral stimulation, they are a direct consequence of postsynaptic activation of ionotropic glutamate receptors. The broad lateral spread is consistent with orthodromic and antidromic activation of glutamatergic fibers in the s. radiatum beam by branches that course from s. oriens (Swanson et al., 1989). The glutamate blocker effect also implies that activated cholinergic and other pathways known to course through the alveus (Swanson et al., 1989) do not give rise directly to the optical signals. This is not to exclude secondary, cooperative effects of these pathways, such as the increased dendritic excitability after activation of cholinergic inputs (Müller and Connor, 1991). We do not have a hypothesis regarding why s. oriens shows such a small relative overshoot under this stimulation condition; however, we found that glutamate iontophoresis onto the pyramidal cell layer also resulted in the largest initial NAD(P)H decreases in the s. oriens, with large overshoots occurring in s. radiatum (see Fig. 6 below). This suggests that there are regional differences that result in a larger overshoot in different locations regardless of stimulus modality. The finding that the compound NAD(P)H responses do not reflect an obligatory coupling between the two components points to a significant advantage of these imaging measurements (when compared with PMT-based approaches), because if data were integrated over a large area, the full extent of each component could be underestimated significantly in some cases.
Fig. 6.
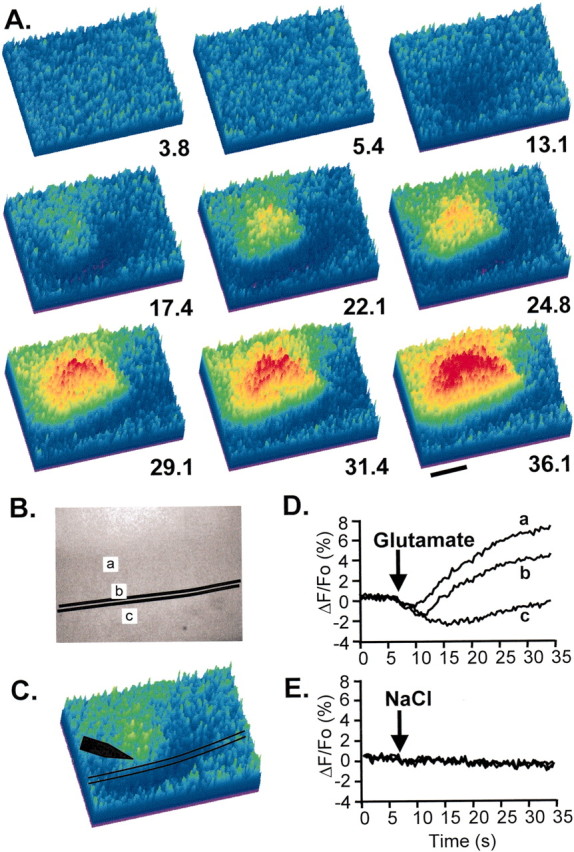
NAD(P)H responses evoked by iontophoretic application of glutamate (20 μA, 2 sec). A, Pseudocolor images show changes in NAD(P)H fluorescence. Images were acquired at 3 Hz, and selected frames are shown at the times indicated in seconds. The stimulus was applied at t = 6.7 sec. Note the different spatial distributions of the NAD(P)H decrease and overshoot. Scale bar, 200 μm. B, Baseline NAD(P)H fluorescence in the same field, demonstrating that resting levels are relatively uniform over the region of interest. Pyramidal cell layer is indicated by black lines. C, Single frame indicating the position of the glutamate microelectrode (black arrow).D, Data extracted from the three regions (a–c), indicated in B. E, Control for iontophoresis current demonstrating that replacement of glutamate with NaCl produces no discernible NAD(P)H transient with identical stimulus current.
Intracellular pathways driving NAD(P)H transients
Figure 5, A andB, compares NAD(P)H fluorescence signals with fluorescence signals attributable to FAD. In these studies brief stimulus trains (2 mA, 10 pulses) were applied to s. radiatum at 5 min intervals. Filter sets were changed between each stimulus so that NAD(P)H and FAD transients were compared in each of five slices. As would be expected if these signals are indeed reflective of demands on oxidative phosphorylation and TCA cycle activity, the FAD signal is inverted when compared with the NAD(P)H transient (Fig. 5A,B). In all other respects the FAD signal is very similar to the NAD(P)H signal, with the initial transient components of both signals peaking at the same time and both being followed by more long-lasting overshoot components. This inverse but temporally matched relationship is also important in establishing that light-scattering changes play little or no part in the measurements. If signals were attributable to light-scattering changes (Salzberg et al., 1985; MacVicar and Hochman, 1991), transients with identical (not inverted) polarity would be expected with two wavelengths separated by only ∼130 nm.
Fig. 5.

Comparison of NAD(P)H fluorescence transients with other fluorescence signals. Stimuli in all panels were single tetani applied to s. radiatum (10 pulses, 50 Hz) in the presence of bicuculline. A, B, Endogenous FAD fluorescence signals are inverted as compared with NAD(P)H transients. Stimuli were maintained at 5 min intervals, and imaging alternated between the two imaging modalities in each slice. Values are ΔF/Fo, mean ± SEM; n = 5. C, Ca2+ transients peak at similar times to initial NAD(P)H oxidation. Fura-2 ratios were normalized against the peak response in each preparation (mean ± SEM; n = 4). To allow for direct comparison of the three signals, we obtained the data in A–C with identical stimuli and acquisition settings; the stimuli were aligned at the vertical dashed line.D, E, Simultaneous imaging of NAD(P)H and Rh123 fluorescence transients, with the stimulus applied at the vertical dashed line. This is a single trial and illustrates that the Rh123 fluorescence increase is coincident with the initial NAD(P)H fluorescence decrease. In all panels the data were acquired at 3 Hz.
Figure 5C shows that the initial component of either the NAD(P)H or FAD fluorescence signal is coincident with increases in neuronal intracellular Ca2+ concentration. These measurements were made in slices in which CA1 pyramidal neurons were loaded by using fura-2 AM (see Materials and Methods). The stimuli and time points of image acquisition are identical to those used in Figure 5, A and B, so that the kinetics of the three signals can be compared directly. The stimulus trains produced robust Ca2+ transients, with an initial peak that was coincident with the initial decrease in NAD(P)H fluorescence and increase in FAD fluorescence. This strong correlation is consistent with the hypothesis that neuronal Ca2+ increases underlie NAD(P)H fluorescence transients (Duchen, 1992; Schuchmann et al., 2001). However, it remains possible from these data that Ca2+ and NAD(P)H signals are not related causally but, rather, may be parallel responses triggered independently by neuronal membrane depolarization. Evidence supporting the latter possibility is discussed in the next section.
As would be expected from the large Ca2+transients that were evoked, these stimuli also were accompanied by a loss of mitochondrial potential (Ψm) as measured from experiments run in parallel on slices loaded with Rh123 (Duchen et al., 1993; McCormack and Denton, 1993; Loew et al., 1994;White and Reynolds, 1997; Bindokas et al., 1998; Schuchmann et al., 2000). Increases in Rh123 fluorescence are an indicator of decreases in Ψm (see Materials and Methods) (Bindokas et al., 1998). An example of simultaneous NAD(P)H and Rh123 fluorescence measurements is given in Figure 5, D and E, and shows that the Ψm decrease occurred coincidentally with the initial component of the NAD(P)H response. These data also would be consistent with a causal role of mitochondrial Ca2+ accumulation in the generation of NAD(P)H transients in slice, but more direct evidence would require experiments that tested the removal of extracellular Ca2+ on these responses.
Are intracellular Ca2+ increases required for NAD(P)H transients in slice?
Studies in a range of cell types have shown that mitochondrial Ca2+ increases can regulate mitochondrial NADH levels (Pralong et al., 1992; Duchen et al., 1993; McCormack and Denton, 1993; Hajnoczky et al., 1995; Rohacs et al., 1997; Brandes and Bers, 1999; Pitter et al., 2002; Voronina et al., 2002). In brain slices the initial NAD(P)H decreases have been attributed to mitochondrial Ca2+ accumulation and ROS production and subsequent increases to Ca2+-dependent stimulation of the TCA cycle (Kovacs et al., 2001; Schuchmann et al., 2001); however, this proposal has not been tested directly.
Although synaptic activation offers the tightest time resolution of stimulus delivery, it is not possible to test the requirement of extracellular Ca2+ with this stimulus protocol, because complete removal of extracellular Ca2+ prevents neurotransmitter release. Therefore, we examined the effects of extracellular Ca2+ removal on responses to exogenous application of the agonists glutamate or kainate. Figure6A shows maps of NAD(P)H transients produced by 2 sec glutamate pulses (20 μA) applied by iontophoresis from a micropipette positioned above the pyramidal cell layer (see Materials and Methods). As with responses evoked by presynaptic stimulation (see above), glutamate-evoked responses were biphasic, with an initial decrease followed by a longer-lasting overshoot. The duration of the initial component was significantly longer than that observed with the Schaffer collateral stimuli, presumably as a consequence of the longer stimulus duration (2 sec compared with 0.1–0.5 sec for electrical stimulus trains) as well as the time taken for the agonist to diffuse to sites of action within the slice. The overshoot in s. radiatum was much more prominent than in s. oriens, as was the case for electrical stimulation of the alveus (see Fig. 4 above). The responses to iontophoresis were a consequence of glutamate delivery rather than any direct effect of the iontophoresis current, because no NAD(P)H responses were evoked when current polarity was reversed (n = 6) or when iontophoresis electrodes were filled with NaCl (1 m) rather than with glutamate (n = 5; Fig. 6E). Both phases of the response to glutamate were blocked by a combination of CNQX (50 μm) and APV (100 μm) (n = 3). Figure7 compares the time courses of NAD(P)H signals with Ca2+ and Rh123 transients to 2 sec glutamate pulses (20 μA) applied from micropipettes positioned above the pyramidal cell layer. The acquisition parameters were matched to allow for direct comparison of the three signals. Ca2+ and Rh123 fluorescence signals were monophasic transient increases, as would be expected as a consequence of Ψm depolarization (Duchen et al., 1993;McCormack and Denton, 1993; Loew et al., 1994; White and Reynolds, 1997; Bindokas et al., 1998; Schuchmann et al., 2000), and the maximum rate of increase for both signals correlated with the initial decrease of NAD(P)H signals (Fig. 7A–C). These time relationships were qualitatively similar as described above for synaptic stimulation, suggesting that mechanisms underlying responses to these pulses of exogenous glutamate may be extended to glutamate that is released after electrical stimulation of presynaptic inputs.
Fig. 7.
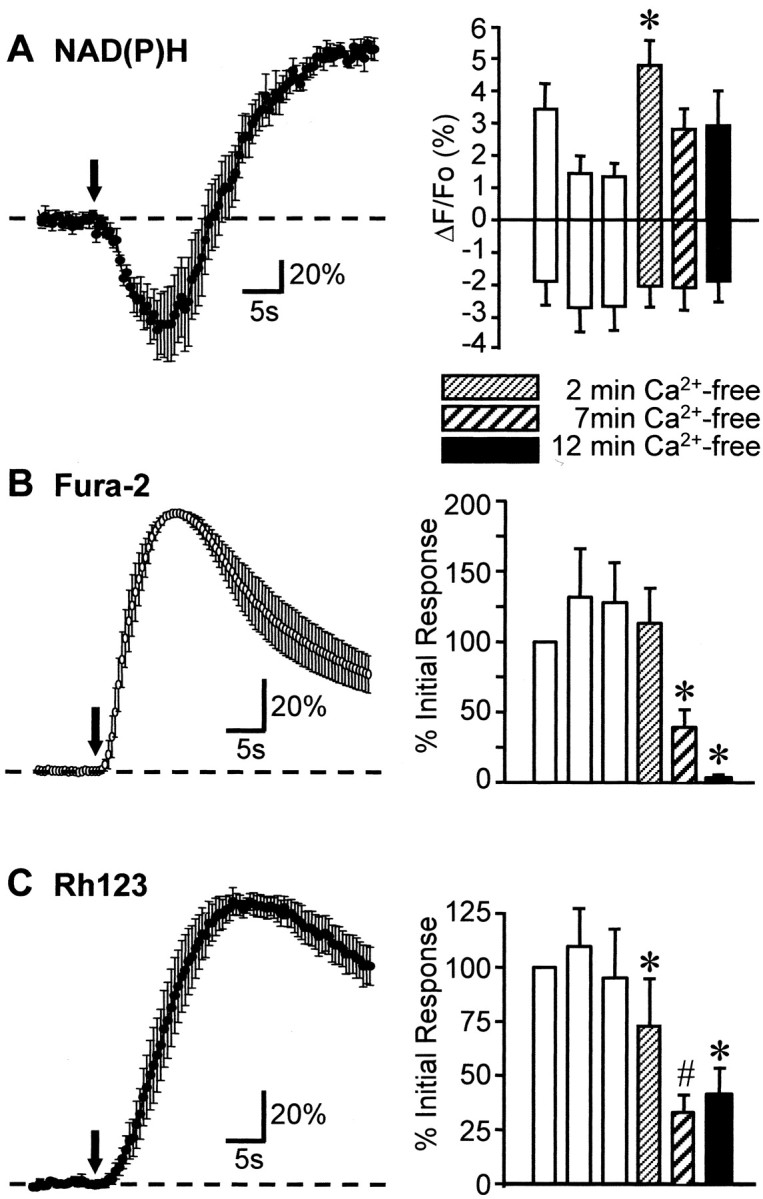
Inhibition of Ca2+ influx did not reduce NAD(P)H transients. For these experiments the stimulus was glutamate applied via microiontophoresis (20 μA, 2 sec; arrows). Left panels show that in regular ACSF the glutamate stimuli produced biphasic NAD(P)H fluorescence transients and monophasic fura-2 and Rh123 fluorescence increases (A–C;n = 6, 5, 7, respectively). To allow for direct comparison of the three signals, we obtained the data inA–C with identical stimulus and acquisition settings. The initial undershoot was coincident with the rising phase of intracellular Ca2+ increase and with the rising phase of the Rh123 signal. Data in left panels are normalized against peak responses. Right panels plot the effect of the removal of extracellular Ca2+ on these three fluorescence signals (mean ± SEM). Three glutamate trials in regular ACSF (open bars) were followed by three trials in Ca2+-free ACSF/0.5 mm BAPTA (hatched and filled bars; see Materials and Methods). NAD(P)H fluorescence transients were increased consistently 2 min after beginning zero Ca2+perfusion (*p < 0.03); even after 12 min of Ca2+ removal both components were not significantly different from responses in control ACSF (A, right;n = 6). Confirming the effective removal of extracellular Ca2+ from the slice, fura-2 signals virtually were abolished by perfusion with zero Ca2+/BAPTA (B, right; *p < 0.02). Rh123 fluorescence transients were reduced significantly in zero Ca2+ conditions (*p < 0.04; #p < 0.02).
After glutamate iontophoresis the overshoot component recovered fully within 2 min; therefore, for subsequent studies 5 min intervals were maintained between successive stimuli. Figure 7A shows that, despite the full recovery in NAD(P)H signal, repeated stimuli led to a progressive decline in the amplitude of overshoot responses evoked by glutamate iontophoresis. Interestingly, amplitudes of the initial components responses did not decline but showed a trend toward an increase in amplitude with repetitive trials (Fig. 7A, open bars). There was no significant change in the value of resting NAD(P)H fluorescence measured immediately before each of the trials (mean fluorescence intensity, 117.2 ± 4.9 vs 119.4 ± 5.8 before first and third trial, respectively; n = 6). Fura-2 signals and Rh123 signals were not decreased during the same repetitive glutamate exposures (Fig. 7B,C, open bars). Based on the results above, one possible explanation for the disparate effects of repetitive stimulation on the two components is that the two components are independent events and that the onset of the overshoot response normally masks the full amplitude of the initial NAD(P)H decrease.
After the establishment of three glutamate responses in control ACSF, three identical responses were evoked in zero Ca2+/ACSF supplemented with 0.5 mm BAPTA (see Materials and Methods). Between all stimuli 5 min intervals were maintained. We were surprised to find that, in the first trial in zero Ca2+ (2 min exposure), the overshoot component of glutamate-evoked NAD(P)H transients was consistently, significantly increased (p < 0.03). With the second and third trials in zero Ca2+ the overshoot was smaller, but still equal to or greater, than values obtained in normal ACSF. In all three trials in zero Ca2+/ACSF the amplitude of the initial component was not significantly different from values in control ACSF.
It is unlikely that Ca2+ influxes occurred after >10 min in the Ca2+-free ACSF and even more so that they increased (to explain the increased overshoot after 2 min in zero Ca2+). However, Ca2+ and Rh123 changes in response to matched glutamate applications were examined to look for a possible intracellular Ca2+ release, or indication thereof, that might persist without Ca2+influx. Figure 7B (hatched bars) shows the effect of extracellular Ca2+ removal on fura-2 ratio signals. There was an appreciable Ca2+ transient after the first glutamate pulse delivered in the Ca2+-free ACSF, as might be expected from the time necessary to achieve low Ca2+ within the slice and also possibly from intracellular release primed by the previous Ca2+ loads (Pozzo-Miller et al., 1996). Ca2+ transients were reduced substantially after 7 min in zero Ca2+ and virtually were abolished 12 min after extracellular Ca2+ removal. A progressive downward shift in the resting baseline compared with normal Ca2+ (11.4 ± 2.6% ratio decrease after 12 min exposure; p < 0.03; n = 5) was noted also.
Concurrent changes in Rh123 signals are illustrated in Figure7C. With the reduced Ca2+transients after removal of extracellular Ca2+ the amplitudes of Rh123 signals (indicating Ψm loss) during the glutamate activation were reduced substantially, but not abolished. Even after 12 min in zero Ca2+ a significant fraction of the Rh123 signal (∼30%) persisted (Fig. 7C). The reduced Rh123 signals were not artifacts caused by loss of Rh123 from the cells during the several stimuli. Ca2+restoration resulted in an increase in both the Ca2+ and ΔΨm to control levels (61.0 ± 11.9 and 91.0 ± 24.1% after 3 and 8 min restoration of Ca2+ for fura-2;n = 5; 67.9 ± 18.7 and 131.6 ± 43.1% for Rh123).
The data of Figure 7 strongly suggest that neither component of evoked NAD(P)H changes requires intracellular Ca2+ increases. In fact, a depression of the overshoot with repetitive glutamate exposures occurs only with stimulation in normal Ca2+/ACSF. Thus it appears that repetitive glutamate exposures lead to changes in the overshoot component of NAD(P)H transients, possibly via Ca2+ loading of mitochondria, but that neither component is reduced by the removal of extracellular Ca2+.
To investigate further the Ca2+ dependence of evoked NAD(P)H fluorescence responses, we examined the effects of the AMPA/kainate receptor agonist KA. KA was applied as a bolus to the perfusate, and previous work showed that this produces a large intracellular Ca2+ increase in murine slices (Shuttleworth and Connor, 2001). Figure8A shows that, like synaptic stimulation and glutamate iontophoresis, this brief KA exposure produced an initial NAD(P)H fluorescence decrease followed by a much larger overshoot. To test the involvement of Ca2+ changes, we compared responses in normal ACSF with responses in slices exposed to zero Ca2+ media for 10 min before KA exposure. From single-cell Ca2+-imaging studies we have found that responses to KA are abolished after 5 min of this procedure (n = 3; data not shown). There was no significant difference in amplitude of overshoot or initial responses in zero Ca2+ (Fig. 8; n = 9 each), suggesting that, as with glutamate iontophoresis, neuronal Ca2+ influx is not required for either component of evoked NAD(P)H transients.
Fig. 8.

Extracellular Ca2+ removal had no significant effect on NAD(P)H fluorescence transients evoked by kainate stimulation. A, B, Representative single trials illustrating NAD(P)H fluorescence changes in s. pyramidale after exposure to a single bolus of kainate (at arrows). C, Mean data for six preparations (±SEM) showing the initial deflection and overshoot responses. No significant differences were found for either component.
Contribution of Na+-dependent mechanisms
The finding that Ca2+ removal had no significant effect on either component of evoked NAD(P)H transients suggested that mitochondrial Ca2+accumulation had little involvement in the transients observed in these mature slices. We therefore considered other types of coupling of neuronal activation to metabolism. ATP use during neuronal activation potentially can influence NADH levels by regulation of rates of oxidative phosphorylation and also of the TCA cycle (Stryer, 1988). A significant demand on ATP levels is made by activity of the plasmalemmal Na+/K+ ATPase during neuronal activity. The possible involvement of this pump in activity-dependent NAD(P)H transients was tested in two ways: (1) by pharmacological inhibition of Na+/K+ ATPase with the use of ouabain and (2) by reduction of Na+ influx by substitution with Li+. Because both of these interventions can interfere with synaptic transmission mechanisms, this series of experiments used direct postsynaptic stimulation with glutamate microiontophoresis or brief KA exposures, as described above, for tests of Ca2+dependence.
Pharmacological inhibition of Na+/K+ ATPase by ouabain
Ouabain exposure (30 μm) for 15 min completely abolished both components of NAD(P)H responses evoked by KA exposure (n = 5). This block could be taken as strong evidence for involvement of this pump in both components of NAD(P)H transients, but it is complicated by other effects of ouabain in the slice. It is well established that ouabain initiates spreading depression (SD) in hippocampal slices (Balestrino et al., 1999; Menna et al., 2000; Wu and Fisher, 2000; Xiong and Stringer, 2000), which results in a sustained decrease in tissue excitability. This phenomenon has been described with microelectrode recording (see above) and also in NAD(P)H-imaging studies of pathologic SD waves in intact cortex (Mayevsky et al., 1998;Rex et al., 1999; Hashimoto et al., 2000; Strong et al., 2000). Indeed, we found that ouabain alone (30 μm) resulted in a spreading depression-type phenomenon in eight of eight preparations that were tested. The event was characterized by a large propagating NAD(P)H decrease, followed by rapid overshoot that moved along the CA1 pyramidal cell layer (Fig.9A,B). In the absence of other drugs SD was observed with a variable onset time after the initiation of ouabain exposure (mean, 9.9 ± 0.9 min; range, 7.1–11.7 min). These results imply that a block of KA responses after 15 min ouabain exposures is confounded seriously by the initiation of SD.
Fig. 9.

Effects of ouabain exposure on spontaneous and evoked NAD(P)H dynamics. A, Exposure to 30 μm ouabain alone (beginning at start of trace) initiated a strong biphasic NAD(P)H response after ∼7.5 min of ouabain exposure (asterisk). B, Illustrated is the progression of this response along the CA1 pyramidal cell layer. The same event as inA is shown at an expanded time base, recorded at three locations along the CA1 pyramidal cell layer. The characteristics of these responses are similar to those described previously for spreading depression (see Results). The onset of spreading depression required that the effects of ouabain on evoked NAD(P)H responses be tested after very brief ouabain exposures. C, NAD(P)H transients after glutamate iontophoresis are shown under control conditions (three trials, top traces) and after 4.5 min of ouabain exposure (bottom trace). Ouabain exposure decreased the overshoot component of the evoked response.
Having determined the minimum expected onset time for ouabain-induced SD, we tested subsequent challenges at an earlier time point (4.5 min). We reasoned that, at this time point, Na+/K+ ATPase should be reduced at least partially and that slices still would be excitable. KA proved unsuitable for this protocol, because this global stimulus accelerated the onset of SD (1.54 ± 0.14 min after KA bolus addition; n = 6). Therefore, glutamate iontophoresis was used. To establish a baseline response, we made three applications of glutamate at 5 min intervals in normal ACSF. A fourth application was administered 5 min after the third, including a 4.5 min exposure to ouabain. NAD(P)H fluorescence levels, measured immediately before glutamate challenges, were not changed significantly by ouabain exposure alone (112.9 ± 4.3 vs 112.8 ± 4.2 AFU, control and ouabain, respectively; 100 msec exposures; n = 6). Acceptance criteria for data were that both components of biphasic NAD(P)H transients were present in stratum pyramidale and that the three control responses showed <10% variation (n = 3 of 6 preparations tested). Figure 9C shows one such data set in which the post-ouabain overshoot was reduced by 46% as compared with control responses, whereas the initial component mainly was unchanged. Measured 30 sec after the glutamate stimulus, the mean NAD(P)H overshoot was reduced from 4.94 ± 1.09 to 1.78 ± 0.82% by ouabain exposure (p < 0.008;n = 3), whereas the initial components of responses were not changed significantly (3.43 ± 0.81 and 3.50 ± 0.45%, n = 3, for control and ouabain, respectively).
Sodium replacement
Lithium ions permeate Na+ channels and ionotropic glutamate receptors and support action potential firing. However, Li+ is a poor substrate for Na+/K+ ATPase (Mullins, 1975) and thus allows neuronal activation while limiting changes in ATP/ADP ratios because of Na+/K+ ATPase activity. We replaced NaCl with LiCl, resulting in an 82.2% reduction of [Na+] in the bathing ACSF (from 153.25 to 27.25 mm). Exposures to Li-ACSF were kept short (<3 min) to prevent secondary effects of Na+ depletion such as loss of Na+-dependent transporter activity (Tong and Jahr, 1994). Fura-2 measurements during Li+ substitution showed that intracellular Ca2+ remained at basal levels for ∼8 min and then began to rise (n = 3 slices; data not shown), possibly because of impaired Na+–Ca2+exchange or increases in ambient glutamate. As can be seen in Figure10A, low-sodium ACSF resulted in a substantial reduction of the overshoot component of responses to glutamate iontophoresis. Responses in control ACSF were compared with responses 5 min later, including a 2.5 min preexposure to lithium ACSF. The amplitude of the overshoot was decreased significantly from an overshoot of 1.28 ± 0.60% to a persistent NAD(P)H decrease of 2.08 ± 0.63% (control and lithium, respectively; p < 0.005; n = 9). The amplitude of the initial NAD(P)H decrease was not significantly different (3.72 ± 0.47 compared with 3.83 ± 0.46%, control and lithium, respectively; p = 0.85; n= 9). Baseline NAD(P)H fluorescence levels, measured immediately before glutamate challenges, were not changed significantly by lithium substitution (108.1 ± 6.7 vs 109.8 ± 6.5 AFU, control and lithium ACSF, respectively; 100 msec exposures; n = 9). Likewise, responses to KA exposure showed a substantial decrease in overshoot response in reduced Na+ from 23.2 ± 5 to 9.4 ± 1.5% (control and lithium, respectively;p < 0.0002; Fig. 10B,C). Under these stimulus conditions the initial component was increased from 2.0 ± 0.1 to 6.7 ± 0.7% (control and lithium, respectively;p < 0.0006; n = 4).
Fig. 10.

Reduction of extracellular [Na+] reduced stimulus-evoked NAD(P)H increases.A, Control NAD(P)H transients evoked by glutamate iontophoresis in 153 mm extracellular Na+ are indicated in filled circles. Reduction of extracellular Na+ to 27 mm (open squares) significantly reduced the overshoot component, with no significant effect on the initial component of NAD(P)H transients (n = 9 for each). B, Effect of Na+ reduction on responses to bolus KA exposure. KA applied at the arrows produced large biphasic transients, as shown previously in Figure 8. Na+ reduction for 3 min led to a significant increase in the initial component and decrease in overshoot component of the response. C, Mean data (±SEM) from four slices in normal ACSF and four slices in low Na+ (**p < 0.0005).
These results, taken together with the ouabain data, are consistent with the suggestion that the activity of Na+/K+ ATPase and consequent increase in ADP/ATP ratio during neuronal activity strongly contribute to the overshoot component of the biphasic NAD(P)H transients. The initial NAD(P)H decrease was not reduced by these procedures. This could be attributable to the fact that it is difficult to obtain a complete block of ATP use by this pump without significant deleterious consequences on slice excitability. From other results in this study it is evident that the initial NADH oxidation is the more prominent feature of small metabolic demands, as in limited spike generation in normal ACSF, whereas the overshoot is more prominent as stimulus intensity is increased or the number of spikes increased by bicuculline exposure (see Fig. 3). Thus as ATP use is reduced for large stimuli by the substitution of Li+ influx for Na+, the NAD(P)H fluorescence signal should revert to the small load format, with a preferential reduction in the overshoot component. However, it also remains possible that the initial NAD(P)H decrease may be attributable to other coupling of neuronal activity to NADH levels independent of plasmalemmal Na+/K+ ATPase activity.
Discussion
We draw three main conclusions from the present results. First, CCD imaging of NAD(P)H fluorescence changes provides a robust, noninvasive indicator of postsynaptic neuronal activation in hippocampal slices. The method is capable of detecting localized evoked activity that lies well within the range of normal physiology. Second, maps of the optical signals show that the two components of biphasic NAD(P)H responses show location-dependent differential expression; thus the two components may not be linked inextricably. Third, NAD(P)H fluorescence changes in the mature slices studied here are not a consequence of neuronal Ca2+ accumulation (Figs. 7, 8) but reflect the coupling of other metabolic demands, including increased activity of Na+/K+ATPase, which accompanies postsynaptic activation.
NAD(P)H imaging of neuronal activation
The present study indicates that robust NAD(P)H changes do not require intense or pathological neuronal activation. NAD(P)H transients evoked by short stimulus trains were of the order of 3–8% in amplitude, were resolved readily in single trials, and could be evoked repetitively for many hours without appreciable decrement. In the presence of bicuculline even responses to single presynaptic shocks could be resolved easily in a single trial (Fig. 1). As might be expected, the averaging of multiple trials enhanced detection of responses to very low intensity stimuli (data not shown). Stimulation also produced a fluorescence change for which the characteristic wavelengths were appropriate for FAD oxidation. These data suggest that relatively large, reproducible demands on oxidative phosphorylation in slice can be imaged during normal synaptic physiology. This would not preclude the involvement of other, perhaps more pathologic, mechanisms (e.g., mitochondrial permeability transition, ROS production) that might occur during seizures or ischemia (Reynolds, 1999; Kovacs et al., 2001; Schuchmann et al., 2001).
The finding that both components of synaptically evoked NAD(P)H transients were abolished by a combination of ionotropic glutamate receptor antagonists implies that the responses result from postsynaptic metabolic loads. It also implies that other metabolic loads introduced by presynaptic activation, such as energy-consuming reuptake and processing of glutamate by glial cells (Magistretti et al., 1999), make only a minor contribution to the observed responses, because there was not an appreciable residual response after glutamate receptor block. This is not to say that the NAD(P)H fluorescence changes in slice originate entirely in neurons. Neuronal electrical activity causes a sizable increase in extracellular K+, which is taken up at least in part by glial cells (Hounsgaard and Nicholson, 1983) at the expense of increased ATP consumption. We have not examined glial Ca2+ dynamics in this study directly, and such signaling potentially could contribute to NAD(P)H changes in the slice preparation also. The large increase in the optical response brought about by GABAA receptor block is consistent with increased postsynaptic excitation for a given stimulus strength (Grinvald et al., 1982), which would increase metabolic demand in both neurons and glia.
Discrimination of components of biphasic responses
For the most part NAD(P)H fluorescence measurements have been made by using single detectors or in some cases multiple detectors coupled to optic fibers (Mayevsky et al., 1988). Higher-resolution devices such as CCD cameras have been used to monitor the slow spread of large changes that occur during spreading depression-like events (Hashimoto et al., 2000; Strong et al., 2000) in intact cortex and during bursting activity in respiratory neurons in brainstem slices (Mironov and Richter, 2001). In the present study this approach enabled monitoring of activity within an extended area of CA1 while maintaining adequate temporal resolution (up to 18 Hz) for reliable assessment of both fast and slow components of evoked NAD(P)H transients. With low-intensity electrical stimuli (Fig. 2) or localized glutamate application (Fig.6), excitation could be seen to initiate in regions close to the stimulus electrode and spread through a discrete region of the of the CA1 pyramidal cell layer. Depending on the stimulus strength, the response could be restricted to s. radiatum and s. pyramidale or could involve more extensive regions, including s. oriens.
A surprising finding that emerged from these studies was that the spatial profiles of the two components were not always matched. We had expected that the same metabolism-linked changes would trigger both initial NAD(P)H decreases and subsequent NAD(P)H overshoots, predicting that the largest decreases would occur at the sites of most intense neuronal activation (typically close to the stimulus electrode) and that, after termination of the stimulus, mechanisms responsible for regenerating NADH levels would be activated most intensely at this same location. This would result in matched spatial profiles of the two components of biphasic responses. This was found generally to be the case when electrical stimuli were applied to s. radiatum. However, after stimulation at the alveus the largest initial decrease occurred in the region of basal dendrites, but the largest overshoot occurred in s. radiatum. Application of glutamate over the pyramidal cell layer also produced the largest initial NAD(P)H decreases in basal dendritic regions, with large overshoots occurring in the apical dendritic area. A number of factors could contribute to differential expression of NAD(P)H decreases and increases in different hippocampal subfields and are the subject of future work. However, these observations do suggest that the compound NAD(P)H responses do not reflect an obligatory coupling between an NAD(P)H decrease and any subsequent increase. This also suggests that integrated area measurements, as are obtained with photo multiplier tubes or photodiodes, can be misleading in that where a large area is observed, the signal is a mixture of components that may have quite different kinetics and spatial distributions. These considerations need to be taken into account if NAD(P)H fluorescence measurements are used for mapping neuron activation, because the characteristics of initial NAD(P)H decreases can be influenced strongly by the differential emergence of NAD(P)H overshoots in different locations (Fig.4B).
Ca2+ independence of evoked NAD(P)H transients
As far as we are aware, the present study is the first to examine the Ca2+ dependence of these signals in slice, and we found that even protracted removal of extracellular Ca2+ and the consequent block of Ca2+ transients did not diminish evoked NAD(P)H transients (Figs. 7, 8). This strongly suggests that, in this preparation, the largest demands on oxidative metabolism are consequences of ionic fluxes other than Ca2+ (e.g., Na+ and K+). Our observations with ouabain exposure and extracellular Na+ reduction (Figs. 9, 10) suggest that activity of plasmalemmal Na+/K+ ATPase contributes significantly to NAD(P)H signals in mature slices. This observation supports an earlier proposal that decreases in NADH fluorescence observed after hippocampal stimulation in vivowere primarily a consequence of ATP depletion by active transport (Lewis and Schuette, 1973). Changes in ADP/ATP ratio could underlie biphasic NAD(P)H transients by direct coupling to an increased oxidative phosphorylation rate, as well as stimulation of enzymes of the TCA cycle to produce longer-lasting NADH increases (Crompton, 1990;Brandes and Bers, 1999). Intracellular Ca2+ increases and mitochondrial depolarization certainly occur during hippocampal depolarization (Figs.5, 7), but we argue that this occurs as a parallel consequence of membrane depolarization and is not required for the NAD(P)H transients that have been imaged here.
These conclusions provide a significant contrast to recent suggestions that mitochondrial Ca2+ dynamics underlie NAD(P)H transients in hippocampal slices and bring into question the utility of NAD(P)H fluorescence as a convenient, noninvasive indicator of mitochondrial Ca2+ loading in these preparations. The pivotal study of Duchen (1992), performed in isolated dorsal root ganglion neurons, clearly showed that removal of extracellular Ca2+ abolished biphasic NAD(P)H responses to plasma membrane depolarization. The stimulus protocol was a sustained K+ depolarization that under normal conditions produced a large Ca2+ rise and significant mitochondrial depolarization. We suggest that the discrepancy between conclusions of the current study and previous work may arise from differences in ion fluxes in the two sets of experiments. During sustained depolarizations in young DRG neurons the Na+ channels rapidly inactivate, preventing the firing of multiple action potentials (Chen et al., 1987). However, in DRG neurons the Ca2+ influx is sustained via high-threshold slowly inactivating voltage-dependent Ca2+ channels during extended depolarizations (Rane et al., 1987). In contrast, hippocampal pyramidal neurons in slice have major routes of Na+influx (AMPA/KA, NMDA receptors, and Na+channels) that are activated by glutamate or KA. These cells fire sustained bursts of action potentials after glutamate or kainate application (Shuttleworth and Connor, 2001) that can perturb intracellular concentrations of Na+significantly (Jaffe et al., 1992) and, to a lesser extent, K+. Removal of Ca2+ has little effect on this activation and actually may enhance the Na+ load and K+ deficit by reducing Ca2+-dependent spike frequency adaptation (Hotson and Prince, 1980). Thus the ionic basis for ATP use (because of the activity of pumps and sequestration mechanisms) that follows excitation of hippocampal neurons and isolated DRGs is likely to be quite different and may explain the different conclusions about dependence on extracellular Ca2+. Although these findings suggest that evoked NAD(P)H transients in slice do not reflect mitochondrial Ca2+ dynamics, they do not rule out contributions from Ca2+-dependent regulation of NADH signals under other, more extreme, conditions, e.g., spreading depression or anoxia (Perez-Pinzon et al., 1998).
Footnotes
This work was supported by National Institutes of Health Grants NS43458, NS35644, and RR15636. We thank H. Xing for assistance with the fura-2 experiments.
Correspondence should be addressed to Dr. C. William Shuttleworth, Department of Neurosciences, University of New Mexico School of Medicine, Basic Medical Sciences Building, Room 145, 915 Camino de Salud Northeast, Albuquerque, NM 87131. E-mail:bshuttleworth@salud.unm.edu.
References
- 1.Balestrino M, Young J, Aitken P. Block of (Na+, K+)ATPase with ouabain induces spreading depression-like depolarization in hippocampal slices. Brain Res. 1999;838:37–44. doi: 10.1016/s0006-8993(99)01674-1. [DOI] [PubMed] [Google Scholar]
- 2.Bindokas VP, Lee CC, Colmers WF, Miller RJ. Changes in mitochondrial function resulting from synaptic activity in the rat hippocampal slice. J Neurosci. 1998;18:4570–4587. doi: 10.1523/JNEUROSCI.18-12-04570.1998. [DOI] [PMC free article] [PubMed] [Google Scholar]
- 3.Blasdel GG, Salama G. Voltage-sensitive dyes reveal a modular organization in monkey striate cortex. Nature. 1986;321:579–585. doi: 10.1038/321579a0. [DOI] [PubMed] [Google Scholar]
- 4.Brandes R, Bers DM. Analysis of the mechanisms of mitochondrial NADH regulation in cardiac trabeculae. Biophys J. 1999;77:1666–1682. doi: 10.1016/S0006-3495(99)77014-1. [DOI] [PMC free article] [PubMed] [Google Scholar]
- 5.Chance B, Cohen P, Jöbsis F, Schoener B. Intracellular oxidation–reduction states in vivo. Science. 1962;137:499–508. doi: 10.1126/science.137.3529.499. [DOI] [PubMed] [Google Scholar]
- 6.Chen GG, Cole AE, MacDermott AB, Lange GD, Barker JL. The influence of skeletal muscle on the electrical excitability of dorsal root ganglion neurons in culture. J Neurosci. 1987;7:2412–2422. [PMC free article] [PubMed] [Google Scholar]
- 7.Cohen LB, Keynes RD, Hille B. Light scattering and birefringence changes during nerve activity. Nature. 1968;218:438–441. doi: 10.1038/218438a0. [DOI] [PubMed] [Google Scholar]
- 8.Cohen LB, Salzberg BM, Davila HV, Ross WN, Landowne D, Waggoner AS, Wang CH. Changes in axon fluorescence during activity: molecular probes of membrane potential. J Membr Biol. 1974;19:1–36. doi: 10.1007/BF01869968. [DOI] [PubMed] [Google Scholar]
- 9.Connor JA, Kreulen DL, Prosser CL. Relation between oxidative metabolism and slow rhythmic potentials in mammalian intestinal muscle. Proc Natl Acad Sci USA. 1976;73:4239–4243. doi: 10.1073/pnas.73.11.4239. [DOI] [PMC free article] [PubMed] [Google Scholar]
- 10.Connor JA, Razani-Boroujerdi S, Greenwood AC, Cormier RJ, Petrozzino JJ, Lin RCS. Reduced voltage-dependent Ca2+ signaling in CA1 neurons after brief ischemia in gerbils. J Neurophysiol. 1999;81:299–306. doi: 10.1152/jn.1999.81.1.299. [DOI] [PubMed] [Google Scholar]
- 11.Crompton M. The role of Ca2+ in the function and dysfunction of heart mitochondria. In: Langer GA, editor. Calcium and the heart. Raven; New York: 1990. pp. 167–199. [Google Scholar]
- 12.Duchen MR. Ca2+-dependent changes in the mitochondrial energetics in single dissociated mouse sensory neurons. Biochem J. 1992;283:41–50. doi: 10.1042/bj2830041. [DOI] [PMC free article] [PubMed] [Google Scholar]
- 13.Duchen MR, Smith PA, Ashcroft FM. Substrate-dependent changes in mitochondrial function, intracellular free calcium concentration, and membrane channels in pancreatic β-cells. Biochem J. 1993;294:35–42. doi: 10.1042/bj2940035. [DOI] [PMC free article] [PubMed] [Google Scholar]
- 14.Frostig RD, Lieke EE, Ts'o DY, Grinvald A. Cortical functional architecture and local coupling between neuronal activity and the microcirculation revealed by in vivo high-resolution optical imaging of intrinsic signals. Proc Natl Acad Sci USA. 1990;87:6082–6086. doi: 10.1073/pnas.87.16.6082. [DOI] [PMC free article] [PubMed] [Google Scholar]
- 15.Grinvald A, Manker A, Segal M. Visualization of the spread of electrical activity in rat hippocampal slices by voltage-sensitive optical probes. J Physiol (Lond) 1982;333:269–291. doi: 10.1113/jphysiol.1982.sp014453. [DOI] [PMC free article] [PubMed] [Google Scholar]
- 16.Grinvald A, Lieke E, Frostig RD, Gilbert CD, Wiesel TN. Functional architecture of cortex revealed by optical imaging of intrinsic signals. Nature. 1986;324:361–364. doi: 10.1038/324361a0. [DOI] [PubMed] [Google Scholar]
- 17.Hajnoczky G, Robb-Gaspers LD, Seitz MB, Thomas AP. Decoding of cytosolic calcium oscillations in the mitochondria. Cell. 1995;82:415–424. doi: 10.1016/0092-8674(95)90430-1. [DOI] [PubMed] [Google Scholar]
- 18.Hashimoto M, Takeda Y, Sato T, Kawahara H, Nagano O, Hirakawa M. Dynamic changes of NADH fluorescence images and NADH content during spreading depression in the cerebral cortex of gerbils. Brain Res. 2000;872:294–300. doi: 10.1016/s0006-8993(00)02509-9. [DOI] [PubMed] [Google Scholar]
- 19.Hill DK, Keynes RD. Opacity changes in stimulated nerve. J Physiol (Lond) 1949;108:278–281. [PubMed] [Google Scholar]
- 20.Hotson JR, Prince DA. A calcium-activated hyperpolarization follows repetitive firing in hippocampal neurons. J Neurophysiol. 1980;43:409–419. doi: 10.1152/jn.1980.43.2.409. [DOI] [PubMed] [Google Scholar]
- 21.Hounsgaard J, Nicholson C. Potassium accumulation around individual Purkinje cells in cerebellar slices from the guinea-pig. J Physiol (Lond) 1983;340:359–388. doi: 10.1113/jphysiol.1983.sp014767. [DOI] [PMC free article] [PubMed] [Google Scholar]
- 22.Jaffe DB, Johnston D, Lasser-Ross N, Lisman JE, Miyakawa H, Ross WN. The spread of Na+ spikes determines the pattern of dendritic Ca2+ entry into hippocampal neurons. Nature. 1992;357:244–246. doi: 10.1038/357244a0. [DOI] [PubMed] [Google Scholar]
- 23.Jöbsis FF, O'Connor M, Vitale A, Vreman H. Intracellular redox changes in functioning cerebral cortex. I. Metabolic effects of epileptiform activity. J Neurophysiol. 1971;4:735–749. doi: 10.1152/jn.1971.34.5.735. [DOI] [PubMed] [Google Scholar]
- 24.Kovacs R, Schuchmann S, Gabriel S, Kardos J, Heinemann U. Ca2+ signaling and changes of mitochondrial function during low-Mg2+-induced epileptiform activity in organotypic hippocampal slice cultures. Eur J Neurosci. 2001;13:1311–1319. doi: 10.1046/j.0953-816x.2001.01505.x. [DOI] [PubMed] [Google Scholar]
- 25.Lewis DV, Schuette WH. NADH fluorescence and [K+]o changes during hippocampal electrical stimulation. J Neurophysiol. 1973;38:405–417. doi: 10.1152/jn.1975.38.2.405. [DOI] [PubMed] [Google Scholar]
- 26.Loew LM, Carrington W, Tuft RA, Fay FS. Physiological cytosolic Ca2+ transients evoke concurrent mitochondrial depolarizations. Proc Natl Acad Sci USA. 1994;91:12579–12583. doi: 10.1073/pnas.91.26.12579. [DOI] [PMC free article] [PubMed] [Google Scholar]
- 27.Luo M, Katz LC. Response correlation maps of neurons in the mammalian olfactory bulb. Neuron. 2001;32:1165–1179. doi: 10.1016/s0896-6273(01)00537-2. [DOI] [PubMed] [Google Scholar]
- 28.MacVicar BA, Hochman D. Imaging of synaptically evoked intrinsic optical signals in hippocampal slices. J Neurosci. 1991;11:1458–1469. doi: 10.1523/JNEUROSCI.11-05-01458.1991. [DOI] [PMC free article] [PubMed] [Google Scholar]
- 29.Magistretti PJ, Pellerin L, Rothman DL, Shulman RG. Energy on demand. Science. 1999;283:496–497. doi: 10.1126/science.283.5401.496. [DOI] [PubMed] [Google Scholar]
- 30.Mayevsky A, Nioka S, Chance B. Fiber optic surface fluorometry/reflectometry and 31-p-NMR for monitoring the intracellular energy state in vivo. Adv Exp Med Biol. 1988;222:365–374. doi: 10.1007/978-1-4615-9510-6_43. [DOI] [PubMed] [Google Scholar]
- 31.Mayevsky A, Meilin S, Manor T, Ornstein E, Zarchin N, Sonn J. Multiparametric monitoring of brain oxygen balance under experimental and clinical conditions. Neurol Res. 1998;20:S76–S80. doi: 10.1080/01616412.1998.11740615. [DOI] [PubMed] [Google Scholar]
- 32.McCormack JG, Denton RM. Mitochondrial Ca2+ transport and the role of intramitochondrial Ca2+ in the regulation of energy metabolism. Dev Neurosci. 1993;15:165–173. doi: 10.1159/000111332. [DOI] [PubMed] [Google Scholar]
- 33.Menna G, Tong CK, Chesler M. Extracellular pH changes and accompanying cation shifts during ouabain-induced spreading depression. J Neurophysiol. 2000;83:1338–1345. doi: 10.1152/jn.2000.83.3.1338. [DOI] [PubMed] [Google Scholar]
- 34.Mironov SL, Richter DW. Oscillations and hypoxic changes of mitochondrial variables in neurons of the brainstem respiratory centre of mice. J Physiol (Lond) 2001;33:227–236. doi: 10.1111/j.1469-7793.2001.0227b.x. [DOI] [PMC free article] [PubMed] [Google Scholar]
- 35.Müller W, Connor JA. Cholinergic input uncouples Ca2+ changes from K+ conductance activation and amplifies intradendritic Ca2+ changes in hippocampal neurons. Neuron. 1991;6:901–905. doi: 10.1016/0896-6273(91)90230-w. [DOI] [PubMed] [Google Scholar]
- 36.Mullins LJ. Ion selectivity of carriers and channels. Biophys J. 1975;15:921–931. doi: 10.1016/S0006-3495(75)85867-X. [DOI] [PMC free article] [PubMed] [Google Scholar]
- 37.O'Connor MJ, Herman CJ, Rosenthal M, Jöbsis FF. Intracellular redox changes preceding onset of epileptiform activity in intact cat hippocampus. J Neurophysiol. 1972;35:471–483. doi: 10.1152/jn.1972.35.4.471. [DOI] [PubMed] [Google Scholar]
- 38.Perez-Pinzon MA, Mumford PL, Carranza V, Sick TJ. Calcium influx from the extracellular space promotes NADH hyperoxidation and electrical dysfunction after anoxia in hippocampal slices. J Cereb Blood Flow Metab. 1998;18:215–221. doi: 10.1097/00004647-199802000-00013. [DOI] [PubMed] [Google Scholar]
- 39.Pitter JG, Maechler P, Wollheim CB, Spat A. Mitochondria respond to Ca2+ already in the submicromolar range: correlation with redox state. Cell Calcium. 2002;31:97–104. doi: 10.1054/ceca.2001.0264. [DOI] [PubMed] [Google Scholar]
- 40.Pozzo-Miller LD, Petrozzino JJ, Golarai G, Connor JA. Ca2+ release from intracellular stores induced by afferent stimulation of CA3 pyramidal neurons in hippocampal slices. J Neurophysiol. 1996;76:554–562. doi: 10.1152/jn.1996.76.1.554. [DOI] [PubMed] [Google Scholar]
- 41.Pralong WF, Hunyady L, Varnai P, Wollheim CB, Spat A. Pyridine nucleotide redox state parallels production of aldosterone in potassium-stimulated adrenal glomerulosa cells. Proc Natl Acad Sci USA. 1992;89:132–136. doi: 10.1073/pnas.89.1.132. [DOI] [PMC free article] [PubMed] [Google Scholar]
- 42.Rane SG, Holz GG, Dunlap K. Dihydropyridine inhibition of neuronal calcium current and substance P release. Pfl∫gers Arch. 1987;409:361–366. doi: 10.1007/BF00583789. [DOI] [PMC free article] [PubMed] [Google Scholar]
- 43.Regehr WG, Tank DW. Selective fura-2 loading of presynaptic terminals and nerve cell processes by local perfusion in mammalian brain slice. J Neurosci Methods. 1991;37:111–119. doi: 10.1016/0165-0270(91)90121-f. [DOI] [PubMed] [Google Scholar]
- 44.Rex A, Pfeifer L, Fink F, Fink H. Cortical NADH during pharmacological manipulations of the respiratory chain and spreading depression in vivo. J Neurosci Res. 1999;57:359–370. [PubMed] [Google Scholar]
- 45.Reynolds IJ. Mitochondrial membrane potential and the permeability transition in excitotoxicity. Ann NY Acad Sci. 1999;893:33–41. doi: 10.1111/j.1749-6632.1999.tb07816.x. [DOI] [PubMed] [Google Scholar]
- 46.Rohacs T, Tory K, Dobos A, Spat A. Intracellular calcium release is more efficient than calcium influx in stimulating mitochondrial NADPH formation in adrenal glomerulosa cells. Biochem J. 1997;328:525–528. doi: 10.1042/bj3280525. [DOI] [PMC free article] [PubMed] [Google Scholar]
- 47.Salzberg BM. Optical recording of voltage changes in nerve terminals and in fine neuronal processes. Annu Rev Physiol. 1989;51:507–526. doi: 10.1146/annurev.ph.51.030189.002451. [DOI] [PubMed] [Google Scholar]
- 48.Salzberg BM, Obaid AL, Gainer H. Large and rapid changes in light scattering accompany secretion by nerve terminals in the mammalian neurohypophysis. J Gen Physiol. 1985;86:395–411. doi: 10.1085/jgp.86.3.395. [DOI] [PMC free article] [PubMed] [Google Scholar]
- 49.Schuchmann S, Buchheim K, Meierkord H, Heinemann U. A relative energy failure is associated with low-Mg2+ but not with 4-aminopyridine-induced seizure-like events in entorhinal cortex. J Neurophysiol. 1999;81:399–403. doi: 10.1152/jn.1999.81.1.399. [DOI] [PubMed] [Google Scholar]
- 50.Schuchmann S, Luckermann M, Kulik A, Heinemann U, Ballanyi K. Ca2+- and metabolism-related changes of mitochondrial potential in voltage-clamped CA1 pyramidal neurons in situ. J Neurophysiol. 2000;83:1710–1721. doi: 10.1152/jn.2000.83.3.1710. [DOI] [PubMed] [Google Scholar]
- 51.Schuchmann S, Kovacs R, Kann O, Heinemann U, Buchheim K. Monitoring NADPH autofluorescence to assess mitochondrial metabolic functions in rat hippocampal–entorhinal cortex slices. Brain Res Brain Res Protoc. 2001;7:267–276. doi: 10.1016/s1385-299x(01)00080-0. [DOI] [PubMed] [Google Scholar]
- 52.Shoham D, Glaser DE, Arieli A, Kenet T, Wijnbergen C, Toledo Y, Hildesheim R, Grinvald A. Imaging cortical dynamics at high spatial and temporal resolution with novel blue voltage-sensitive dyes. Neuron. 1999;24:791–802. doi: 10.1016/s0896-6273(00)81027-2. [DOI] [PubMed] [Google Scholar]
- 53.Shuttleworth CW, Connor JA. Strain-dependent differences in calcium signaling predict excitotoxicity in murine hippocampal neurons. J Neurosci. 2001;21:4225–4236. doi: 10.1523/JNEUROSCI.21-12-04225.2001. [DOI] [PMC free article] [PubMed] [Google Scholar]
- 54.Strong AJ, Smith SE, Whittington DJ, Meldrum BS, Parsons AA, Krupinski J, Hunter AJ, Patel S. Factors influencing the frequency of fluorescence transients as markers of peri-infarct depolarizations in focal cerebral ischemia. Stroke. 2000;31:214–222. doi: 10.1161/01.str.31.1.214. [DOI] [PubMed] [Google Scholar]
- 55.Stryer L. Biochemistry, 3rd Ed, pp 390, 421. Freeman; New York: 1988. [Google Scholar]
- 56.Swanson LW, Kohler C, Bjorklund A. The limbic region. In: Bjorklund A, Hokfelt T, Swanson LW, editors. Integrated systems of the CNS, Pt I, The septohippocampal system, Chap 2. Elsevier; New York: 1989. pp. 125–279. [Google Scholar]
- 57.Tong G, Jahr CE. Block of glutamate transporters potentiates postsynaptic excitation. Neuron. 1994;13:1195–1203. doi: 10.1016/0896-6273(94)90057-4. [DOI] [PubMed] [Google Scholar]
- 58.Voronina S, Sukhomlin T, Johnson PR, Erdemli G, Petersen OH, Tepikin A. Correlation of NADH and Ca2+ signals in mouse pancreatic acinar cells. J Physiol (Lond) 2002;539:41–52. doi: 10.1113/jphysiol.2001.013134. [DOI] [PMC free article] [PubMed] [Google Scholar]
- 59.White RJ, Reynolds IJ. Mitochondria accumulate Ca2+ following intense glutamate stimulation of cultured rat forebrain neurones. J Physiol (Lond) 1997;498:31–47. doi: 10.1113/jphysiol.1997.sp021839. [DOI] [PMC free article] [PubMed] [Google Scholar]
- 60.Wu J, Fisher RS. Hyperthermic spreading depressions in the immature rat hippocampal slice. J Neurophysiol. 2000;84:1355–1360. doi: 10.1152/jn.2000.84.3.1355. [DOI] [PubMed] [Google Scholar]
- 61.Xiong ZQ, Stringer JL. Sodium pump activity, not glial spatial buffering, clears potassium after epileptiform activity induced in the dentate gyrus. J Neurophysiol. 2000;83:1443–1451. doi: 10.1152/jn.2000.83.3.1443. [DOI] [PubMed] [Google Scholar]