

Abstract
It is surprising how quickly we can find our bearings when suddenly confronted with a familiar environment, for instance when the lights are turned on in a dark room. Subjectively, this appears to occur almost instantaneously, yet the neural processes permitting this rapid reorientation are unknown. A likely candidate is the head direction (HD) cell system. These limbic neurons found in several brain regions, including the thalamus and the hippocampus, discharge selectively when the head of an animal is oriented in a particular (“preferred”) direction. This neuronal activity is independent of position and ongoing behavior and is thus likely to constitute a physiological basis for the sense of direction. Remarkably, although the HD cell system has properties resembling those of a compass, it is independent of geomagnetic fields. Rather, the preferred directions of the HD cells are strongly anchored to visual cues in the environment. Here, we bring evidence for the first time that a fundamental component of the capacity to rapidly reorient in a familiar environment may be brought about by updating of HD cell responses as rapidly as 80 msec after changes in the visual scene. Continuous attractor networks have been used successfully to model HD cell ensemble dynamics. The present results suggest that after large rotations of the surrounding landmarks, activity in such networks may be propagated in abrupt jumps rather than in a gradually progressive manner.
Keywords: anterodorsal thalamic nucleus, update latency, spatial memory, landmark, visual orientation, attractor network
Introduction
Head direction (HD) cells discharge selectively when the head of a monkey, rat, mouse, or chinchilla is oriented in a particular direction of the environment, which is referred to as the preferred direction (Ranck, 1984; Knierim et al., 1998; Taube, 1998; Blair et al., 1999; Robertson et al., 1999; Khabbaz et al., 2000; Muir and Taube, 2002). Although HD cell responses can be influenced by various multisensory and motor signals (Blair and Sharp, 1996; Stackman and Taube, 1997; Goodridge et al., 1998; Zugaro et al., 2001b), the preferred directions are primarily updated on the basis of visual landmarks (Taube, 1995; Zugaro et al., 2001a). But how rapidly are preferred directions updated after rotation of visual landmarks? Although this question was addressed briefly in previous studies (Knierim et al., 1998; Zugaro et al., 2000), the experimental protocols could not measure updates occurring faster than 15 sec, because those procedures required recordings while the head of the animal was reoriented in many different directions. However, neural network simulations predict that preferred direction updates could be as rapid as a few hundred milliseconds (Zhang, 1996; Redish, 1999). The experimental protocol described here was developed to test this prediction.
Materials and Methods
Electrode implantation. Four adult male Long–Evans rats (200∼250 gm; CERJ, Le Genest-St-Isle, France) were tranquilized with xylazine, deeply anesthetized with pentobarbital (40 mg/kg), and then surgically implanted with electrodes in the anterodorsal nucleus of the thalamus (anteroposterior, approximately −1.6–2.0 mm; mediolateral, ±1.2 mm relative to bregma; 3.8 mm ventral to brain surface). The electrode assembly consisted of bundles of eight, single wire electrodes (Formvar-coated nichrome wires: diameter, 25 μm; impedance, 200–800 kΩ) inserted in a 30 gauge stainless steel cannula and mounted on an advanceable connector assembly (Wiener, 1993). The headstage was permanently fixed to the skull with dental acrylic and tiny screws. All animal care and experimental protocols were in accord with institutional and international standards and legal regulations (Certificate 7186, Ministère de l'Agriculture et de la Pêche).
Data acquisition. During the recording sessions, electrode signals passed through field effect transistors and were differentially amplified (10,000×) and filtered (300 Hz to 5 kHz, notch at 50 Hz). The signals were acquired on a DataWave Discovery system (Longmont, CO). Two small infrared light-emitting diodes (10 cm separation) mounted above the headstage were detected by a video camera, and their moment-to-moment positions were stored by the data acquisition system for off-line analyses [for details, see Zugaro et al. (2001b)].
Apparatus. The experimental setup consisted of a black cylinder (diameter, 76 cm; height, 50 cm) with a white card attached to its inner wall. This subtended 90° and served as the principal visual cue. Water could be delivered to a small reservoir at the center of the cylinder to keep the lightly water-deprived rats immobile without applying physical restraint (Zugaro et al., 2001b), which is known to depress directional responses (Taube, 1995). The 3 × 3 × 3 m recording chamber was surrounded by black curtains suspended from the ceiling along the four walls. Illumination was provided by a 40 W overhead lamp on the ceiling that diffused light evenly within the cylinder. All electronic instruments and computers were situated outside of the curtains, and the entire experimental room was phonically isolated from the rest of the building.
Behavioral task. At the beginning of each recording session, the preferred directions of the HD cells were determined as the rat foraged for small food pellets distributed sparsely onto an elevated circular platform over a 5 min period. Then, the unrestrained rat remained immobile with its head oriented in the preferred direction while receiving small drops (∼30 μl) of water at 0.5–1 sec intervals from the reservoir at the center of the platform. The rats had previously been trained to remain immobile at the water spout with a behavioral shaping procedure: water delivery was triggered only when the rat was positioned at the reservoir at the appropriate orientation, and water was ceased as soon as it moved away from the preferred direction. (The solenoid valve that released the water made a distinct clicking sound that likely served as a cue.) After a stable recording of the directional response had been established (Fig.1A), the room light was turned off and the card was manually rotated along the cylinder wall by 90° to a new orientation (Fig. 1B). This was done as rapidly and silently as possible to keep the rat from detecting the rotations. The light was then turned back on (Fig. 1C). This was intended to trigger an update in the HD system. Because the preferred directions of the HD cells are anchored to visual cues (Taube, 1998), the previously active cells would stop firing, whereas others would become active. After a short delay, the light was turned off again, and the card was rotated back to the initial position (Fig.1D). The light was then turned back on (Fig.1E) to retrigger the initial cell responses. We measured the latencies of the cell responses to the light onset with the card in each position (referred to as a “reorientation event”).
Fig. 1.
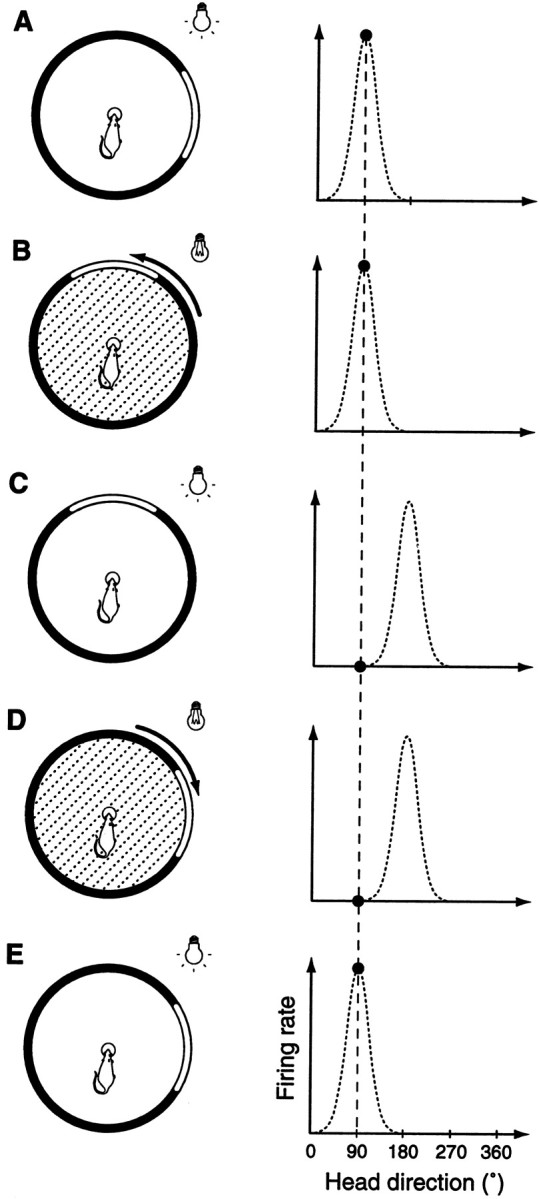
Experimental procedure. A, Because the rat remains immobile oriented in the (previously determined) preferred direction while drinking water from the reservoir (left), full response curves cannot be sampled. Rather, only the cell responses corresponding to this particular head direction can now be recorded (black circle in right panel). B, The light is turned off, and the card is rotated by 90° along the cylinder wall.C, The light is turned back on. This triggers a shift in the directional response curve of the neuron because this activity is anchored to visual cues (right panel). Accordingly there should be a marked decrease in firing rate (compare the filled circles inB and C, right panels). D, The light is turned off again, and the card is returned to the standard position. E, The light is turned back on. The preferred direction shifts back to its initial orientation (right panel). This corresponds to a marked increase in discharge frequency (compare the filled circles in D and E, right panels). Steps B through E are repeated until the rat is satiated and no longer remains immobile at the center.
Data analysis. For each reorientation event, the response of each HD cell was compared 0.5 sec before and 0.5 sec after the light was turned on (referred to as a “trial”). Two criteria were used to select trials suitable for analysis: (1) the head of the rat had to remain close to the preferred direction (i.e., within two SDs of the Gaussian fit of the response curve around the preferred direction), and (2) the head direction had to remain stable throughout the whole trial, i.e., remain within ±15° around its mean value. Two methods were used to measure latencies of updating of directional responses. We first pooled all analyzable trials recorded from all cells and computed a cumulative response histogram. In the cumulative response histogram, the change point in firing rate was determined by computing the best fit slopes before and after each 10 msec bin within 250 msec after light onset. The bin corresponding to the smallest square error was then selected as the estimated update latency (Friedman and Priebe, 1998). The second method examined firing rate changes on a trial by trial basis. Only trials with a minimum of 10 action potentials were selected for this analysis. The mean interspike intervals were compared for 500 msec intervals before and after each spike occurring within 250 msec after light onset. A maximum likelihood estimator was then used to determine the transition point.
Results
Twenty-three HD cells were recorded in 15 sessions (including 7 sessions in which two or more cells were recorded simultaneously). Turning the light off did not appear to alter the cell responses. The head of the rat remained stable in 261 of 496 (53%) trials. Perhaps because of drift or attentional factors, the preferred directions of the HD cells were not always updated after the light was turned on. Trials were rejected as unusable if the number of spikes emitted was unchanged in the 500 msec before versus 500 msec after light onset [the criterion was ∣ spikesbefore −spikesafter ∣ /(spikesbefore+ spikesafter) ≤0.2)], or if the total number of spikes in these periods was <5. With these additional criteria, 129 of 496 (26%) trials were retained. In 51 trials, perhaps because of drift or updating of the preferred directions, the cells started firing when the light went on with the card in its rotated position or stopped firing when the light went on with the card in its initial position.
Figure 2 shows raster plots of the HD cell responses to the light going on with the cue card in the new orientation. The corresponding peri-event histograms and cumulative spike count histograms are also shown. The figure includes the plots of the best fit models of the latter histograms used to compute response latencies (Friedman and Priebe, 1998). The new preferred directions were established at a latency of 80 ± 10 msec, when the newly activated HD cells arrived at their maximum firing rate (Fig.2A). However, the cessation of activity after the cue card was shifted away from its original orientation occurred at a slower rate: the return to baseline occurred only after 140 ± 10 msec (Fig. 2B).
Fig. 2.

Latency of preferred direction updates in HD cells. Raster plots (above), peri-event histograms (middle), and cumulative histograms (below) (bin width = 10 msec) of action potentials recorded from all of the HD cells analyzed. Time 0 indicates when the lights were turned on again. After light onset, the preferred directions return to their initial orientations (A) or shift to the rotated (nonpreferred) orientations (B). To determine the average latency of the preferred direction update, least-squares estimates were computed from the cumulative histograms using the first 250 msec of data after light onset (thick curves) (Friedman and Priebe, 1998). Transition points are at 80 ± 10 msec (A) for returns to the preferred orientation and 140 ± 10 msec (B) for shifts to the nonpreferred orientation. Brackets indicate trials from the same cell within a given session; the variations in spike density among the rows of rasters reflect differences in peak and background firing rates among the neurons.
We then examined the time course of firing rate changes on a trial by trial basis, using the maximum likelihood estimator of Seal et al. (1983). As shown in the example in Figure3, there was moderate variability across trials within the same session. No systematic trend was evident, indicating that it is unlikely that learning occurred during the course of the experiment. Also, update latencies appeared reproducible across sessions and animals in the total of 75 trials used for this analysis (Table 1). This was tested with separate ANOVAs for the increasing and decreasing firing rate conditions. For trials in which the firing rates increased after light onset, there were no significant differences among animals (F = 0.09; df = 2; NS) or sessions (F = 0.07; df = 4; NS). One outlier was removed from these analyses. For this session, the average estimated latency was 167 msec (Table 1) (the least-square estimator described above yielded an update latency of only 70 msec). Similarly, for trials in which the firing rates decreased after the light was turned on, no significant differences were found among animals (F = 1.18; df = 2; NS) or sessions (F = 0.53; df = 4; NS).
Fig. 3.

A typical analysis of update latency on a trial by trial basis with the method of Seal et al. (1983). Raster plots show action potentials recorded from a single HD cell during a single session, when the firing rate increases (A) or decreases (B) after card rotation. Light onset occurs at time 0. For each trial, the update latency is computed as the maximum likelihood estimator of the change point in the mean interspike interval (thick vertical bars).
Table 1.
Update latencies in individual recording sessions
| Rat | Delay (msec) | Trials | |
|---|---|---|---|
| Firing rate increase | 1 | 83 ± 22 | 8 |
| 1 | 74 ± 5 | 5 | |
| 1 | 75 ± 21 | 5 | |
| 3 | 70 ± 21 | 5 | |
| 3 | 167 ± 20 | 8 | |
| 4 | 86 ± 51 | 4 | |
| (All | 92 ± 64 | 44) | |
| Firing rate decrease | 1 | 90 ± 17 | 7 |
| 1 | 141 ± 41 | 4 | |
| 3 | 142 ± 34 | 5 | |
| 4 | 100 ± 13 | 3 | |
| 4 | 96 ± 38 | 4 | |
| (All | 117 ± 80 | 31) |
HD cells providing data suitable for analyses (as described in Materials and Methods) recorded during three or more trials within the same session were selected for each rat. Single-trial estimates of update latencies were then computed. Average latencies (±SEM) are displayed for each rat and each session. Average latencies computed over all trials are also shown for reference (including trials from sessions in which only one or two trials were analyzable; two outliers were removed). These were consistent with estimates obtained from cumulative response histograms.
Discussion
These results show that in HD cells of the anterodorsal thalamic nucleus, preferred direction updates, a likely basis for reorientation processes, benefit from very rapid processing of visual signals. Neural network simulations (Zhang, 1996) predict that after changes in the visual scene, the firing rates of the newly activated cells reach their maximum at latencies on the order of several hundreds of milliseconds. The present results reveal markedly briefer delays. However, all existing models of HD cells use rate code neurons rather than spiking neurons which would provide more veridical models of the dynamical properties of biological neural circuits. In neural networks with spiking neurons, state transitions can occur almost instantaneously (Brunel et al., 2001), consistent with the present results.
Our work sheds light on the nature of the dynamics of the ensemble response of HD cells to reorienting stimuli. Neural network models have described the ensemble activity profile of HD cells as a “hill” of excitation (attractor state) encoding the current directional heading (Redish et al., 1996; Zhang, 1996; Goodridge and Touretzky, 2000) (cf.Droulez and Berthoz, 1991). Whether this activity profile responds to rapid visual reorientation by traveling toward a new preferred direction (Fig. 4B) or by jumping abruptly to it (Fig. 4C) has been unresolved until now (Taube, 1998). The rapid transient response (80 ± 10 msec for a 90° reorienting signal, including retinothalamic transmission time) observed in our experiment appears to support the abrupt shift model rather than the hypothesis of a pulse of activity moving to the new distal state by passing through all cells selective for the intermediate heading angles. However, it is likely that the state transition dynamics depend more generally on the magnitude of the angle of rotation (Zhang, 1996), as well as on other factors such as the efficacy of the orienting cue or the complexity of the visual scene. The longer latency observed here when the directional firing rates returned to baseline (140 msec) is consistent with the notion that recurrent inhibition triggering this decrease in firing rates would occur after the increase in overall activity within the HD cell network (illustrated in Fig. 4C where the left hill decreases more slowly than the right hill increases).
Fig. 4.

Two possible mechanisms for dynamic updating in continuous attractor networks. A, Network connectivity. Each cell (circle) sends excitatory signals (triangles) to its neighbors and inhibitory signals (bars) to all of the cells in the network (for clarity, only the connections from one prototypic cell are shown). B, Progressive updating of the ensemble response of the HD system. The firing rate of each formal cell is proportional to the height of the vertical bar. The hill of activity migrates progressively to the target population. C, Abrupt updating of the ensemble response. The hill of activity jumps to the target firing pattern without activation of intermediate neurons.
Previous neurophysiological studies addressing this question failed to reveal the striking rapidity reported here because the experimental protocols did not permit measures of dynamic changes of <1 sec (Knierim et al., 1998; Zugaro et al., 2000). The very short latencies observed are consistent with the fact that anterodorsal thalamic nucleus receives direct projections from the retina (Itaya et al., 1981; Ahmed et al., 1996) as well as indirect projections from the visual cortex via the postsubiculum (Vogt and Miller, 1983) and the retrosplenial cortex (Reep et al., 1994), and that visual stimulation of the retina evokes field potentials in the primary visual cortex with delays as brief as 40 msec (Galambos et al., 2000).
These experimental observations and theoretical considerations provide a plausible mechanism underlying the capacity to rapidly reorient in a familiar environment. They may also provide a new paradigm to study the deficits of this capacity in aging or in a number of neurological disorders.
Footnotes
This work was supported by the Centre National de la Recherche Scientifique-National Science Foundation cooperation program, Centre National d'Etudes Spatiales, Action Concertée Incitative du Ministère de la Recherche, Cogniseine, Groupement d'Intérêts Scientifique. M.B.Z. received a grant from the Fondation pour la Recherche Médicale. We thank N. Brunel for comments on this text, F. Maloumian for illustrations, M.-A. Thomas and S. Doutremer for histology, and L. Hazan for help with experiments.
Correspondence should be addressed to S. I. Wiener, CNRS–Collège de France LPPA, 11 place Marcelin Berthelot, 75231 Paris Cedex 05, France. E-mail:sidney.wiener@college-de-france.fr.
References
- 1.Ahmed AK, Guison NG, Yamadori T. A retrograde fluorescent-labeling study of direct relationship between the limbic (anterodorsal and anteroventral thalamic nuclei) and the visual system in the albino rat. Brain Res. 1996;729:119–123. doi: 10.1016/s0006-8993(96)00283-1. [DOI] [PubMed] [Google Scholar]
- 2.Blair HT, Sharp PE. Visual and vestibular influences on head-direction cells in the anterior thalamus of the rat. Behav Neurosci. 1996;110:643–660. doi: 10.1037//0735-7044.110.4.643. [DOI] [PubMed] [Google Scholar]
- 3.Blair HT, Cho J, Sharp PE. The anterior thalamic head-direction signal is abolished by bilateral but not unilateral lesions of the lateral mammillary nucleus. J Neurosci. 1999;19:6673–6683. doi: 10.1523/JNEUROSCI.19-15-06673.1999. [DOI] [PMC free article] [PubMed] [Google Scholar]
- 4.Brunel N, Chance FS, Fourcaud N, Abbott LF. Effects of synaptic noise and filtering on the frequency response of spiking neurons. Phys Rev Lett. 2001;86:2186–2189. doi: 10.1103/PhysRevLett.86.2186. [DOI] [PubMed] [Google Scholar]
- 5.Droulez J, Berthoz A. A neural network model of sensoritopic maps with predictive short-term memory properties. Proc Natl Acad Sci USA. 1991;88:9653–9657. doi: 10.1073/pnas.88.21.9653. [DOI] [PMC free article] [PubMed] [Google Scholar]
- 6.Friedman HS, Priebe CE. Estimating stimulus response latency. J Neurosci Methods. 1998;83:185–194. doi: 10.1016/s0165-0270(98)00075-2. [DOI] [PubMed] [Google Scholar]
- 7.Galambos R, Szabo-Salfay O, Barabas P, Palhalmi J, Szilagyi N, Juhasz G. Temporal distribution of the ganglion cell volleys in the normal rat optic nerve. Proc Natl Acad Sci USA. 2000;97:13454–13459. doi: 10.1073/pnas.240448697. [DOI] [PMC free article] [PubMed] [Google Scholar]
- 8.Goodridge JP, Touretzky DS. Modeling attractor deformation in the rodent head-direction system. J Neurophysiol. 2000;83:3402–3410. doi: 10.1152/jn.2000.83.6.3402. [DOI] [PubMed] [Google Scholar]
- 9.Goodridge JP, Dudchenko PA, Worboys KA, Golob EJ, Taube JS. Cue control and head direction cells. Behav Neurosci. 1998;112:749–761. doi: 10.1037//0735-7044.112.4.749. [DOI] [PubMed] [Google Scholar]
- 10.Itaya SK, Van Hoesen GW, Jenq CB. Direct retinal input to the limbic system of the rat. Brain Res. 1981;226:33–42. doi: 10.1016/0006-8993(81)91081-7. [DOI] [PubMed] [Google Scholar]
- 11.Khabbaz A, Fee MS, Tsien JZ, Tank DW. A compact converging-electrode microdrive for recording head direction cells in mice. Soc Neurosci Abstr. 2000;26:984. [Google Scholar]
- 12.Knierim JJ, Kudrimoti H, McNaughton BL. Interaction between idiothetic cues and external landmarks in the control of place cells and head direction cells. J Neurosci. 1998;18:425–446. doi: 10.1152/jn.1998.80.1.425. [DOI] [PubMed] [Google Scholar]
- 13.Muir GM, Taube JS. Firing properties of head direction cells, place cells, and theta cells in the freely moving chinchilla. Soc Neurosci Abstr. 2002;32:584.4. [Google Scholar]
- 14.Ranck JB., Jr Head-direction cells in the deep cell layers of dorsal presubiculum in freely moving rats. Soc Neurosci Abstr. 1984;10:599. [Google Scholar]
- 15.Redish AD. Beyond the cognitive map: from place cells to episodic memory. MIT; Cambridge, MA: 1999. [Google Scholar]
- 16.Redish AD, Elga AN, Touretzky DS. A coupled attractor model of the rodent head direction system. Network. 1996;7:671–685. [Google Scholar]
- 17.Reep RL, Chandler HC, King V, Corwin JV. Rat posterior parietal cortex: topography of corticocortical and thalamic connections. Exp Brain Res. 1994;100:67–84. doi: 10.1007/BF00227280. [DOI] [PubMed] [Google Scholar]
- 18.Robertson RG, Rolls ET, Georges-Francois P, Panzeri S. Head direction cells in the primate pre-subiculum. Hippocampus. 1999;9:206–219. doi: 10.1002/(SICI)1098-1063(1999)9:3<206::AID-HIPO2>3.0.CO;2-H. [DOI] [PubMed] [Google Scholar]
- 19.Seal J, Commenges D, Salamon R, Bioulac B. A statistical method for the estimation of neuronal response latency and its functional interpretation. Brain Res. 1983;278:382–386. doi: 10.1016/0006-8993(83)90279-2. [DOI] [PubMed] [Google Scholar]
- 20.Stackman RW, Taube JS. Firing properties of head direction cells in the rat anterior thalamic nucleus: dependence on vestibular input. J Neurosci. 1997;17:4349–4358. doi: 10.1523/JNEUROSCI.17-11-04349.1997. [DOI] [PMC free article] [PubMed] [Google Scholar]
- 21.Taube JS. Head direction cells recorded in the anterior thalamic nuclei of freely moving rats. J Neurosci. 1995;15:70–86. doi: 10.1523/JNEUROSCI.15-01-00070.1995. [DOI] [PMC free article] [PubMed] [Google Scholar]
- 22.Taube JS. Head direction cells and the neurophysiological basis for a sense of direction. Prog Neurobiol. 1998;55:1–32. doi: 10.1016/s0301-0082(98)00004-5. [DOI] [PubMed] [Google Scholar]
- 23.Vogt BA, Miller MW. Cortical connections between rat cingulate cortex and visual, motor, and postsubicular cortices. J Comp Neurol. 1983;216:192–210. doi: 10.1002/cne.902160207. [DOI] [PubMed] [Google Scholar]
- 24.Wiener SI. Spatial and behavioral correlates of striatal neurons in rats performing a self-initiated navigation task. J Neurosci. 1993;13:3802–3817. doi: 10.1523/JNEUROSCI.13-09-03802.1993. [DOI] [PMC free article] [PubMed] [Google Scholar]
- 25.Zhang K. Representation of spatial orientation by the intrinsic dynamics of the head-direction ensemble: a theory. J Neurosci. 1996;16:2112–2126. doi: 10.1523/JNEUROSCI.16-06-02112.1996. [DOI] [PMC free article] [PubMed] [Google Scholar]
- 26.Zugaro MB, Tabuchi E, Wiener SI. Influence of conflicting visual, inertial and substriatal cues on head direction cell activity. Exp Brain Res. 2000;133:198–208. doi: 10.1007/s002210000365. [DOI] [PubMed] [Google Scholar]
- 27. Zugaro MB, Berthoz A, Wiener SI. Background, but not foreground, spatial cues are taken as references for head direction responses by rat anterodorsal thalamus neurons. J Neurosci 21 2001a. RC154(1–5). [DOI] [PMC free article] [PubMed] [Google Scholar]
- 28.Zugaro MB, Tabuchi E, Fouquier C, Berthoz A, Wiener SI. Active locomotion increases peak firing rates of anterodorsal thalamic head direction cells. J Neurophysiol. 2001b;86:692–702. doi: 10.1152/jn.2001.86.2.692. [DOI] [PubMed] [Google Scholar]