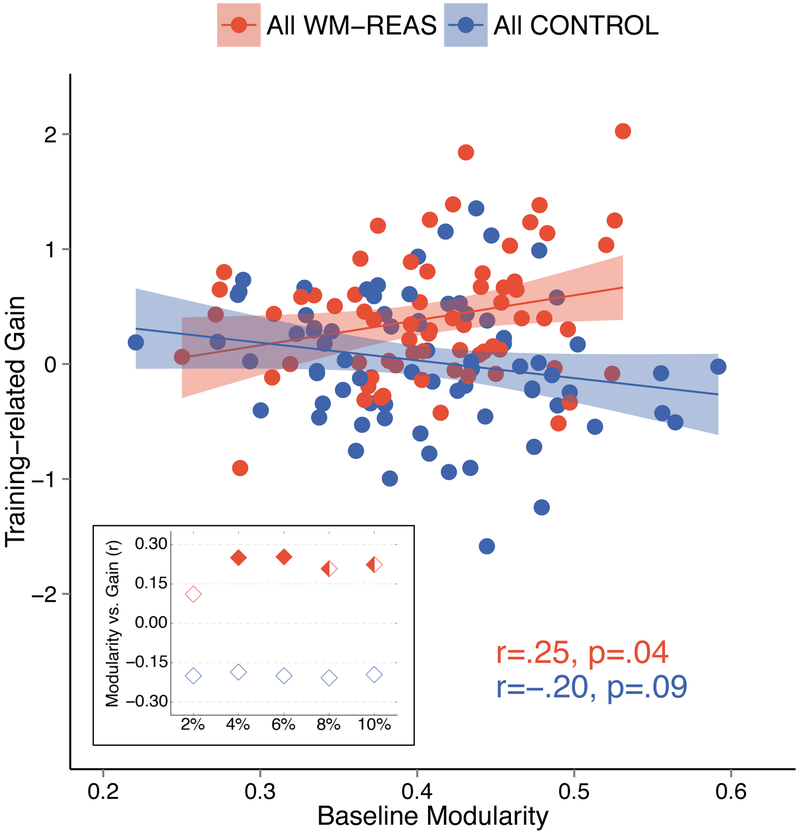
Figure 2.
Relationship between baseline modularity (6% threshold) and training-related gain. Shown is the Pearson’s coefficient (r) and the two-tailed p-value. Shaded areas represent 95% confidence region of the regression line. Inset: Correlation (Pearson’s coefficient) between baseline modularity and training-related gain for each tested threshold. Solid diamonds indicate where the effect was significant at p<.05, two-tailed. Half-solid diamonds indicate where the effect was significant at p<. 10, two-tailed.

