Abstract
Purpose.
The Activity Inventory (AI) is an adaptive visual function questionnaire that consists of 459 Tasks nested under 50 Goals that in turn are nested under three Objectives. Visually impaired patients are asked to rate the importance of each Goal, the difficulty of Goals that have at least some importance, and the difficulty of Tasks that serve Goals that have both some importance and some difficulty. Consequently, each patient responds to an individually tailored set of questions that provides both a functional history and the data needed to estimate the patient’s visual ability. The purpose of the present article is to test the hypothesis that all combinations of items in the AI, and by extension all visual function questionnaires, measure the same visual ability variable.
Methods.
The AI was administered to 1880 consecutively-recruited low vision patients before their first visit to the low vision rehabilitation service. Of this group, 407 were also administered two other visual function questionnaires randomly chosen from among the Activities of Daily Living Scale (ADVS), National Eye Institute Visual Functioning Questionnaire (NEI VFQ), 14-item Visual Functioning Index (VF-14), and Visual Activities Questionnaire (VAQ). Rasch analyses were performed on the responses to each VFQ, on all responses to the AI, and on responses to various subsets of items from the AI.
Results.
The pattern of fit statistics for AI item and person measures suggested that the estimated visual ability variable is not unidimensional. Reading-related and other items requiring high visual resolution had smaller residual errors than expected and mobility-related items had larger residual errors than expected. The pattern of person measure residual errors could not be explained by the disorder diagnosis. When items were grouped into subsets representing four visual function domains (reading, mobility, visual motor, visual information), and separate person measures were estimated for each domain as well as for all items combined, visual ability was observed to be equivalent to the first principal component and accounted for 79% of the variance. However, confirmatory factor analysis showed that visual ability is a composite variable with at least two factors: one upon which mobility loads most heavily and the other upon which reading loads most heavily. These two factors can account for the pattern of residual errors. High product moment and intraclass correlations were observed when comparing different subsets of items within the AI and when comparing different VFQs.
Conclusions.
Visual ability is a composite variable with two factors; one most heavily influences reading function and the other most heavily influences mobility function. Subsets of items within the AI and different VFQs all measure the same visual ability variable.
Keywords: low vision, Rasch analysis, outcome measure
Numerous visual function questionnaires (VFQ) have been offered over the past two decades that are designed to measure various aspects of vision-related quality of life (QoL).1–3 The various VFQs differ from one another in item content, number of items, number and nature of response categories, and phrasing (and/or language) of items and responses. Several VFQs divide their items into subscales or domains with the aim of packaging measures of different QoL variables into a single instrument.4 Most VFQ developers claim to have validated their instruments by presenting evidence of correlations with other measures (e.g., visual acuity), segregation of respondents into expected categories, response reliability, and more recently, agreement with expectations of axiomatic measurement models (i.e., Rasch analysis5).1,3
The proliferation of VFQs could continue indefinitely, or at least until editors and readers grow weary of the enterprise. Each new VFQ presumably measures something different from or better than its predecessors. But, it is rare when a developer directly addresses the questions of how the newly proffered VFQ is unique or represents an improvement over the existing inventory of VFQs and whether or not the new VFQ actually realizes an advance in technology. The development of VFQs has been driven largely by the practical, immediate, and often parochial needs of patient-centered and evidence-based health care research and practice.
Although existing VFQs have a fixed number of items, VFQ developers have recognized that not all items are relevant to all respondents. Consequently, most VFQs permit respondents to skip items, either based on responses to screening questions,6 or by permitting them to respond that the item is not applicable or they do not do the activity described in the item for reasons other than vision.7 Skipped items translate to missing data, which pose serious problems for VFQs when conventional Likert-type scoring algorithms are used.8 The problem of missing data can be circumvented using scoring methods based on Rasch analysis.9 But, if Rasch analysis is employed, then that begs the question of why use fixed-item VFQs at all? Within the framework of Rasch measurement theory, the trait of the respondent that one is attempting to measure is independent of the items and response categories. Therefore, it should not matter which items are presented to the subject, and the most efficient measurement strategy would employ adaptive testing,10 like that used in modern automated perimeters.
Activity Inventory
Several years ago, we developed and validated an adaptive VFQ called the Activity Inventory (AI).11–13 The AI has a hierarchical structure based on a theoretical framework we call the Activity Breakdown Structure (ABS).11–14 The ABS views the visually impaired patient’s life state as a constellation of activities. Patients differ from one another in terms of the importance and difficulty of different activities.
At the most primitive level of the ABS, specific cognitive and motor activities (e.g., sew a hem) are identified as “Tasks.” Theoretically, the difficulty of performing a Task depends both on the person’s ability and on the ability level demanded by the Task. The difference between these two variables is functional reserve.11,14,15 If the person’s ability far exceeds the ability level required by the Task, and therefore functional reserve is high, we expect the person to report that the Task is easy to perform. At the other extreme, if the ability level required by the Task far exceeds the ability of the person, and therefore functional reserve is negative, we expect the person to report that the Task is impossible to perform. These extreme examples illustrate the idea that when people are asked to rate the difficulty of Tasks, they actually are assigning a rating to the magnitude of their personal functional reserve for each Task. In principle, to make measurement possible, the ability level required by the Task must be independent of the ability of the person.
At the next level of the ABS, Tasks have “Goals”—Tasks are performed for a reason. For example, to achieve the Goal of managing one’s personal finances, it is necessary to perform several Tasks in a coordinated manner, such as reading bills, writing checks, and using a computer. The list of Tasks customarily performed to achieve a Goal can vary from person to person. Therefore, in the AI the respondent must specify whether or not a Task is applicable to the parent Goal before rating its difficulty. Tasks are not necessarily performed for just one reason, they can serve several different Goals. The perceived difficulty of a Task might vary with the Goal it is serving, depending on the performance requirements of the Goal.
Besides organizing Tasks under the Goals they serve, Tasks also can be grouped according to the type of function required.16,17 We, like others, have identified four classes of function: reading, visual motor (also called manipulation), visual information (also called seeing), and mobility.13 If a person is unable to perform applicable Tasks with customary ease, we say that person is experiencing functional limitations.
The importance of Goals varies between individuals depending on lifestyle, knowledge and skills, availability of resources, and personal preferences. For example, the Goal of cooking daily meals might be important to people living alone, but not important to people who are living with others and expect meals to be prepared by another person. The difficulty of achieving a Goal must depend on some combination of the difficulties of performing Tasks that serve that Goal.13 If a person has abnormal difficulty achieving, or cannot achieve important Goals, we say that person is experiencing disabilities (called activity limitations in the World Health Organization International Classification of Functioning, Disability, and Health [WHO ICF] system16).
At the highest level of the ABS, Goals serve Objectives. Objectives frame Goals and give them importance based on expectations of society. For example, certain Goals must be achieved to live independently, other Goals must be achieved to be employed at a job. Objectives also can influence the perceived difficulty of achieving Goals because of performance standards imposed on Goals by others. If disabilities make it difficult or impossible to achieve Objectives, we say the person is experiencing handicaps (called participation limitations in the WHO ICF system16).
In its current configuration, the AI consists of a list of 50 Goals nested under three Objectives (Daily Living, Social Interactions, Recreation). Approximately 460 Tasks are nested under the 50 Goals. The AI is administered adaptively by computer-assisted interview. First the respondent is asked to choose from among four ordered response categories and rate the importance of the first Goal (not important, slightly important, moderately important, or very important). If the Goal is rated not important, then the interviewer moves on to the next Goal, otherwise the respondent is asked to rate the difficulty of the Goal using one of five ordered response categories (not difficult, slightly difficult, moderately difficult, very difficult, or impossible). If the Goal is rated not difficult, then the interviewer moves on to the next Goal, otherwise the respondent is asked to rate the difficulty of each of a list of subsidiary Tasks (using the same response categories as used to rate Goal difficulty) or identify the Task as not applicable. Because of the response contingencies, each person receives a custom-tailored VFQ that elicits a structured functional history (a demonstration of the complete AI is available online at www.lowvisionproject.org).
The psychometric properties of the AI were evaluated with Rasch analysis of the responses of 600 low vision patients.12,13 That earlier study found that visual ability measures estimated from difficulty ratings of Goals agreed with visual ability measures estimated from difficulty ratings of Tasks.13 The study also demonstrated that the required ability of Goals was well-described by the average required ability of the subsidiary Tasks. Analysis of the fit statistics for both Goals and Tasks provided evidence of a two-dimensional structure to the vision disability variable. Based on factor analysis of functional ability measures that were estimated from subsets of Tasks, the earlier study concluded that reading function loaded heavily onto one of the dimensions and mobility function loaded heavily onto the other. Visual ability, which was estimated from all difficulty ratings of Tasks, corresponded to the principal component and accounted for 80% of the variance.
Because of its adaptive nature, the AI has practical value to the clinician. It can be used to take a structured and detailed functional history tailored to individual patients in a way that their responses still can be used effectively to estimate a quantitative measure of functional ability. It has not been our intent to create another new measure, but to offer a new measurement strategy. Consequently, the aim of the present study is to determine if the AI measures the same visual ability construct that is measured by other VFQs, and if so, to equate the AI scale with the scales of other VFQs. A secondary aim is to determine if the originally observed two-dimensional structure of visual ability can be confirmed in a larger independent sample of low vision patients.
METHODS
Subjects
The AI was administered to 1880 consecutively-recruited low vision patient subjects before their first visit to the Wilmer Low Vision Rehabilitation Service. None of these subjects were included in the sample of low vision patients described in a previous report.12 All subjects signed a HIPAA waiver and a written informed consent, both of which were read to them by clinic staff. The study was approved by the Johns Hopkins IRB and adhered to the tenets of the Declaration of Helsinki.
Subjects ranged in age from 18 to 100 years (mean age = 68 years) and 59% were women. Disorder diagnoses were distributed as follows: 39% age-related macular degeneration; 15% glaucoma; 14% diabetic retinopathy; 8% retinal detachments; 7% optic atrophy; 5% stroke or brain injury; 4% inherited retinal degenerations; 3% refractive disorders; 1% corneal disorders; 1% ocular injuries; 3% other miscellaneous disorders. Habitual binocular visual acuity ranged from 20/14 to no light perception (median = 20/60; mean of measured acuities = 0.56 log MAR; standard deviation, SD = 0.45 log MAR).
Procedures
The AI was administered by computer-assisted telephone interview. Subjects began by rating the importance of being able to achieve the first Goal without the assistance of another person. The importance response categories were: “not important,” “somewhat important,” “moderately important,” and “very important.” If the subject responded “not important,” then the interviewer moved on to the next Goal. If the Goal was rated with any other importance category, then the subject was asked to rate the difficulty of achieving the Goal without the assistance of another person. The difficulty response categories were: “not difficult,” “somewhat difficult,” “moderately difficult,” “very difficult,” and “impossible.” If the subject responded “not difficult,” then the interviewer moved on to the next Goal. If the subject rated the Goal as having some level of difficulty, then the subject was asked to rate the difficulty of each Task nested under that Goal, or to identify the Task as “not applicable.” The response categories for Task difficulty ratings were the same as the response categories for Goal difficulty ratings. Because of the adaptive nature of the interview, each subject received an individualized set of items out of a pool of 50 Goals and 459 Tasks. Each subject was asked to rate the importance of all 50 Goals, rate the difficulty only of Goals that were at least somewhat important, and rate the difficulty only of Tasks that fell under Goals that were at least somewhat important and somewhat difficult.
In a second telephone interview within 2 weeks of the first and before the patient’s scheduled first visit to the low vision service, a consecutive series subset of 407 of the 1880 subjects also were administered two of four other VFQs: ADVS,6 NEIVFQ-25 plus supplement,18 VAQ,19 and VF-14.7 The ADVS, VF-14, and part 2 of the NEI VFQ employ difficulty ratings of items with five ordered response categories. The NEI VFQ also has a mixture of response categories for various sets of items in other parts of the instrument. Responses to items in the NEI VFQ that had more than five-response categories and to items that were unrelated to vision (e.g., general health) were censured from the database before analysis (see Ref. 20 for details of item censuring). The VAQ requires subjects to respond with a rating of how frequently the item applies to them using five ordered response categories. In the analysis, all rating responses for the different instruments were treated as being equivalent. For these 407 subjects, the order in which the AI and two VFQs were administered was randomized. The choice of VFQ pairs for each subject was determined by a random allocation table that did a sequential random deal of all possible pairings to achieve sample size balance for each pair of instruments. The order of VFQ administration was also randomized within each pair. The characteristics of this subset of subjects are described in another article.20
Several sets of Rasch analyses were performed on the difficulty ratings by the 1880 low vision subjects of Goals and Tasks in the AI. The first analysis was performed on all Goals and Tasks combined; the second set of analyses was on all Goals and Tasks separately; the third set consisted of a separate analysis on each subset of Goals under each of the three Objectives; the fourth set was a separate analysis of each subset of Tasks under each of the three Objectives; and the fifth set was a separate analysis of each of the subsets of Tasks that made up the four separate functional domains. Rasch analyses also were performed separately on each set of responses of the 407 low vision subjects to the items in the four VFQs.
As of December 2006, there were approximately 40 studies in the literature that employed Rasch analysis with VFQs.20 All of the Rasch analyses in the present study were performed with Winsteps 3.16 (Winsteps, Chicago, IL) using Andrich rating scale model21 and an unconditional maximum likelihood estimation routine. Some studies of VFQs have used Masters’ partial credit model for the Rasch analysis.22 We chose the rating scale model because it assumes that the estimated response thresholds refer only to values of functional reserve and are independent of items and persons. The partial credit model allows response thresholds to vary across items, which interacts with estimations of the item measure. We argue that if response thresholds are allowed to vary across items, then item-specific constructs that are independent of persons must be assumed to influence the use of response categories. That assumption is illogical for a rating scale task and violates the principle of parsimony by inflating the number of degrees of freedom in the model by an additional mI — m — I (where m is the number of response categories and I is the number of items). Bivariate regressions were performed with JMP v5.1 (SAS, Cary, NC), factor analyses were performed with SYSTAT 10 (SPSS, Inc., Chicago, IL), and all other computations were performed with Excel (Microsoft Corporation, Redmond, WA).
RESULTS
Rasch analysis provides estimates of the visual ability of each subject (person measure), the visual ability required by each item (item measure), χ2-like fit statistics [weighted mean square (MNSQ) residuals], response category thresholds, and separation reliabilities (ratio of the true variance in the estimated measures to the observed variance).23 Fig. 1 illustrates histograms of person measures for the 1880 low vision subjects (black bars on the left) in comparison with item measures for the 50 Goals (white bars on the right) and for the 459 Tasks (black bars on the right). The mean person measure is 0.64 logit with a SD of 0.88 logit. The person measure separation reliability is 0.95 (i.e., 5% of the observed variance in the person measure distribution can be attributed to estimation error). The mean item measures are −0.17 logit for Goals (SD = 0.66 logit) and 0.02 logit for Tasks (SD = 0.73 logit). The item measure separation reliability for Goals and Tasks combined is 0.97 (i.e., 3% of the observed variance in the item measure distribution can be attributed to estimation error). Fig. 1 shows that the items in the AI are well targeted for about 75% of the low vision patient sample, but are not well targeted to discriminate among persons with the most visual ability (i.e., there are few items that overlap with the person measure distribution at the top of the scale).
FIGURE 1.
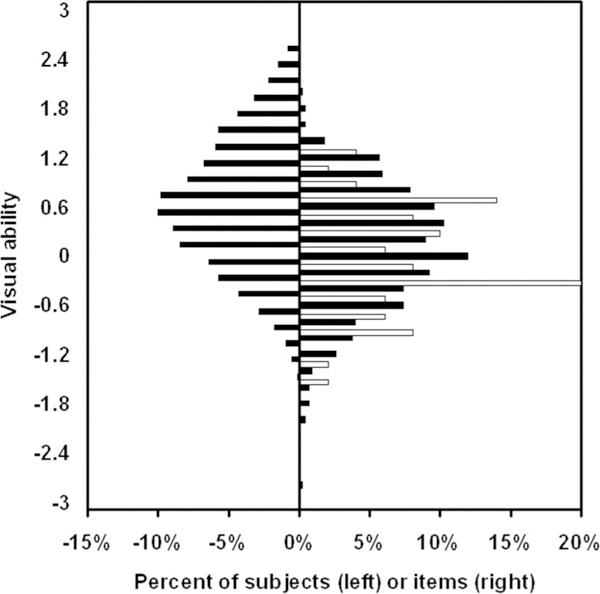
Person-item map that illustrates the relationship between the distribution of person measures (visual ability histogram on the left) and the distribution of item measures (required visual ability histogram on the right). For the item measures, the white bars on the right represent the relative distribution of required visual ability among the 50 Goals and the black bars on the right represent the relative distribution of required visual ability among the 459 Tasks.
Table 1 lists estimates of response thresholds for each of the rating scale categories for the AI. There are three different response thresholds provided. The column labeled step calibrations contains functional reserve values at which the probability of using the particular rating scale is equal to the probability of using the next lower-ranked rating scale. The disordering of step calibrations relative to the ranks of the response categories indicates that the use of some categories is unreliable across subjects. The column labeled Thurstone thresholds contains estimates of functional reserve at which each response category, or a lower-ranked category, would be used at least 50% of the time (i.e., a cumulative response threshold). The column labeled category measure is the sample-free estimate of average functional reserve (i.e., from the Andrich model) across all values of functional reserve. The values in parentheses are 0.25 units in from the estimated extreme values (i.e., when the response to every item is impossible or the response to every item is no difficulty), because the sample-free estimates for the extreme response categories would be infinite. The category measure values can be used to approximate person measure estimates from raw rating scores as described in another article.20 The column labeled infit MNSQ contains a weighted χ2 statistic (based on observed responses relative to responses expected by the Andrich model using the estimated step calibrations) for each response category (see additional discussion below). The expected value of the infit MNSQ is 1.0 (i.e., observed response error variance is equal to the average expected response error variance). Values <1.0 indicate that the observed response error variance is less than expected and values >1.0 indicate that the observed response error variance is greater than expected. All of the infit MNSQ values are acceptably close to 1.0.
TABLE 1.
Rating scale category threshold estimates from Rasch analysis of AI combined Goal and Task difficulty ratings
| Category rank | Category rescore |
Observed count |
Step measure |
Infit MNSQ |
Thurstone threshold |
Category measure |
|---|---|---|---|---|---|---|
| 0 | 4 | 78992 | 0.00 | 1.11 | 0.78 | (−1.98) |
| 1 | 3 | 30304 | 0.41 | 0.93 | 0.33 | −0.62 |
| 2 | 2 | 29760 | 0.20 | 0.94 | −0.10 | −0.08 |
| 3 | 1 | 37925 | −0.61 | 1.05 | −0.96 | −0.62 |
| 4 | 0 | 34159 | None | 0.94 | None | (−1.98) |
The first column contains the rank score of each response category (not difficult = 0 to impossible = 4). The second column is the rescoring of the ranks to reverse the order (so the estimated scale ranges from less to more ability with increasing value of the measure). The third column is the number of times each response category was used across all items and people. The fourth column contains the step calibration for each response category. There is no step for the first category (“impossible”) because functional reserve extends to negative infinity. The fourth column contains the infit mean square for each response category (the expected value is 1.0). The fifth column contains the Thurstone threshold for each response category (i.e., 50% thresholds for cumulative response functions). The sixth column contains the category measure for each response category. For response categories 1–3, the category measure is the sample-free average functional reserve. For the extreme response categories (0 and 4), the category measures are 0.25 logit inside the most extreme functional reserve measures for the sample and denoted with parentheses (because the sample-free average functional reserve is infinite for the extreme categories).
Dimensionality of Visual Ability
Rasch measurement theory is built on the premise that the latent variable, in this case visual ability, is unidimensional and that the person’s visual ability is independent of the visual ability required to satisfy the item content. Furthermore, Rasch measurement theory assumes that the observed variable, in this case the subjects’ ratings for each item, will order the subjects the same way for each item and order the items the same way for each person. This pattern of ordering is called a Guttman scale.8 But, because it is probabilistic, Rasch theory assumes that the required ordering will be disrupted by random errors in the observed variable. This random disordering of the observed responses produces a probabilistic Guttman scale.8,9
Confounding variables introduce biased errors into the Guttman scale (i.e., disordering that exceeds expectations based on random errors). Therefore, if visual ability is not strictly unidimensional, or if other variables contribute to the pattern of the subjects’ responses, then the pattern of observed responses will differ significantly from the expected responses. As described briefly for Table 1, the degree of departure of observed responses from expected responses is captured in a χ2-like statistic called the infit MNSQ. Mathematically, the infit MNSQ is the difference between the observed and expected response squared, averaged across items for individual subjects or averaged across subjects for individual items, divided by the average expected variance in the error across subjects or items, respectively. Because the infit MNSQ is expected to have a χ2 distribution, it can be transformed to a standard normal distribution (mean = 0 and SD = 1) using a Wilson-Hilferty transformation.24
Fig. 2 illustrates a scatter plot of item measures vs. transformed infit MNSQs (z-scores). The vertical dashed lines define the range of infit MNSQs that are within ±2 SD of the expected value. The large gray circles are the individual Goals and the small black circles are the individual Tasks. There appears to be a negative linear trend between the item measures and the infit MNSQ z-score. The correlation coefficient is −0.52 (p < 0.001), which indicates that Goals and Tasks requiring more visual ability have lesser errors than expected by the average error variance and Goals and Tasks requiring less visual ability have greater errors than expected.
FIGURE 2.
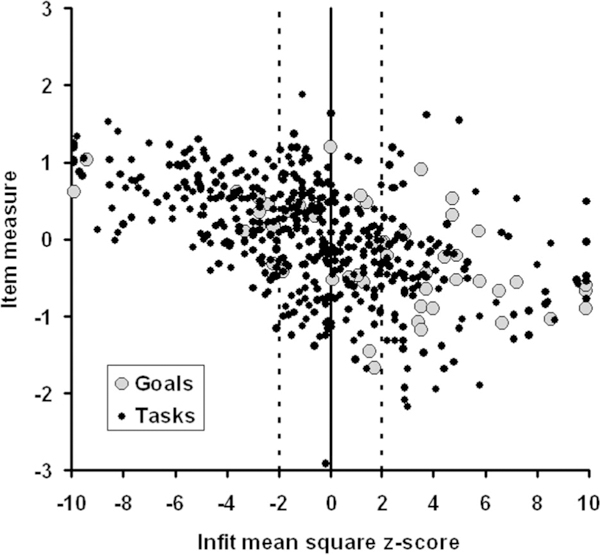
Scatter plot of item measures (ordinate) for AI Goals (large gray circles) and Tasks (small black circles) vs. corresponding infit mean square transformed to a standard normal deviate (z-score) relative to the expected χ2 distribution (abscissa). The expected transformed infit mean square is 0.0 and the expected standard deviation is 1.0. The dashed vertical lines bound the region ±2 SD around the expected value.
Normally results like these would challenge the validity of many of the items and challenge the premise that visual ability is a unidimensional construct. However, before censoring items, we want to try to understand the source of errors and the dimensionality of visual ability. The Goals with the most negative infit z-scores (<–9) are “correspondence” and “read newspaper.” The Tasks with the most negative infit z-scores are “read handwritten mail,” “see photographs,” “read magazine table of contents,” “read news-paper articles,” “read syndicated newspaper column,” “read magazine articles,” “read TV listings,” “read obituaries,” and “read classified adds.” The Goals with the most positive infit z-scores (>9) are “personal health care” and “attend church.” The Tasks with the most positive infit z-scores are “arrange transportation for shopping,” “shave,” “sign your name,” “arrange and use transportation to social functions,” “arrange and use transportation to restaurant,” “arrange and use transportation to an event,” and “arrange and use transportation to place of worship.” Thus, the bestfitting items are primarily reading activities and the worst-fitting items are primarily transportation-related.
Cutting across Goals and Objectives, each of the 459 Tasks was classified as representing one of four types of functional vision: reading, visual motor (i.e., visually guided manipulation17), visual information processing (i.e., seeing16), or mobility. Fig. 3 reproduces the Task data in Fig. 2, but each data point is symbol-coded to denote the functional vision type assigned to the Task. It can be seen that the best-fitting items are reading (black circles) and visual information (asterisks) Tasks. The worst-fitting items are mobility (gray circles) and visual motor (white circles) Tasks. The two worst-fitting reading Tasks (black circles to the farthest right) are “read bathroom scale” (infit z-score = 5.6) and “use credit cards” (infit z-score = 8). The two worst-fitting visual information Tasks (asterisks to the farthest right) are “get server’s attention in a restaurant” (infit z-score = 6.4) and “set alarm clock” (infit z-score = 5.3). The two best-fitting visual motor Tasks (white circles to the farthest left) are “place electronics components” (infit z-score = − 5.9) and “fill out forms” (infit z-score = −5.1). These results suggest that there might be two independent variables influencing subjects’ difficulty ratings of Tasks and Goals. One variable might have its strongest influence on responses to reading Tasks. The other variable might have its strongest influence on responses to mobility Tasks.
FIGURE 3.
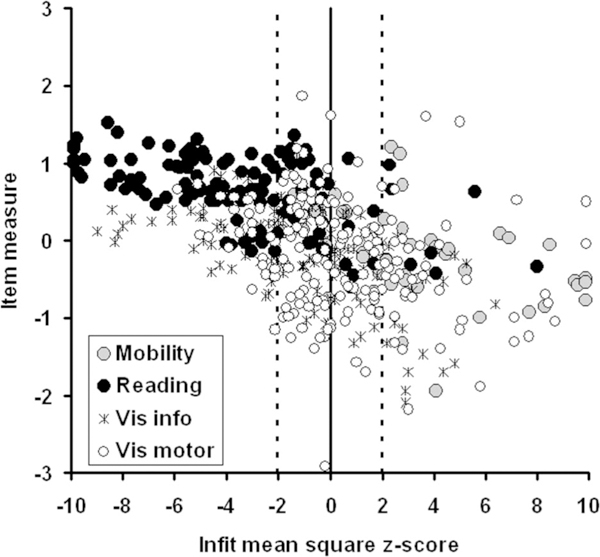
Scatter plot of item measures (ordinate) for AI Tasks vs. infit mean square transformed to a standard normal deviate (z-score) relative to the expected χ2 distribution. Each Task was classified according to visual function: reading (filled circles), visual information (asterisks), visual motor (open circles), or mobility (gray circles).
Rasch analyses were repeated on responses to Tasks in each of the subsets representing the four functional vision domains. Thus, we had five person measures for each subject: visual ability (estimated from responses to all Tasks), reading ability (estimated from responses to reading Tasks), mobility ability (estimated from responses to mobility Tasks), visual information processing ability (estimated from responses to visual information Tasks), and visual motor ability (estimated from responses to visual motor Tasks). A principal components analysis was performed on the five sets of person measures and the eigenvalues were found to be 3.92 for the first principal component and 0.559 for the second principal component. The first principal component accounted for 78% of the variance.
These results indicate that the Task difficulty ratings are dominated by a single variable, visual ability. However, given the pattern of fit statistics, it would appear that visual ability is a composite variable with at least two dimensions. These dimensions would explain the distribution of errors among Tasks. To evaluate this idea, a two-dimensional confirmatory factor analysis, using a maximum likelihood algorithm (principal axis factoring), was performed on the five sets of person measures with varimax rotation to simultaneously maximize the variance on each factor. Fig. 4 illustrates the results in a two-dimensional vector diagram. In this vector diagram, the cosine of the angle between any pair of vectors is equal to the estimated partial correlation in the plane of the two factors. Vector magnitude corresponds to the proportion of variance explained by these two factors (i.e., shorter vectors would require one-third dimension to explain the unaccounted for variance). The dashed line indicates the orientation of the first principal component. Confirming our observations in the earlier study,13 but with a new sample of low vision patients that is three times larger, reading loads most heavily onto factor 1 and mobility loads most heavily onto factor 2. Visual ability (all Tasks) is almost coincident with the first principal component. These results are consistent with the hypothesis that visual ability is a two-dimensional composite variable.
FIGURE 4.
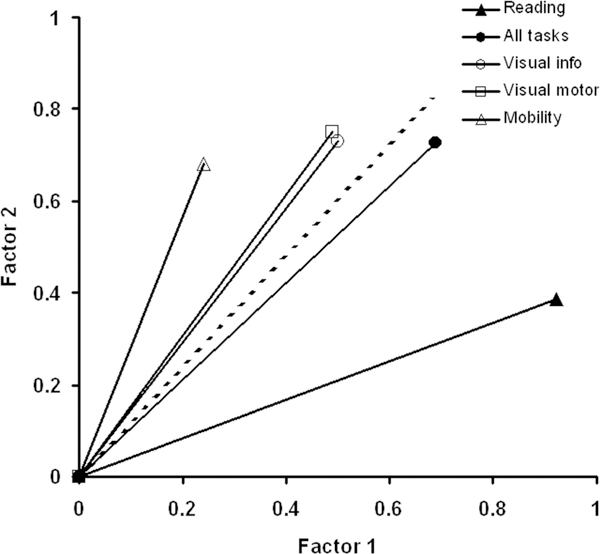
Factor plot for person measures estimated from responses to Tasks in representing different visual functions: reading (solid triangle), visual motor(open square), visual information (open circle), mobility (open triangle), and all Tasks combined for visual ability (filled circles). The cosine of the angle between any pair of vectors corresponds to the partial correlation between those measures when all but these two factors are fixed. The dashed line represents the location of the first principal component.
Visual Ability as a Single Construct
Despite its composite nature, we still can regard visual ability to be a single theoretically constructed variable for the low vision population. Fig. 5 is a scatter plot of person measures for each of the 1880 subjects vs. their infit MNSQ z-scores. The vertical dashed lines bound ±2 SD of the expected value of the infit MNSQ. Sixty-four percent of the subjects fall within ±2SDof the expected value, compared with 95% that would be observed if the distribution were normal. As illustrated in Fig. 6, the person measure infit MNSQ distribution (solid curve) is more platykurtotic (flatter) than the expected Gaussian distribution (dashed curve). The kurtosis for the person measure transformed infit MNSQ distribution is 3.83, compared with an expected value of 1.0 for a normal distribution. Thus, there are a significant number of subjects who have error distributions less than expected (z-score <–2) and a significant number with error distributions greater than expected (z-score >2).
FIGURE 5.
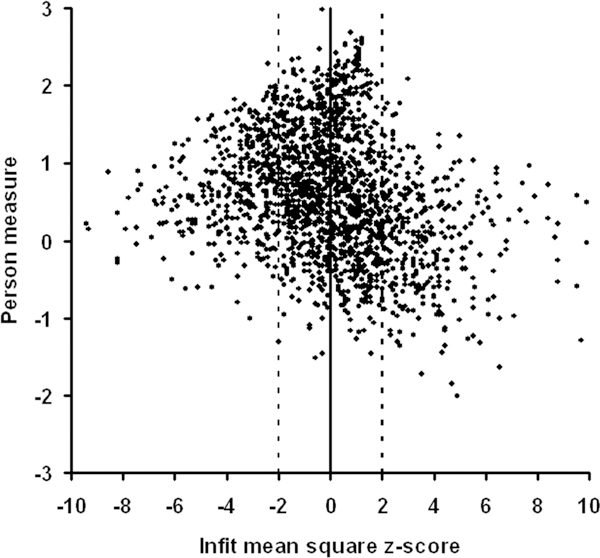
Scatter plot of visual ability person measures estimated from difficulty ratings of AI Goals and Tasks (ordinate) vs. infit mean squares transformed to a standard normal deviate (z-score) for the expected χ2 distribution (abscissa). The vertical dashed lines bound ±2 SD around the expected value of the transformed infit mean square.
FIGURE 6.
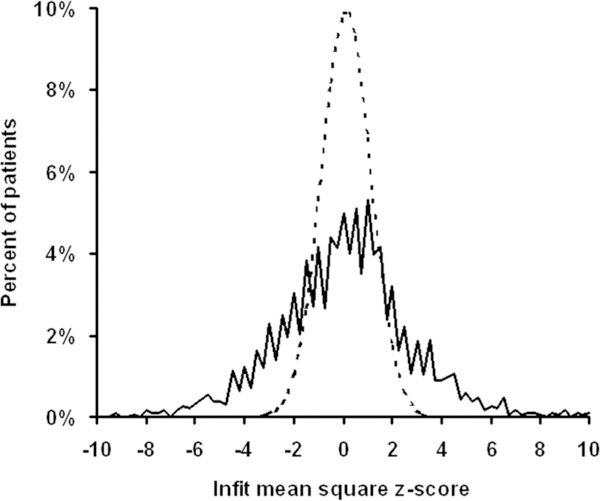
Histogram of transformed infit mean squares plotted in Fig. 5 (solid line) plotted along with the expected standard normal density function (dashed line). The difference between distributions is one of kurtosis (3.83 for the transformed infit mean squares).
One possible explanation for the platykurtosis observed in the person measure infit distribution is differences between diagnostic categories in the nature of visual impairment. For example, because of central vision loss, subjects with age-related macular degeneration might have a different pattern of responses to the Tasks than those of subjects with glaucoma, who experience peripheral vision loss. Fig. 7 re-illustrates the person measure vs. infit MNSQz-score scatter plot comparing the three most prevalent diagnostic categories in this low vision patient sample. Although diagnostic categories might explain the most misfitting subjects (z-score >7), there is no significant differences between z-score distributions for any of these three diagnostic groups of subjects (one-way ANOVA, p > 0.15).
FIGURE 7.
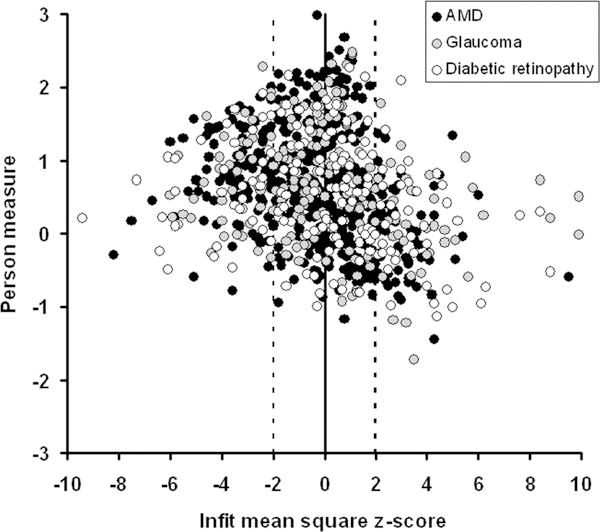
Scatter plot of person measures vs. transformed infit mean squares estimated from difficulty ratings of AI Tasks and Goals. The three most prevalent disorder diagnoses are compared: age-related macular degeneration (black circles), glaucoma (gray circles), and diabetic retinopathy (open circles). There is no significant difference among these diagnostic groups in either visual ability of infit mean square distributions.
If visual ability is a single construct, then it should not matter which items in the AI are used to estimate the person measure, as long as they are not all chosen to be homogeneous with respect to loading on one factor or the other (i.e., not all reading items or all mobility items). Thus, person measures estimated from Goal difficulty ratings should agree with person measures estimated from Task difficulty ratings, and person measures estimated from sub-sets of Goals or Tasks under each Objective should agree with one another. Fig. 8 is a scatter plot of visual ability estimated from responses to Tasks vs. visual ability estimated from responses to Goals. The scales were equated by linear regression on item measures estimated from Rasch analysis of a merged set of responses to Goals and Tasks vs. item measures from separate Rasch analyses of responses to Goals and to Tasks. The solid line in Fig. 8 is the identity line. The Pearson correlation is 0.83 (correlation significant, p < 0.0001).
FIGURE 8.
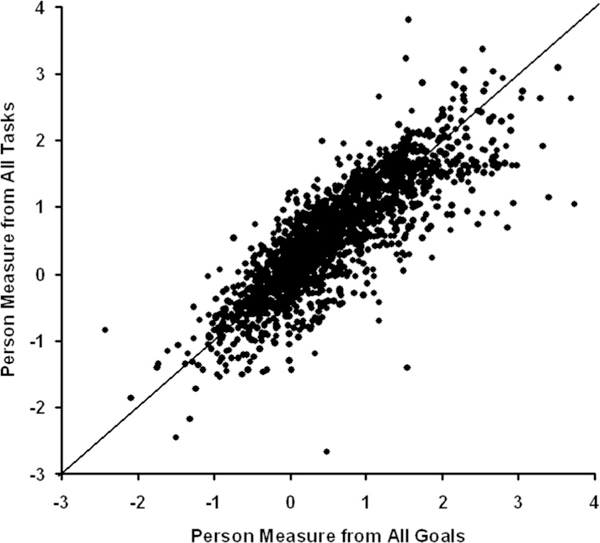
Scatter plot of person measures estimated from difficulty ratings of AI Tasks vs. person measures estimated from difficulty ratings of AI Goals. All of the points would fall on the solid identity line if the two sets of estimates were in perfect agreement.
Fig. 9 compares person measure estimates from difficulty ratings of Goals under each of the three Objectives. The scales were equated using item measure estimates, and the identity line is plotted along with the data in each panel. Fig. 10 similarly compares person measure estimates from difficulty ratings of Tasks under each of the three Objectives. Here too, the scales were equated from item measure estimates, and the identity line is plotted along with the data in each panel. The intraclass correlation is 0.75 for Goals (one-way ANOVA not significant, p = 0.6) and 0.82 for Tasks (one-way ANOVA not significant, p = 0.06). The Pearson correlations are 0.64 (Goals) and 0.79 (Tasks) for Daily Living vs. Social Objectives; 0.73 (Goals) and 0.79 (Tasks) for Daily Living vs. Recreation Objectives; and 0.62 (Goals) and 0.76 (Tasks) for Social vs. Recreation Objectives (all correlations significant p < 0.0001).
FIGURE 9.

Left panel, Scatter plot of person measures estimated from difficulty ratings of the subset of AI Goals that fall under the Social Interactions objective vs. person measures estimated from difficulty ratings of the subset of AI Goals that fall under the Daily Living objective (left panel). All points would fall on the solid identity line if the two sets of measures were in perfect agreement. Middle panel, Similar scatter plot comparing person measures estimated from AI Recreation Goal difficulty ratings vs. Daily Living Goal difficulty ratings. Right panel, Same as the other two panels except comparing person measures estimated from AI Recreation Goal difficulty ratings vs. Social Interactions Goal difficulty ratings.
FIGURE 10.

Same as Fig. 9 but for person measures estimated from subsets of Tasks that fall under each of the three Objectives.
There appears to be a ceiling effect in Fig. 9 for both Social Interaction and Daily Living Goals. The ceiling is occurring for the most able people. These two Objectives contain the least difficult Goals and the ceilings are occurring for the most able people. The maximum estimated person measure is that which corresponds to rating the difficulty of all of the Goals that are at least somewhat important as “not difficult.” The people at each ceiling did just that.
Effects of Multidimensionality on Visual Ability Measures with Adaptive Testing
Because the item measure fit statistics are different for different functional vision domains (Fig. 3), one might expect person measure fit statistics to vary with variations in the relative proportion of reading and mobility tasks low vision subjects are asked to rate. Because the AI is administered adaptively, there is no control over the number of items in each functional vision domain that contribute to the estimation of visual ability for each person. Thus, with visual ability being a composite variable, it is possible that adaptive testing could lead to unknown distortions in the measurement (this important concern was raised by an anonymous reviewer).
If the relative contributions of the two factors illustrated in Fig. 4 to visual ability estimates varied with variations in the combination of items rated by the person, then fit statistics should be correlated with the relative difference between the number of reading items and number of mobility items rated by the person. A factor contribution index was computed for each subject by taking the difference between the number of reading Tasks and the number of mobility Tasks rated by the subject divided by the total number of Tasks rated by the subject. This factor contribution index ranges from 1.0 (if all rated Tasks are reading Tasks) to −1.0 (if all rated Tasks are mobility Tasks). Small values of the factor contribution index indicate balance between reading Tasks and mobility Tasks and/or relatively small numbers of reading and mobility Tasks relative to visual information and visual motor Tasks (which load more equally on the two factors). The average factor contribution index across all subjects is 0.27, indicating that the percent of all rated Tasks that are from the reading domain exceed the percent of all rated Tasks that are from the mobility domain by a difference of 27% (e.g., 37% of all rated Tasks are reading and 10% of all rated Tasks are mobility). This bias toward reading (positive values) is expected because the reading Tasks outnumber the mobility Tasks two to one and represent approximately 22% of all Tasks. The SD of the factor contribution index is 0.16.
As shown by the scatter plot in Fig. 11, there is a slight downward trend in the relation between the factor contribution index and the person measure infit MNSQ (expressed as a z-score). However, the Pearson correlation is −0.18, so the factor contribution index can explain only about 3% of the variability in the transformed infit MNSQ distribution, indicating that the adaptive nature of the AI coupled with the composite nature of the visual ability variable does not lead to distortions in the measurement.
FIGURE 11.
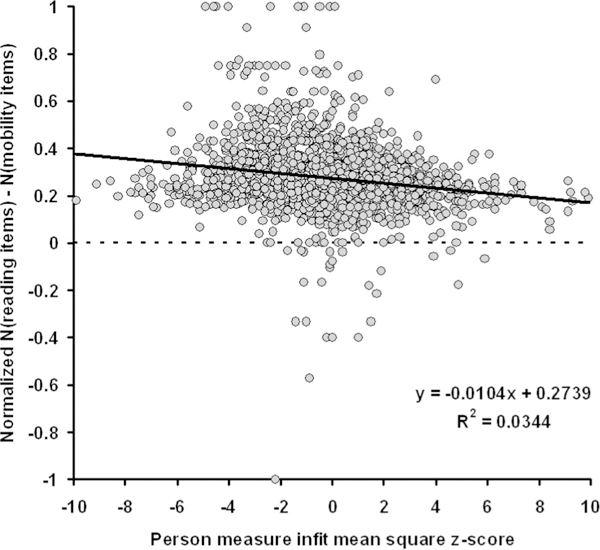
Scatter plot of factor contribution index vs. person measure infit mean square (expressed as a z-score). There is a slight negative correlation (r = −0.17) with the trend represented by the regression line. This trend indicates that worse person measure fit is associated with a greater proportion of mobility TASK items rated by the low vision subject. However, the regression line accounts for only about 3% of the variability in the z-transformed infit mean square distribution.
Comparison of AI Measures to Other VFQ Measures
Like the AI, the VF-14, ADVS, and part 2 of the NEI VFQ employ five ordered categories of difficulty ratings for subject responses. They differ from the AI and from each other in the choice of items that define the instrument. Our working hypothesis is that visual ability is a trait of the person and is independent of the items. The choice of items is expected to have little effect on the measurement, except for linear scaling parameters and accuracy and precision of the estimates. Thus, the hypothesis predicts that measurements of visual ability by different subsets of items within the AI, and by other VFQs that employ difficulty ratings of items, will agree. Many of the items in the NEI VFQ employ other types of response categories, such as level of agreement with a statement, magnitude of a quality (e.g., poor to excellent), and frequency that a statement applies to the respondent. An earlier study showed that these items mapped onto the same visual ability variable, but had poor fit statistics, suggesting that responses to these items were influenced by confounding variables.25 The VAQ also asks subjects to rate the frequency with which the statement in the item applies to them, but for all items. Because the items in the VAQ were crafted to measure the impact of visual impairments on functional ability,19 and because low vision subjects differ from one another in visual ability, we might expect responses to the VAQ to function as measures of visual ability. However, like items on the NEI VFQ that use similar response categories, other variables, such as schedules or lifestyle differences, might influence subject responses in a way that confounds the measurement of visual ability.
Because each of the 407 of the 1880 subjects who responded to a pair of VFQs also responded to the AI, all of the data that were collected as part of this study were merged into a single database keyed to the subject and Rasch analysis was performed on the combined data. Separate Rasch analyses also were performed on the responses to each of the four VFQs (see Ref. 20 for details of item and person measure fit statistics and response thresholds). Bivariate regressions were performed on VFQ item measures estimated from each VFQ analysis vs. corresponding item measures from the merged data analysis and on AI item measures estimated from difficulty ratings of Goals and Tasks vs. the corresponding item measures from the merged data analysis. These regressions were then used to equate person measure estimates from each VFQ to person measure estimates from AI Goal and Task difficulty ratings. Fig. 12 illustrates comparison of person measure estimates from each VFQ to corresponding person measure estimates from the AI on equated visual ability scales. The identity line is plotted along with the data in each panel. The intraclass correlation is 0.71 (one-way ANOVA not significant, p = 0.303). Pearson correlations for each instrument vs. the AI are 0.80 for the ADVS, 0.81 for the NEI-VFQ, 0.67 for the VAQ, and 0.86 for the VF-14.
FIGURE 12.
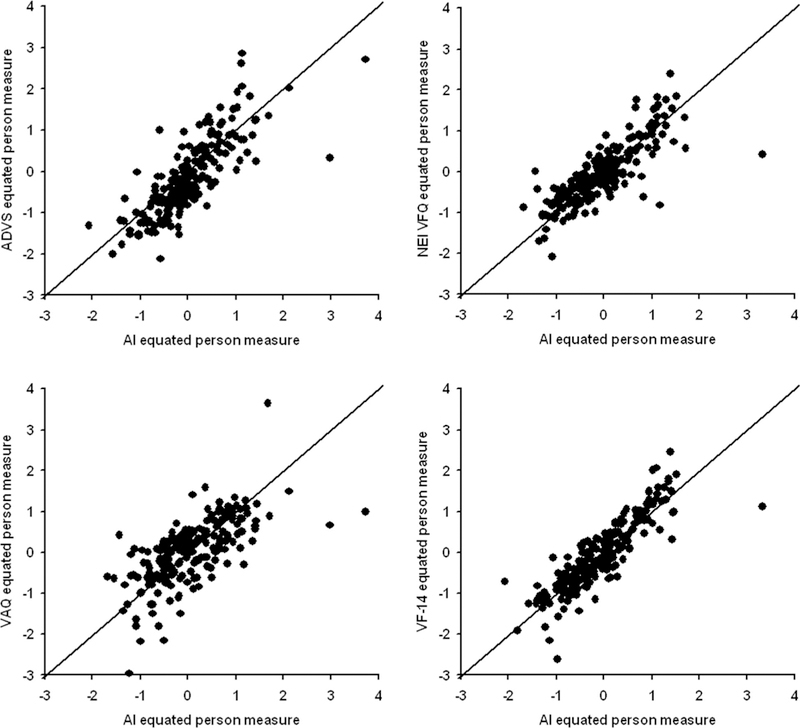
Scatter plots of person measures estimated from ratings of items in each of the four VFQs vs. person measures estimated from difficulty ratings of AI Goals and Tasks: ADVS (upper left panel), NEI VFQ (upper right panel), VAQ (lower left panel), and VF-14 (lower right panel). The solid identity line is plotted along with the data in each panel.
DISCUSSION
The results of the present study support the conclusion that difficulty ratings of various combinations of items describing activities can be used to estimate measures of visual ability that calibrate to a common scale. The results from the NEI VFQ and VAQ demonstrate that this conclusion generalizes beyond difficulty ratings to also include other types of response categories. The results of this study also confirm earlier observations that visual ability is a composite variable that can be factored into two independent dimensions, which helps explain the patterns of errors in Guttman scales for VFQs. In other words, in principle, the choice of items in a VFQ can bias visual ability estimates toward one factor or the other.
One of the major principles of Rasch models is that the variable being measured is unidimensional. Although visual ability has two dimensions, we argue that it functions as if it were unidimensional and therefore should be considered a composite variable. Other examples of composite variables are visual acuity (test distance and stimulus size), optical density (path length and concentration), and speed (distance and time). If the factors of these composite variables are not well controlled, then the underlying independent sources of variability might be manifest in the unidimensional measures of the composite variable. One might argue that if we know that visual ability is two-dimensional, then why not simply measure the two underlying variables separately? First, we do not know precisely what the underlying variables are. Reading loads most heavily on factor 1 but it also has a significant loading on factor 2; vice versa for mobility. Reading and mobility measures are not measures of the two independent factors, they are measures that incorporate both factors. Because of the loading pattern, we can speculate that factor 1 is related to seeing detail (which is disrupted by visual acuity loss) and factor 2 is related to the size of preview areas (which would be disrupted by scotomas and visual field loss). Because of vision enhancement (e.g., magnification) and adaptations (e.g., scanning), the two factors may describe properties of the patient’s ability rather than simply describing properties of the patient’s visual impairment. Second, patients’ disabilities from low vision cover a wide range of activities. The composite description of a low vision patient’s ability to function in everyday life must cover the full gamut to be useful clinically. Fortunately, as illustrated in Fig. 4, the composite visual ability variable is a strong principal component that explains 79% of the variability in person measures. This observation is corroborated by the strong agreement among person measures estimated from different subsets of variables in the AI (Figs.8–10) and from different instruments (Fig. 12). As illustrated in Fig. 11, although there is a weak trend, the potential biasing from the adaptive nature of the AI coupled with the two-dimensional structure of visual ability, does not seriously distort measures of visual ability.
The results summarized in Fig. 12 show that the same visual ability variable is estimated by different VFQs. The product moment correlations between pairs of estimates based on the four VFQs and the AI are strong. Product moment correlations also are strong between Goal and Task-based person measure estimates, between estimates from different subsets of Goals grouped by Objective, and between estimates from different subsets of Tasks, also grouped by Objective. Whereas the product moment correlation is an index of the strength of the linear trend between variables, the intraclass correlation is an index of absolute agreement among estimates. The intraclass correlation is simply the proportion of total observed variance that can be explained by between subject variance. If each subset of items and/or each VFQ were measuring the same visual ability variable in each subject with no errors, then the within subject variability (between measures) would be 0 and the intraclass correlation would be 1.0. If all of the VFQs and/or subsets of items were measuring unrelated phenomena, then the within subject variability would be larger relative to the between subject variability and the intraclass correlation would tend toward zero. Within subject variability accounted for 29% of the total variance when person measures were estimated from Tasks, 40% of the total variance when person measures were estimated from Goals, and 29% of the total variance when person measures were estimated from different VFQs. These high values for the intraclass correlation indicate that all of the tested VFQs and subsets of items in the AI are measuring the same visual ability variable. The relatively greater within subject variance for Goals probably reflects the more general nature of Goals, which allows for a greater range of interpretation by each subject.
The conclusions of our study validate the adaptive nature of the AI and other types of adaptive testing that might be contemplated (e.g., staircase methods10) for estimating visual ability. Given the number of items in the AI, and the robustness of equating scales for instruments with different response categories, it would not be premature to conclude that all visual function questionnaires measure the same visual ability variable. The only substantive differences between VFQs are measurement accuracy (bias away from the principal component toward one factor or the other) and measurement precision (separation reliability in different parts of the visual ability scale). The caveat must be added, however, that this conclusion does not reach beyond the boundaries of visual ability. For example, depression is a variable commonly associated with the population of individuals with vision loss. But, depression differs as a variable from visual ability. Although depression measures in this population may be influenced by visual ability, the two are expected to be separate measures.
In clinical practice, the AI can be helpful to the physician and team members in addressing goal-oriented components of the rehabilitation plan. The AI can serve as a tool to plan rehabilitation, evaluate patient progress, and measure outcomes. Unlike fixed-item VFQs, the AI provides the clinician with patient-specific information that can be used to identify and prioritize patient-centered rehabilitation goals around which the treatment plan can be built and evaluated. Rehabilitation occurs at the Task level, but its effectiveness should be evaluated in terms of preventing or reversing disabilities. Quantitative estimates of functional ability in reading, mobility, visual motor, and visual information processing domains (or other functional domains defined by subsets of Tasks) can be used to measure the efficacy of rehabilitation. Measures of visual ability at the Goal level can be used to measure the effectiveness of rehabilitation.
ACKNOWLEDGEMENTS
This research was supported by Grant EY-012045 from the National Eye Institute, National Institutes of Health, Bethesda, MD.
REFERENCES
- 1.Massof RW, Rubin GS. Visual function assessment questionnaires. Surv Ophthalmol 2001;45:531–48. [DOI] [PubMed] [Google Scholar]
- 2.Vitale S, Schein OD. Qualitative research in functional vision. Int Ophthalmol Clin 2003;43:17–30. [DOI] [PubMed] [Google Scholar]
- 3.de Boer MR, Moll AC, de Vet HC, Terwee CB, Volker-Dieben HJ, van Rens GH. Psychometric properties of vision-related quality of life questionnaires: a systematic review. Ophthalmic Physiol Opt 2004; 24:257–73. [DOI] [PubMed] [Google Scholar]
- 4.Mangione CM, Berry S, Spritzer K, Janz NK, Klein R, Owsley C, Lee PP Identifying the content area for the 51-item National Eye Institute Visual Function Questionnaire: results from focus groups with visually impaired persons. Arch Ophthalmol 1998;116:227–33. [DOI] [PubMed] [Google Scholar]
- 5.Pesudovs K Patient-centred measurement in ophthalmology—a paradigm shift. BMC Ophthalmol 2006;6:25. [DOI] [PMC free article] [PubMed] [Google Scholar]
- 6.Mangione CM, Phillips RS, Seddon JM, Lawrence MG, Cook EF, Dailey R, Goldman L. Development of the ‘Activities of Daily Vision Scale’. A measure of visual functional status. Med Care 1992;30: 1111–26. [DOI] [PubMed] [Google Scholar]
- 7.Steinberg EP, Tielsch JM, Schein OD, Javitt JC, Sharkey P, Cassard SD, Legro MW, Diener-West M, Bass EB, Damiano AM, Steinwachs DM, Sommer A. The VF-14. An index of functional impairment in patients with cataract. Arch Ophthalmol 1994; 112:630–8. [DOI] [PubMed] [Google Scholar]
- 8.Massof RW Likert and Guttman scaling of visual function rating scale questionnaires. Ophthalmic Epidemiol 2004;11:381–99. [DOI] [PubMed] [Google Scholar]
- 9.Massof RW. Application of stochastic measurement models to visual function rating scale questionnaires. Ophthalmic Epidemiol 2005; 12:103–24. [DOI] [PubMed] [Google Scholar]
- 10.Gershon RC. Computer adaptive testing. J Appl Meas 2005;6: 109–27. [PubMed] [Google Scholar]
- 11.Massof RW. A systems model for low vision rehabilitation. II. Measurement of vision disabilities. Optom Vis Sci 1998;75:349–73. [DOI] [PubMed] [Google Scholar]
- 12.Massof RW, Hsu CT, Baker FH, Barnett GD, Park WL, Deremeik JT, Rainey C, Epstein C. Visual disability variables. I. The importance and difficulty of activity goals for a sample of low-vision patients. Arch Phys Med Rehabil 2005;86:946–53. [DOI] [PubMed] [Google Scholar]
- 13.Massof RW, Hsu CT, Baker FH, Barnett GD, Park WL, Deremeik JT, Rainey C, Epstein C. Visual disability variables. II. The difficulty of tasks for a sample of low-vision patients. Arch Phys Med Rehabil 2005;86:954–67. [DOI] [PubMed] [Google Scholar]
- 14.Massof RW. A systems model for low vision rehabilitation. I. Basic concepts. Optom Vis Sci 1995;72:725–36. [DOI] [PubMed] [Google Scholar]
- 15.Kirby RL. The nature of disability and handicap In: Basmajian JV, Kirby RL, eds. Medical Rehabilitation. Baltimore: Williams & Wilkins; 1984:14–18. [Google Scholar]
- 16.World Health Organization. International Classification of Functioning, Disability, and Health. Geneva: WHO; 2001. [Google Scholar]
- 17.Lennie P, Van Hemel SB, eds. Committee on Disability Determination for Individuals with Visual Impairments, Board on Behavioral, Cognitive, and Sensory Sciences, Division of Behavioral and Social Sciences and Education, National Research Council Visual Impairments: Determining Eligibility for Social Security Benefits. Washington, DC: National Academy Press; 2002. [PubMed] [Google Scholar]
- 18.Mangione CM, Lee PP, Gutierrez PR, Spritzer K, Berry S, Hays RD. Development of the 25-item National Eye Institute Visual Function Questionnaire. Arch Ophthalmol 2001;119:1050–8. [DOI] [PubMed] [Google Scholar]
- 19.Sloane ME, Ball K, Owsley C, Bruni JR, Roenker DL. The visual activities questionnaire: developing an instrument for assessing problems in everyday visual tasks In: Noninvasive assessment of the Visual System. OSA Technical Digest, vol 1 Washington DC: Optical Society of America; 1992;26–9. [Google Scholar]
- 20.Massof RW. An interval scaled scoring algorithm for visual function questionnaires. Optom Vis Sci 2007;84:689–704. [DOI] [PubMed] [Google Scholar]
- 21.Andrich D A rating formulation for ordered response categories. Psychometrika. 1978;43:561–73. [Google Scholar]
- 22.Masters GN. A Rasch model for partial credit scoring. Psychometrika 1982;47:149–74. [Google Scholar]
- 23.Bond TG, Fox CM. Applying the Rasch Model: Fundamental Measurement in the Human Sciences. Mahwah, NJ: L. Earlbaum; 2001. [Google Scholar]
- 24.Wilson EB, Hilferty MM. The distribution of chi-square. Proc Natl Acad Sci USA 1931;17:684–8. [DOI] [PMC free article] [PubMed] [Google Scholar]
- 25.Massof RW, Fletcher DC. Evaluation of the NEI visual functioning questionnaire as an interval measure of visual ability in low vision. Vision Res 2001;41:397–413. [DOI] [PubMed] [Google Scholar]


