Abstract
Alterations in Zn2+ concentration are seen in normal tissues and in disease states, and for this reason imaging of Zn2+ is an area of active investigation. Herein, enriched [1-13C]cysteine and [1-13C2]iminodiacetic acid were developed as Zn2+-specific imaging probes using hyperpolarized 13C magnetic resonance spectroscopy. [1-13C]cysteine was used to accurately quantify Zn2+ in complex biological mixtures. These sensors can be employed to detect Zn2+ via imaging mechanisms including changes in 13C chemical shift, resonance linewidth, or T1.
Keywords: imaging agents, zinc, hyperpolarization, 13C MRI, chemical shift
Graphical abstract

Enriched [1-13C]cysteine and [1-13C2]iminodiacetic acid are developed as Zn2+-specific imaging probes using hyperpolarized 13C magnetic resonance spectroscopy. These sensors can be employed to detect Zn2+ via imaging mechanisms including changes in 13C chemical shift, resonance linewidth, or T1. [1-13C]cysteine is able to accurately quantify Zn2+ in complex biological mixtures.
Zinc (Zn2+) is the second most abundant transition metal ion in the human body and plays various structural, regulatory and catalytic functions in physiology.1,2 Multiple methods for the measurement of Zn2+ concentration have been investigated as biomarkers for human disease, including blood and tissue tests, and imaging methods.3 Existing imaging techniques include fluorescence and magnetic resonance-based approaches. Small-molecule fluorescent agents with varying Zn2+ affinities have been used to image live cells4,5,6 Magnetic resonance imaging (MRI) using Zn2+-responsive contrast agents has been proposed as an alternative imaging method that would allow non-invasive high-resolution monitoring of Zn2+ metabolism. Although there has been some success using manganese-derived probes7 and paramagnetic chemical exchange saturation transfer agents,8 most reported Zn2+-responsive MRI agents are gadolinium-based.9,10
Enabled by hyperpolarization techniques such as dynamic nuclear polarization (DNP) and parahydrogen induced polarization (PHIP),11–14 hyperpolarized (HP) probes for in vivo detection of a variety of analytes using HP 13C MRS have been developed.15,16 Hyperpolarized EDTA and EGTA were reported for multi-metal imaging.17 Here, we explored the use of HP 13C MRS for Zn2+-specific imaging. In particular, we identified L-cysteine-1-13C ([1-13C]Cys) and iminodiacetic acid-1-13C2 ([1-13C2]IDA) as candidate probes that demonstrate altered magnetic properties upon binding Zn2+, optimized their polarization parameters, and demonstrated that [1-13C]Cys can accurately measure Zn2+ using 13C HP MRS in phantoms and biological samples (Figure 1A).
Figure 1.
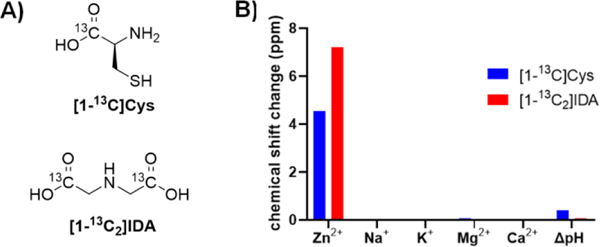
Approach to specific detection of Zn2+ via hyperpolarized magnetic resonance spectroscopy (A) Structures of [1-13C]Cys and [1-13C2]IDA. (B) Specificity of 50 mM [1-13C]Cys and [1-13C2]IDA for physiological cations (present at 1 equivalent). pH-dependence of chemical shift was measured at pH 7.4 and 6.5, the physiologically relevant extracellular range.
We considered the requirements for a potential hyperpolarized Zn2+ imaging probe to include 1) a large change in 13C chemical shift in the presence of Zn2+, 2) good selectivity to Zn2+ over biologically abundant cations such as Ca2+ and Mg2+, 3) insensitivity to changes in pH over the physiologic range, 4) a sufficient T1 relaxation time for MRI, and 5) lack of known or predicted toxicity. We began our study by screening a variety of candidate Zn2+ ligands for their chemical shift response upon Zn2+ binding. Among the 34 tested compounds, 10 ligands demonstrated a chemical shift response to Zn2+ binding. We noted that ligands with logarithm of stability constants of Zn2+ (logK) greater than 6.9 all displayed a chemical shift response to Zn2+ binding, while ligands with logK lower than 5.2 did not have a chemical shift response to Zn2+ binding (SI Table S1). Ligands bearing a soft functional group such as pyridine tended to show a chemical shift response at lower Zn2+ stability constants while ligands with hard functional groups, such as hydroxyl showed a chemical shift response at higher stability constants. Cysteine and iminodiacetic acid were selected for further evaluation because of their large chemical shift response to Zn2+ binding (+4.6 and +7.3 ppm in the presence of equimolar Zn2+, respectively), excellent water solubility, low molecular weight, predicting a long 13C T1, and convenience for 13C labeling. 13C-labeled cysteine was commercially available, and 13C-labeled IDA was synthesized from [1-13C]glycine and [1-13C]methyl bromoacetate in 3 steps with a 32% total yield (Scheme 1). Their specificity for Zn2+ versus other abundant physiologic cations and their sensitivity to pH changes were also tested. Both probes showed excellent specificity for Zn2+ over other main physiologic cations Na+, K+, Ca2+ and Mg2+, and limited chemical shift change over the physiologic pH range of 6.5 to 7.4 (Figure 1B). These preliminary investigations suggested that [1-13C]Cys and [1-13C2]IDA would be specific and sensitive probes for detecting Zn2+ using HP 13C MRI.
Scheme 1.

Synthesis of [1-13C2]IDA disodium salt.
A quantitative method for determining Zn2+ concentration was developed for these probes using NMR. A titration curve was plotted to show the chemical shift difference between [1-13C]Cys and internal standard urea as a function of the Zn2+ to [1-13C]Cys ratio. The peak moved linearly with increasing Zn2+ up to 0.25 equivalents of Zn2+ to [1-13C]Cys. The rate of chemical shift change decreased at higher Zn2+ concentrations (Figure 2A, 2B, SI Table S2, SI equation S1). This suggests that [1-13C]Cys may have multiple Zn2+ binding conformations, as previously reported.18,19 The manifestation of the 13C signal as a single resonance indicates that the on-off rates for Zn2+ binding are rapid, compared with the absolute frequency difference between bound/unbound 13C resonances. A linewidth change with different Zn2+/[1-13C]Cys ratios was also observed. In particular, the linewidth increased significantly at lower Zn2+ concentrations with the widest linewidth being between 0.2 eq and 0.5 eq of [1-13C]Cys, thus demonstrating exchange broadening at different Zn2+/[1-13C]Cys ratios (SI Table S3). The chemical shift change of [1-13C]Cys with equimolar Zn2+ was tested at different temperatures ranging from 20 °C to 50 °C and at various [1-13C]Cys concentrations from 1 mM to 100 mM. These studies showed that the temperature and concentration of [1-13C]Cys (in the presence of equimolar zinc) had little or no influence on the chemical shift response (SI Tables S3 and S4).
Figure 2.
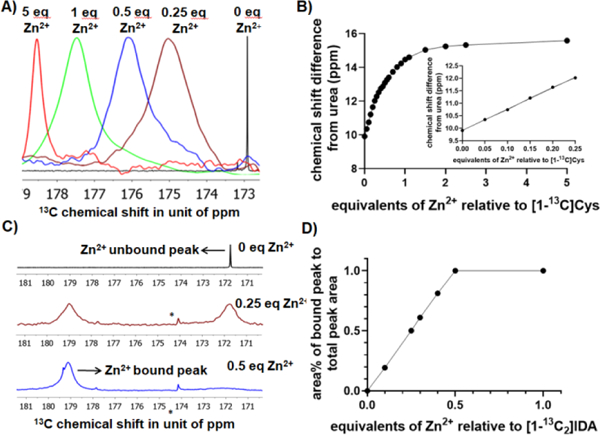
Response of [1-13C]Cys and [1-13C2]IDA to Zn2+ can be detected by several magnetic resonance mechanisms. (A) 13C NMR Spectra for 50 mM [1-13C]Cys with varying Zn2+ concentrations (B) Standard titration curve of [1-13C]Cys in response to various Zn2+ concentrations. The insert shows the titration curve at low Zn2+ equivalents. (C) Spectra for 50 mM [1-13C2]IDA with various Zn2+ concentrations highlighting formation of a Zn2+ bound species, and increased linewidth upon Zn2+ binding. * represents natural abundance citric acid peak (D) Standard titration curve of [1-13C2]IDA.
A similar titration method was utilized for IDA for quantitative determination of Zn2+ concentration. When Zn2+ was added to [1-13C2]IDA, a new resonance at a lower field appeared. The area under the peak (integration) increased linearly with increasing Zn2+ concentration from 0 to 0.5 equivalents of Zn2+ to [1-13C2]IDA, which indicates that [1-13C2]IDA binds to Zn2+ with a 2:1 probe:Zn stoichiometry, as previously reported (Figure 2C, 2D).20 Additionally, the unbound [1-13C2]IDA peak demonstrated increasing line broadening in response to Zn2+ (SI Table S5). It is worth noting that the [1-13C2]IDA:Zn complex appears as two separate peaks while the [1-13C]Cys:Zn complex appears as a single peak, indicating that the on and off rates for [1-13C2]IDA are slower than the frequency difference between bound and unbound resonances and the on and off rates for [1-13C]Cys are more rapid. These results are analogous to prior findings in 15N, 19F, and hyperpolarized 13C pH imaging probe development efforts.21–27 Overall, these data demonstrate that the chemical shift of the 1-13C NMR signal of cysteine and IDA change in a predictable and quantitative manner in response to Zn2+ concentration.
Next, we developed and optimized a hyperpolarization method for 13C labeled [1-13C]Cys and [1-13C2]IDA. For [1-13C]Cys, the optimized preparation was obtained by a mixture of 1.0 eq of [1-13C]Cys, 0.5 eq of 4N HCl and 2.65 eq of glycerol, with 20 mM OX063 radical.28 Using this method, 13.4 ± 0.6% back-calculated polarization was obtained with a polarization time constant of 1227 ± 30 (n = 3). The T1 relaxation time was 36.0 ± 1.8 seconds at a magnetic field of 3T. A Zn2+-dependent decrease in T1 of [1-13C]Cys was observed when polarized [1-13C]Cys was mixed with various equivalents of Zn2+. A T1 of 17.5 seconds was observed when 1 equivalent of Zn2+ was present (Table S6). For [1-13C2]IDA, the optimized preparation included a mixture of 1.0 eq of [1-13C2]IDA disodium salt, 14.0 eq of D2O and 1.8 eq of DMSO, with 15 mM OX063.17 Using this method, 6.6 ± 0.9% (n = 3) back-calculated polarization was obtained with the polarization time constant of 1480 ± 38 (n = 3). The T1 was 39.3 ± 1.0 seconds at 3T. The T1 of both bound and unbound [1-13C2]IDA resonances were also Zn2+ dependent, with the T1 decreasing to 16.6 seconds when 1 eq of Zn2+ was present (Figure 3, SI Table S7). We hypothesize that the decrease in T1 is due to an increase in molecular weight of the complex.29 The high percent polarization, and relatively long T1 of the Zn2+ ligands suggested feasibility for subsequent imaging experiments.
Figure 3.
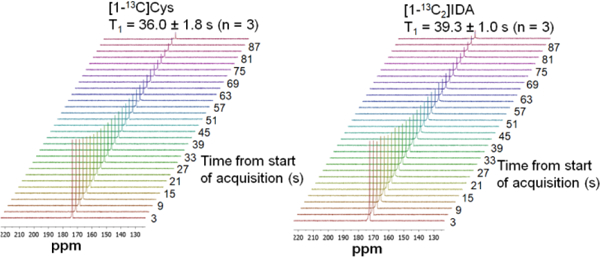
Dynamic 13C NMR spectra following polarization of [1-13C]Cys (left) and [1-13C2]IDA (right). Pulse conditions were TR = 3s, 5º hard pulses, 10 kHz spectral width, 30 timepoints, nominal spectral resolution = 0.5 Hz.
The ability of the probes to image Zn2+ concentration was tested using phantoms on a 3T MRI system. For cysteine, a copolarization method, as we have previously reported, was developed with [1-13C]urea as a chemical shift standard.23 A four-compartment phantom containing various Zn2+ concentrations in each compartment was prepared (Figure 4A, B). As in the thermal equilibrium measurements, a chemical shift change was observed in response to Zn2+ in the 13C cysteine spectrum. By using the best-fit linear model of chemical shift asFigure 3 a function of Zn2+ concentration (Figure 2B inset), hyperpolarized [1-13C]Cys was able to accurately determine the concentration over the physiologically relevant range of 0.2 – 20 mM Zn2+. At the highest tested Zn2+ concentration of 40 mM, a slight deviation was observed, possibly due to signal loss and/or line broadening.
Figure 4.
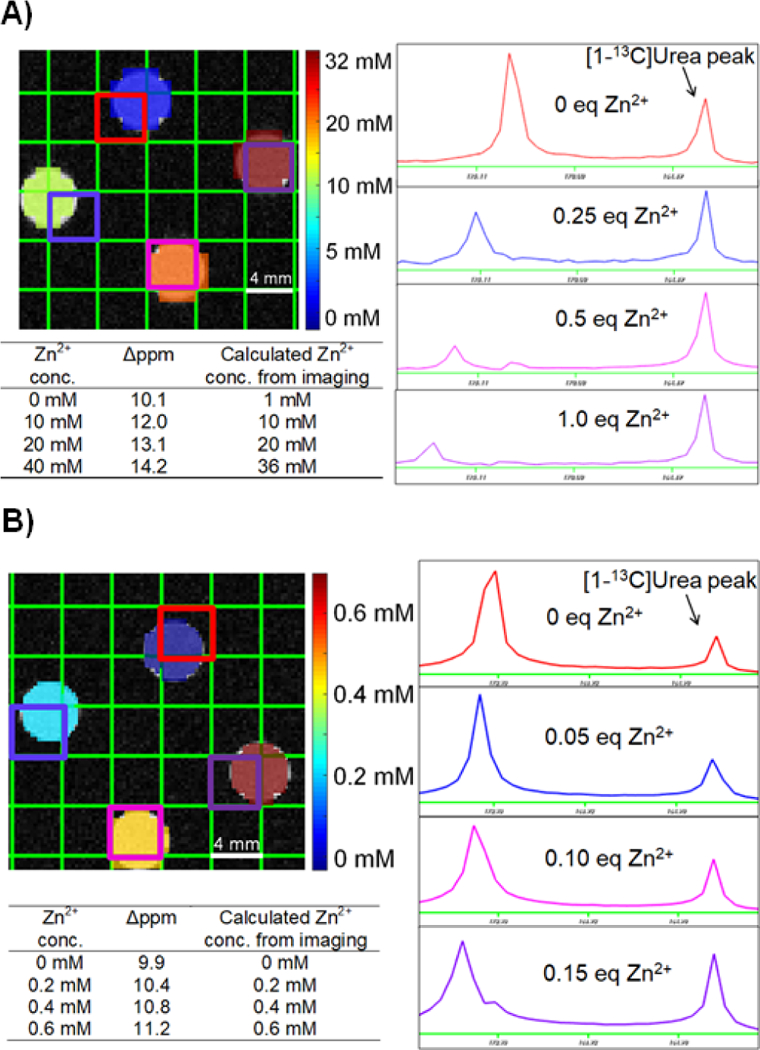
HP [1-13C]Cys accurately quantifies Zn2+ concentration in phantom imaging experiments through use of chemical shift measurements. (A) Phantom imaging conducted using 40 mM [1-13C]Cys. (B) Phantom experiment conducted using 4 mM [1-13C]Cys, indicating high sensitivity for low concentrations of Zn2+.
A phantom imaging experiment to determine the sensitivity showed that HP [1-13C]Cys can detect 200 μM of Zn2+ when 4 mM of [1-13C]Cys was present (Figure 4B). When hyperpolarized [1-13C2]IDA was tested in a phantom for Zn2+ imaging, the Zn2+ bound [1-13C2]IDA peak appeared when more Zn2+ was present. The line broadening of both the Zn2+ bound and unbound peaks of [1-13C2]IDA resulted in a loss of SNR between 0.2 eq Zn2+ and 0.3 eq Zn2+ (SI Figure S2). For this reason, accurate Zn2+ concentrations could not be obtained using this probe. Overall, these phantom experiments demonstrated that hyperpolarized [1-13C]Cys is a sensitive and accurate Zn2+ biosensor over the physiologic range, while issues with line broadening and signal loss limit the applicability of [1-13C2]IDA.
Finally, we verified that HP [1-13C]Cys could accurately determine Zn2+ concentration in biological samples (Figure 5) by comparing imaging results against a commercially available fluorescence based Zn2+ quantification kit. Rat serum and prostate extracts were selected as biological samples with low and high Zn2+ concentration, respectively. In these samples, the Zn2+ concentration was accurately measured at 0.1 and 1.9 mM, respectively. The HP and kit Zn2+ measurements agreed within 0.1 mM. In order to verify that the signal change in these samples represented a specific response to Zn2+, additional tubes including serum spiked with exogenous Zn2+, and a prostate sample with additional tris(2-pyridylmethyl)amine (TPA), a high-affinity and specific chelator, were investigated.30 We found that the Zn2+ concentration was accurately measured in the spiked serum sample, and that the addition of the TPA to the prostate extract blocked the chemical shift change. These data confirm that Zn2+ is both necessary and sufficient to induce the chemical shift change in cysteine, and moreover that this probe accurately and specifically determines Zn2+ concentration in complex biological samples.
Figure 5.
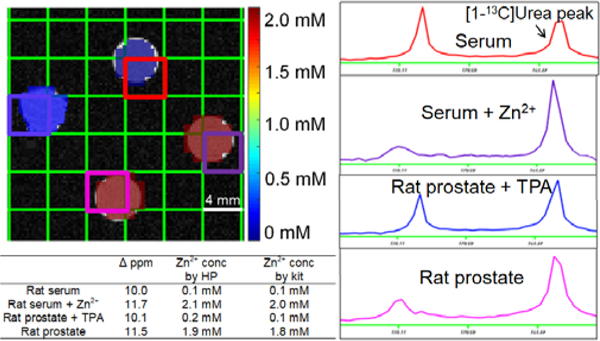
Hyperpolarized [1-13C]Cys phantom imaging experiment demonstrating accurate Zn2+ quantification in biological samples. Accurate detection of Zn2+ concentration in presence of exogenous Zn2+ and in the presence of Zn2+-chelating TPA demonstrates specificity of the probe for Zn2+ over other endogenous analytes.
For future in vivo applications, [1-13C]Cys in particular demonstrates both possible advantages and limitations compared against existing techniques. Owing to the short lifetime of the signal, it is unlikely that it would be internalized into cells in a time course reasonable to measure intracellular zinc concentration. Therefore, this method would likely be restricted to extracellular space Zn2+ imaging. However, zinc can be secreted from tissues including pancreas and prostate in response to glucose treatment. For example, Sherry et al. have developed imaging methods to detect the release of Zn2+ ions from β-cells in response to high glucose,31 as well as to differentiate between healthy and malignant prostate tissue in mouse models.32 Such a model could applied for initial in vivo testing of these probes. An additional limitation could be metabolic transformation, which could confound interpretation of spectroscopic data. Toxicity concerns are unlikely based on the known toxicology profile of cysteine.33 The majority of Zn2+ imaging probes are gadolinium-based contrast agents, which face the concern of their deposition in brain and environment, a concern which would be avoided in this case.34 A final potential benefit of this method is the broad range of zinc concentration in serum and other tissues, potentially enabling high image contrast. Overall, these preliminary data suggest both possibilities and limitations for future in vivo applications of these methods.
Taken together, these data demonstrate that [1-13C]Cys and [1-13C2]IDA represent promising probes for imaging Zn2+ using hyperpolarized 13C MRI. The probes demonstrate large changes in signal and chemical shift in response to Zn2+, excellent selectivity over other biologically relevant cations and changes in pH, favorable T1 and polarization parameters, and can be imaged in phantom experiments. [1-13C]Cys accurately quantified Zn2+ concentration in biological samples at physiologically relevant concentrations. For this reason, [1-13C]Cys is a particularly promising probe for future in vivo hyperpolarized magnetic resonance imaging of pathologies with alterations in Zn2+ homeostasis such as prostate cancer, neurodegenerative disease, and diabetes.
Supplementary Material
Acknowledgements
R.R.F. acknowledges a Howard S. Stern award of the Society of Abdominal Radiology, a David Blitzer Prostate Cancer Foundation Young Investigator Award, a Department of Defense Prostate Cancer Research Program Physician Research Training Award, and NIH R21 EB026012–01.
Contributor Information
Sinan Wang, Department of Radiology and Biomedical Imaging, University of California, San Francisco, San Francisco, CA, USA 94107.
David E. Korenchan, Department of Radiology and Biomedical Imaging, University of California, San Francisco, San Francisco, CA, USA 94107
Paola M. Perez, Department of Radiology and Biomedical Imaging, University of California, San Francisco, San Francisco, CA, USA 94107
Céline Taglang, Department of Radiology and Biomedical Imaging, University of California, San Francisco, San Francisco, CA, USA 94107.
Thomas R. Hayes, Department of Radiology and Biomedical Imaging, University of California, San Francisco, San Francisco, CA, USA 94107
Renuka Sriram, Department of Radiology and Biomedical Imaging, University of California, San Francisco, San Francisco, CA, USA 94107.
Robert Bok, Department of Radiology and Biomedical Imaging, University of California, San Francisco, San Francisco, CA, USA 94107.
Andrew S. Hong, Department of Radiology and Biomedical Imaging, University of California, San Francisco, San Francisco, CA, USA 94107
Yunkou Wu, Department of Radiology, Johns Hopkins University, Baltimore, MD, USA 21287.
Henry Li, Department of Radiology and Biomedical Imaging, University of California, San Francisco, San Francisco, CA, USA 94107.
Zhen Wang, Department of Radiology and Biomedical Imaging, University of California, San Francisco, San Francisco, CA, USA 94107.
John Kurhanewicz, Department of Pharmaceutical Chemistry, University of California, San Francisco, San Francisco, CA, USA 94107; Department of Radiology and Biomedical Imaging, University of California, San Francisco, San Francisco, CA, USA 94107.
David M. Wilson, Department of Radiology and Biomedical Imaging, University of California, San Francisco, San Francisco, CA, USA 94107
Robert R. Flavell, Department of Pharmaceutical Chemistry, University of California, San Francisco, San Francisco, CA, USA 94107 Department of Radiology and Biomedical Imaging, University of California, San Francisco, San Francisco, CA, USA 94107.
References
- [1].Kambe T, Tsuji T, Hashimoto A, Itsumura N, Physiol. Rev. 2015, 95, 749–784. [DOI] [PubMed] [Google Scholar]
- [2].Vallee BL, Auld DS, Acc. Chem. Res. 1993, 26, 543–551. [Google Scholar]
- [3].Costello LC, Franklin RB, Mol. Cancer. 2006, 5, 1–13. [DOI] [PMC free article] [PubMed] [Google Scholar]
- [4].Zhang XA, Hayes D, Smith SJ, Friedle S, Lippard SJ, J. Am. Chem. Soc. 2008, 130, 15788–15789. [DOI] [PMC free article] [PubMed] [Google Scholar]
- [5].Komatsu K, Kikuchi K, Kojima H, Urano Y, Nagano T, J. Am. Chem. Soc. 2005, 127, 10197–10204. [DOI] [PubMed] [Google Scholar]
- [6].Tsien RY, Nat. Cell Biol. 2003, 16–21.12511887 [Google Scholar]
- [7].Zhang X, Lovejoy KS, Jasanoff A, Lippard SJ, Proc. Natl. Acad. Sci. 2007, 104, 10780–10785. [DOI] [PMC free article] [PubMed] [Google Scholar]
- [8].Trokowski R, Ren J, Kálmán FK, Sherry AD, Angew. Chemie. Int. Ed. 2005, 44, 6920–6923. [DOI] [PubMed] [Google Scholar]
- [9].Lo ST, Martins AF, Jordan VC, Sherry AD, Isr. J. Chem. 2017, 57, 854–886. [DOI] [PMC free article] [PubMed] [Google Scholar]
- [10].Esqueda AC, López JA, Andreu-de-Riquer G, Alvarado-Monzón JC, Ratnakar J, Lubag AJM, Sherry AD, De León-Rodríguez LM, J. Am. Chem. Soc. 2009, 131, 11387–11391. [DOI] [PMC free article] [PubMed] [Google Scholar]
- [11].Gram A, Hansson G, Hansson L, Lerche MH, Ardenkjær-larsen JH, Servin R, Thaning M, Golman K, 2003, 100, 10158–10163. [DOI] [PMC free article] [PubMed] [Google Scholar]
- [12].Golman K, Axelsson O, Jo H, Månsson S, Olofsson C, Petersson JS, Magn. Reson. Med. 2001, 5, 1–5. [DOI] [PubMed] [Google Scholar]
- [13].Leunbach I, Mansson S, Petersson JS, Ardenkjaer-Larsen JH, Golman K, Proc. Natl. Acad. Sci. 2003, 100, 10435–10439. [DOI] [PMC free article] [PubMed] [Google Scholar]
- [14].Nikolaou P, Goodson BM, Chekmenev EY, Chem. -A Eur. J. 2015, 21, 3156–3166. [DOI] [PMC free article] [PubMed] [Google Scholar]
- [15].Day SE, Kettunen MI, Gallagher FA, Hu DE, Lerche M, Wolber J, Golman K, Ardenkjaer-Larsen JH, Brindle KM, Nat. Med. 2007, 13, 1382–1387. [DOI] [PubMed] [Google Scholar]
- [16].Bhattacharya P, Chekmenev EY, Reynolds WF, Wagner S, Zacharias N, Chan HR, Bünger R, Ross BD, NMR Biomed. 2011, 24, 1023–1028. [DOI] [PMC free article] [PubMed] [Google Scholar]
- [17].Mishra A, Pariani G, Oerther T, Schwaiger M, Westmeyer GG, Anal. Chem. 2016, 88, 10790–10794. [DOI] [PubMed] [Google Scholar]
- [18].Shindo H, Brown TL, J. Am. Chem. Soc. 1965, 87, 1904–1909. [DOI] [PubMed] [Google Scholar]
- [19].Li NC, Manning RA, J. Am. Chem. Soc. 1955, 77, 5225–5228. [Google Scholar]
- [20].Ni LB, Zhang RH, Liu QX, Xia WS, Wang H, Zhou ZH, J. Solid State Chem. 2009, 182, 2698–2706. [DOI] [PMC free article] [PubMed] [Google Scholar]
- [21].Düwel S, Hundshammer C, Gersch M, Feuerecker B, Steiger K, Buck A, Walch A, Haase A, Glaser SJ, Schwaiger M, Schilling F, Nat. Commun. 2017, 1–9. [DOI] [PMC free article] [PubMed] [Google Scholar]
- [22].Korenchan DE, Taglang C, Von Morze C, Blecha JE, Gordon JW, Sriram R, Larson PEZ, Vigneron DB, Vanbrocklin HF, Kurhanewicz J, Wilson DM, Flavell RR, Analyst 2017, 142, 1429–1433. [DOI] [PMC free article] [PubMed] [Google Scholar]
- [23].Flavell RR, Von Morze C, Blecha JE, Korenchan DE, Van Criekinge M, Sriram R, Gordon JW, Chen H, Subramaniam S, Bok RA, Wang Z, Vigneron D, Larson P; Kurhanewicz J, Wilson DM, Chem. Commun. 2015, 51, 14119–14122. [DOI] [PMC free article] [PubMed] [Google Scholar]
- [24].Gallagher FA, Kettunen MI, Day SE, Hu DE, Ardenkjær-Larsen JH, Zandt RI, Jensen PR, Karlsson M, Golman K, Lerche MH, Brindle KM, Nature 2008, 453, 940–943. [DOI] [PubMed] [Google Scholar]
- [25].Jiang W, Lumata L, Chen W, Zhang S, Kovacs Z, Sherry AD, Khemtong C, Sci. Rep. 2015, 5, 9104. [DOI] [PMC free article] [PubMed] [Google Scholar]
- [26].Shchepin RV, Barskiy DA, Coffey AM, Theis T, Shi F, Warren WS, Goodson BM, Chekmenev EY, ACS Sensors 2016, 1, 640–644. [DOI] [PMC free article] [PubMed] [Google Scholar]
- [27].Shchepin RV, Goodson BM, Theis T, Warren WS, Chekmenev EY, ChemPhysChem 2017, 18, 1961–1965. [DOI] [PubMed] [Google Scholar]
- [28].Jensen PR, Karlsson M, Meier S, Duus J, Lerche MH, Chem. -A Eur. J. 2009, 15, 10010–10012. [DOI] [PubMed] [Google Scholar]
- [29].Keshari KR, Wilson DM, Chem. Soc. Rev. 2014, 43, 1627–1659. [DOI] [PMC free article] [PubMed] [Google Scholar]
- [30].Huang Z, Zhang X, Bosch M, Smith SJ, Lippard SJ, Metallomics 2013, 5, 648–655. [DOI] [PMC free article] [PubMed] [Google Scholar]
- [31].Lubag AJM, De Leon-Rodriguez LM, Burgess SC, Sherry AD, Proc. Natl. Acad. Sci. 2011, 108, 18400–18405. [DOI] [PMC free article] [PubMed] [Google Scholar]
- [32].Preihs C, Zhang S, Lo ST, Chen S, Li WH, Clavijo Jordan MV, Lubag AJM, De Leon-Rodriguez LM, Rofsky NM, Sherry AD, Proc. Natl. Acad. Sci. 2016, 113, 5464–5471. [DOI] [PMC free article] [PubMed] [Google Scholar]
- [33].Lewis RJ Sr (ed), Sax’s Dangerous Properties of Industrial Materials, 11th Edition Wiley-Interscience, Wiley & Sons, Inc; Hoboken, NJ: 2004, p1059. [Google Scholar]
- [34].Guo BJ, Yang ZL, Zhang LJ, Front. Mol. Neurosci. 2018, 11, 1–12. [DOI] [PMC free article] [PubMed] [Google Scholar]
Associated Data
This section collects any data citations, data availability statements, or supplementary materials included in this article.


