

Abstract
Background
Strengthening social integration could prevent suicidal behavior. However, minimal research has examined social integration through relationship network structure. To address this important gap, we tested whether structural characteristics of school networks predict school rates of ideation and attempts.
Methods
In 38 US high schools, 10,291 students nominated close friends and trusted adults to construct social networks. We used mixed‐effects logistic regression models to test individual student networks and likelihood of suicidal ideation (SI) and suicide attempts (SA); and linear regression models to estimate associations between school network characteristics and school rates of SI, SA, and SA among all with ideation.
Results
Lower peer network integration and cohesion increased likelihood of SI and SA across individual and school‐level models. Two factors increased SA: student isolation from adults and suicidal students’ popularity and clustering. A multivariable model identified higher SA in schools where youth–adult relationships were concentrated in fewer students (B = 4.95 [1.46, 8.44]) and suicidal students had higher relative popularity versus nonsuicidal peers (B = 0.93 [0.10, 1.77]). Schools had lower SA rates when more students named the same trusted adults named by friends and many students named the same trusted adults. When adjusting for depression, violence victimization and bullying, estimates for adult network characteristics were substantially unchanged whereas some peer effects decreased.
Conclusions
Schoolwide peer and youth–adult relationship patterns influence SA rates beyond individual student connections. Network characteristics associated with suicide attempts map onto three theory‐informed domains: social integration versus thwarted relational needs, group cohesion, and suicidal students’ social influence. Network interventions addressing these processes, such as maximizing youth–adult connections schoolwide and heightening influence of youth with healthy coping, could create more protective schools. Longitudinal and intervention studies are needed to determine how schools differentiate in network structure and clarify reciprocal dynamics between network characteristics and suicidal behavior.
Keywords: Suicide prevention, social networks, social integration, network interventions
Introduction
Suicide is the second leading cause of death among adolescents worldwide (WHO, 2016). Reducing suicide rates will require a greater range of interventions along the public health continuum (Tsai, Lucas, & Kawachi, 2015; Wyman, 2014). To date, suicide prevention has focused primarily on individual‐level psychiatric risk factors and on strategies to refer and treat high‐risk youth (Gould et al., 2005). Yet researchers (Kawachi & Berkman, 2001; King & Merchant, 2008; Tsai et al., 2015) and policymakers (CDC, 2006) recommend strengthening positive social bonds because social integration can reduce suicidal behavior in youth (King & Merchant, 2008) and adults (Tsai et al., 2015). With rare exceptions (Bearman & Moody, 2004), suicide prevention research has operationalized social integration through self‐report measures (e.g., perceived belonging). However, social integration can also be measured by individuals’ positions within their network (e.g., are they isolated or well connected?) and by broader patterns of relationships among all members of the network (e.g., are there many relationships among people?). Furthermore, network research has identified characteristics of networks that affect health (Valente, 2010).To address this important gap, the present study tests whether characteristics of school networks predict rates of suicidal thoughts and behaviors (STBs). The goal was to identify potential targets for network‐informed suicide prevention.
Social networks provide the mechanisms for the diffusion of norms and practices (Rogers, 2003) and the context for peer group monitoring and support (Whitlock, Wyman, & Moore, 2014). Network characteristics influence the spread of many health behaviors (e.g., smoking; Mercken, Snijders, Steglich, Vertiainen, & de Vries, 2010). By focusing on patterns of relationships, network methods can clarify the contexts in which relationships form and exert influence on others. Network interventions have become state of the art for many adolescent health problems (Campbell et al., 2008; Valente, 2012) but not yet suicide prevention. A promising but relatively unexplored direction is to use adolescents’ school relationship networks to strengthen protective social and mental health benefits (Wyman et al., 2010).
This study examined relationship networks in 38 high schools (10,291 students) in primarily rural, micropolitan communities, which have higher youth suicide rates than urban areas (Kegler, Stone, & Holland, 2017). We examined networks that incorporated students’ friendships and relationships with supportive adults. By including adult connections, we extend prior work that focused only on peer networks (Bearman & Moody, 2004), which potentially misses key protective processes (Pisani et al., 2012). To our knowledge, this is the first study of any adolescent health problem, including suicidal behavior, that integrates adult connections into friendship networks at a school population level.
Our primary focus was on school‐level network characteristics. School‐level factors encompass both individual‐level characteristics aggregated to the school level (e.g., percent isolated students) and variables describing overall patterns of relationships across all network members, which cannot be broken down into smaller units (Valente, 2010). For example, some networks are hierarchical such that disproportionately more relationship ties are concentrated in fewer individuals (i.e., centralized). These school‐level network characteristics are a critical source of information for schoolwide network interventions as they indicate the opportunities for influence and interaction among members (Rulison, Gest, & Osgood, 2015).
We therefore examined network characteristics that map onto three empirically and theoretically informed domains of risk/protective processes identified in previous work:
Integrated versus thwarted relational needs
Youth with positive bonds to family, peers, and/or school are generally less likely to consider or attempt suicide (King & Merchant, 2008; Whitlock et al., 2014) consistent with risk models emphasizing thwarted relationship needs (Joiner et al., 2009) and protective models emphasizing strong ties (Berkman, Glass, Brissette, & Seeman, 2000; Tsai et al., 2015). Thus, we expected lower school rates of STB where a higher proportion of students were connected versus isolated. We also expected STB to be higher in schools where friendships were concentrated in fewer students, consistent with effects of disparity on other health outcomes (Arcaya, Arcaya, & Subramanian, 2015).
Suicidal student influence
Adolescents appear susceptible to suicidal behavior modeling (Insel & Gould, 2008). For example, Bearman and Moody (2004) found that reporting that a friend attempted suicide differentiated adolescents who attempted versus only considered suicide in the Add Health study. We extend prior work by examining school network characteristics that could magnify suicidal students’ influence, looking beyond students’ direct connections to suicidal peers. We expected higher rates of STB in schools where suicidal students were more popular.
Group cohesion
Cohesion is linked to reduced STB primarily through self‐report (McKeown et al., 1998). In one of the few studies examining structural cohesion of school networks, (Bearman & Moody, 2004) females in friendship groups comprised of loosely connected individuals were more likely to consider suicide. Cohesive groups may reduce stress from competing social norms (Bearman & Moody, 2004) and increase collective support (Whitlock et al., 2014), consistent with the ‘social regulation’ concept introduced by Durkheim (Durkheim, 1897). We extend prior work by examining peer network cohesion and integration of peer and adult networks. We expected lower STBs in schools where more students share adult connections with their friends, congruent with an update of Durkheim's model positing that suicides have increased most in youth populations in which adolescents’ friends are disconnected from adults, thereby reducing adult monitoring and regulation (Bearman, 1991).
Our primary aim was to test whether variations in school networks accounted for differential school rates of suicide attempts (SA), suicide ideation without attempts (SI), and of SA among the subgroup of all students with suicide ideation. A second aim was to examine likelihood of individual students reporting SA and SI as a function of their network characteristics, which in combination with school network findings provide a more comprehensive analysis. The overarching goal was to contribute to a theoretically informed network epidemiology of suicidal behavior and identify implications for network‐informed prevention.
Methods
Schools and participants
Participants were 10,716 students among a total population of 12,906 in 38 high schools in New York State (n = 29) and North Dakota (n = 9). Schools were recruited from counties with past five‐year youth suicide rates above the 2009–2011 state average (per 100,000, 24.40 in North Dakota and 5.19 in New York) for youth 15–19. Four schools (two per state) served American Indian reservations. School size ranged from 50 to 1,015 students (M = 334). (See Appendix S1 in the Supporting Information for additional information on schools.) Schools enrolled in four cohorts (2010–2013) in a type I hybrid effectiveness‐implementation trial of Sources of Strength (Wyman et al., 2010), a school and peer‐based suicide prevention program. All data reported here were from baseline assessments prior to program implementation.
Researchers sent parents/guardians of all 9–12th graders information letters that included an option for parents to decline. Parents and students were informed that all data would be de‐identified and no student responses examined for crisis intervention. Participation rates ranged from 66% to 95.6% (M = 83%) across schools, meeting criteria for modeling school‐level network data in 38 schools. We excluded two additional schools that invited only representative portions of each grade (~50%) to participate, a method that yields unsuitable network data. The University of Rochester IRB approved the study protocol with a waiver of documentation of parent permission. Research personnel collected opt‐out forms and conducted student verbal assent, followed immediately by web‐based assessments. All students received information about how to access help. (See Appendix S1 for additional information on opt‐out rates and human subject considerations).
The sample was 48.9% female. Race/ethnicity reflected the predominantly rural, small town communities: 79% white, 8% black, 4.6% Native American, 1.7% Asian, and 5.3% other or mixed race; 6.5% identified as Hispanic/Latino.
Network measures
Students named up to seven of their closest friends at their school, a process considered to yield fewer, yet closer relationships versus checking names off a roster (Valente, Fujimoto, Chou, & Spruijt‐Metz, 2009). A novel aspect was that students also named up to seven ‘adults in your school who you trust and feel you can talk to about personal things’. We used friend nominations from each student (i.e., ego) to other students (i.e., alters) and to adults to construct social networks and variables spanning multiple levels.
Peer network integration
The extent to which students had connections that would facilitate satisfaction of (vs. thwarted) relational needs was captured by isolation from peers (i.e., no friendship nominations made or received), number of friendship nominations made (i.e., out‐degree), number of nominations received (i.e., in‐degree), and coreness (i.e., size of friendship group based on one's own and immediate friends’ nominations). We created three school‐level peer integration variables by aggregating: (a) Percent isolates in the school, (b) Mean number of friends named, and (c) Mean coreness. Table 1 describes school‐level variables and each school's network structure relative to all others (e.g., percent isolates ranged 0–6.45% across the 38 schools).
Table 1.
School‐level network characteristics
| Mean (SD) | School range | Description | |
|---|---|---|---|
| Peer network integration | |||
| Percent isolates | 2.01 (1.58) | 0.00 to 6.45 | Percent of students who neither name friends nor are named by others. |
| Mean # Friendships | 4.99 (0.50) | 3.74 to 5.99 | Average total friendship nominations for students in the network. Note that when aggregated, average in‐degree equals average out‐degree. |
| Mean coreness | 5.40 (0.82) | 3.78 to 7.53 | Average coreness for students in the network. A student's coreness value k is the largest value that satisfies the following condition: the student has at least k friends who also have at least k friends. |
| Peer network centralization | |||
| In‐degree centralization | 6.18 (3.82) | 1.35 to 12.74 | Degree to which incoming nominations are concentrated in a few, popular students. When all ties are directed to only one student, this value is 100. |
| Out‐degree centralization | 1.84 (1.44) | 0.15 to 6.98 | Degree to which outgoing nominations are concentrated in a few students. When all ties originate from only one student, this value is 100. |
| Coreness centralization | 31.98 (9.13) | 17.62 to 50.41 | Degree to which there is one distinct core of individuals disconnected from others. When there is one core of connected individuals, this value is 100. |
| Peer network cohesion | |||
| Network scaled density | 62.08 (8.55) | 42.58 to 80.63 | Percent of friendship ties that exist compared to the theoretical maximum number of ties. When all possible ties exist, this value is 100. |
| Network transitivity | 11.39 (2.72) | 6.80 to 19.96 | The degree to which triads in the network form triangular closure (closure happens when a student's friends are also friends with each other). When all triads are closed, this value is 100. |
| Suicidal student influence | |||
| Popularity any STB versus NS | 0.87 (0.16) | 0.29 to 1.15 | The average in‐degree for students with either suicidal ideation or attempts divided by the in‐degree for students with neither. When suicidal and nonsuicidal students are equally popular, this value is 1. |
| Suicidal student clustering | |||
| Homophily for STB | 0.09 (0.08) | −0.06 to 0.33 | The degree to which suicidal students are connected to each other, calculated by Moran's I. When students are completely segregated by suicide status (complete homophily), this value is 1. |
| Student–adult network | |||
| Percent adult isolates | 31.12 (10.14) | 8.22 to 53.40 | Percent of students who did not name any trusted adults. |
| Mean adult out‐degree | 2.57 (0.56) | 1.19 to 3.92 | Mean number of trusted adults named by students. |
| Any shared adult | 56.65 (14.05) | 26.21 to 91.78 | Percent of students who had 1 + friends who named the same trusted adult. |
| Student–adult network centralization | |||
| Outgoing to adult | 2.66 (1.88) | 0.37 to 8.01 | Degree of variation in the number of students who nominate adults. When all ties to adults originate from one student, this value is 100. |
| Incoming to adult | 20.81 (9.60) | 7.17 to 55.87 | Degree to which nominations are directed to a single adult. When all ties to adults are directed toward one adult, this value is 100. |
Peer network centralization
School‐level variables were created indicating the extent to which each peer integration measure (i.e., in‐degree, out‐degree, coreness) was concentrated within a few students or distributed evenly across students in the network (Freeman, 1978). Higher centralization scores for each measure indicated greater disparity in social connections among members of the network.
Peer network cohesion
Two school‐level variables were constructed to describe the extent to which friendship groups in each school were comprised of interconnected, cohesive groups: (a) Density (the proportion of possible friendship ties that were present) and (b) Transitivity (tendency for students’ friends to also be friends).
Suicidal student influence
Students’ exposure to suicidal friends was captured by number of friends they named who reported ideation and number who reported suicide attempt. We created two school‐level indicators: (a) Suicidal student popularity was calculated as the ratio of nominations received by suicidal students compared to the nominations received by nonsuicidal student. Extensive variability (school range 0.29–1.15) indicated that suicidal youth ranged from far less popular to more popular versus nonsuicidal peers, and (b) Suicidal student clustering was the extent to which students with STB were friends with other suicidal youth (i.e., homophily), using Moran's I (Moran, 1950). Values ranged from −0.06 (indicating nearly random placement of STB) to 0.33 (evidence of clustering).
Student–adult networks
School‐level variables captured the extent to which students were connected to trusted adults at their schools, another source for satisfying relational needs: (a) Percent adult isolates (i.e., 8.2%–53.4% of students did not name any trusted adults across schools), and (b) Mean number of trusted adults nominated. A third variable captured integration of students’ adult and peer networks: (c) Percent shared a trusted adult nomination with a friend (i.e., both the student and at least one friend nominated the same adult).
Student–adult network centralization
Student–adult network centralization variables reflected the degree to which there was disparity in student‐trusted adult nominations at each school. We used two indicators: (a) Outgoing to Adult centralization (higher scores = greater student disparity, that is, more nominations made to adults from fewer students), and (b) Incoming to Adult centralization (higher scores = greater adult disparity, that is, more nominations received by fewer adults from students).
Self‐report measures
Suicidal thoughts and behaviors
Suicidal thoughts and behaviors (STB) were assessed using the Youth Risk Behavior Survey measure (Eaton et al., 2008). Students were asked whether in the preceding 12 months they had: seriously considered suicide; planned suicide; made one or more suicide attempts; or made an attempt that resulted in injury requiring medical treatment. Students with logically inconsistent responses (n = 324) were re‐coded as missing using YRBS guidelines. Excluded from further analyses were 101 participants who did not answer any STB questions, yielding a final sample of 10,291.
Students completed the following self‐report measures of constructs that have been linked to increased likelihood of STB. Depressive Symptoms were measured using the Short Mood and Feelings Questionnaire (Angold, Costello, Messer, & Pickles, 1995). Scores ranged from 0 to 26, with higher scores indicating more depressive symptoms. Violence Victimization in past 12 months including physical, sexual assault, stabbing, and shooting was measured using a scale from Add Health (Borowsky, Ireland, & Resnick, 2001). Scores ranged from 0 to 1 (M = 0.13) with higher scores indicating greater victimization. Bully Victimization was assessed using questions adapted from the World Health Organization youth survey (Klomek et al., 2011). Scores ranged from 1 to 5 (M = 1.5) with higher scores indicating greater bully victimization.
(See Appendix S1 for additional information on measures including STB rates by sex).
Statistical analysis
We computed network measures in R (v. 3.4.4) using the igraph package (Csardi & Nepusz, 2006) and network diagrams graphed using Gephi v0.9.2 (GitHub, San Francisco, CA, USA). We conducted all other analyses (described below) in R.
To test likelihood of individual students reporting STB as a function of their network characteristics, we used three contrasts as outcomes in mixed‐effects logistic regression models: (a) odds of suicide attempt (SA) versus no STB (NS), (b) odds of suicidal ideation only (SI) versus NS, and (c) odds of SA versus SI. We tested each individual‐level network characteristic in a separate model, adjusting for sex, race (white vs. nonwhite), and age (both a linear and quadratic effect). We included a random intercept to account for variability among schools. To determine whether sex moderated network‐risk associations, we tested for sex by network characteristics interactions in separate models.
To test schoolwide effects of network characteristics, we examined three separate outcomes: (a) schoolwide rate of SA per 100 students, (b) schoolwide rate of SI per 100 students, and (c) rate of SA among all students with SI at school (SA/Total SI), per 100 students. Linear regression models included all predictor variables listed in Table 1, which were grouped into seven categories. Although suicidal student popularity and clustering were originally included in one category, for the purpose of model building they were separated into individual categories due to relatively low association (r = .17, p = .31). (See Table S1 for correlations among school network variables). Each model was adjusted for school size (log‐transformed to reduce the influence of larger schools and produce a unimodal, more symmetric distribution), % White, and % female. Age was not included due to low variability across schools. All predictors were normalized to produce predictor z‐scores. For each outcome variable, we first estimated a univariable model to test the effect of each network variable separately (adjusting for covariates). Then, we estimated a multivariable model within each domain to identify the best exemplar variable within that domain that was most highly associated with the rate of STB. Finally, we estimated a multivariable model that included exemplar variables from each of the seven categories. (See Appendix S1 for missing data considerations).
To assess the robustness of school‐level estimates to sources of potential confounding, we conducted sensitivity analyses with three variables. Depression is a known risk factor for suicidal behavior (Gould & Kramer, 2001) and affects social functioning (Cruwys et al., 2013). Elevated depression could account for observed relationship between social disconnection and STB. Second, adolescents’ victimization by bullying and violence is linked to STB (Klomek et al., 2011) and could confound the observed relationship between weaker peer and youth–adult networks and suicidal behavior. We adjusted for those potential confounders in separate models that included as covariates average school‐level depression, bully, or violence victimization scores.
Results
Individual networks and STB classification
Of 10,291 students who answered questions about STB, 8% reported seriously considering suicide without attempts (SI: 11% females; 6% males) and 7% reported one or more attempts (SA: 9% females; 4% males).
Table 2 summarizes network characteristic for students in each risk category (columns 1–3) and the likelihood of being in one risk category compared to another, based on a one unit change in the network characteristic (columns 4–6). In general, students in the SA category were the least connected to their peers, most likely to be exposed to suicidal friends, and least connected to trusted adults. Means for students in the SI category generally fell between those for SA and NS. Students with attempts were most likely to be isolated from adults (42.7%) versus SI (32.4%) and NS (31.5%). Figure 1 depicts one school friendship network and illustrates how students with NS had more friends overall, but fewer of those friends were suicidal.
Table 2.
Individual‐level friendship and trusted adult networks by risk group status (Means and standard errors, OR and 95% CI)
| NS | SI | SA | SA vs. NSa | SI vs. NSa | SA vs. SIa | |
|---|---|---|---|---|---|---|
| M (SE) | M (SE) | M (SE) | OR (95% CI) | OR (95% CI) | OR (95% CI) | |
| Peer network integration | ||||||
| Peer isolates | 2.19 (0.16) | 2.62 (0.55) | 2.89 (0.64) | 1.22 (0.74, 1.99) | 1.25 (0.79, 1.97) | 1.64 (0.75, 3.61) |
| # Friend noms received | 4.43 (0.03) | 3.93 (0.09) | 3.89 (0.11) | 0.95 (0.92, 0.98) | 0.95 (0.92, 0.97) | 0.98 (0.94, 1.02) |
| # Friend noms made | 5.11 (0.03) | 4.60 (0.09) | 4.17 (0.11) | 0.87 (0.85, 0.90) | 0.93 (0.91, 0.96) | 0.92 (0.88, 0.96) |
| Coreness | 5.41 (0.02) | 4.95 (0.07) | 4.67 (0.08) | 0.84 (0.80, 0.87) | 0.90 (0.86, 0.93) | 0.89 (0.84, 0.95) |
| Exposure to suicidal friends | ||||||
| Proportion of friends w/ideation | 0.35 (0.01) | 0.46 (0.03) | 0.49 (0.03) | 1.28 (1.13, 1.46) | 1.30 (1.16, 1.45) | 1.11 (0.94, 1.32) |
| Proportion of friends w/attempt | 0.26 (0.01) | 0.42 (0.03) | 0.66 (0.04) | 1.96 (1.76, 2.19) | 1.49 (1.33, 1.67) | 1.45 (1.24, 1.70) |
| Student–adult network | ||||||
| Adult isolates | 31.5 (0.5) | 32.4 (1.6) | 42.7 (1.9) | 1.70 (1.44, 2.01) | 1.02 (0.88, 1.20) | 1.62 (1.28, 2.05) |
| Trusted adult nomin. | 2.58 (0.03) | 2.23 (0.08) | 1.94 (0.08) | 0.88 (0.85, 0.92) | 0.94 (0.91, 0.97) | 0.94 (0.89, 0.99) |
| Shared adult w/Friend | 54.4 (0.5) | 48.2 (1.7) | 38.5 (1.9) | 0.50 (0.43, 0.60) | 0.79 (0.68, 0.91) | 0.64 (0.51, 0.80) |
Increase in likelihood of classification for a one unit change in each attribute; models adjusted for sex, race/ethnicity, and age (linear and quadratic effect). OR in bold are significant p < .05.
Figure 1.
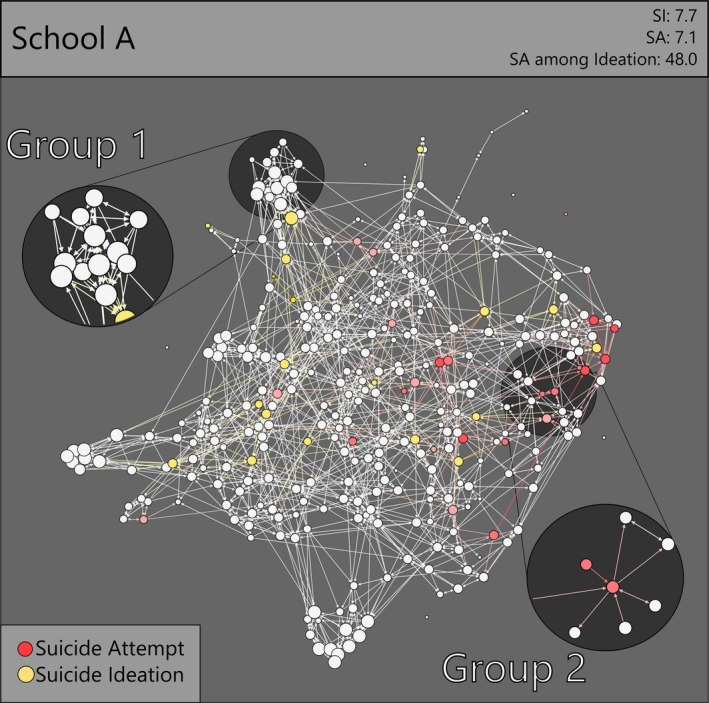
Network location of students with suicide attempt (shaded red) and ideation (shaded yellow) in one sample school. Darkness of shading represents clustering of suicidal thoughts and behavior (STB); darker nodes are connected to more students with STB. Nodes are sized by coreness and reflect belonging to a larger, cohesive friendship group. Arrows represent friendship nominations to and from students. Group 1 blowout shows a cohesive friendship group with few suicidal students.Group 2 blowout shows a sparse friendship group with clustering by suicide attempt
We found few sex differences (see Table S2). In three of 27 tests, females’ network characteristics (all peer friendship) had a stronger relationship with risk status versus males.
School‐level characteristics and school rates of STB
Schoolwide rates of STB were approximately normally distributed across schools. The mean rate of SA was 6.5 per 100 (range: 0–13.3), the mean rate of SI was 8.5 per 100 (range: 4.1–16.0), and the mean rate of SA/Total SI was 41.7 per 100 (range: 0–62.5).
Table 3 summarizes univariable and multivariable predictors of school STB rates. When we tested each school‐level characteristic separately (column 1), rates of SA were higher in schools where networks reflected lower peer integration and cohesion: students named fewer friends, friendship nominations were disproportionately concentrated in fewer students (i.e., higher out‐degree centralization), and students’ friends were less often friends with each other (i.e., lower transitivity). SA rates were also higher in schools where students with STB were more popular relative to NS peers and more clustered in the network. To illustrate the latter finding, Figure 2 compares peer networks in two schools. In the school with higher attempts (bottom), students with STB have higher relative popularity (shown by larger node size) and are more clustered together versus school with fewer attempts (top).
Table 3.
Univariable and multivariable relationships between network predictors and schoolwide rates of SA and SI
| Rate of suicide attempt (SA) | Rate of ideation only (SI) | Rate of SA/total SI | ||||
|---|---|---|---|---|---|---|
|
Univariable B (95% CI) |
Multivariable B (95% CI) |
Univariable B (95% CI) |
Multivariable B (95% CI) |
Univariable B (95% CI) |
Multivariable B (95% CI) |
|
| Friendship network size | −0.09 (−1.06, 0.89) | 1.15 (−0.84, 3.14) | −0.17 (−1.13, 0.79) | −0.22 (−1.33, 0.88) | 1.14 (−3.35, 5.62) | −7.02 (−17.63, 3.58) |
| Peer network integration | ||||||
| Percent isolates | 0.76 (−0.34, 1.85) | 1.08 (0.03, 2.13) | −0.82 (−6.01, 4.37) | |||
| Mean # Friendship ties | −1.35 (−2.34, −0.36) | −0.21 (−1.47, 1.04) | −1.23 (−2.22, −0.24) | −2.96 (−7.90, 1.98) | ||
| Mean coreness | −1.09 (−2.18, 0.01) | −1.60 (−2.59, −0.61) | −0.83 (−6.03, 4.37) | −1.30 (−6.59, 4.00) | ||
| Peer network centralizationa | ||||||
| In‐degree centralization | 0.69 (−1.38, 2.76) | −0.16 (−2.04, 1.72) | 0.11 (−9.94, 10.16) | |||
| Out‐degree centralization | 2.36 (0.35, 4.36) | −2.38 (−5.41, 0.64) | 0.82 (−1.11, 2.75) | 8.93 (−1.03, 18.89) | ||
| Coreness centralization | −0.27 (−1.36, 0.82) | 0.18 (−0.81, 1.17) | −4.10 (−9.21, 1.00) | |||
| Peer network cohesion | ||||||
| Network scaled density | −1.03 (−2.13, 0.08) | −1.61 (−2.61, −0.61) | −0.82 (−6.06, 4.41) | −0.66 (−6.01, 4.68) | ||
| Network transitivity | −1.85 (−3.17, −0.54) | −1.00 (−2.34, 0.35) | −1.66 (−2.98, −0.35) | −6.41 (−12.74, −0.07) | −1.13 (−8.59, 6.33) | |
| Suicidal student influence | ||||||
| Popularity any STB versus NS | 1.20 (0.25, 2.14) | 0.93 (0.10, 1.77) | 0.88 (−0.09, 1.84) | 5.60 (1.28, 9.92) | 2.63 (−2.67, 7.94) | |
| Suicidal student clustering | ||||||
| Homophily (SI/SA) | 1.31 (0.49, 2.13) | 0.72 (−0.15, 1.60) | 0.72 (−0.16, 1.61) | 4.15 (0.09, 8.21) | 2.85 (−1.44, 7.15) | |
| Student–adult network | ||||||
| Adult isolates | 1.41 (0.33, 2.49) | 0.53 (−0.71, 1.78) | 0.94 (−0.18, 2.05) | 4.65 (−0.55, 9.84) | ||
| Mean adult out‐degree | −1.29 (−2.35, −0.24) | −1.00 (−2.07, 0.07) | −3.78 (−8.88, 1.33) | |||
| Any shared adult | −1.45 (−2.58, −0.32) | −0.99 (−2.15, 0.18) | −4.62 (−10.07, 0.83) | |||
| Student–adult network centralizationa | ||||||
| Outgoing to adult | 2.74 (0.55, 4.92) | 4.95 (1.46, 8.44) | 0.67 (−1.74, 3.08) | 8.66 (−2.47, 19.79) | ||
| Incoming to adult | −1.84 (−3.47, −0.22) | −0.88 (−2.58, 0.81) | −10.15 (−17.39, −2.90) | −6.14 (−15.60, 3.33) | ||
B is standardized coefficient (change in rate for a 1 SD change in predictor per 100 students).
All analyses adjusted for log network size, race/ethnicity, and sex. B in bold are significant at p < .05.
Models adjusted for corresponding centrality variable.
Figure 2.
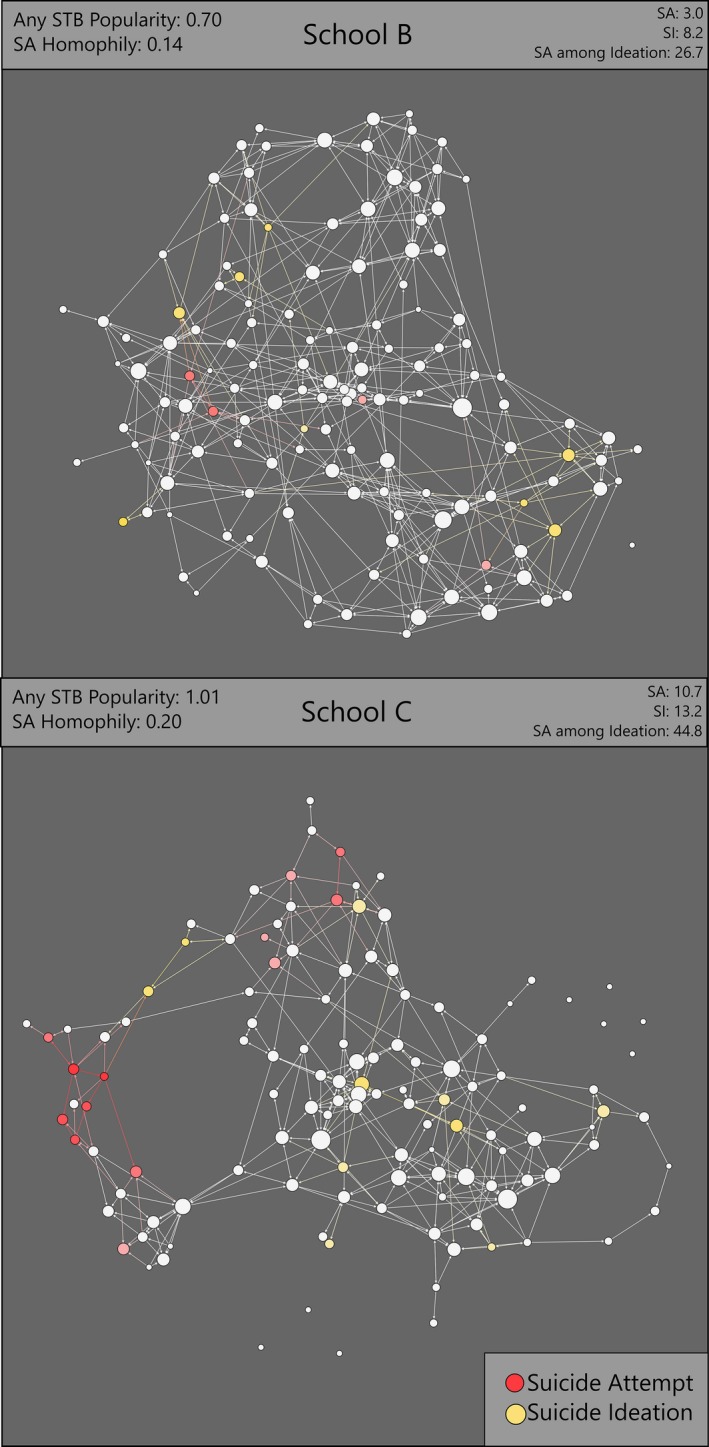
Differing suicidal behavior exposure in two schools. Darkness of shading reflects clustering of students with suicidal thoughts and behavior (STB). Nodes are sized by in‐degree (i.e., popularity). In School B, students with STB are relatively less popular versus no STB compared to School C. Additionally, students with SA cluster less in School B than School C. School B has lower suicide attempt rates than School C
Regarding student–adult networks, SA rates were higher in schools where: more students were isolated from adults, fewer students named trusted adults shared with friends, and student nominations of adults were concentrated among fewer students (i.e., higher outgoing to adult centralization). Conversely, SA rates were lower where there was higher incoming to adult centralization, that is, a smaller proportion of staff received disproportionately more nominations. To illustrate this latter finding, Figure 3 shows nominations from students in outer ring to adults in inner ring for two schools. Controlling for total nominations to adults, the SA rate is lower in the school where a few staff received many nominations (School D; top) compared to the school where nominations received by adults were more evenly distributed (School E; bottom).
Figure 3.
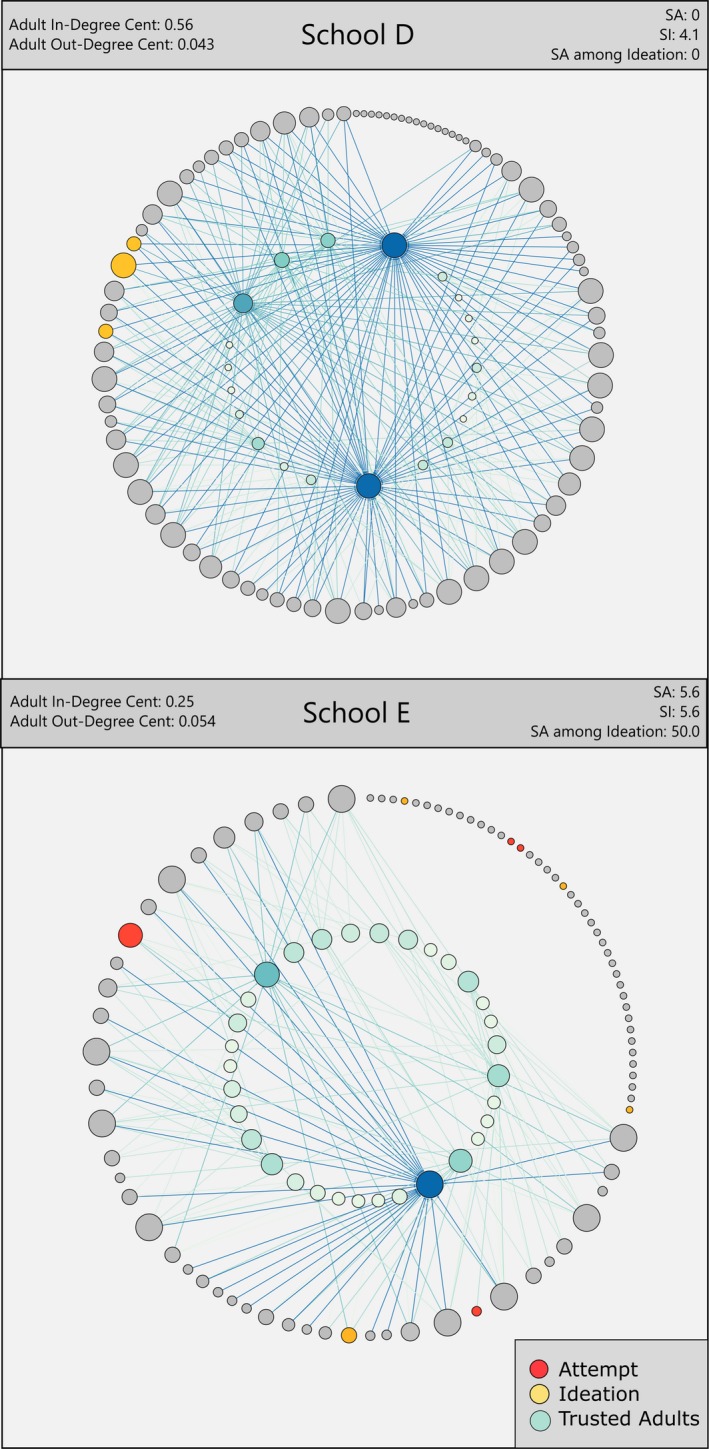
Student‐trusted adult nominations in two schools. Students (outer ring) are sized by nominations made and adults (inner ring) sized by nominations received. Darker shaded adult nodes reflect more nominations received. School D has several well‐identified trusted adults nominated by many students and lower suicide attempt than School E, in which trusted adults generally have similar number of nominations
The multivariable model for SA (Table 3, column 2) identified two school‐level characteristics that uniquely predicted schoolwide SA rates: suicidal youth having higher relative popularity and trusted adult nominations concentrated among fewer students.
Only peer network integration and cohesion measures predicted SI (Table 3, column 3). Specifically, schoolwide rates of SI were higher in schools where there were more peer isolates, fewer friendship ties, and smaller friendship groups that were less dense, and when students’ friends were less likely to be friends with each other. In the multivariable model (Table 3, column 4), neither measure independently predicted rates of SI.
Schools were more likely to have a higher rate of SA/Total SI (Table 3, column 5) when peer friendship groups were less cohesive (i.e., lower transitivity), youth with STB had higher relative popularity and clustered on the network, and student nominations of trusted adults were distributed widely across school staff (i.e., lower incoming to adult centralization). The multivariable model (Table 3, column 6) identified no independent predictors.
Sensitivity analyses
When we adjusted for student depression, violence victimization, and bullying, estimates for trusted adult characteristics remained substantially unchanged; estimates for some peer network variables decreased in magnitude (See Tables S3–S5). As expected by adding covariates with a total sample size of 38 schools, fewer network characteristics were significant in the models. With depression or bullying as covariates, suicidal student popularity did not increase likelihood of attempts as in the uncorrected model. However, with depression as a covariate the proportion of students isolated from adults in a school became a significant predictor of SA rates in the multivariable model.
Discussion
This study extends prior work in youth suicide prevention by identifying characteristics of protective school networks and, conversely, school networks that increase risk for STB. Those characteristics map onto three theory‐informed domains: integration versus thwarted relational needs, group cohesion, and suicidal student influence to normalize STB. Study strengths included examining peer friendship and youth–adult networks together and converging evidence from school‐level and individual‐level analyses of STB. Our findings are novel by identifying patterns of peer and youth–adult relationships across a school population as influential for rates of attempts, beyond individual connections. A multivariable model showed SA rates higher in schools where youth‐trusted adult relationships were concentrated in fewer students and suicidal students had greater relative popularity versus nonsuicidal peers. Youth–adult networks and suicidal student popularity also predicted high rates of attempts among all students considering suicide. Network‐informed interventions (Valente, 2012) that address these processes (Valente, 2010) could create a more protective school social environment for preventing youth suicidal behavior.
Schools with friendship networks reflecting greater integration and cohesion had lower rates of SI and SA. Students with more friendship ties and who were part of larger, interconnected friendship groups were less likely to report SI and SA; those indices aggregated at the school population level predicted lower school rates of STB. Evidence of a dose–response relationship suggests that impact of low integration and cohesion occur along a continuum, increasing vulnerability for SI and, at higher levels, for SA. Findings showed substantial similarity for female and male students in peer network characteristics associated with increased likelihood of SI and SA; however, three differences indicated a stronger relationship between peer networks and risk status for females. These findings may signal one source accounting for greater likelihood of SI and SA in female versus male adolescents.
Student isolation from adults specifically increased vulnerability to SA. A difference of 10% fewer students isolated from adults (1 SD) was associated with 1.41 fewer attempts per 100 students, a 20.1% reduction in the average rate of attempts (7/100). Students with trusted adults at school are more likely to seek help (Pisani et al., 2012), and students lacking access to adult support may be vulnerable to transitioning from ideation to an attempt.
A novel finding was that SA rates were elevated in schools with youth–adult relationship ties concentrated within fewer students, that is, centralized. In centralized peer‐adult networks, less connected students may perceive their own connection as reduced, similar to how economic disparity magnifies adverse health effects in part due to negative social comparison (Arcaya et al., 2015). Moreover, finite adult resources may be less available for isolated youth when some students have disproportionately many adult connections. In contrast, schools with fewer adults receiving many trusted nominations had lower rates of SA and SA/Total SI. This process may reflect the presence of clearly identified, competent adults being connected to many students.
Our study also identified a novel network characteristic – that is, suicidal youth having higher relative popularity versus nonsuicidal peers – as predicting higher SA rates and more attempts among those considering suicide (SA/Total SI). Popularity is strongly related to social influence (Garcia, Mavrodiev, Casati, & Schweitzer, 2017), suggesting that popular suicidal youth normalize suicidal behavior. SA rates were also higher when suicidal youth were more clustered (i.e., homophily). Clustering of popular suicidal youth could magnify socialization and influence processes (Mercken et al., 2010) that promote adoption of suicidal behavior among students nearby on the network (see Figure 2).
The present study is the first empirical evidence linking more integrated youth–adult networks (i.e., students sharing trusted adults with friends) to lower SA. Our findings regarding cohesive youth–adult networks aligns with a sociological perspective positing that vulnerability to suicide increases when social changes erode adolescents’ intergenerational cohesion (Bearman & Moody, 2004). Cohesive youth–adult networks may promote more help‐seeking for students and for their friends with whom they share a common bond to a supportive adult.
We recommend three areas for future research. First, investigation of school contextual factors to elucidate how schools come to differentiate so widely in network structure, e.g., 8.3%–53.4% of students isolated from adults across the 38 schools in this study. One fruitful direction would be to examine how school staff characteristics (e.g., diversity, attitudes about youth) and school climate (e.g., leadership style) align with different structure of youth–adult networks. Second, longitudinal studies are needed to clarify the reciprocal dynamics over time between network characteristics identified in our study (e.g., isolation from adults) and youth STB, to identify optimal intervention targets and phases. A third priority is to develop and test strategies to strengthen protective social networks. Network interventions that train youth key opinion leaders decrease health risk behaviors like smoking (Campbell et al., 2008). Student peer leaders trained in Sources of Strength increase schoolwide help‐seeking for suicide concerns (Wyman et al., 2010). Key opinion leader programs could be an effective approach to increase influence of youth with healthy coping practices including in network components with concentrated suicidal peers. Determining how Sources of Strength and other network‐informed interventions prepare students and adults to promote healthy social influence while engaging at‐risk youth is one important direction for research (Valente, 2012). Schoolwide network patterns identified in this study can be incorporated into the research program for Sources of Strength. An example is examining how gains in youth–adult connections among trained student opinion leaders (Wyman et al., 2010) translate into similar gains for untrained peers versus increasing youth–adult ties among those students who are already well connected to adults (i.e., increased youth–adult network centralization).
Limitations
Network data were collected contemporaneously with student self‐reports of STB, and therefore our analyses could not determine whether network characteristics contribute to future STB or whether they are a consequence (e.g., students who make attempts isolate themselves from adults). Students could only nominate friends enrolled in their high school. However, it is likely that a majority of students’ friends attend their high school in these primarily small town, micropolitan communities, versus more urban communities with multiple high schools. Although sensitivity analyses controlled for depression, bullying and violence victimization, other unidentified factors could also account for observed associations. Schools were in primarily small town and micropolitan communities, and our findings may not generalize (e.g., urban). Moreover, as with nearly all studies investigating STB in general populations (Bearman & Moody, 2004) our findings are limited by self‐report without other sources of evidence to confirm differences in STB rates across schools.
Conclusions
Our study findings have implications for developing network‐informed suicide prevention (NISP) approaches in schools and other education settings. First, NISP is likely to be most effective and safe by incorporating multiple foci: maximizing protective bonds across school populations, increasing opportunities for group cohesion including integrated youth–adult networks, and promoting influence of youth with healthy coping. Second, our findings suggest effective NISP interventions will involve youth and adults. Most current network health interventions focus on leveraging influential peer group opinion leaders (Campbell et al., 2008). Fruitful areas for future work include identifying new strategies for integrating adolescents’ peer and adult networks and increasing accessibility of competent adults.
Key points.
Suicide prevention research has identified social integration as protective but has not examined integration in terms of social network structure.
This is the first study of suicidal ideation (SI) and attempts (SA) to examine peer and adult connections integrated in school social networks.
In 38 US high schools, (10,291 students) networks reflecting greater peer social integration and cohesion were associated with lower school rates of SI and SA. Student isolation from adults, youth–adult relationships concentrated in fewer students, and higher popularity of suicidal youth were associated with higher SA rates.
Network‐informed suicide prevention (NISP) should be tested to: maximize protective peer and youth–adult bonds schoolwide, build group cohesion, and promote social influence of youth with healthy coping.
Supporting information
Appendix S1. Additional information on methods, measures, and human subjects.
Table S1. Correlations among network‐level characteristics.
Table S2. Results from tests of sex by network interactions in predicting STB risk category (Odds ratios and p values).
Table S3. Depression adjustment.
Table S4. Violence adjustment.
Table S5. Bully adjustment.
Acknowledgements
Funding for the research was received through the National Institute of Mental Health (RO1MH091452). The authors have declared that they have no competing or potential conflicts of interest.
Conflict of interest statement: No conflicts declared.
References
- Angold, A. , Costello, E.J. , Messer, S.C. , & Pickles, A. (1995). Development of a short questionnaire for use in epidemiological studies of depression in children and adolescents. International Journal of Methods in Psychiatric Research, 5, 237–249. [Google Scholar]
- Arcaya, M.C. , Arcaya, A.L. , & Subramanian, S.V. (2015). Inequalities in health: Definitions, concepts, and theories. Global Health Action, 8, 27106. [DOI] [PMC free article] [PubMed] [Google Scholar]
- Bearman, P.S. (1991). The social structure of suicide. Sociological Forum, 6, 501–524. [Google Scholar]
- Bearman, P.S. , & Moody, J. (2004). Suicide and friendships among American adolescents. American Journal of Public Health, 94, 89–95. [DOI] [PMC free article] [PubMed] [Google Scholar]
- Berkman, L.F. , Glass, T. , Brissette, I. , & Seeman, T.E. (2000). From social integration to health: Durkheim in the new millennium. Social Science and Medicine, 51, 843–857. [DOI] [PubMed] [Google Scholar]
- Borowsky, I.W. , Ireland, M. , & Resnick, M.D. (2001). Adolescent suicide attempts: Risks and protectors. Pediatrics, 107, 485–493. [DOI] [PubMed] [Google Scholar]
- Campbell, R. , Starkey, F. , Holliday, J. , Audrey, S. , Bloor, M. , Parry‐Langdon, N. , … & Moore, L. (2008). An informal school‐based peer‐led intervention for smoking prevention in adolescence (ASSIST): A cluster randomised trial. The Lancet, 371, 1595–1602. [DOI] [PMC free article] [PubMed] [Google Scholar]
- Center for Disease Control (CDC) . (2006). Connectedness as a strategic direction for the prevention of suicidal behavior. Available from: https://www.cdc.gov/ViolencePrevention/pdf/Suicide_Strategic_Direction_Full_Version-a.pdf [last accessed 1 October 2018].
- Cruwys, T. , Dingle, G.A. , Haslam, C. , Haslam, S.A. , Jetten, J. , & Morton, T.A. (2013). Social group memberships protect against future depression, alleviate depression symptoms and prevent depression relapse. Social Science and Medicine, 98, 179–186. [DOI] [PubMed] [Google Scholar]
- Csardi, G. , & Nepusz, T. (2006). The igraph software package for complex network research. InterJournal, Complex Systems, 1695, 1–9. [Google Scholar]
- Durkheim, E. (1897). Suicide: A sociological study. Paris, Alcan: The Free Press. [Google Scholar]
- Eaton, D.K. , Kann, L. , Kinchen, S. , Shanklin, S. , Ross, J. , Hawkins, J. , … & Wechsler, H. (2008). Youth risk behavior surveillance–United States, 2007. MMWR Surveillance Summary, 57, 1–131. [PubMed] [Google Scholar]
- Freeman, L.C. (1978). Centrality in social networks conceptual clarification. Social Networks, 1, 215–239. [Google Scholar]
- Garcia, D. , Mavrodiev, P. , Casati, D. , & Schweitzer, F. (2017). Understanding popularity, reputation, social influence in the Twitter Society. Policy and Internet, 9, 343–364. [Google Scholar]
- Gould, M.S. , & Kramer, R.A. (2001). Youth suicide prevention. Suicide and Life‐Threatening Behavior, 31, 6–31. [DOI] [PubMed] [Google Scholar]
- Gould, M.S. , Marrocco, F.A. , Kleinman, M. , Thomas, J.G. , Mostkoff, K. , Cote, J. , & Davies, M. (2005). Evaluating iatrogenic risk of youth suicide screening programs: A randomized controlled trial. JAMA, 293, 1635–1643. [DOI] [PubMed] [Google Scholar]
- Insel, B.J. , & Gould, M.S. (2008). Impact of modeling on adolescent suicidal behavior. Psychiatric Clinics of North America, 31, 293–316. [DOI] [PubMed] [Google Scholar]
- Joiner, T.E., Jr , Van Orden, K.A. , Witte, T.K. , Selby, E.A. , Ribeiro, J.D. , Lewis, R. , & Rudd, M.D. (2009). Main predictions of the interpersonal‐psychological theory of suicidal behavior: Empirical tests in two samples of young adults. Journal of Abnormal Psychology, 118, 634–646. [DOI] [PMC free article] [PubMed] [Google Scholar]
- Kawachi, I. , & Berkman, L.F. (2001). Social ties and mental health. Journal of Urban Health, 78, 458–467. [DOI] [PMC free article] [PubMed] [Google Scholar]
- Kegler, S.R. , Stone, D.M. , & Holland, K.M. (2017). Trends in suicide by level of urbanization – United States, 1999–2015. MMWR. Morbidity and Mortality Weekly Report, 66, 270–273. [DOI] [PMC free article] [PubMed] [Google Scholar]
- King, C.A. , & Merchant, C.R. (2008). Social and interpersonal factors relating to adolescent suicidality: A review of the literature. Arch Suicide Res, 12, 181–196. [DOI] [PMC free article] [PubMed] [Google Scholar]
- Klomek, A.B. , Kleinman, M. , Altschuler, E. , Marrocco, F. , Amakawa, L. , & Gould, M.S. (2011). High school bullying as a risk for later depression and suicidality. Suicide and Life threatening Behavior, 41, 501–516. [DOI] [PMC free article] [PubMed] [Google Scholar]
- McKeown, R.E. , Garrison, C.Z. , Cuffe, S.P. , Waller, J.L. , Jackson, K.L. , & Addy, C.L. (1998). Incidence and predictors of suicidal behaviors in a longitudinal sample of young adolescents. Journal of the American Academy of Child & Adolescent Psychiatry, 37, 612–619. [DOI] [PubMed] [Google Scholar]
- Mercken, L. , Snijders, T.A. , Steglich, C. , Vertiainen, E. , & de Vries, H. (2010). Smoking‐based selection and influence in gender‐segregated friendship networks: A social network analysis of adolescent smoking. Addiction, 105, 1280–1289. [DOI] [PubMed] [Google Scholar]
- Moran, P.A.P. (1950). Notes on continuous stochastic phenomena. Biometrika, 37, 17–23. [PubMed] [Google Scholar]
- Pisani, A.R. , Schmeelk‐Cone, K. , Gunzler, D. , Petrova, M. , Goldston, D.B. , Tu, X. , & Wyman, P.A. (2012). Associations between suicidal high school students’ help‐seeking and their attitudes and perceptions of social environment. Journal of Youth and Adolescence, 41, 1312–1324. [DOI] [PMC free article] [PubMed] [Google Scholar]
- Rogers, E.M. (2003). Diffusion of innovations. New York, NY: Free Press. [Google Scholar]
- Rulison, K.L. , Gest, S.D. , & Osgood, D.W. (2015). Adolescent peer networks and the potential for the diffusion of intervention effects. Prevention Science, 16, 133–144. [DOI] [PMC free article] [PubMed] [Google Scholar]
- Tsai, A.C. , Lucas, M. , & Kawachi, I. (2015). Association between social integration and suicide among women in the united states. JAMA Psychiatry, 72, 987–993. [DOI] [PMC free article] [PubMed] [Google Scholar]
- Valente, T.W. (2010). Social networks and health: Models, methods, and applications. American Journal of Epidemiology, 172, 488. [Google Scholar]
- Valente, T.W. (2012). Network interventions. Science, 337, 49–53. [DOI] [PubMed] [Google Scholar]
- Valente, T.W. , Fujimoto, K. , Chou, C.P. , & Spruijt‐Metz, D. (2009). Adolescent affiliations and adiposity: A social network analysis of friendships and obesity. Journal of Adolescent Health, 45, 202–204. [DOI] [PMC free article] [PubMed] [Google Scholar]
- Whitlock, J. , Wyman, P.A. , & Moore, S.R. (2014). Connectedness and suicide prevention in adolescents: Pathways and implications. Suicide and Life‐Threatening Behavior, 44, 246–272. [DOI] [PubMed] [Google Scholar]
- World Health Organization (WHO) . (2016). Global health estimates 2015: Disease burden by cause, age, sex, by country and by region, 2000–2015. Available from: http://www.who.int/healthinfo/global_burden_disease/estimates/en/index2.html [last accessed 1 October 2018].
- Wyman, P.A. (2014). Developmental approach to prevent adolescent suicides: Research pathways to effective upstream preventive interventions. American Journal of Preventive Medicine, 47(3 Suppl 2), S251–S256. [DOI] [PMC free article] [PubMed] [Google Scholar]
- Wyman, P.A. , Brown, C.H. , LoMurray, M. , Schmeelk‐Cone, K. , Petrova, M. , Yu, Q. , … & Wang, W. (2010). An outcome evaluation of the sources of strength suicide prevention program delivered by adolescent peer leaders in high schools. American Journal of Public Health, 100, 1653–1661. [DOI] [PMC free article] [PubMed] [Google Scholar]
Associated Data
This section collects any data citations, data availability statements, or supplementary materials included in this article.
Supplementary Materials
Appendix S1. Additional information on methods, measures, and human subjects.
Table S1. Correlations among network‐level characteristics.
Table S2. Results from tests of sex by network interactions in predicting STB risk category (Odds ratios and p values).
Table S3. Depression adjustment.
Table S4. Violence adjustment.
Table S5. Bully adjustment.